UPDATE 4/23 4PM: I’ve been in contact with the Eureka Weather Station manager, and despite the incredible nature of the temperature jumps that are outside of normal experiences, such as July 14 2009, they do appear to be real. The METAR coding errors are another issue. I have many pictures now, plus a plan map, and a better meteorological insight than what can be gained from the meager online metadata. I’ll have an updated post later tonight or tomorrow – Anthony
Ecotretas find more cases of missing “M”s and mangled data in METAR reports making it into climatic temperature data. I’ve reposted his findings below and added some of my own notes [in brackets] to strengthen his findings. This time it’s Eureka, Nunavut, Canada. From “Up Here” magazine:
The first High Arctic Weather Station in history, Eureka was established in April 1947 at 80-degrees north latitude in the vicinity of two rivers, which provided fresh water to the six-man United States Army Air Force team that parachuted in. They erected Jamesway huts to shelter themselves and their equipment until August, when an icebreaker reached Eureka – as it has every year since – and brought permanent buildings and supplies. For decades after that, small, all-male crews would hunker down for entire winters, going a little stir-crazy from the isolation.

As I pointed out last Saturday there’s a common reporting flaw in world meteorological stations that use the METAR weather data format to report their hourly temperatures. Just one bad report in a cold location in the Arctic or Antarctic is enough to throw off the whole month’s worth of data when averaged. And it is monthly data that is used for climate. The all time high temperature error identified below has found it’s way into Wikipedia as “factual” when it is clearly wrong.
Some METAR and other kinds of unidentified errors also seem to be finding their way into official Environment Canada data. I’ve made screencaps. Given the importance of this weather station as the last surviving GHCN station that far north, also used in GISS, you’d think better quality control would be done, particularly when EC has a statement about data quality on each data page. What has been found seems to point to a corrupted dataset there.
– Anthony
=======================================
Eureka by Ecotretas


[Images above from GISS – click to enlarge]
Eureka, in Nunavut Canada, is a very special meteorological station. As can be seen in the first image above, it is responsible for the very big stripe on the very top of Canada. As can be seen on the second image, the data from only one station is responsible for a very big percentage of global temperatures… Both graphs can be obtained here.
So, one would imagine that data for this station is quality proof. We found two sources for temperature data: at Weather Underground and at the National Climate Data and Information Archive.
The first interesting data about this station is its record high temperature, which according to Wikipedia was reached on July 14, 2009, with 20ºC. [image below added by Anthony]

[UPDATE: Wikipedia editor removed the sentence above within 8 hours of this posting. See discussion here]
On Weather Underground, the monthly page for that day does say that 20ºC was the maximum temperature. But when you check the METAR data, the maximum temperature was 14ºC.
[Here is where it really gets strange, I’ve added two screencaps from Environment Canada, on for the monthly data, another for the daily data from July 14th, 2009. They don’t match! The 20.9C value never appears in the July 14th hourly data. Click images below to enlarge, EC’s July 2009 Monthly report on the left, July 14th, 2009 daily/hourly data on the right. Perhaps EC corrected the error in the daily/hourly data, but missed the monthly? – Anthony]


[click images above to enlarge]
[It also shows up as 20.9C on the EC yearly report for 2009, shown below]

Checking the Environment Canada page, the maximum for the date was 14.4ºC.
Things were different on the day before, July 13th. Maximum temperature for Weather Underground was also 20ºC, while at Environment Canada was 19.6ºC. But if you check the graphs below, some special heat occurred at 10PM, when temperatures soared some 15ºC!
(click images to enlarge)


[Image below added by Anthony. Here is the METAR report for Eureka, via Weather Underground, the error is highlighted in yellow, note the jump in temperature followed by a fall the next hour]

[In the image below added by Anthony, note the implausible temperature jump in the Environment Canada data for July 13th, 2009 at 22:00 where it was 5.9C at 21:00, jumping to 19.6C at 22:00, then back down to 4.1C at 23:00. Looking at the weather conditions of clear sky and moderate sustained winds from the North ~ 24 km/hr, there does not appear to be a meteorological explanation. Looking at the METAR data above, it appears the temperature was rounded up by the observer to 20C from 19.6. This makes me wonder if the event could be caused by something like a plane, truck, or snow-cat parked briefly near the sensor. In the Arctic, vehicles are left to idle, as turning them off allows them to freeze up, sometimes never to be restarted. ]

As Anthony Watts pointed out at Watts Up With That, the Eureka station registered the biggest rise in temperature probably seen on the Earth’s surface: 86ºC in one hour, on March 3, 2007! Now this data is available on Weather Underground, but seems not to exist in Environment Canada. The graph differences are clear below:


But that seems not to be the case in other examples. Take January 1st, 2007, for instance. Both Weather Underground and Environment Canada agree: there was a mighty spike at noon. Seems like the “M” problem affects both:


[Here’s the METAR data with the missing “M”, note at 11AM the M reappears]

There are times where differences are not so big, but the “M” problem is still there. Check the images from Weather Underground and Environment Canada for September 26, 2006:


Other times, changes are so significant, that something must be wrong. Check out the temperature rise on June 20, 2005. On the left, the weekly graph from Weather Underground shows a great surge in temperatures, confirmed by the Environment Canada graph for the day.


=====================================
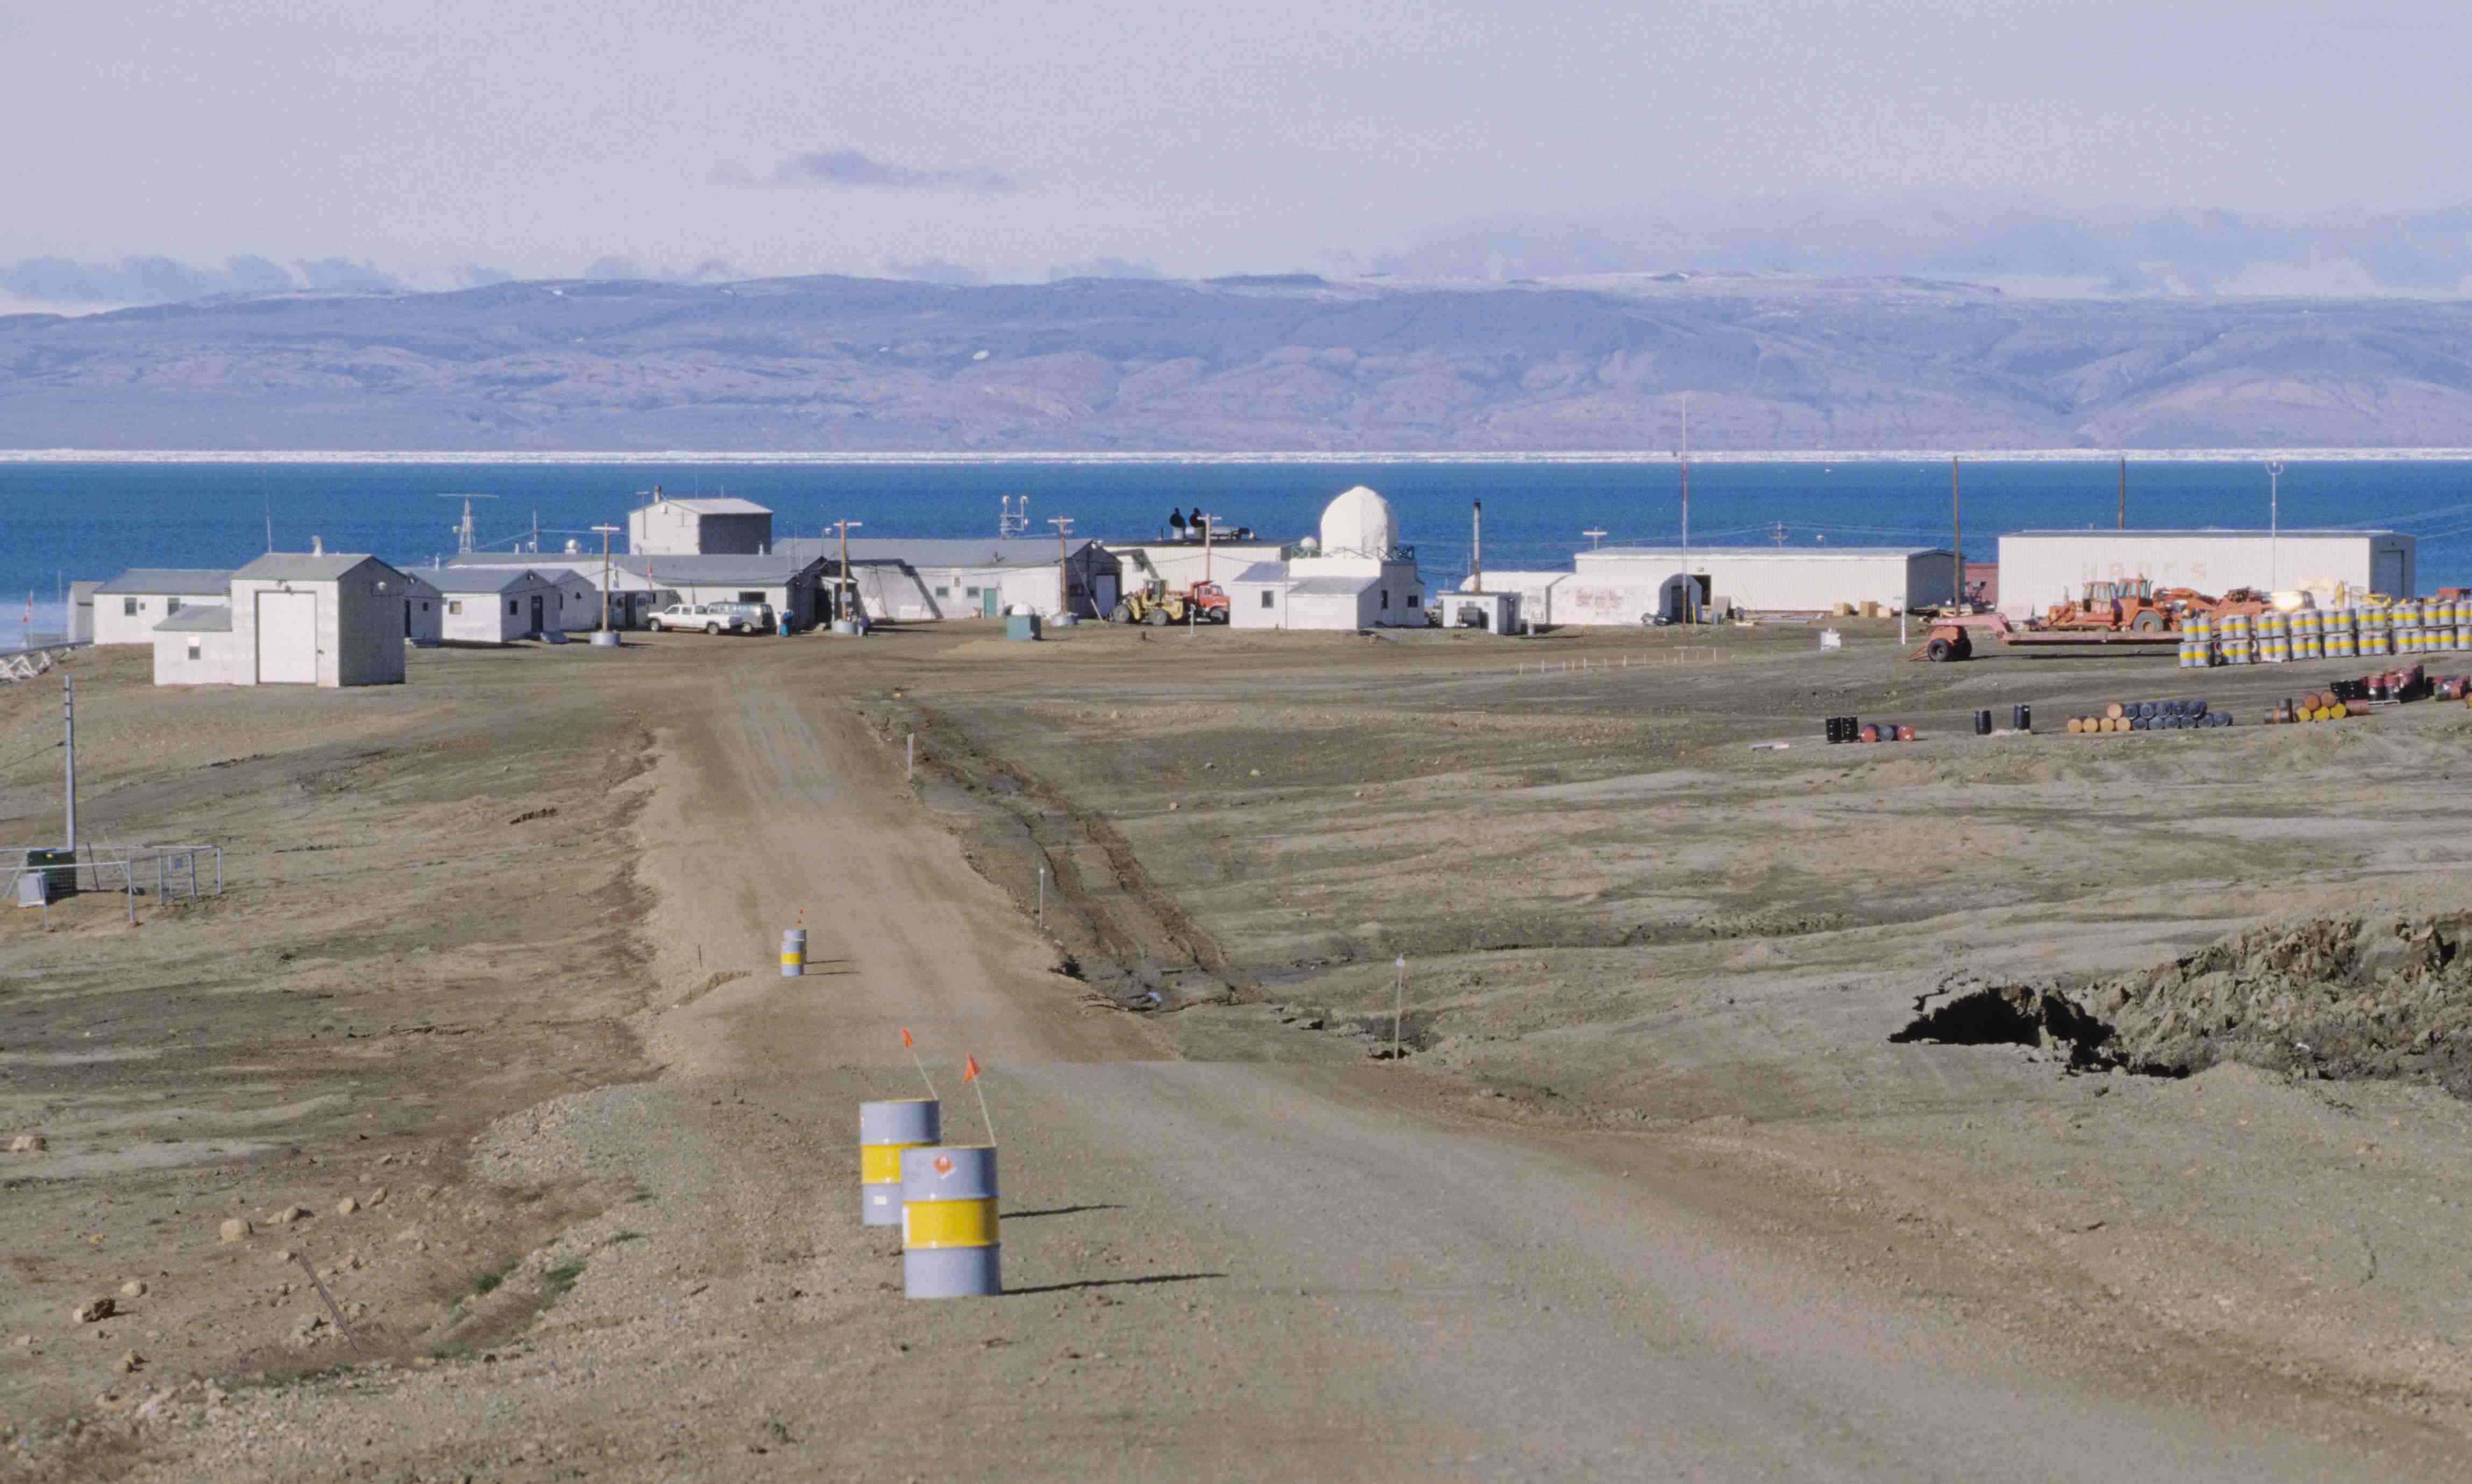
Thanks to Ecotretas for his sleuthing, I’m sure there are many more like this yet to be discovered. It seems with Eureka, more is going on than METAR errors. The temperature rises reported seem impossible given the meteorological conditions, and because they seem to be automated, suggest sensor error or perhaps sensor environment contamination (like a vehicle or other heat source). If you look at this 1997 image from Wikipedia (and click it to get the super hi-res version and pan around) you’ll see a number of vehicles near buildings. Where is the temperature sensor? – I don’t know, but if someone can find out it might shed some light on this mystery.
The fact that the obvious error on July 14th is now cited in Wikipedia as an “all time record high”, when it doesn’t appear in the EC hourly data, is troubling. – Anthony
Sudden water vapor outgassing (maybe a researcher cooked himself an egg), leading to a rapid localized feedback and runaway warming is the only possible answer within the framework of physical laws. 😉
seems like maybe someone is opening closing doors …. (and hence warming of thermometers) proping open doors for an afternoon in summer or having door open for a few minutes during winter??
I’m confused why you feel the need to conflate this with Metar. This can’t be a missing sign, right?
Not saying it isn’t wrong, but it can’t be a Metar missing negative sign from what I can see.
REPLY: See the January 1st, 2007 example with a missing M. Yes not all cases have missing M’s but we also have what appears to be meteorologically impossible values in the METAR reports. I can’t tell you if this is a manual coding error, an instrument error, or a local heat bias. More investigation is needed. Clearly there are data problems of all kinds here -A
Just for the record.
Carol Browner, former Clinton administration EPA head and current “Obama White House climate czar, instructed auto industry execs “to put nothing in writing, ever” regarding secret negotiations she orchestrated regarding a deal to increase federal Corporate Average Fuel Economy (CAFE) standards. Rep. James Sensenbrenner, R-WI, is demanding a congressional investigation of Browner’s conduct in the CAFE talks, saying in a letter to Rep. Henry Waxman, D-CA, that Browner “intended to leave little or no documentation of the deliberations that lead to stringent new CAFE standards.”
..So why do we keep complete and accurate records?
As Lord Nelson famously said, ” I see no ships”.
Although great pains were made by Anthony to suggest that it could be human error, evidently the quality control of the body who aggregates this data is either lacking or biased.
Take your pick viewers.
Any reasons why the GHCN and GISS data should differ so much from the Environment Canada data?
http://diggingintheclay.blogspot.com/2010/04/canada-2-ghcngiss-comparisons-with.html
REPLY: I wish I knew. Which one is the “correct” temperature. Who knows? – Anthony
It is all about The Narrative.
the data is inconsequential.
the measuring process is inconsequential.
The Narrative is all. Disturb not the Narrative, lest ye be Judged!
(in canadian civil court, apparently)
Mysteries of modern climatological ‘science’.
1. Mistakes are always found by non-climatologists.
2. Mistakes are found to have been erroneously increasing the temperature.
3. People who find the mistakes are reviled by climatologists.
But don’t forget – the ‘science’ is settled.
I believe there are statistical methods which could be used on the entire temperature record from eureka which would identify outliers like the readings in question on this post. I don’t have the skills myself but I wonder whether the various algorithms used by the likes of GISS identify and discard such anomalies?
wws –
yes, the narrative is all and if u disturb it?
22 April: Guardian:Michael White: Leaders’ TV debate: Nick Clegg: Score 9/10
Best moment: When he accused Dave of working with “nutters, anti-Semites, people who deny climate change exists, homophobes”.
http://www.guardian.co.uk/politics/2010/apr/22/tv-leaders-debate-nick-clegg
22 April: BusinessWeek: Brown Attacks Clegg on Trident, Slams Cameron on EU (Update2)
Clegg described the Conservatives’ allies as “a bunch of nutters, anti-Semites, people who deny climate change exists, homophobes.”..
http://www.businessweek.com/news/2010-04-22/cameron-clegg-brown-clash-on-europe-in-tv-election-debate.html
22 April: Financial Times: Matthew Engel: Surreal spot from well-worn comedy trio
Mr Clegg – predictably enough in a foreign affairs debate – called the Tories’ new allies in the European parliament “nutters, homophobes, anti-Semites and climate change deniers”. ..
http://www.ft.com/cms/s/0/f4fceed4-4e5c-11df-b48d-00144feab49a.html
As Lord Nelson famously said, ” I see no ships” followed by “only hardships” for some
They had a barbecue that day or burned their trash
Hi Anthony,
has any official agency confirmed those reporting errors yet ?
Or has any acknowledged there could be a problem ?
Where is the thermometer? Look just to the left of the “low-boy” trailer. That white block looks like an intrument shelter. I think the building just to the left of the radome is the generator building.
Anthony, the July 13th data also is very close to the 20 deg.
Anthony–
You should get some kind of award for discovering the “Missing M” in the METARS. Thanks.
The temperature spikes at Eureka are obviously exhaust from UFOs that visit the station! 🙂
@ Henry chance (15:55:43) : IMHO, every person in the Obama Admin. including Senate & Congress, the Supreme court, and every dept and regulatory agency, should have a video recorder & RFID/GPS surgically implanted to capture every sound, gesture, email, phone con, writing, sign language, and movement (bowel or otherwise) they ( and whoever else is present in person or via any technology ) make, with a live feed to the web, and 50 year storage of it.
The july 13 data with the big jump to 19.6 at 22:00 hrs also has some interest jumps at 10:00 hrs and 17:00 hrs. The temperature jumps from 6.9 to 13.0 and back to 7.4 at 10:00 hrs and again 9.5 to 13.7 and back to 7.2 at 17:00 hrs. Looks weird like running equipment parked near the sensor.
They have all these super accurate models that are so good they can predict the climate 100 years into the future. Surely they can use some of this predictive ability to determine the maximum temperature change for any station for any given hour and then throw out any temperature that exceeds this maximum. As anybody who has done the smallest bit of programming can tell you, it is a trivial matter to either discard or flag temperature changes that exceed a maximum possible change.
Gee, I wonder when they change the group posted to the station? Could a newbie just posted to the station be the answer to the data jumps in the July 13 record?
Is this a case of GISS saying that when it comes to quality control…
“We;ll have Nunavut” ?
CO2MIC SPRITES? A very rare and unusual meterillogic event in the Arctic. Only a vew UN Environmentalists, Ecologists, Economists, Climatologists, Historians, Biologists, Arms Reduction Negotiators, and Socialogists have been able to study them up close. I imagine from what we’re seeing in these official reports that they’re very hot, sometimes, and not very hot sometimes. Isn’t this just wierd? The Universe is a mighty wonderous and very strange place, and here we are just spoiling everything. I for one intend to stop breathing for Lent, next year, if it gets hot, in Canada, and all the snow and ice melts, and the oceans rise more than 3 feet, before Ash Wednesday.
Anthony:
I’ve been recording Alert’s monthly average for a number of years now. Have it broken down by month as well so that can be trended. Kapuskasing as well for obscure work reasons. If you wish, I can send you the excell file. For days with missing data, I’ve substituted the mean from the day before and the day after. In some cases, the day is missing from the monthly record, but can be reconstructed by using daily data. Not a huge number of data points. As I was doing this for personal reasons, I didn’t keep careful track of which months were adjusted. I would put it at less than 1% though.
JE
geo (Anthony’s reply) (15:54:35) :
Ah, okay, so we’re broadening the METAR critique here beyond the M issue. Got it.
This also appears to me to be an obvious and compelling argument for doing some outlier testing and rejection during QA of these kind of “edge of the world” sites that are used to represent vast areas of the globe all by themselves without other averaging available to smooth out temporary issues.
That’s probably worthy of its own focus, outside of whatever METAR contributes to that problem.
While I enjoy reading your posts I dearly look forward to the day that you learn that it’s is not th possessive of “it”, but rather the contraction of “it is”.
The possessive of it is merely “its”.
Freespeech: We all make mistakes, even simple ones like leaving the “e” off “th_”
Ed Caryl (16:18:20) :
You know, that DOES look like a stevenson screen, sitting on a slightly lower elevation. If you look closely, the landscape seems to drop lower 5-6 meters behind the low boy.
It’s worth taking a look at http://www.sailwx.info/shiptrack/
This website uses The World Meteorological Organization’s Voluntary Observing Ship (VOS) data.
Click on All ships worldwide and start searching in the cold northen regions. Scroll down for individual ship and bouy data. You’ll soon notice plenty of missing minus signs.
Some examples
This ship
http://www.sailwx.info/shiptrack/shipposition.phtml?call=UFTA
or this bouy
http://www.sailwx.info/shiptrack/shipposition.phtml?call=48548
(these are realtime readings if they stop working then take 5min to find some of your own)
Environment Canada’s hourly readings are not the high for the hour. They are just the reading that was taken on the hour. I have seen the high for the day be off by a degree or two for my area in Ontario, but nothing like this.
John M Reynolds
I’m willing to bet that the office cat curled up for a nap on the temperature sensor.
Kind of funny, Nick CLegg calling people “nutters” when he’s about the most vicious anti-semite British politics has seen in a long, long time. Look up some of his comments on the subject.
This makes me wonder if the event could be caused by something like a plane, truck, or snow-cat parked briefly near the sensor. In the Arctic, vehicles are left to idle, as turning them off allows them to freeze up, sometimes never to be restarted.>>
Well… since the advent of fuel injection and electronic timing, not so much. I think more importantly though… not at +19 degrees C!
Although some people leave their trucks idling so the air conditioning keeps running….
Bunch of guys, isolated and bored.
You are bound to get a blue flame every now and then, and since they show up better in the dark (outside) and they can warm you up a little, there is no need for any further analysis.
Anthony, as I understand it, WMO requires that a METAR report have AUTO included near the start if it was automatically generated. The illustrated reports do not contain this indicator.
Fortunately, all METAR reports from U.S. stations are required to have an additional “T Group” tacked on the end reporting the temperature and dew point in tenths of degrees Celsius, each preceded by a sign indicator, 0 for positive and 1 for negative. This at least provide a crosscheck. But nothing can automatically fix sloppy observations. Take a look a few U.S. METAR reports and be surprised.
I’m with you – I liked AIRWAYS code. I was always intrigued by the way so much info was packed into the term W0X0F, which for you “youngsters” meant “Ceiling Indefinite, Zero, Obscured, and visibility Zero with Fog.” We always pronounced it as if the zeros were alpha “ohs.”
OT
Not that I’m a fan at all of Shawn Hannity of Fox news, but he is doing a show tonight on Climategate at 9PM eastern.
given the time of year and the time of day, I’d guess the sensor was undergoing maintenance and someone brought it in or accessed it from indoors that evening – thus the 68F.
Picture of NDACC station at Eureka
http://www.ndsc.ncep.noaa.gov/sites/stat_reps/eureka/
NOAA article showing arctic observatories
http://www.esrl.noaa.gov/news/2007/psd070419.html
http://www.esrl.noaa.gov/psd/arctic/search/fig.html
http://www.oar.noaa.gov/research/2007/arctic.shtml
Eureka Operations building
http://www.ec.gc.ca/EnviroZine/english/issues/72/feature2_e.cfm
Canadian Station
http://www.canada.com/story_print.html?id=1298434&sponsor=
http://www.vancouversun.com/life/green-living/2465224.bin?size=620×400
http://gaw.empa.ch/gawsis/reports.asp?StationID=295
Eureka airstrip picture
http://static.panoramio.com/photos/original/2448336.jpg
Aerial view of Eureka
http://p6.hostingprod.com/@treks.org/arctic08.jpg
Eureka has eMinent domain over the north!
[:)]
Let me guess, it’s right next to the source of the black smoke in this photo…
http://acebox.uwaterloo.ca/eureka/Eureka2004/EurekaPictures/feb23_weather_station_at_night.jpg
If not here’s lots of other pics to chose from:
http://acebox.uwaterloo.ca/eureka/photos.html
http://acebox.uwaterloo.ca/eureka/Eureka2009/photos.html
http://acebox.uwaterloo.ca/eureka/Eureka2008/photos.html
http://acebox.uwaterloo.ca/eureka/Eureka2007/photos.html
http://acebox.uwaterloo.ca/eureka/Eureka2006/photos.html
http://acebox.uwaterloo.ca/eureka/Eureka2005/photos.html
http://acebox.uwaterloo.ca/eureka/Eureka2004/photos.html
Look at the other readings from July 13th, 2009 in Eureka, they’re consistent with a humid heat source. Dew point is higher, so there is more water in the air. The wind speed and pressure are unchanged, so something moist warmed the thermometer without a pressure change and without reaching the wind sensors.
It’s a non-weather temperature change, and not a misread thermometer.
I do note that the dew point happens to be the same as the previous hour’s temperature. But the temperature should have been dropping, so the actual temp that hour probably was not copied in the wrong place.
There is a possibility that the previous hour’s temp was copied twice, once into the temp and again into the next hour’s dew point. But if the temp was back-calculated from the dew point, the relative humidity should have been lower than it is. Again, this is inconsistent, so a local heat source is most likely.
It renders any conclusions you can draw from the data sets as eMpty of value.
Eureka has eMinent dominion over the north!
[:)]
Their GOES products and lightning detection are good, I have respect for some of their workers and field people but the management and public/media relations depts are just horrendous…
They sure do invest millions and millions of taxpayer dough in “green” initiatives and they’re big Kyoto cheerleaders, tho..
Drifting buoy.
http://www.sailwx.info/shiptrack/shipposition.phtml?call=48534
http://www.sailwx.info/shiptrack/shipposition.phtml?call=48537
Crazy temperature
Perhaps if they didn’t make the sensors look like ashtrays this sort of thing wouldn’t happen
A chinook perhaps ?
http://www.mountainnature.com/climate/Chinook.htm
The question I’ve got is how do you get a trend out of all this?
If a technical change introduced more errors then you may see a spike at the time of introduction. After that the rate of errors should remain the same and appear randomly. It could change the absolute values but not introduce a trend.
Gail Combs (16:36:33) :
The july 13 data with the big jump to 19.6 at 22:00 hrs also has some interest jumps at 10:00 hrs and 17:00 hrs. The temperature jumps from 6.9 to 13.0 and back to 7.4 at 10:00 hrs and again 9.5 to 13.7 and back to 7.2 at 17:00 hrs.
That’s what my data looked like from Anthony’s USB-2 two days ago.
After an evening cruize (sic) in my black 350Z (checking SA UHI), I left it installed in the window, taking readings every 10 seconds. Over night temps were very stable (overcast), but the next day was partly cloudy (with only a mild wind).
Max temp at the airport was 76°F, but a foot above the roof of my car, the temps were all over the map, reaching 98°F during one mid-afternoon sunny period.
The device would be an inexpensive way to measure cloudiness.
http://i41.tinypic.com/scqmn9.jpg
http://tinypic.com/r/scqmn9/5
I hope one or the other address is correct.
I thought this website was interesting.
http://www.sailwx.info/shiptrack/index.html
It shows The the World Meteorological Organization’s Voluntary Observing Ship (VOS) data realtime.
Click all ships worldwide and check some of the cold northerly reports. You can see many missing minus signs in both the ship and bouy data.
Do I notice a simultaneous drop in humidity? It must be the barbecue or a fired heater of some kind. I think vehicle exhaust might have a higher humidity than ambient. Somebody at the site may know exactly what happened. Otherwise, a simoom, maybe?
Every one of them [ the general pool of media the government criminal ring to terrorize people with the end of the world got it’s hands around: wikipedia, government reporting, government (university) review of scientific literature ]
Every one of them is being revealed to be fake , one,
by one.
Al Gore the guy who ”had a great idea of how to transform the economy he wanted to show the people… SMART, SMART MEN, He KNEW, had APPROVED it” –
carbon credits opened at $22 per ton. . . opening at Z.E.R.O. after
dozens of arrests all over Europe where he worked with Germans and others
Hansen with his legendary record of false predictions that , for some years, was literally a CAT CALL to shut a bunch of globel warming HICKS up.
Mann with his “school of statistics for climatography-ism-istic studies in the magic-sphere”
The entire system recently adjudicated as “not mathematics we endorse as being actual statistics” by the Royal Statistical Society…
If their statistics aren’t even endorsed by the people that teach statistical modeling
they aren’t qualified to make climate models and submit them at ALL.
‘WHAT YOU DO IS NOT MATH’ turns that water O.F.F. PERMAnently. PERManently kids.
They dont have MODELS they can get certified any more, NONE of them who used the Mann/Briffa/Jones/etc methods do; not by serious statistical/instrumentation schools or foundations. That’s done because it is a simple matter to simply enter into federal regulations and state, that methods used must have endorsement by statistical/instrumentation professionals and teachers in a variety of fields.
Briffa.. with 12 trees.. HID it for YEARS. Wanted it submitted to sway policy.. but didn’t want to have to let people look under the hood, just like Mann didn’t.
Kevin “I’m the smartest man in the world” Trenberth with his LUDICROUS ‘earth energy budget’ who
when we gave him a satellite
found he couldn’t read the information from it: what he had thought and taught and testified was end-of-the-world runaway warming
was
situation – what? Oh yea situation normal.
Gavin Schmidt who whined about how ”the troposphere really is heating if you look for it”
Steven Schneider who tried to float the “the answer’s floating in the wind” paper which said – he had MODELED TEMPERATURE from WIND SPEED in the troposphere, and SURE ENOUGH
the troposphere is heating and yea.. it’s worse than we thought, and yea … all the radiosonde
satellite
aircraft
thermal sensors on earth
are broken. They don’t work.
And with the NEW MODEL thermal measurement was no longer needed because it was OBSOLETE compared to schneider’s model.
Can you believe those claims were allowed to be floated at large, by him and the people who hire him, trenberth etc
As science that was foretelling the END people, of the WORLD.
Which one of them has NOT had his fundamental methodology and acumen completely revoked in broad daylight….
But they’re a ring of government employees and Al Gore needed them to pulse his “i could have been president” rage tantrum.
Dispicable.
Many years ago, Gore and others would have been out on the front steps of the capital choosing pistols out of a matched set in a box, where someone called him out to see if he really stood by his beliefs, as he and his friends LAID WASTE to PEOPLE’S LIVES and CAREERS in the interest of sheer political will for their word
to be the law of the land.
freespeech (16:55:57) :
While I enjoy reading your posts I dearly look forward to the day that you learn that it’s is not th possessive of “it”, but rather the contraction of “it is”.
The possessive of it is merely “its”.
Anthony Watts (17:01:20) :
We all make mistakes, even simple ones like leaving the “e”. off “th_”
I’m whit Aohnnty on tihs. Sure, trehe aer tinghs taht bug me too, lkie wehn plopee use teh wrod “then” wehn tehy maen “than”, but get oevr it, i’ts teh mnieiang of waht smoebdoy syas taht cnuots, nto teh spelinlig.
This reminds me of the time it got down to -11F and snowed in Key West Florida on July 11, 2009.
http://wattsupwiththat.com/2009/07/11/key-west-fl-sets-new-subzero-record-low-temperature/
…I don’t think they let that record stand though.
That drop in humidity is relative. If the dewpoint is up, the absolute humidity may be high, which would correspond, I suspect, to a high temperature–not an instrument error per se, unless they determine the relative humidity from the same temperature sensor.
Wait a bit. Look at the low-boy, then to the right. Count six drums. What is that above the 6th drum??? Looks like a honkin’ big burner to me. Do my eyes deceive me?
freespeech (16:55:57) :
“[While I enjoy reading your posts I dearly look forward to the day that you learn that it’s is not th possessive of “it”, but rather the contraction of “it is”.
The possessive of it is merely “its”.]”
And THE is spelled THE; not TH
Surely these unexpected sharp spikes of temperature rise lend credence to the idea that “tipping points” via positive feedbacks are real, robust and “worse than we thought”
As Anthony, himself, has admitted, no known metereological process exists to explain such dramatic changes.
Climate “Science” already has the answer. When the metrics are subjected to rigorous and unquestioning analysis AND are going in the direction you first thought of, first move dissenting data to the censored folder.
Once this step has been achieved, present the pros and cons together in a balanced, neutral and peer-reviewed publication. “Nature”, springs to mind!
Remember, if you can’t find a physical mechanism to explain your findings, it must be Anthropogenic in origin.
Nothing to do with an ignorance on your part of the Science, ‘cos that is settled, it doesn’t need to invoke witchcraft- not so saleable,nowadays, as it used to be-but it does evoke a favourable response from the funding-throwers! Ching, Ching…
That’s good, isn’t it?
Anthony Watts!
The world’s temperatures own Mr Sherlock Holmes. Fantastic work again Anthony! GISS NHCD are completely incompetent.
Anthony Watts (17:01:20)
I don’t know about you, Anthony, but I use a wireless keyboard because I absolutely loathe being “tethered”. The drag of a physical connection just distracts me beyond endurance at this point of technology history. I am also prepared to swear under oath that wireless keyboards miss a character here and there that my finger quite firmly pushed.
I’m not entirely intolerant of the spelling/grammar police. But have a little sympathy for technolgy, eh?
These types of errors are common in EC data for some stations (and we are not talking about just a few – my experience has been that messy stations are far more common than good ones). This is admitted openly by EC administrators (one of whom wrote to me indicating his position was being phased out or eliminated or something to that effect shortly after we had correspondence about admitted data quality issues).
Anthony & others looking into this:
Note on the EC data pages links to “CSV” Excel files. In SOME cases they reveal more detailed info about which “data” have been estimated (some might say “cooked”).
I could show you MUCH more humorous examples that what you have shown here.
One has to wonder what data quality standards are like in “less” developed countries around the world…
Regards,
Paul.
@DaveK (16:15:42) :
As Lord Nelson famously said, ” I see no ships” followed by “only hardships” for some
Sorry to be pedantic, but that’s a common misquote. According to the legend, what Nelson said was,
“I really do not see the signal!” http://militaryhistory.about.com/b/2007/04/05/admiral-nelson-turns-a-blind-eye.htm.
– And “signal” is more relevant to the blind eye in the present case, but the motives behind this one are far less heroic.
jorgekafkazar (18:10:51) – As I mentioned recently, I think there was an increase in humidity because the dew point increased. Temp and humidity both increased.
Anthony – I think this is the first post for which the picture appears in the RSS feed. You often choose interesting pictures, so that’s a good change.
Why aren’t there two or more thermometers at every weather station, separated by say 100 metres? With automatic recording it would be easy to check whether the readings agree (as they should). Then parking a helicopter next to one of them may be noticed.
Or a lawn sprinkler: http://i41.tinypic.com/20ti0yu.jpg
(Google Streetview of Winton Post Office, Australia with Stevenson screen on left, sprinkler on right)
Dugg on http://digg.com/environment/Dial_M_for_mangled_Wikipedia_and_Env_Canada_data_errors
I’m looking into the min/max daily mean over a month and the difference with the precise hourly mean over a month – basically noise events like this get exaggerated by the first method..
See http://www.ecowho.com/blogs/30/What_exactly_is_a_monthly_mean%3F/-08b8b
Familiar stomping grounds for me. Worked there March 1979 to July 1980. Summers were wonderful, the winters sucked! i have similiar photos of that place.
An alternative interpretation of this data leads to the following conclusion.
Man Made Emissions of CO2 are not well mixed in the atmosphere but are capable of clumping together to form super hot spots, probably not much more than 1 meter wide, but kilometers high.
I would contend that just such a hot spot has occurred several times in the direct vicinity of the referenced thermometer. Due to the narrow width of the hot spots they rapidly come and go.
I would also contend that this is very similar to those rare situations where a super high wave is created when other waves happen to align with each other.
It also strikes me that this concept could also be used to explain spontaneous human combustion… and probably many other rare phenomena based around sudden heating.
Of course with many such ideas as the above, it is wise to apply Occams razor and compare the above contention with the other possible explanations ranging from human error, to fraud, to mechanical disruption of the thermometers environment…
Given the extremely high ethical standards and competancy of climate scientists I leave it to the reader to draw their own conclusions.
I was just about to make the point that davidmhoffer (17:12:07) did:
This makes me wonder if the event could be caused by something like a plane, truck, or snow-cat parked briefly near the sensor. In the Arctic, vehicles are left to idle, as turning them off allows them to freeze up, sometimes never to be restarted.>>
Well… since the advent of fuel injection and electronic timing, not so much. I think more importantly though… not at +19 degrees C!
Although some people leave their trucks idling so the air conditioning keeps running…
—- Except that it doesn’t seem warm enough to need air conditioning, and at these temperatures – even the real ones – a vehicle shouldn’t make that much of a difference.
Something stranger here. Could be a polar bear sitting on it, or something more obvious…
Why are all these errors on the convenient side?
I can’t think of a [ ]-gate term that is clever. We seem to be out of clever [ ]-gate terminology. And that speaks volumes.
@Graeme From Melbourne (19:09:44)
Please remind me of the heat coefficient of CO2?
Lance . . . did you ever work the DEW Line ?
Something similar seems to have happened last month when, according to NASA, it turned toasty (relatively speaking) all around the north pole:
http://data.giss.nasa.gov/cgi-bin/gistemp/do_nmap.py?year_last=2010&month_last=3&sat=4&sst=0&type=anoms&mean_gen=03&year1=2010&year2=2010&base1=1951&base2=1980&radius=1200&pol=pol
Could the huge anomaly of ~ 4 degrees Celsius be connected with readings from the Eureka weather station? I don’t think you can blame this one on a nearby vehicle with its engine running. Take a look at March 29, 2010:
http://www.wunderground.com/history/airport/CWEU/2010/3/29/DailyHistory.html?req_city=NA&req_state=NA&req_statename=NA
Automated surface measurements are subject to innumerable vicissitudes, manual data-entry is always prone to error. But surely, even rudimentary checks would flag major discrepancies for adjustment, editing, deletion. The fact that no-one on any level seems ever to run basic quality-control routines suggests that data gathering is marginal to climate studies’ “real work”– not an objective, rational scientific enterprise at all, but rather an agenda-driven exercise in buttressing preconceived conclusions regardless of circumstances pertaining to the real-world.
On this basis, a return to disinterested first principles is decades overdue. But having forfeited public trust to this extent, it’s hard to see how anything but a radical change in personnel over at least a generation could reinstate anything concerning Climate Cultists’ Green Gang of Briffa, Hansen, Jones, Mann, Trenberth et al. Meantime, nothing Pachauri and his ill-gotten crew pronounce has any credibility whatever.
Pamela Gray (19:26:34) “I can’t think of a [ ]-gate term that is clever. We seem to be out of clever [ ]-gate terminology. And that speaks volumes.”
Good point. How about Your-EC-agate?
DirkH’s comment about cooking eggs reminds me of a story:
In the early 60’s a quarterly supply flight delivered to the boys at Eureka their rations for the next few months whch included a couple of cases of eggs and a couple of jugs of rum. The next morning the station chief woke to find that the cook had discovered the rum and had fried all the eggs; then nailed them to the cookhouse wall. I have no idea what that day’s temperature record looked like.
Yeah well in wikipedia the truth doesn’t matter too much. It is filled with obstructionist pseudo-intellectual morons and enabled by admins who are in on the carbon credit scheme.
Yeah – I’m serious – check this out:
http://pediawatch.wordpress.com/2010/04/21/administrative-conflict-of-interest/
20.9C reads like an indoor temperature.
Wonder if someone brought the sensor array indoors for a brief period to replace or service a part not realizing it would have such a dramatic effect on the temperature history of the region. This happened recently enough that Environment Canada might have records or be able to query the staff about what happened.
Might be worth an email. They probably don’t even know they reported record temperatures.
One hesitates to cry “fraud”, but was no one at Env. Canada interested enough in a temperature of over 20C at Eureka to bother to question it; to look at the thermometer data?. This was not some one or two degree variance, this was huge. Alarm bells should have rung somewhere. They didn’t. Why?
too crazy to excerpt –
‘Avatar’ Director James Cameron: Climate Change as Great as Any Threat Since World War II
http://www.cnsnews.com/news/article/64516
@Pamela Gray (19:26:34) :
It is obvious, 1968-1996 (METAR transition) seem to be the weirdest in temperature measurements, METAR-GATE is appropriate (M-Gate for short). Transitions from and to all new metrology equipment should always be done under close supervision and statistical analysis (a gauge R&R is helpful, but, I dare say, the ubiquitous ‘they’ did not do that. ‘They’ did not fix this obvious ‘sign flipping’ issue and this amounts to the same neglect that the CRU and Mann are accused of.
M-gate works for me.
The Antarctica AWS stations are not good. Stay with this a twist is coming.
The Harry data led me to start looking and what turned up was not good.
Turns out the AWS hardware is problematic.
Then I found what I am quite sure is a bus error and then lots of instances of hardware malfunctions. To make it worse, the radio links are awful, inadequate error detection. Try a 20C jump in a matter of minutes and then back.
Cutting that part of the story short, I had the high resolution data when BAS were fiddling around with their web published public version so I could back calculate, all highly amusing. Antarctica Treaty and BAS omitted to say they have to give the data to others and they make it available to the public.
Hence I discovered the hardware errors in the real data.
What’s this to do with the Arctic, surely they are poles apart?
Seeing that ancient mil spec A/D are likely or similar and being a former equipment designer I took a guess, grab calculator.
” The temperature jumps from 6.9 to 13.0 and back to 7.4 at 10:00 hrs and again 9.5 to 13.7 and back to 7.2 at 17:00 hrs. ”
Only takes condensation to do this, given it happens at room temperature.
13 – 6.9=6.1C not interesting. But this is american equipment.
6.1*9/5 = 10.98 and that looks likely, is basically internally F, the higher numeric resolution. Kind of things folks do.
13-7.4*9/5=1008
13.7-9.5*9/5=756
13.7-7.2*9/5=1170
Bet that unlike the BAS stuff which appears to use an old BCD interface this is binary and a duff bit, 1024, bit 9, 2^10
Is about right on resolution. Wouldn’t be surprised if 1.024 or 10.24 is the internal reference
Look for jumps around 5.7C
If a higher bit is dodgy, might get 22.8C jump.
However on looking at some of the examples, could be at least 3 bits playing games
11.4
11.4+5.7=17.1
One of the plots shown might have several instances where actually the temperature variation was rather boring.
It gets worse, the reading are probably averaged and faults are noisy so anything is possible.
Might not be the only pattern and so the entire record is suspect, other malfunctions are possible. The equipment housing probably has an air leak.
The above is guesswork so I might be very wrong.
Fun puzzle as usual – this site is very addictive.
Consider being up there and the winter/night logic.
One would likely enjoy the beautiful July days but night would likely bring on a warmed up truck cab before venturing out. If the sensor was under a maintenance routine after all the rain a couple of days before, wouldn’t you work on it on the slightly warmed up hood of the truck in the morning and late afternoon and inside the cab at night?
There must be a lot of tundra “furies” out at night up there and it would be warmer in the cab.
Thus the modest spikes at 9am and 4pm and the big one at 9pm?
Here’s why
http://1.bp.blogspot.com/_blnN-QHR9C4/SyCdnL6-DwI/AAAAAAAAAOU/AWNYOYsPw4I/s1600-h/091125boklores1.jpg
I think we should destroy the economy just in case those heat spikes are real.
Is it safe to come out now?
Has all the ash fallen?
Is Earth Day done.
Are we done.
So done.
We.
This has less to do with METAR and more to do with the observers input and the lack of error checking by the software. When I type in the hourly weather, not in the METAR format, there is only a limited amount of error checking done.
Pressure is the only time the software looks back at the previous hour to check. So if at 1300Z I type -20.5 for the temperature and then at 1400Z I forget the – sign and type 20.6 the software won’t notice it.
While I can’t say for sure but I think the Stevenson Screen is visible in the image above. In the centre right there are some black and red drums. Directly above the 2 upright black drums and to the left of the flatbed is a white object that is the correct shape for the screen.
I searched through the temp records of every day in July and the 19.6 degrees C on July 13th was the warmest logged hourly temp that I found.
However, when you look at the hourly log for the 13th, it is obvious 19.6 was an error. There is no possible way the temperature would have soared to 19.6 at 10:00 pm, up from 5.9 deg at 9:00 pm. Then at 11:00 pm it drops back down to 4.1 degrees. Does this make logical sense?
Well from the Pics I saw here the New weather building is not there,you can’t miss it it is a very large blue building with everything in it. the pic is an old one. As for the truck, or snow-cat parked briefly near the sensor is possible, as I spent 3 months there for OP Hurricane and this kind of thing happens all the time of leaving vehicles running while conducting your business. At that time I wouldn’t even notice where the weather sensors were to my location, as I wouldn’t be paying any attention to it. But I can say there were no barriers or signs even put arround a weather station/sensor to avoid this kind of contaminatiion or I would have seen it and been told about parking too close to one. The weather station manager there is very controlling of the area and doesn’t want anyone stepping on or interferring in his business there. He calls the shots and doesn’t want anyone to tell him what to do. So I was always courtious with him and was able to conduct my business with the weather station personnel with minimal obstruction.
This might have been mentioned earlier (I only read WUWT in the evenings) but Ed Morrissey taped a very good interview with Dr Roy Spencer here:
http://tinyurl.com/36pe4ft
Dr. Spencer is the second of three guests.
Joanie
6.19 versus 19.6? Big difference. Reminds me of a little ‘ol mistake in the IPCC report.
Might it have been the case of read it and get back in where it’s warm? Now what was that number again? Oh hell. Can’t remember and I am freezing my numbnuts off. Ain’t goin back out there. I know it had a 1, a 9, and a 6 init. Close nuf for guvmnt work.
“Clearly there are data problems of all kinds here -A”
Just a bit of an understatement, eh Anthony…
If these ‘ERRORS’ were random, we should find some adding to the temps and others reducing temps…
Since the ‘ERRORS” all seem to be adding to the temperature… there has to be a concerted effort to achieve the temp increases.
Since, Mr. Smith, Mr. McIntyre and Mr.Watts have repeatedly shown the infinite layers of errors and manipulations have falsely shown miniscule warming.
This is an extremely shaky foundation for ‘science’.
When are we to say enough already!
Juts wondered if there are any known cases of sudden and drastic falls in temperature? Like if the researcher spills his G&T over the temperature sensor at 7pm each evening?
Because if not, then, together with the M problem described earlier, the collection and reporting mechanisms themselves are already biased to show artificially high temperatures.
maybe some global warmist just put their hand on the sensor to skew the data upwards but could not keep it there for a whole day, obviously!
Either you fudge the data, the statistical method, or the sensors… by the way, how often do these sensors get calibrated?
I’m flabbergasted that temperature data collection can be prone to so many errors in so many dimensions from siting issues to human errors of data entry and misunderstanding the limits of statistics, though on to human analysis fabrications (intentional or otherwise). How can any of it be taken seriously?
Has anyone made a list or flow diagram showing all the steps and all the places that errors have been found to creep in?
I found a similar error in a Resolute maximum in the last few years. I do not remember the year and month but I think it was about 15 degrees too high. I may have noted it here or in Climateaudit.
I’d like to say hi to Joby the maintenance man/ jack of all tradesman there if anyone from there is reading this. A well likeable fellow and a Newfoundlander too.
Anthony,
You mention that “the data from only one station is responsible for a very big percentage of global temperatures”. We can test this fairly easily by calculating global land temps (using raw GHCN v2.mean data) with and without Eureka (wmo_id 71917).
To me at least the results appear indistinguishable:
The trends bear this out: http://i81.photobucket.com/albums/j237/hausfath/Picture119.png
Trend 1900-2009 (Degrees C per decade)
GHCN land: 0.07456
GHCN land sans Eureka: 0.07453
Trend 1960-2009 (Degrees C per decade)
GHCN land: 0.20243
GHCN land sans Eureka: 0.20235
So while data quality from this station is certainly important, lets not make too much of its special status.
REPLY: Actually I did not mention that, Ecotretas did, but let’s not make a too much out of your mistakes. The issue of most interest is not GHCN as a whole, bit the fact the Eureka data gets interpolated into nearby grid boxes. Nice try at diluting the issue though. – A
It should not be hard to automate the discovery of the most blatant errors. A computer is pretty good at making comparisons in data. If a temperature rises some extreme amount from the previous and subsequent readings, particularly at a time of day when temperature should not be rising, it should be flagged for scrutiny.
I believe this shows the complete lack of scrutiny this data gets. We are asked to allow lifestyle modifying changes to be made in our laws (income modifying, too, I might add) based on these readings yet they take no serious responsibility for making sure those data are correct. It is yet again another indication of the lack of respect for and apparent contempt in which the tax paying citizen is held by those in these various government agencies and research organization.
How can they expect us to believe a word they say when such obvious errors slip through, possibly on a daily basis?
Just got back from a horrible match of pool. I’m…….this is ……well, to quote my vice president……this is a big f…n deal!!!!!! Were they really that stupid??? I haven’t read the discussion because….well, I’m back from the bar, but wtf? Is that really the station that is causing all the warming????? I’ve got a good 1/2 hr left in me tonight……….. someone give me a yes or no!!!! IS that the one that is making the arctic so hot??
Anthony wrote:
“Freespeech: We all make mistakes, even simple ones like leaving the “e” off “th_”
I agree, and just like the dropped ‘M’ I hope we can all tell the difference between a systematic error and a typo. I am not trying to be a smart arse here. This mistake appears systematically in your documents, it is difficult for a pure spell-checker to correct since both are correct words. Your documents are being seen (hopefully) by more influential audiences and hence it is important that they appear to be of high quality and well thought out. While I understand that content should be more important than form, we need to be aware that if a document appears to be written by an Appalachian banjo player it may affect its impact.
Now I’m not saying your documents appear that way, just trying to help.
I should have prefixed the original post with:
“Helpful comment only–do not publish”
Apologies.
.
.
Please look up “The Cremation of Sam McGee”.
Therein lies the answer to sudden rises of temperature in Canada’s North.
.
.
Let me get this straight. It started out being manned by American soldiers, but its a Canadian base, so over time it has had a mix of both, all men, no radio, TV, newspapers, nothing to do but drink, and nothing to read but a thermometer. Can you imagine some of the conversations?
Cdn; Did you read the thermometer?
Amcn; Yup. marked it down.
Cdn; Did you put an M for minus?
Amcn; Nope. It was positive.
Cdn; Eh?
Amcn; Plus. It was like plus 20.
Cdn; Can’t be. Its like snowing out, eh.
Amcn; Well dummy, 20 is 12 degrees below freezing.
Cdn; Moron, we use Celsius now. You read the wrong side of the thermometer.
Amcn; So I gotta read it again?
Cdn; Yeah.
Amcn; Can’t. There’s a polar bear out there now. Can’t we just convert?
Cdn; Yeah, you gotta divide by nine and multiply by five…
Amcn; …no, I think you got it backwards…
Cdn; …and add 32.
Amcn; and put an M in front of it cuz itz below freezing?
Cdn; no because its below zero
Amcn; but its plus 20…
Cdn; so don’t.
Amcn; Fine.
Cdn; Fine.
Amcn; You gotta read the next time.
Cdn; Polar bear still out there. Not risking my life to read a thermometer.
Amcn; …and we’re outa booze, I forgot the rest in my truck.
Cdn; that’s different. gimme my jacket, eh?
One would expect basic data entry errors to have a neutral bias, one would expect them to happen in both directions at about equal frequency. The METAR M problem is one which always biases warm or will bias warm at much greater frequency. It requires someone to insert an incorrect M in order to bias a reading cold while it takes a simple mistake of “-” or omission to bias warm. In other words, warm is the bias of omission which is an easier mistake to make.
There are two things that should be done to eliminate the error:
1. Require a P for + in addition to the M required for -. Do not assume an unsigned reading is positive.
2. Develop input software that will substitute P for a + and M for a – in the input data.
3. Flag unsigned input data with an E flag. 13.2 would be reported as E13.2 in order to flag that the sign needs to be corrected.
In this way the bias of omission is to flag error (neutral consequence) and to bias a legitimate reading warm or cold would require an active mistake on the part of the person entering the reading. Such errors would be expected to happen in both directions over time.
davidmhoffer, To my knowledge it is all Canadians there, until the spring summer season, NASA people were there but were very secret about what they were doing, other than testing a rover prototype is all I know. But they have all kinds of instruments there other than thermometers as you say. they do ice cores, weather balloons they send up with different instruments twice a day, A station specifically setup for the Ozone layer to measure the upper atmosphere, other stations we weren’t in the need to know about????? They have internet, satellite TV, radio and Telephone there too, although the Satellite link for TV is on the very edge of the horizon and is choppy at times, but they have it, so stop talking like they are from the dark ages, you are assuming things and making an ass of your self.
This is so very typical of USA science now.
freespeech;
we need to be aware that if a document appears to be written by an Appalachian banjo player it may affect its impact>>
The opposite in fact. You have neatly summed up one of the biggest issues of the climate debate. Reams of data, documented, cross referenced, and presented in mind numbing detail, accompanied by sparkling graphs, are turning out to be fabricated or fraudulent or deliberately misrepresented. Their credibility lies not in their content, facts, or logic, but is in fact reliant upon the assumption that the professional presentation confers on it an aura of quality, that graphs produced by the most complex of computer programs must be taken at face value. As a grad student once told me, when you don’t know what you are doing, do it very neatly and in great detail, chances are no one will notice.
The its versus it’s thing is really getting old. If it was important enough we would have a vote on it and spelling them both as “its” would win by a landslide. Language changes with time as conventions that don’t substantively change the intepretation of the words get dropped in favour of the simplist solution.
Read some Chaucer some time and be thankful that the pronunciation of the words evolved to something easier. As it happens, I know an Appalachian banjo maker which is different from a player, but he is quite skilled. I;m not certain which version he uses, when I ask he just says “izza banjo, you buy or not.”
Maybe Ecotreas has found the famous tipping point, which the warmers are so afraid of? Yes we can!
Someone who has been there;
That rant had SO much good material in it crying out for a clever response. I sense however that you are genuine in having taken umbrage with my representsation of the conditions, and see this as a direct insult to the integrity, capabilities, and ethics of the people who work there. I measnt no harm, I was just illustrating in a a humerous way some of the many factors that could have lead to wrong readings. I am sending a care package with three cokes. One for you, one for your budy and one for the polar bear.
And I will have you know that I have NOT made an ass of myself. I was born this way. The proper term is disability. although I do take considerable time to amplify it when possible.
davidmhoffer .. VERY funny. Thanks.
Anthony. WOW! Outstanding digging. Thank you.
I’ll ask the EC minister to tell me what the temps REALLY were. He will respond. He plays the political AGW game, but knows the truth and is playing the cards reasonably well up here.
Clive
How about a farting polar bear ?
Apparently, they have removed the ‘high temp’ description from WIKI. That sentence has been dissappeared.
So the data clearly have problems.
What is less discussed I think is how flawed the method seems to be. As I understand it, the algorithm takes the max/min temperature and averages it for a given day. Anyone spending some time at data analysis realizes that any method that relies heavily on extremes almost always becomes a error finding method. Don’t you think a data error is more likely than not to be either a max or a min?
The M issue is very interesting because it is a data error that is both likely to affect the min/max calculation (as are most errors), but also has a strong warming bias. Having said that, I think the headline should be dial M for Mangled Method.
James
davidmhoffer, you are sending a care package with three cokes. One for you, one for your budy and one for the polar bear? I hope there is rum with that? HAHAHA. And besides I knew the people there for about 3 months a few years back, it’s not like they are my best friends or something., let me get that straight. But I have been there and from what I saw was plausible to what is reported here. In face the place is probably an environmental nightmare from what I’ve seen, and personnel there were over tasked with jobs they are not qualified for when I was there. And why was there no mention of the Alert weather station, the most northerly weather station, and well that is a military station to begin with anyway but Environment Canada has a weather station there too. I know I’ve been there as well????????
hourly data for july 13 on wunderground
http://www.wunderground.com/history/station/71917/2009/7/13/DailyHistory.html?theprefset=SHOWMETAR&theprefvalue=1
see peak at 9 pm:
METAR CWEU 140100Z 01014KT 40SM FEW070 FEW110 FEW240 06/01 A3019 RMK ACC1AC1CI0 CAMP WND 290/08 KTS SLP223
METAR CWEU 140200Z 02013KT 40SM FEW070 FEW240 20/06 A3019 RMK AC1CI0 SLP223
METAR CWEU 140300Z 01013KT 40SM FEW080 FEW240 04/00 A3019 RMK AC1CI0 CAMP WND 290/13 KTS LAST OBS/NEXT AT 140600Z SLP226
Error is not visible in the corrected weekly plot (july 13 is monday)
http://www.wunderground.com/history/station/71917/2009/7/13/WeeklyHistory.html
REPLY: See the January 1st, 2007 example with a missing M. Yes not all cases have missing M’s but we also have what appears to be meteorologically impossible values in the METAR reports. I can’t tell you if this is a manual coding error, an instrument error, or a local heat bias. More investigation is needed. Clearly there are data problems of all kinds here -A
Anthony, this is where your experience with real measurement wins completely over theoretical academics with very little practical experience. You have a sense for how “trustworthy” the data can be. How easily figures can be mis-recorded and like me that gives you a rule of thumb for how small a variation is meaningful and how much a whole range of measurements can be biased.
So, it is only a matter of time before the academics in their ivory tower will finally have to admit that the basic they relied on wasn’t up to scratch. And then guess who they’ll blame? Yes! The people like you and me who were all along telling them the data wasn’t fit for the purpose they were using it for!
The quality of the posts here are truly excellent. I enjoyed the well written ad- hominen discussion by IAMDIGITAP, an excellent history of the human bias factors very intelligently presented.
If I may be so bold to add:
Let’s face it, the major cause of this entire AGW hoax was such a behavioral issue in the first place. We should expect matter of factly, without being judgmental about it, that research grants, like laboratory food pellets will change people’s behavior in undesirable ways. We all like to think that we ourselves would never be scientifically dishonest. George C Scott said, as he portrayed the conniving swindler, the”Flim Flam Man”, in the movie of the same name, when asked if everyone had avarice in them, – “Every thermometer’s gotta register something”. How coincidentally apropos to this discussion don’t you think?
And in this particular instance, let’s face it, another warming report coincidently in favour of AGW. At the very least we have the writer getting his little food pellet for the article he wrote, probably from his editor, publisher and incoming emails. “We broke the news and you heard it first here – blah blah, good work son” and all that. Long live B F Skinner and his lab rats. So competent researchers should expect these errors as normal and work to eliminate them.
The best plan in overcoming this that I can see is right here with websites such as this combined with freedom of information. It’s the naked raw numbers which contain the truth. I would object to computer algorithms doing anything more than to searching for and identifying suspicious data. I would rather have someone pointing them out, as is done here so we all can see. We’ve all had enough of secret data bases from Phil Jones and the tree ring boys.
PS: If I recall correctly, the Flim Flam man had a very exalted degree, an “MBS CS DD”, ie, Master of Back Stabbing, Cork Screwing and Dirty Dealing. Sort of rolls of the tongue doesn’t it. And if I just happen to park my snowmobile a little too close to that sensor, well, whose going to know anyway. And the funding committee – “wow, record high temperatures eh, it’s a good thing we’re funding these people”. Send them more money!
Pamela Gray (19:26:34)
“I can’t think of a [ ]-gate term that is clever. We seem to be out of clever [ ]-gate terminology. And that speaks volumes.”
Easy – Eurekagate. The day the World realised that temperature data quality is not fit for purpose, as anomalies are within the error-bars of normal (whatever that may mean)!
Looking at this data today makes it imperative that all the weather data be scrutinized carefully to look for errors. The simplest way to do this would be for people to audit the data in their local area and, of course, such important stations like Eureka. When I started looking at my local area, (there are 18 weather stations in and around Kamloops), I ran into a very frustrating problem when trying to download data from the http://www.climate.weatheroffice.ec.gc.ca/climateData/ site. I could download a few csv files and then my web browser would appear to hang. I suspect this is deliberate to prevent people from downloading too much data as it occurred in multiple web browsers run from different IP addresses.
To get around this problem I wrote a quick and dirty (very dirty) program to generate the query strings for any Canadian station and date range and found I could quickly download large amounts of data. The initial version of the program just downloaded daily readings. After Anthony pointed out the major error in the Eureka station today the importance of looking at hourly readings became apparent. I added the ability to download hourly temperature readings tonight and will make it available for download on my webserver if there is sufficient interest.
The only thing I ask is that no-one comments about the quality of the code as it was thrown together in a few hours of programming and it works. It’s written in VB6 and is relatively slow as it does byte by byte transfers because I had some test code for the internet transfer control which worked and I wanted the temperature data, not an elegant program. I have it running right now and it’s taken about 20 minutes to download 400 months of hourly temperature data from station 1750 (Eureka).
One of the reasons I haven’t posted the code right now is because I don’t want to lose the ability to grab large amounts of temperature data which might happen if everybody starts downloading every Canadian weather station. Maybe someone with enough bandwidth could host this data in a less irritating form?
The quality of the posts here are truly excellent. I enjoyed the well written ad- hominen discussion by IAMDIGITAP, an excellent history of the human bias factors very intelligently presented.
If I may be so bold to add:
Let’s face it, the major cause of this entire AGW hoax was such a behavioral issue in the first place. We should expect matter of factly, without being judgmental about it, that research grants, like laboratory food pellets will change people’s behavior in undesirable ways. We all like to think that we ourselves would never be scientifically dishonest. George C Scott said, as he portrayed the conniving swindler, the”Flim Flam Man”, in the movie of the same name, when asked if everyone had avarice in them, – “Every thermometer’s gotta register something”. How coincidentally apropos to this discussion don’t you think?
And in this particular instance, let’s face it, another warming report coincidentally in favor of AGW. At the very least we have the writer getting his little food pellet for the article he wrote, probably from his editor, publisher and incoming emails. “We broke the news and you heard it first here – blah blah, good work son” and all that. Long live B F Skinner and his lab rats.
The best plan in overcoming this that I can see is right here with websites such as this combined with freedom of information. It’s the naked raw numbers which contain the truth. I’m a little suspicious of unpublished computer programs altering data. We’ve all had enough of obscure or secret data bases from Phil Jones and the tree ring boys who are apparently forced to walk on foot carrying chainsaws and aren’t even paid for their work.
PS: If I recall correctly, the Flim Flam man had a very exalted degree, an “MBS CS DD – Master of Back Stabbing, Cork Screwing and Dirty Dealing”. Sort of rolls off the tongue doesn’t it? And if I just happen to park my snowmobile a little too close to that sensor, well, who’s going to know anyway. And the funding committee – “wow, record high temperatures eh, it’s a good thing we’re funding these people”. And buy those poor tree ring people carrying those chainsaws a vehicle. Send everybody more money!
Sorry for the first posting. I think I posted by mistake while editing. Remove and or ignore the first if you wish.
roy
I’m usually tolerant of those who make mistakes; both in the use of language and use of data, unless they start to call others idiots. Mistakes happen. When people call into question the intelligence of those who disagree with them, they,themselves, damn well better be perfect.
AlGore, Mann, and the rest of the Mutual Admiration Society obviously are not.
JT (16:08:30) : I believe there are statistical methods which could be used on the entire temperature record from eureka which would identify outliers like the readings in question on this post. I don’t have the skills myself but I wonder whether the various algorithms used by the likes of GISS identify and discard such anomalies?
GISS in GIStemp doesn’t really do any “QA”. It does drop any record shorter than 20 years. It does “homogenize” things so data gets smeared around. But it generally presumes the data as received from NOAA / NCDC is “pristine”.
NOAA / NCDC do have QA processes, but a different set is applied to the USHCN than is applied to the GHCN. (And COOP stations get a different variation from what I’ve seen so far…). Exactly what “QA” has been applied to any given bit of data is, er, “uncertain”… The various national Meteorological Services get first crack at it (and in some cases, the only shot at the daily data as they create a monthly that is reported via CLIMAT report, so unless you pay up for the daily data, you have nothing to QA…) then their ‘work product’ gets circulated as a CLIMAT to NCDC who put it into the GHCN (except they sometimes don’t…. Bolivia has several years of CLIMATS on Ogimet as does Papua New Guinea and others; but don’t rate a spot in GHCN)
But that’s OK. PNG is only the second largest island in the world… (per Wiki, so apply salt…)
And the QA that is applied has some “Issues” IMHO.
Folks wanting a peek at the QA process can see here:
http://chiefio.wordpress.com/2010/04/11/qa-or-tossing-data-you-decide/
Alvin (19:32:18) :
@Graeme From Melbourne (19:09:44)
Please remind me of the heat coefficient of CO2?
Joking…
Damn, that nice big volcanic red area up there looked so warm and inviting. Does that mean I should advise my tour group to unpack the beach towels, sunblock and scuba gear?
davidmhoffer (17:12:07) : Well… since the advent of fuel injection and electronic timing, not so much. I think more importantly though… not at +19 degrees C!
Clearly not a Diesel guy, I see…
And you can see that much of the equipment there is Diesel.
FWIW: Diesel is much thicker than gasoline. About like warm cooking oil (if you warm cooking oil, it’s about the same viscosity as room temperature Diesel) If cold enough it will ‘gel’ and turn to something like honey or even crisco. Then you don’t go anywhere.
It is a standard practice in very cold climates to not let your Diesel get cold via not turning it off. It’s also common to have a batch of electric heating elements added so you can get it re-started if you do shut it down. The typical “arctic kit” includes heated fuel lines, fuel tanks, and special heated fuel filters. Oh, and a block heater too. You will find an electric cord near the door of many places to “plug in”. Interesting to note that a cord of some sort is visible in the top picture near the door…
“Back in the old days” folks would use propane torches or build fires under the fuel lines / tanks to thaw out the Diesel if they got desperate enough. Haven’t seen that in a while, though.
On a regular Diesel, some fuel is bypassed at the hot injectors (they have always been injected…) and routed back to the fuel tank to help warm the fuel. At about 10 F it took me around 20 minutes to get my Diesel started on one ski trip. I’d arrived at Tahoe with a tank of #2 Diesel that night and forgot to fill ‘er up with #1 (winterized Diesel) upon arrival. Just parked at the Hotel and hit the hot tub. Then 6 AM came. No joy. A load of ‘Diesel Starter’ in the throat and loads of cranking and repeated cycling of the glow plugs got it warm enough to start after about 20 minutes (why I packed the long extension cord and battery charger). Then I left it idling for about an hour to get the fuel in the tank warmed. Didn’t shut it down until I’d filled up with #1 later in the day. ( I did add a couple of gallons of “lamp oil” from the nearest grocery store while looking for a Diesel stop with #1 for sale. That eased my worries a bit.)
Now if that’s what happens at 10 F, just imagine at the Arctic Circle.
Adding a few gallons of “lamp oil” or “kerosene” is a decent field expedient measure. My 240D says it can take up to 25% Regular Unleaded gasoline as winterizing, but my 300D says 50% Kerosene – one could substitute Jet-A if desired; just to give an idea what ‘winter Diesel’ is like. For severe arctic conditions their is an even thinner spec. that’s about like straight Jet-A.
Oh, and “BioDiesel” has the added problem that it can throw crystals of solidified fat at even higher temperatures. Like 50 F. While in common blends it’s usually good down to 0 C or 32 F that is NOT a given. It depends entirely on the particular fats and percentages used to make that batch of fuel. If you are in Very Cold Country then BioDiesel is NOT your friend. I’m an advocate of BioDiesel and run it often, but you have to know its limitations if you are not going to be stuck in the barn… Nothing like having a filter plugged with fat crystals to stop you in your tracks. This is why many bioDiesel conversion or Straight Veg Oil conversions put an arctic heater on the fuel filter. And why some guy in California knows about arctic Diesel kit… If I’d been running BioDiesel on that Tahoe trip I’d have never gotten it started. At 10 F it’s fudge.
So, as a Diesel driver, I can tell you for certain that on cold days I would get my truck started at Eureka and never shut it down until I was near an electrical outlet or heated barn. You can turn it off for a few minutes (fuel lines take time to cool) but not for long if it’s very cold and not worth the risk in the Arctic. I can also tell you that if it was my job to check the climate gear shed at 10 pm on a very cold night I’d be snuggling that truck up as close to my destination as possible and there is no way I’d turn it off. And I’d not be at all surprised to find a vehicle heater electrical outlet located near the front door of every building there. So if I did shut it down, it would be because I was plugged into a kilowatt or 2 of electrical heater to keep the rig toasty.
And those 10, 14, 17, 19, 22:00 temperature blips sure look like some kind of ‘appointed rounds’ to me. A “10 to 10” cycle of some thing. It would be very interesting to see if the pattern holds on other days.
HR (18:01:08) : The question I’ve got is how do you get a trend out of all this?
If a technical change introduced more errors then you may see a spike at the time of introduction. After that the rate of errors should remain the same and appear randomly. It could change the absolute values but not introduce a trend.
Simple. They use a “baseline”, so all that’s needed is that whatever the bogus heating is, not be present during 1951-1980. Since the site has grown a great deal, that’s pretty easy to accept.
So you can “lock in” a hot arctic via a cold baseline interval and then any ‘added heat’ will always show up as a rosy red Canada. Easy really.
Yeah, if you looked at, say, 1998 to now you would not see a warming trend. But who would ever do that?…
ZT (16:03:30) :
Mysteries of modern climatological ‘science’.
1. Mistakes are always found by non-climatologists.
2. Mistakes are found to have been erroneously increasing the temperature.
3. People who find the mistakes are reviled by climatologists.
But don’t forget – the ‘science’ is settled.
ZT, I think you have the basis of The Ten Golden Rules of Climatology. Perhaps others can expand on them.
jorgekafkazar (18:21:13) : Wait a bit. Look at the low-boy, then to the right. Count six drums. What is that above the 6th drum??? Looks like a honkin’ big burner to me. Do my eyes deceive me?
If you look around the picture, there are LOTS of smokestacks. Take that little building just in front of the ‘radar dome’ like structure. That grey thing on this side is a Fuel Tank. Don’t know why a tiny little building like that has a big fuel tank and a tall smoke stack but it does. Then the big shed / garage behind the red dump truck has odd structures on the top. Vents? One looks like a giant version of an outdoor kerosene heater. Maybe it’s the equipment repair shop? Then further on other buildings have smokestacks too. So there are loads of places that could be venting heat.
Its a shame that there is no built in way for Wikipedia errors to be corrected.
🙁
It’s really quite depressing. These records provide the basis for the unprecedented warming and it’s obvious they are not accurate. This is what we are asked to sacrifice billions for? Surely someone is responsible for the errors and surely someone must be held to account. Is there a complaint mechanism that would alert authorities to these gross errors?
E.M. Smith: It is a standard practice in very cold climates to not let your Diesel get cold via not turning it off.
Well, I drive a diesel minivan in cold climate, and I do turn it off. But it’s got a small heater that I can program to start at a given time. It’s basically a small stove, similar to a kerosene stove used when hiking, that pre-heats the engine before you start it. On very cold days (I’ve tried it at at least -30 C) it may need up to 45 minutes before the engine starts without complaining.
(Of course the small “stove”, while using miniscule amounts of diesel compared to a running engine, still heats its environment, it will typically melt a small patch of snow below the car)
Zeke Hausfather (21:44:01) : To me at least the results appear indistinguishable:
That’s because you didn’t do the “homogenize” and “Grid / Box” steps as GIStemp does. So first take your Eureka temps and spread them 1000 km in all directions as ‘fill in’ and “homogenizing” to any stations missing data or that were discontinued after the baseline. THEN take those and spread them another 1200 km into “empty” grid boxes. I make that about 2200 km RADIUS of influence. That’s how GISS does it. And that’s why the GISS graph has a small box for Eureka (the first image up top with a mostly grey arctic Canada) but then the whole thing turns blood red when you smear the data around ala GIStemp.
Look, if you’re going to play ‘climate scientist’ you really must learn all the tricks of the trade. Try reading Hansen’s papers for starters. “The Reference Station Method” and “Optimal Interpolation” would be good search terms to start with. For advanced study, read the GIStemp source code. I know where you can read it on line…
So, go back to your map, and draw a 1200 km radius circle around Eureka. That is the MINIUM area it will directly be used to fabricate the Grid Box anomaly. Now draw a 1000 km radius circle. Any OLD stations in that radius will be homogenized with Eureka (now, we don’t know how many or how much). Then put a 1200 km radius around each of THEM. That’s the ultimate “reach” of the data. Well, maybe not the ultimate ultimate… I did leave out one additional ‘reach’ step… After the 1000 km ‘homogenize’ there is an added 1000 km ‘UHI’ adjust. To the extent it’s ‘backwards’ you could get bogus warming from it. Not that that ever happens. Well, not more than 1/2 the time…. then after the UHI ‘correction’ it goes to the Grid/ Box step. So in theory you could chain this out to 3600 km radius. But I’m sure that rarely happens. After all, you would need to have nearly no other stations nearby, since the code uses the closest stations first. And I’m sure there must be dozens of stations ‘up there’… What, only one you say? Who knew?…
So just remember, this is ‘climate science’. You can’t expect to apply simple mathematics to it and find the warming influence. So your ‘toy world’ experiment was doomed from the beginning.
Anthony
Does CLIMAT reports are made from SYNOP reports or doesn’t?
James Sexton (21:58:31) : someone give me a yes or no!!!! IS that the one that is making the arctic so hot??
Yes.
sky (16:29:46) :
The temperature spikes at Eureka are obviously exhaust from UFOs that visit the station! 🙂
Don’t be silly, everyone knows UFOs use “cold” fusion.
With respect to this:
http://wattsupwiththat.files.wordpress.com/2010/04/ec_eureka_daily_071309.png
There are anomalies not spoken of as well.
Do take note that at the following times there are thermal deviations which ~seem~ outside the norm of what is happening otherwise:
[1] 1000 hrs = 13.0º
[2] 1400 hrs = 11.3º
[3] 1700 hrs = 13.7º
[4] 1900 hrs = 11.2º
[5] 2200 hrs = 19.6º
In the cases mentioned above:
[1] is bracketed by 6.9º and 7.4º = .5º
[2] is bracketed by 8.8º and 9.4º = .6º
[3] is bracketed by 9.5º and 7.2º = 2.3º
[4] is bracketed by 7.2º and 9.5º = 2.3º
[5] is bracketed by 5.9º and 4.1º = 1.8º
I call those into question because it seems rather odd to have such wide deviations in the former (above) when the latter seem to be following a norm trend.
Where I live here in Washington, those differences don’t exist on even the ‘weirdest’ days.
The bracketing temperatures seem more ‘normal’ in the sense that they are closer together, as opposed to the ‘peaky’ temps they bracket.
Before making too many assumptions did you read this: http://www.climate.weatheroffice.gc.ca/climateData/dataQuality_e.html
Isn’t this where someone is supposed to say ‘EUREKA!’?
http://www.sailwx.info/shiptrack/shipposition.phtml?call=25593
Average -30,7438
Total corrected -40,7688
Min -41.1
Max 41.1
Zeke Hausfather (21:44:01) :
Trend 1960-2009 (Degrees C per decade)
GHCN land: 0.20243
GHCN land sans Eureka: 0.20235
REPLY: Actually I did not mention that, Ecotretas did, but let’s not make a too much out of your mistakes. The issue of most interest is not GHCN as a whole, bit the fact the Eureka data gets interpolated into nearby grid boxes. Nice try at diluting the issue though. – A
I don’t think it is to stress too much either. Yet, a few errors in a single station reflects into calculations, “heating” the result at the tens of thousandth in the trend. Now, we know the M error occurs in many stations. We also know that thousands of stations were removed.
But assessing this hypothesis is an entire workload.
My ‘other half’ does a lot of data entry. When she saw the following graph she stated that this is quite obviously a data entry error. That is, someone typed it in wrong.
http://2.bp.blogspot.com/_iCyUsWAeuro/S89rXYT3NoI/AAAAAAAABLs/mx9X6cNFK4E/s1600/env20070101.png
‘jaymam (18:57:27) :
Why aren’t there two or more thermometers at every weather station, separated by say 100 metres? ….’
A man with with one watch knows the time. A man with two watches is never sure.
cheers David
http://www.tutiempo.net/en/Climate/Eureka/07-2009/719170.htm
Working with a lot of data sets produced by a controlled system, containing thousands or tens of thousands of data points around a setpoint, There will always be the chance of another maximum or minimum generated on the next data point measured.
Maxima and minima, in isolation, tell us very little about the system being measured.
Why is station data quality getting seemingly WORSE? This is 2010 for crying out loud…
And speaking of Canada…
It seems journalists and researchers just can’t resist the urge to tag “…and is likely made worse by global warming” onto everything they investigate/publish. Nothing whatsoever to back it up, as we’re all too well aware.
Killer fungus:
http://www.alertnet.org/thenews/newsdesk/N22129903.htm
JimB
…and now researchers, continuing The Narrative – facts notwithstanding, have determined that the deadly fungus originating from Vancouver Island may be helped to spread by global warming:
http://www.alertnet.org/thenews/newsdesk/N22129903.htm
Apparently, this is not a fungi to hang out with.
Hi friends
If I may indulge in an OT.
I need some help. Sometime ago I seem to remember reading something about Nature mag not wanting to publish sceptical papers because the science was settled?
Anyone remember? If so, please point me in the right direction.
thankyou in advance
I haven’t read the above comments, so excuse me if this is a repeat.
Looking at the table Anthony prefaces with this;
[In the image below added by Anthony, note the implausible temperature jump in the Environment Canada data for July 13th, 2009 at 22:00 where it was 5.9C at 21:00, jumping to 19.6C at 22:00, then back down to 4.1C at 23:00.
you will notice the are also smaller but probably significant spikes at 10, 14, 17, and 19 hundred hours. All of these spikes and including Anthonys, are highly associated with a corresponding decline in humidity. I understand the relationship between humidity, temperature, and thermal energy, just an observation I thought was interesting.
maggieblanco (19:32:23) :
Lance . . . did you ever work the DEW Line ?
No, but one of the guys up there with us had done a stint on the DEW. Can’t recall his name though. We were both on courses at the training centers for Environment Canada in Ottawa and Scarbourgh (the last ones before they moved it all to Cornwall Ont.)
looked at some photos and some new buildings there now, but lots of the old stuff, the Upper Air Building and H2 building haven’t moved as with the quaters for sleeping etc., but I would image quite a bit else has changed. The Metar didn’t exist when i was up there, and appears to be away from the main station further down Slider Fjiord(west). It had a better Satillite link from that direction (all experimental back then, but i image its much better now).
The relative humidity is a derived number
If on 13 july the temperature is set to 9.6 insted of 19.6 then the RH is 76 which is more inline. RH of 40 is bone dry.
Check this handy calculator (make sure to select Celsius!!):
http://einstein.atmos.colostate.edu/~mcnoldy/Humidity.html
Has anyone done a 2 axis drive through of Eureka to get a UHI correction yet? Based on what I can see in the last picture, the place seems to have significantly changed since it was originally established by a few guys with pup tents and rifles and an M1A1 Met Kit. Why I’ll bet that by now they even have a water heater set up for their Saturday night showers. And if they have helicopter or Cub Piper delivery of 16mm movies once a week, that would screw the readings too.
What troubles me the most is peoples’ tendency to trust all things in technology, without the consideration that human error frequently renders the data erroneous.
This can so very easily be minimized by the encoding of ‘parameters’ which can produce error messages or ‘flags’ for follow up!
As a person who was fortunate enough to have participated in and supervised the conversion of thousands of spreadsheet financial applications over to computer assisted recording (in the early 80’s)-it became immediately obvious that these parameters needed to be established. Further, I assure you that my team of programmers had no trouble adding the coding necessary to accomplish the task. This is not brain surgery and even if it were-brain surgery is almost routine these days…
Parameters people, paramaters.
Some eureka images: http://www.flickr.com/photos/78042080@N00/332142726/
Weather station/post offfice in spring (not too revealing): http://www.flickr.com/photos/78042080@N00/332142726/
Weather station/post office in summer: http://xpda.com/arctic04/PICT7836.jpg
(taken from: http://xpda.com/arctic04/eureka.htm)
And another: http://xpda.com/arctic04/PICT7627.jpg
(taken from: http://xpda.com/arctic04/eureka.htm)
In Popular Mechanics (http://www.popularmechanics.com/technology/engineering/4213353) is:
“Eureka weather station, population 8. Musk oxen graze near the 60-year-old outpost, staffed year-round by a federal department called Environment Canada. Temperatures here can drop to minus 58 F, so it seems appropriate that building doors are insulated like walk-in freezers.”
“After unloading cargo, the crew unfurls 1200 ft. of floating hose so that fuel can be pumped to the weather station’s tanks. I hop in the brand-new Ford F350 pickup truck just delivered to University of Toronto physicist Pierre Fogal. He manages the neighboring Polar Environment Atmospheric Research Laboratory (PEARL), run by researchers in the Canadian Network for the Detection of Atmospheric Change. To reach the lab, we follow what is perhaps the world’s longest extension cord 9 miles up a dirt road. “To keep the air as clean as possible we get our power from Eureka so we don’t have to run a generator up here,” Fogal says.”
Then: “As part of the International Polar Year, a worldwide research blitz that began on March 1, PEARL will be a critical source of data for scientists trying to understand how the Arctic interacts with the global climate system. “We expect that the initial signs of climate change, which we are probably already seeing, will be visible in the Arctic and Antarctic because they are pristine en-vironments,” Fogal says. In 2005, Ellesmere Island experienced its warmest summer since 1960; numerous landslides rippled across the thawing permafrost. As we return to the ship, Fogal points out several places where the permafrost has melted beneath steep tundra slopes, causing it to slide down in muddy waves. ”
The records for 2005: http://climate.weatheroffice.gc.ca/climateData/monthlydata_e.html?Prov=XX&timeframe=3&StationID=1750&Month=1&Day=1&Year=2005&cmdB1=Go
Perhaps there is some explanation why temps seems to rise in the evening (while the sun is still up) during some months?
Something else odd in the Eureka records. The first two hours of each day is missing. The middle of the night. Looks like nobody’s assigned to do this at midnight and 1 AM.
Is this a climate station? It has some of the cold data missing.
I vote for EUREKAGATE! I would only add — “temperature data quality is not fit for ANY purpose” — except lying.
“Tenuc (00:53:31) :
Pamela Gray (19:26:34)
“I can’t think of a [ ]-gate term that is clever. We seem to be out of clever [ ]-gate terminology. And that speaks volumes.”
Easy – Eurekagate. The day the World realised that temperature data quality is not fit for purpose, as anomalies are within the error-bars of normal (whatever that may mean)!”
For anyone interested in seeing the GHCN data for Eureka; I’ve made a set of graphs. There are temperatures (by month), monthly anomalies, and the running total of the monthly anomalies (that ought to be the most accurate picture of change over time).
http://chiefio.wordpress.com/2010/04/23/eureka-canada-graphs/
You can easily pick out a ‘time of troubles’ or two in the data as things were very volatile or dropped. There is also a clear pattern of the “warming” being in Sept-Dec and the other months being more nearly flat (or in some cases falling…)
Lets see, what happens in Sept-Dec…. Oh yeah, winter comes and the “new guy” needs to learn to put an M in the report for “Minus”… and runs the heaters a lot since the fuel bunker is full and he feels cold…
Is there a reason why the July monthly min temps don’t match the dailies?
What makes reports like this one so tiresome is that no one is listening and the political/economic train wreck just keeps piling up.
If I can get some help from the cognoscente on this list, I’ll draft another petition to EPA to demand a review of the data. I would need help documenting how the known errors in the temperature records, which would allow the petition to argue that these errors have corrupted the temperature record to such a degree that it cannot withstand the required data quality review necessary upon which to ground a regulation under U.S. laws.
Contact me off-line at dwschnare@gmail.com
The fact that there are so many nefarious entries in the temperature record that is used to support AGW is, at best bad, science; the refusal by the relevant authorities to investigate, acknowledge and correct the faulty data is criminal
Climate scientist sues newspaper for ‘poisoning’ global warming debate
Climate modeller Andrew Weaver launches libel action in Canada for publishing ‘grossly irresponsible falsehoods’
http://www.guardian.co.uk/environment/2010/apr/22/climate-change-libel-action-canada-national-post
McConchie Law Corporation, acting for Weaver, said that the National Post articles had “gone viral on the internet” and were reproduced on dozens of other websites, including prominent climate-sceptic sites Climate Audit and Watts Up With That.
The modeling science the AGW criminal cabal likes to use are centered around “anomalies”. If these shysters are asking us to believe they are unable to catch these very obvious data entry anomalies in the front end of their data then they can kiss my foot!
Here’s the next thing the scaremongers will want us to panic about:
http://www.alertnet.org/thenews/newsdesk/N22129903.htm
KPO (03:21:11) : Does that mean I should advise my tour group to unpack the beach towels, sunblock and scuba gear?
No. Sunblock is useful for nose sunburns when skiing. Beach Towels are great to wrap up in after you get the snow rinsed off in the shower. And I once used a wet suit to survive being stuck in a blizzard all night. Handy, that. (Though when I DID get to the ‘town’ the folks in the coffee shop looked at me a bit oddly 😉 Not every day a guy walk in wearing a full wet suit and parka…
FWIW, this:
http://upload.wikimedia.org/wikipedia/commons/8/8f/Astro-Lab_%2804-08-97.jpg
is claimed to be the: Astro-Lab (Arctic Stratospheric Ozon Observatory) near Eureka Weather Station (Nunavut, Canada)
here:
http://en.wikipedia.org/wiki/File:Astro-Lab_(04-08-97.jpg
Yes, it says “near” the weather station… but… it has an anemometer on a mast on the roof… rather like the one seen on automated reporting stations in the Antarctic… Wonder what else is built on the roof so as not to be knocked down by a snow plough… This “new architecture” looks to be a box with stuff on the top. Not much on the ground… one hopes they didn’t put the thermometer on the roof.
I’m with Ed for the location:
Ed Caryl (16:18:20) :
Where is the thermometer? Look just to the left of the “low-boy” trailer. That white block looks like an intrument shelter. I think the building just to the left of the radome is the generator building.
Especially since the lo-boy has an attachment to be towed with a forklift. I’m willing to be with the placement of the lo-boy that the gauge is affected by the occasional placement of something with hot exhaust.
My best guess anyway.
Are the decades of METAR records available somewhere? The calculus of correcting this enormous data set would need another surfacestations volunteer army to do. Are the errors all on the warming side?
This sounds like an interesting community project — a bit like the surface station project. Volunteers could select specific stations and examine that station for METAR errors. Anthony, maybe you could setup a structure for this(?) The emphasis should be on the most northerly stations, I suspect.
It seems to me that the goal should be to characterize the frequency and magnitude of these errors in order to assess the impact on the temperature record.
Also, if you could show that the METAR error in Finland falsifies the NOAA claim that March was the warmest month ever, then I think that would be news worthy.
See what happens when just anybody can look at the data? Nothin’ but trubble… 🙂
“Faking versus adjusting” – why it is wise to sometimes hide “original” data by Reinhard Böhm (http://klimazwiebel.blogspot.com/2010/01/guest-contribution-from-reinhard-bohm.html)
These seem like obvious glitches and not representative of real temperatures.
I sure hope this is being brought to the attention of the people responsible for this data!
I offer one suggestion for determining the source of these errors; keep an hourly record of the fluid level in that bottle of Canadian Club they keep in the closet.
So what’s the truth then.
Even Anthony has stated he thinks the globe has warmed, yet stuff like this makes me question we can trust the data to come to that conclusion?
This Mgate-eurekagate problem could be very significant.
Has anyone challenged Gavin yet?
Sean Peake (07:15:14) :
Some eureka images: http://www.flickr.com/photos/78042080@N00/332142726/
Weather station/post offfice in spring (not too revealing): http://www.flickr.com/photos/78042080@N00/332142726/
______________________________________________________________________________
…not too revealing?? Actually the photo reveals an orange extension cord probably used to plug into the block heater of a vehicle. This means vehicles are parked in front of the P.O. I wish I could see exactly where they are taking the temp measurements.
Also thanks to the article you found the timing of personnel rotation can be left in as a possible reason for the weird temperature reading on July 13th. Supplies and personnel would probably be dropped off some time around the first couple of weeks in July.
“…Canadian coast guard’s six icebreakers, which spend the winter maintaining navigation channels in the St. Lawrence River and waters of the Atlantic provinces, head north in late June to activate navigation beacons for the Arctic shipping season. The ships remain there until freeze-up in late October, carrying out search-and-rescue operations, escorting icebound vessels, cleaning up oil and diesel spills and participating in scientific research….”
Thanks for the additional information.
____________________________________________________________________________
Barbee (07:14:13) :
What troubles me the most is peoples’ tendency to trust all things in technology, without the consideration that human error frequently renders the data erroneous…..
_____________________________________________________________________________
I certainly agree with you. A study on hospital testing revealed the old 80-20 rule applies. 20% of the tests was found to be incorrect. (sorry I do not have the links as the tests were done over 15 years ago) Nothing I have seen in my career as an industrial chemist has made me believe data is always correct. That is why good lab managers always check the data from their technicians.
E.M.Smith (03:24:52)
Perhaps they are burning ‘Jet A’ kerosene (a.k.a. JP8) which has a cloud point of circa -50F. ‘Jet A’ fuel is specifically designed for this type of environment and would minimize the chances of diesel fuel filter clogging etc.
They’re saying that the 14th of July was unusually warm? With 12kts of NORTHERLY wind blowing????
Give me a break!
I think R Spencer needs to clear this is up. Is the current UHA temp data based mainly on one extreme hot spot over Canada?
http://discover.itsc.uah.edu/amsutemps/execute.csh?amsutemps
because the rest of the world is not showing any warming at all!
See COLA. analysis of current conditions etc… climate
899 (04:42:16) : I agree with your findings and comments. I’ve just finished looking at numerous July records over the years from 1948 to 2009. Large rises and falls in temperature are recorded over a matter of a few hours. This is particulaly prevelant in the post-1970 years, although I also noted many occassions prior to 1970 when highs of 18degC and over are recorded.
Anthony: Is it possible for temperatures in the Arctic to rise and fall by +/- 5degC and more over a period of one or two hours in effectively static atmospheric conditions?
REPLY: The only naturally occurring thing that would do that (that I can think of) would be a katabatic or downslope foehn/chinook type wind
http://en.wikipedia.org/wiki/Foehn_wind
http://en.wikipedia.org/wiki/Chinook_wind
But looking at the other meteorological data in the hours before and after there doesn’t appear to be evidence for it. – Anthony
AnonyMoose (07:15:49) :
Something else odd in the Eureka records. The first two hours of each day is missing. The middle of the night. Looks like nobody’s assigned to do this at midnight and 1 AM.
Is this a climate station? It has some of the cold data missing.
________________________________________________________________________________
It would be interesting to find out if only 22 hrs worth of data was the norm through the entire data record or if it is a “new” habit.
E. M. Smith states at his blog
“The bulk of the ‘rise’ of the dT line comes after the 1990 changes of process, prior to that it’s a flat series with some volatility. All I see in this graph is some crappy data artifacts and some recent warming via process changes.”
Chiefio, do you have the hourly data? can you tell if they actually drop 2 hrs worth of data each day and when it began?
As you said: ” What has been found seems to point to a corrupted dataset there”….
The whole system is obviously corrupted and it would deserve not to pay it attention anymore, however your diligent and very patient work makes a great service to science and truth, though their lies, widely publicized by msm, and specially directed to simple working people, fulfill their political objectives.
Hans Erren (06:57:20) :
The relative humidity is a derived number
If on 13 july the temperature is set to 9.6 insted of 19.6 then the RH is 76 which is more inline. RH of 40 is bone dry.
Check this handy calculator (make sure to select Celsius!!):
http://einstein.atmos.colostate.edu/~mcnoldy/Humidity.html
Opps, didn’t notice the “Rel”
data stops at 2008
http://arctic.atmos.uiuc.edu/cryosphere/IMAGES/seasonal.extent.1900-2007.jpg
ZT (16:03:30) :
Mysteries of modern climatological ‘science’.
1. Mistakes are always found by non-climatologists.
2. Mistakes are found to have been erroneously increasing the temperature.
3. People who find the mistakes are reviled by climatologists.
But don’t forget – the ‘science’ is settled
=============================================
Great !!!!!!!!!!!
@ davidmhoffer, I disagree with the criticism of your 22:10 post. As a Canadian-American I immediately understood your point. My American half still thinks 19.6 degrees is bloody cold whilst the Canadian is still amused. Brilliant!
@ Dr A Burns (18:00:06) : “A chinook perhaps ?”
Speaking only from personal experience, I have never experienced a Chinook that lasted 2 hours or less. I also have never experienced a Chinook in the summer. Having lived in southern and northern Alberta, my understanding of the Chinook wind is that is occurs because of air flow over the mountains from the Pacific. I am not sure Chinooks occur further north than Alberta/BC.
The best view of the Eureka station I’ve found (see Friday August 22). There are other nice shots of the far north, too:
http://www.zeco.com/upload/rep_ptb_2008-09-16_133549/GREL0801-log.pdf
Could this be the weather station? Look behind the red pickup on the right side of the picture. Hard to tell.
http://www.jproc.ca/rrp/alert_eureka_satdish.jpg
A case of nerd humor?
In one of the Intel commercials, a scientist changes a minus to a plus sign in a complicated formula written on the glass. Not exactly a knee-slapper, but, maybe that’s Canadian nerd humor, eh? (Snort)
Based on Anthony’s exposure of so many common errors in METAR (and no doubt other reporting codes) I think there are questions to be asked. Since I believe the best quality control starts early, I would ask (wherever the site):
1. What kind of training/experience are the “weather observers” and “weather equipment maintenance” folks required to have?
2. After being trained is there any apprenticeship that must be served under watchful eyes to be certified? Are there ‘national’ standards to meet?
3. Is management “technical” enough to understand and control this process?
4. Who does the certification?
5. How often is recertification required?
6. Is there any sort of ‘real time’ QC. If not, why not? If so, is it adequate?
7. What is the paper trail? Are “error logs” maintained? Are checklists used?
8. Are error summaries periodically posted at all sites under the blanket of higher management to foster competition, and are there awards for error free performance?
8. Does/can management deal with and correct error prone individuals?
9. Is training supplemented with periodic/updated refresher courses? Is this mandatory?
10. Where (at what level) IS the problem?
Basically, WHO is in charge and WHO is taking names and correcting the problems?
Ulric Lyons (06:03:42) :
http://www.tutiempo.net/en/Climate/Eureka/07-2009/719170.htm
Well spotted.
@ Sean Peake (07:15:14) :
Let’s play “Eureka! Who can find the anomaly?”
I’ll start. July 2, 2005.
Here, how IPCC makes its report:
http://news.yahoo.com/s/ap/20100423/ap_on_he_me/us_med_psychedelic_therapy
REPLY: The only naturally occurring thing that would do that (that I can think of) would be a katabatic or downslope foehn/chinook type wind
http://en.wikipedia.org/wiki/Foehn_wind
http://en.wikipedia.org/wiki/Chinook_wind
But looking at the other meteorological data in the hours before and after there doesn’t appear to be evidence for it. – Anthony
IMHO I don’t think the terrain at Eureka can create katabatic or chinook winds ( experienced a mild former in Nachvak Fjord in Labrador, the latter outside of Banff, Alberta). Just a thought (no laughter, please): Could the spikes in temperature be the result of the low-lying Sun reflecting off the windows of the station and on to the Stevenson screens?
REPLY: I don’t think they use a Stevenson Screen there, but some sort of electronic sensor. That said, your theory is as plausible as any other. – A
Talk about screwed up data! What’s it gonna take!
I just translated a piece from German to English –
RUSSIAN SCIENTIST SAYS TO EXPECT COOLING!
…mentions US measuring stations…pols on wrong horse…
(You can click on my URL)
Is the thingy in the foreground of this photo an mmts?
http://acebox.uwaterloo.ca/eureka/Eureka2005/Mar_1/photos/photo15.htm
Or is it the lone Stevenson screen looking thing in the upper RH corner area, all by itself in this picture.
http://csailor.50webs.net/eureka/pic/eureka/pic112.html
At least this is the source of the anomalous heating!
http://csailor.50webs.net/eureka/pic/eureka/pic105.html
REPLY: Photo 15 is an interferometer. pic112 is at the military base nearby, not the weather station base. See http://csailor.50webs.net/eureka/pic/eureka/pic28.html -A
Kevin G (09:40:59) :
Let’s play “Eureka! Who can find the anomaly?”
I’ll start. July 2, 2005.
Oh, Oh, my turn, my turn… umm, let’s do one at random… July 15 2007: daily says Max 12.7, Min. 4.5, hourly says Max. 10.0 (16:00h), Min. 6.2 (18:00h)… brrrr, cooled off in a hurry, but just wait for an hour and it’ll go up 3+ degrees. (This is too easy… I must be doing something wrong!)
OK, your turn
We are a new Calgary climate skeptics group that keeps track of Canadian data fudging:
http://friendsofginandtonic.org/
REPLY: No, your are not skeptics. Why do you have to lie right off the bat? Another Hoggan DeSmogblog clone, and not even a good parody. -Anthony
HR (17:00:14) … What the heck is MS/MV Curtiss doing at 88,5 N in late April???
She was built in 1969…Another Manhattan Project??? (Icebreaking tanker Manhattan GWS…) But if that shiptracking site is good, we can track what all
the icebreakers are doing in the summer in the Arctic…Yamal BTW is just N of
Norway (?)
Having been the quality systems registrar for a half dozen federal agencies, I was not at all surprised by these findings.
Environment Canada has substantially dismantled their surface station system over the past decade which means fewer data points, more anomalous impact. Compound apparent data quality issues and further corrupt the record….
Unfortunately, root cause analysis and effective, verifiable corrective action will only commence once “top management” identifies a negative trend that affects the bottom line.
Although Canadian citizens are technically MSC’s paying customers, and this post triggered a “customer complaint”, I don’t expect to be in receipt of a non-conformance report any time soon.
Anthony, here’s what’s Wikipedia says now:
“I re-inserted the deleted statement. The claim is readily verifiable by Environment Canada and the actual METAR obs show a high of 20.9C. The website expressing concerns about its strongly opposed to climate science and thus cannot be used as a source of controversy without violating Wikipedia’s overarching goals at achieving a neutral point of view in its articles. The claim itself does not strike me as “obviously wrong”; the station in question is adjacent to the Arctic Ocean. Small changes in wind direction can lead to large temperature changes in the summer. A quick glance at some other days shows that the temperatures frequently oscillate with even minute changes in wind direction. There is no evidence of any temperature sensor malfunction. 72.240.53.216 (talk) 15:58, 23 April 2010 (UTC)”
This thread just keeps getting better!
You could always call the Environment Canada hotline @ $2.99 per minute and ask what’s up!
A lesson on trying to extract very simple information from Canadian government agencies — here’s a representative example of how it can go:
Weeks ago, I wrote:
“ALPI (Aleutian Low Pressure Index) data/info was formerly located here:
http://www.pac.dfo-mpo.gc.ca/sci/sa-mfpd/downloads/indices/alpi.txt
Please indicate where it has moved.”
From the response:
“Thank you for your email […] requesting information […] Unfortunately, since our service only offers basic information […] we cannot provide the information you requested. We have, however, forwarded your request to a representative who will assist you further.”
So I waited patiently for weeks and wrote back:
“I’m still waiting for the link to the new webpage.”
From the response:
“Thank you for your email […] requesting information […] Unfortunately, since our service only offers basic information […] we cannot provide the information you requested. We have, however re-forwarded your request to a representative who will assist you further.”
Charming. Very helpful. Note that they took the trouble of adding “re-” (“re-forwarded”).
mpaul (09:12:23) :
Could this be the weather station? Look behind the red pickup on the right side of the picture. Hard to tell.
When i was up there in 79-80, DND was doing some experiements with Satelite communications(note the almost horizontal angle of the dishes). This location I believe is to the east of Eureka where they were doing the communications links to Alert. At that time no temp censors were there.
Tim Clark (09:47:16) :
Or is it the lone Stevenson screen looking thing in the upper RH corner area, all by itself in this picture.
Picture didn’t load for me sorry, but the alchol/mercury thermometers were next to the Radom building. it was away from most builds on a slight rise from the rest of the roads (3 white objects in some pictures i’ve see).
Perhaps someone who as been there more recently can update us.
I did talk to a former co-worker from Env Canada about a year ago and they (Env Canada) still do the hourlys (but perhaps they have shut down those early hour obs now).
Gentleman, I will send an e-mail to my former co-worker, who still works for Environment Canada, he may be able to shed some light on that temperture sensor is located.
Might be a few days before i get an answer, but i can post here or on tips sections.
lance
Just for fun, I had a look at the month of July and compared what appears to be the two stretches of “warm days” ( July 13-15 and July 20-22) to the daily records.
As you pointed out Anthony, there are questions with July 13th and 14th. Additionally the monthly record indicates the high on July 15th as 15.7. The daily record shows a high temperature on the 15th of 14.2 at 700hrs. 000hrs and 100hrs are missing.
I encountered discrepancy July 20-22 as well when the monthly record indicates high temperatures of 16.4, 15, and 17.1 respectively, the daily records are as follows: July 20th 16.1 at 1500hrs, 21st 13.5 at 2300hrs, and 22nd 16.6 at 1500hrs.
Data from 000hrs and 100hrs is missing from all of these dates.
Re: intrepid_wanders (20:00:09)
I am sorry, but “M-gate” does not appear to be popular enough. Perhaps because an M-gate could lead to an M-path. I feel your pain.
Tim Clark (09:47:16):
The weather station is visible to the left of balloon man at: http://xpda.com/arctic04/PICT7627.jpg
Cross-reference with image here taken on top of the hill behind/right of balloon man (on page for Aug 22, top): http://www.zeco.com/upload/rep_ptb_2008-09-16_133549/GREL0801-log.pdf
http://friendsofginandtonic.org/ is so lame it hurts.
This is a great thread and this site is MOST addicting!
As for another “gate”: What about “Sign-Gate”?
Thanks Anthony and the other big names…I’ve learned a ton and have come to respect you all a great deal over the last 6 mo. I’m currently working my way through the infamous Unit Root thread over on Bart’s blog– most facinating and the details are definitely way over my head but not the basic idea.
How about negate?
James
Anthony, just an update for your update.
Appears someone at Wikipedia reinserted the statement, claiming verification from EC and using the METAR data. They then go on to do a little bashing of your website and claim they need to remain neutral!
REPLY: yes I saw that, quite humorous. -A
Wait a minute! Isn’t this how “smoothing” works?
Please tell me that massive inconsistencies such as this are identified and smoothed out of the data.
Isn’t this a process that Dr Hansen has openly admitted is a crucial aspect of data presentation?
Surely then the GISS map is showing us the data “post smoothing”, in which case the anomolous temp reading is meaningless.
If the data has been smoothed, then these odd readings should not in themselves constitute a problem.
Anthony, let me set the record straight!
I am the station manager of Eureka and was on site when we broke a new all time high on July 14, 2009 of 20.9°C and have the picture to prove it! The reason there was such a big fluctuation in temerature from the METARS before and after the record breaking temperature was all due the direction of the wind. If you look at the location of the weather station (and where the stevenson screens are), it is located about 300 metres inland from the north shore of Slidre Fjord. Normally our winds are from the East, South or West which cools off the air as it passes over the cold waters of the fjord. However, when the wind switches from the north the temperature will be representative of the inland over the Fosheim Pennisula. Inland temperatures can be 10 – 15°C warmer during the summer months than along the shoreline where we are situated.
There was no malfunction of equipment nor data entry errors. It is all due to local effects and whether the wind blows from the north (inland) or not.
Having said that, I have personally seen the effects of global warming at Eureka over the past 12 years as each summer we break a new record maxium high and we see more and more mudslides on the tundra as the permafrost melts even lower and can no long support the clay and dirt above it.
If you or anyone else wants to see my picture of our RTI showing 20.9°C please e-mail me at EurekaWxStn@ec.gc.ca
I have many more pictures of Eureka I am willing to share.
Rai LeCotey – Eureka Station Manager
REPLY: Thanks, what about the day before, with 19.6? I’ll drop you a note for the pix.
That’s hilarious. That’s like saying that surfacestations.org is strongly opposed to thermometers.
Buried in the recently released NASA emails, there is a forwarded email from Phil Jones of UEA/CRU referring to Environment Canada and the good homogeneity work that EC has been doing. The email can be found in the large part 4 of the NASA emails at page 59 or the 618 page Adobe pdf. It is dated 15/8/2007 at 10:12:05 The relevant part of the forwarded email is:-
So it seems to me very likely that Environment Canada is involved with NASA and UEA/CRU in adjustments and manipulation of real temperature data in Canadian stations used in NASA and CRU global compilations. Assuming that the temperature data freely available online in Environment Canada’s website is actually the real temperature readings, it should be simple to compare the EC data for specfic Canadian stations that are used by NASA for the same day and month to see how similar or different the data is.
It would be good if as many independent comparisons could be made by different people for various Canadain stations and dates/periods and the results posted here in WUWT.
Or during the past 12 years have you been breaking new records of wind direction? How are the wind flow studies doing?
Gail Combs (08:46:34) :
Chiefio, do you have the hourly data? can you tell if they actually drop 2 hrs worth of data each day and when it began?
Look here.
The mean temp for the 14th was 11,46 ºC based on hourly temps, standard deviation 1,66 ºC. Mean plus five s.d. is 19,8 ºC, plus six s.d. is 21,4 ºC. Not impossible, but…
Rai LeCotey (Eureka Station Manager) (14:13:51) :
I am the station manager of Eureka and was on site when we broke a new all time high on July 14, 2009 of 20.9°C and have the picture to prove it!
It good to have someone who was there! I also make lots of photos myself.
I would like to ask, to a first-hand witness them, what happens so that the max temp is 6 degs above the highest hourly record. I’m sure this has to be simple, but I can’t figure it out by myself.
RHS (08:06:32) : Especially since the lo-boy has an attachment to be towed with a forklift. I’m willing to be with the placement of the lo-boy that the gauge is affected by the occasional placement of something with hot exhaust.
So, is that a white pole with graduation on it between the low boy and the white box? Maybe a snow depth pole? Oh, for just a bit more resolution…
Also, as a quasi-military base, what’s the odds that there is a regularly scheduled ‘perimeter check’ that has someone drive around checking that everything is stowed where it belongs? It would explain the 10 to 10 schedule and the low measures at lunchtime and dinner (18:00)
So folks start working at, oh, 8 AM. First ‘patrol’ is 10:00. Long lunch. After lunch run at 2 pm. Check just before dinner at 5pm (17;00) then a nice dinner “hour” from 5 pm to 6:30 or so, post dinner check at 19:00 (7 pm) and then a gap until the “bed check” at 10pm (22:00) where the “warmth source” lingers a bit longer than usual so you get a larger “anomaly” rise. Not that folks on the ‘graveyard’ shift tend to go a bit more leisurely than most… (Did I ever mention that I LOVE to work ‘graveyard’ due to the peaceful nature and “calm” pace … )
So all it takes is that the measurement station be “near” or “downwind” from that convenient place to park the ( truck | forklift | staff car ) while sucking on that thermos of chocolate and meeting your ‘appointed rounds’…
I do find that periodicity in the record highly suspicious. I’ve made enough schedules to recognize those times as ‘frequently chosen’ times for checkin / checkup times. The old Dr. Pepper jingle was “10, 2 and 4”. Not that much different from “10, 2, and 5”. The ‘bracket dinner’ at a shift change is also common. If you have an 8 am to Midnight coverage split at 4 pm (one shift 8 am to 5 pm, the next at 3 pm to Midnight (or 4 pm to 1 am) you get the ‘last run’ of the morning guys just before dinner and the ‘first run’ of the evening shift just after dinner. Then all it takes is a ‘bed check’ symmetrically scheduled with the first morning check at 10 am / 10 pm.
So I’d put my money on the temperature station being near a convenient place to park a security truck while filling out a log book and sucking on a cup of java…
Gail Combs (08:46:34) : Chiefio, do you have the hourly data? can you tell if they actually drop 2 hrs worth of data each day and when it began?
No, I don’t. The hourly data for many countries are not available, so I’ve not dug into them. Canada does make hourly data available (I THINK!) though I don’t know if they charge (many places do charge) but I’ve focused on the bigger annual / monthly views. Maybe that needs a re-visit… Anthony is more in touch with the daily sources than I am. Being a Met guy and all means watching the daily pattern for a few weeks a frequent behaviour for weathermen, not so much for computer geeks…
I forwarded this post to Env. Canada’s contact point. See their response here:
http://fnieuwenhuis.xanga.com/725951059/eureka-data-issues/
The Sun was maybe 15 degrees above the horizon at 10 PM, so maybe the Sun came out from an otherwise overcast day to cause the warm reading?
Tim Clark (09:47:16) : At least this is the source of the anomalous heating!
http://csailor.50webs.net/eureka/pic/eureka/pic105.html
What A Hoot!
Lets see, a bunch of young guys stuck as far away from anywhere as you can get and bored beyond belief… what to do what to do..
I know, lets burn all the cardboard and shipping pallets trash on the beach and alternate between jumping into 0 C Ocean and “chestnuts roasting on an open fire” 😉
Just the thing to tell folks back home and just the thing to embarrass the newbies with. “WE all went swimming in the Arctic Ocean. Are YOU the wimp in this crop?”
FWIW, I’ve been in ‘frozen cold’ swimming three times. Once for a couple of hours in the ocean at about 40 F water temp with a wet suit. Once without the wet suit for a couple of hours but with frequent runs to the blanket (though eventually got quite hypothermic… took me about 8 hours to get ‘warm’ again.) And once when the water was about 32 F / 0 C in a mountain stream of snowmelt. I can ‘relate’ to the guys in the image. The “plunge” part is a bother, but as long as you don’t put your head underwater too long it’s not so bad for the first 20 minutes or so. (At least if you are a bit pudgy 😉
Ben Kellett (13:52:52) : Wait a minute! Isn’t this how “smoothing” works? Please tell me that massive inconsistencies such as this are identified and smoothed out of the data. Isn’t this a process that Dr Hansen has openly admitted is a crucial aspect of data presentation?
I’ve been through all the GIStemp code and while there is talk of “homogenizing” I’ve not seen “smoothing” as a topic.
Surely then the GISS map is showing us the data “post smoothing”, in which case the anomolous temp reading is meaningless. If the data has been smoothed, then these odd readings should not in themselves constitute a problem.
Unfortunately, the GIStemp process is more about extending the reach of data than about ‘smoothing’ errors out. The initial steps “warm” the data by about 0.6 C ( I ran a benchmark on it through the ‘homogenize’ step). Also, as other stations were dropped from the record, the surviving stations, such as Eureka, gain ever more importance and influence. They are the SOURCE of the data that are ‘homogenized’ in to the now missing areas. So if anything this “smoothing” is better described as “spreading”.
Finally, since the “monthly mean” is what is handed to GIStemp, the impact of anomalous daily data are already ‘baked in the cake’ of the monthlies long before GIStemp ever sees it. This means that the monthly data will already be ‘lifted’ and that the ‘lift’ will be spread far and wide as the smoothing / spreading “spreads the wealth” to all those grey areas that have no data.
But yes, I’d agree with you (and it would seem, Hansen) that this “smoothing” spreading is an essential part of the “Global Warming” process. Without it we would find that it’s still cold everywhere else…
So… read the station manager’s explanation (thankyou sir BTW for sending that) but now I have MORE questions.
1. That great big stripe in the GISS map is mostly over land. But the station manager says the temperature is governed most often by the prevailing wind coming off the sea?
2. Inland, (where the big GISS stripe is) the temps in summer are 10 to 15 degrees higher than the station…. so the areas temps in GISS are being UNDER reported?
3. When the prevailing wind changes direction, the station gets a big temp hike. Can understand that. But doesn’t that mean that cold air is coming onto land from the other side, so the temps are falling over most of the area when the weather station temps are rising?
This was actually easier to understand when I thought the numbers were just wrong. Now I think the numbers are right, the area they represent is just wrong. What kinda gate is that? Finaly-found-some-proper-data-but-its-for-the-ocean-next-door-gate is a bit long. It’s? Its? It is? Can we have an its-gate too?
Here’s a quote from Anthony Standen’s Science Is a Sacred Cow (1950):
The Eureka METAR report (Weather UnderGround) shown by Anthony for 140200Z (9PM) shows a temperature of 20C, but if it had been measured at 20.9C then some unusual rounding scheme must have been used. Of course it is possible it was still warming at observation time. There seems to be only a 10 degree shift in the wind from the previous hour with a speed increase of only 1 knot. An hour later the wind had reverted to its 01Z direction and lost that 1 knot.
Indeed, the daily summary sheet does show a max-temp of 20.9 so where did that come from? METAR stations do not, repeat DO NOT, report max or min temperatures in their observations, nor would a rise of .9C or the slight wind shift require a SPECI report.
I must be missing something.
Rai LeCotey, thanks for writing in. The Eureka station data uniquely influences a vast amount of the GISS temperature record (perhaps more than any other station on the planet). Does this mean that the entire arctic temperature anomaly is really measuring nothing more than shifts in the wind pattern on a tiny peninsula? That’s staggering.
If one were to remove individual records when the wind was blowing from the north, how would that change the anomalies? That sounds like one ‘adjustment’ that would actually make sense.
Grumbler (06:00:17) : “A man with with one watch knows the time. A man with two watches is never sure.”
I have around seven clocks that I rely on. Some use electronic chips to tell the time, others are actual computers, another is directly controlled by the mains frequency. I keep them in step using a time signal from a satellite. I provide video evidence and photos with timestamps to the police as evidence of crimes, therefore I need the times to be reasonably correct.
If only weather station thermometers were calibrated every day.
Unfortunately, our ‘official’ temperature recording site has not moved for over 50 years and thus is greatly influenced by the cold Arctic water from Slidre Fjord when the winds are from the East, South or West during the summer months.
This has probably given a big misrepresentation of how warm the Arctic is actually getting.
I would not be surprised to see temperatures up to the mid twenties or even near 30°C far inland where there are no winds. The Arctic is heating up! Wildlife come to the shoreline to cool off, Muskoxen are taking dips in the Fjord, permafrost is melting down in some areas to 10-12 ft, there is more and more open water over the Arctic ocean every year and the Ayles Ice Shelf has broken away.
How much more does one need to see before you believe the Arctic is dramatically warming up.
We’ve had a warmer than usual winter this year with a number of daily maxiums broke and I would expect another record breaking summer.
Hot in Eureka Rai
I think it is real, there were a lot of other things going on that the METARs reveal. In the days before there was quite a bit of rain in the area, and the day of (and hours preceeding) there were reports of Towering Cumulus and AltoCumulus Castellanus. Both of those cloud types say the atmosphere is unstable and usually you should be on the lookout for showers and virga (showers that evaporate before reaching the surface, also reported in the days prior). In the hours prior, there were TCUs over the mountains to the west (it looks like this place is in a valley). What it looks like to me is they got an outflow, because with that observation and after it, there are no more records of unstable cloud types through the 16th. An outflow coming down the mountainside like that would cause the air to warm rapidly. There would also be added moisture from the TCU that collapsed, and potentially from any snow that was melted on the way down. These are called Chinooks which someone referenced earlier. It looks to me like this one had a little bit of a different trigger.
Rod Smith: Many metars will carry the max and min temps for the previos 6 hours and for the previous 24 on the 6 hourly and midnight UTC observations. This station doesnt, but it wouldnt surprise me if they fill out a daily form to record absolute max and min temps, precip totals, and max wind speeds like a large number of reporting stations do. So while it wouldnt show up in the metar data, it would be on record.
One other thing I forgot…
While the main wind speed shows northerly (010), the remarks on the observations on each side of the one with 20C state the winds at the camp are still from the West (290), the direction of the mountains. The nrly winds seem to occur at the same time each day which leads me to think it is a local effect caused by the valley.
Neel: I stand corrected on min/max temperature reporting. Thank you.
I guess these things changed out from under me. The last decoders I wrote (a long time ago) didn’t need that, but I seldom look at METARS any more and I guess I’m out of date. I see it in US METAR information.
But looking at WMO docs on FM-15 Code, I don’s see it. It seems likely it is a regional variation.
I would be cautious about conflating the summer month anomalies and temperature excursions with the clearly erroneously entered data during the colder months when temperatures below 0°C are more prevalent and the missing “M” can create a major distortion in the daily mean, and subsequently the monthly mean. And such errors are always in the direction of higher temperatures.
The problem is not with the METARS, it’s the ETARS that really matter.
The calculations don’t lie, but the liars calculate.
Rai LeCotey (Eureka Station Manager) (18:04:04) :
How much more does one need to see before you believe the Arctic is dramatically warming up.
Rai, with all respect, I will be happy enough with a temperature record. I don’t want to believe, I want to know. (And again thanks for being here.)
Some interesting videos around Eureka:
http://www.youtube.com/watch?v=ZDkRT1EjFBo
http://www.youtube.com/watch?v=WFCnGmfe80Y
Ecotretas
Rai LeCotey (Eureka Station Manager)
Thank you, Rai, for your helpful comments. Many (perhaps most) people who follow this site accept that there has been warming in the Arctic and don’t doubt your account whatsoever. I can’t speak for others, but I find your firsthand knowledge invaluable and I hope you’ll continue to help us.
In that spirit, I would be interested in your views on how the Eureka Station records should be used. Should the temperature spikes be smoothed out? Is it appropriate to extrapolate other grid temperatures from your data?
It’s your choice to smooth out the temperature anomilies… however, in my opinion, the temperatures that are being reported from Eureka are not representative of what is aqctually happening especially inland during the summer due to the proximity of our instrument compound to the shoreline of Slidre Fjord. Just 1 km inland, the temperature can be 10-15°C warmer on a warm, sunny, calm day in the summer.
I know from first-hand experience how hot it can get on the tundra, having made a 5-day portage from the Thelon River to the Back in 1985 and 2-day carry from the Hanbury River to the Baillie in 1992. The barrens get quite warm, some days were in the low to mid 30s in July but I attribute that to the sun being up for 20 hours and a lack of wind (which allows the bugs to reach Biblical proportions). Too many times we had to cover our tents with sleeping bags to get out of the heat and wait until 10 or 11 before making dinner because it was too hot.
I imagine that inland from Eureka the terrain radiates heat much faster because there is much more exposed gravels and rock unlike near the Arctic Circle in the Nunavut interior, which has more vegetation and soils to absorb and radiate heat more slowly. I have to wonder if Arctic wind pattern changes over the past few years (a topic of conversation here and likely accounts for the sudden drop in sea ice in 2007) have caused more frequent offshore winds at Eureka and could explain the increasing temperatures that Rai LeCotey (and thank-you for posting here, Sir) has observed of late?
FYI–the wikipedia page reinserted the statement because of the Envirionment Canada data and because a blog is not a reputable source.
Rai LeCotey (Eureka Station Manager) (10:36:00) :
It’s your choice to smooth out the temperature anomilies… however, in my opinion, the temperatures that are being reported from Eureka are not representative of what is aqctually happening especially inland during the summer due to the proximity of our instrument compound to the shoreline of Slidre Fjord. Just 1 km inland, the temperature can be 10-15°C warmer on a warm, sunny, calm day in the summer.
—…—…—…
A more-than-ironic statement, considering that Hansen claims he expands the temperature data from this one station not merely 1 km inland, but apparently more than 1200 km out to sea and well over km 1200 east, west, and south ….
aurbo (21:25:44) :
I would be cautious about conflating the summer month anomalies and temperature excursions with the clearly erroneously entered data during the colder months when temperatures below 0°C are more prevalent and the missing “M” can create a major distortion in the daily mean, and subsequently the monthly mean. And such errors are always in the direction of higher temperatures.
The problem is not with the METARS, it’s the ETARS that really matter.
—…—…—…
We see this explicitly in the 60 years of 80 degree arctic temperatures from the WUWT link on the upper right side of the page.
Symptom: For the entire record, summer temperatures have remained constant at +3 degrees C. NO “M” data expected, none recorded, none required => yields accurate plots with almost NO variation across the entire period when temperatures are entirely “positive.
Spring and fall: As temps go down, the differences from the actual value increase: a +3 deg C averaged into a number of -3 deg records is only 6 degrees wrong. A single +12 deg C averaged into the same number of -12 records is a +24 degree increase. Result? We see a much larger variation in the temperatures daily in both seasons.
Winter: Extreme differences from the actual values (plus 40 in the 1 Jan record shown above!), extreme variation between days and hours, and extreme randomness in the winter temperatures.
Coincidentally, a very “rough” winter temperature means the very, very small change in real Arctic temperatures between 1950 and 2010 is easy to change graphically into a vary large number of GISS red and orange spots spanning tremendous areas of the tundra and Arctic Ocean.
It is heartening to see the numbers who are not fooled by your story. Allthe silly falsehoods I picked up have been commented on by others. It looks like the Climategate hype has resulted in more activity by those still able to think critically. You will have to fact check your stories better or your economic masters will notice a growing triviality .
Nice to see the real weather information from the North: I probably wouldn’t have seen it if you weren’t posting the bushwa.
Someone put the bad info back in to the Wikipedia page (it’s there as of April 26th 2010) ignoring the concerns expressed here. The Wikipedia pages on global warming are dominated by warmists who make sure no skeptical views are included.
Now, if one wants to balance Eureka, try the interior of the Yukon Territories, such as Whitehorse – often the coldest area of Canada in the winter.
One day an airline had to hurry passengers onto a 737, as the way the temperature was dropping they’d soon be below what was allowed for takeoff. But that may have been in the depths of 1970s global cooling. 😉
Well, I haven’t checked summer temps there, I’m on the global cooling wagon. [I joke, perhaps badly.]
What an astonishing tale! I would’ve given odds of 100:1 that the 5.9C, 19.6C, 4.1C hourly data series was corrupt.
But if the Eureka station manager says that there are no gremlins, one is obliged to believe him! (Admittedly, he was writing about the following day’s 20.9C record, but same principle.)
I have been a fierce critic of the AGW theory, and remain highly dubious, but this episode shows that folks like me were maybe too hasty in dismissing the Tales from the Tundra. I will be more reluctant to say, “There’s not the slightest sign of warming where I live: ain’t it funny that it’s only at edge-of-the-world stations, and at beer time, that the thermometer skyrockets.”