Steven Goddard writes below that he agrees with the prediction I made in late 2009 that we’d see another 500,000 km2 of Arctic sea ice recovery in 2010. The Arctic Oscillation seems to be negative again, and according to NSIDC, this figures greatly in making thicker ice thus lowering summer losses. – Anthony

Source: Climate Prediction Center
NSIDC regularly puts out a news article describing the deteriorating state of the Arctic, called the Sea Ice News. In their May 5, 2008 article, they stated:
…the Arctic Oscillation was in its positive phase through the winter season, associated with a wind pattern helping to flush thick ice out of the Arctic, leaving thinner ice. This is one of the factors helping to set the stage for pronounced ice losses this summer.
Additionally, Dr. Walt Meier from NSIDC told WUWT:
The NAO/AO (Arctic Oscillation) is a particularly prominent one and a substantial amount of the decline in the sea ice during the late 1980s and early 1990s could be attributed to a strong positive mode during winters because the positive mode favors the loss of thicker ice (through drift) that is less likely to melt during summer.
In their January 5, 2010 article NSIDC states that we are in an “Extreme negative phase of the Arctic Oscillation” which can be seen in this NOAA graph below. Oddly (but not surprisingly) the article failed to mention how this affects drift.

If a positive Arctic Oscillation flushes out the Arctic into the Atlantic, the implication is that a negative phase would tend to retain ice. This indeed appears to be the case. Arctic buoys show very light polar drift this winter.

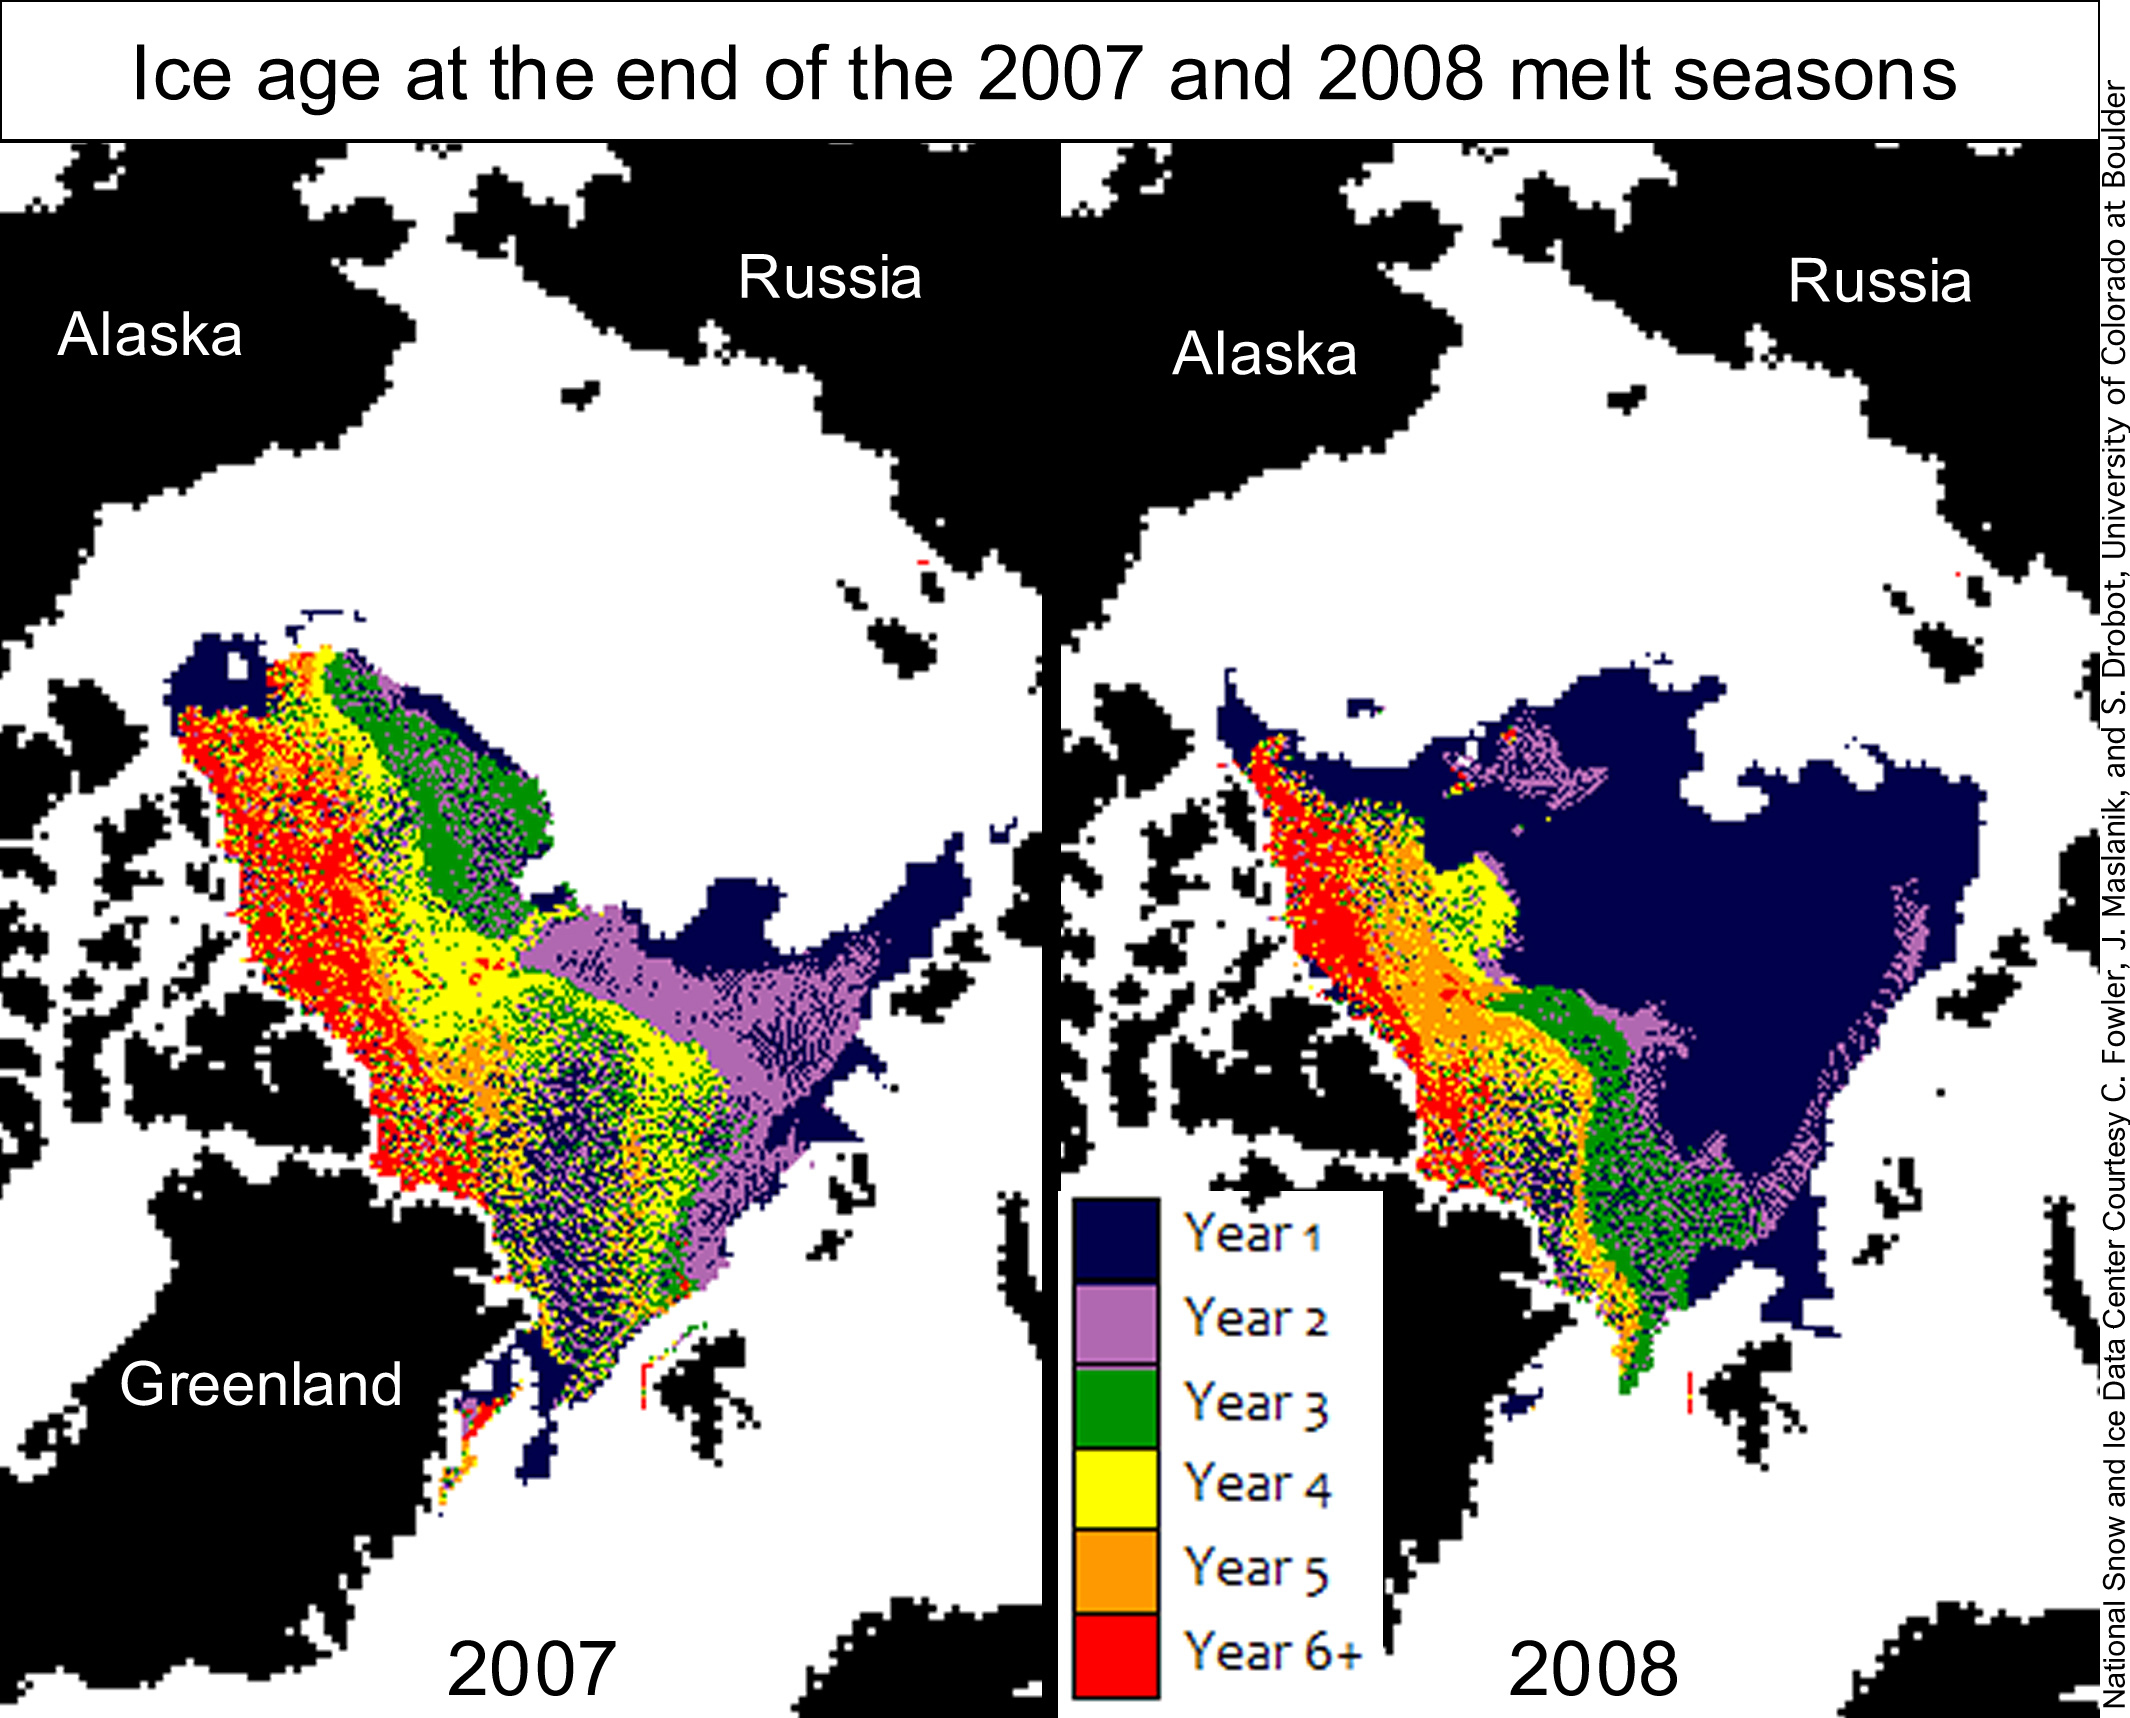
NSIDC made a big deal about loss of multi-year ice in the Arctic during 2007-2008, but this was due more to drift in the winter than melting in the summer, as can be seen in the NSIDC map pair below. Note that most of the 2007 multiyear ice was replaced by first year ice after the 2007 melt season ended and (necessarily) before the 2008 melt season started. The only way this could have happened was due to drift during the 2007-2008 winter, i.e. it could not be the result of summer melt -because ice only forms in the winter.

If the ice is not drifting (i.e. not under tensile stress) the concentration should be high. This indeed appears to be the case. According to UIUC maps, sea ice concentration is high (above 90%) across the Arctic Basin.
http://arctic.atmos.uiuc.edu/cryosphere/NEWIMAGES/arctic.seaice.color.000.png
The Arctic ice minimum extent increased by about 25% between 2007 and 2009, and many indications (negative AO, light drift, high concentration) point to the idea that it will continue to increase in 2010.

http://www.ijis.iarc.uaf.edu/seaice/extent/AMSRE_Sea_Ice_Extent.png
We can also expect that the average age of the ice has increased this winter, continuing a trend started in 2009.

Here’s your chance to weigh in:
Prediction: Arctic Ice Will Continue to Recover this Summer
NSIDC regularly puts out a news article describing the deteriorating state of the Arctic, called the Sea Ice News. In their May 5, 2008 article, they stated:
the Arctic Oscillation was in its positive phase through the winter season, associated with a wind pattern helping to flush thick ice out of the Arctic, leaving thinner ice. This is one of the factors helping to set the stage for pronounced ice losses this summer.
Additionally, Dr. Walt Meier from NSIDC told WUWT:
The NAO/AO (Arctic Oscillation) is a particularly prominent one and a substantial amount of the decline in the sea ice during the late 1980s and early 1990s could be attributed to a strong positive mode during winters because the positive mode favors the loss of thicker ice (through drift) that is less likely to melt during summer.
In their January 5, 2010 article NSIDC states that we are in an “Extreme negative phase of the Arctic Oscillation” which can be seen in this NOAA graph below. Oddly (but not surprisingly) the article failed to mention how this affects drift.

If a positive Arctic Oscillation flushes out the Arctic into the Atlantic, the implication is that a negative phase would tend to retain ice. This indeed appears to be the case. Arctic buoys show very light polar drift this winter.

NSIDC made a big deal about loss of multi-year ice in the Arctic during 2007-2008, but this was due more to drift in the winter than melting in the summer, as can be seen in the NSIDC map pair below. Note that most of the 2007 multiyear ice was replaced by first year ice after the 2007 melt season ended and (necessarily) before the 2008 melt season started. The only way this could have happened was due to drift during the 2007-2008 winter, i.e. it could not be the result of summer melt -because ice only forms in the winter.
If the ice is not drifting (i.e. not under tensile stress) the concentration should be high. This indeed appears to be the case. According to UIUC maps, sea ice concentration is high (above 90%) across the Arctic Basin.

http://arctic.atmos.uiuc.edu/cryosphere/NEWIMAGES/arctic.seaice.color.000.png
The Arctic ice minimum extent increased by about 25% between 2007 and 2009, and many indications (negative AO, light drift, high concentration) point to the idea that it will continue to increase in 2010.

http://www.ijis.iarc.uaf.edu/seaice/extent/AMSRE_Sea_Ice_Extent.png
We can also expect that the average age of the ice has increased this winter, continuing a trend started in 2009.
Poll:
What will the 2010 Summer Arctic Sea Ice Extent Be?
It will be greater than 2009
It will be greater than 2008 but not 2009
It will be less than 2007
It will be near normal
The North pole will be “ice Free” in 2010
http://bishophill.squarespace.com/
Interesting comments from Andrew Lacis on Bishop Hill Blog.
You won’t believe it.
I believe 2010 will be 2006-ish.
I’m skeptical of 500K sq km more. The arctic has been warm over the last 6 months. I think it will be a bit below 09.
It still don’t get why drift favours thinner ice over thicker.
The JAXA ice graph shows about the same acreage as in the 2007 low year, despite the good summer/fall recovery in 2009.
What’s your rationale Steve for the thickening; is it just that temperatures are lower; or is there a lot of precipitation on top of the growing sea ice; or is it something else ? Would an El Nino condition that we apparently now have result in a lot of Arctic precipitation ?
http://igloo.atmos.uiuc.edu/cgi-bin/test/print.sh?fm=02&fd=01&fy=2007&sm=02&sd=01&sy=2010
Is it me or the ice looks much healthier than in 2007, before the record summer minimum?
I bet it is thicker as well. Recent slower growth and even temporary retracts are due to compaction (thicker ice). It will show its quality next September.
Temperatures in the Arctic have been plenty cold, averaging close to minus 30C.
http://ocean.dmi.dk/arctic/meant80n.uk.php
The key thing which determines growth in ice thickness during the winter, is drift. During 2007, lots of older ice melted during the winter because it blew out into the warm waters of the North Atlantic (remember the crusty ice that summer?) This year, drift is light because of the negative Arctic oscillation. So the ice is largely growing thicker in situ.
Extent anomalies are nearly meaningless at this point in the winter. The “missing” ice is in the first places to melt in spring.
http://nsidc.org/data/seaice_index/images/daily_images/N_daily_extent.png
Note that in the AMSR-E graph, 2006 had the lowest February extent, but had one of the highest summer extents.
From the comments, it appears that the process of Artic Ice formation and loss is not fully understood by anyone. Does it give any indication of a warming/cooling trend? Or is there insufficient data to answer the question? As a mere taxpayer, I would like to know when I can have my barbeque Summer. Alternatively give me my money back.
The ice extent won’t change much, but it will surely be a lot thicker. I don’t expect a summer melt any longer than the ‘brief’ 2009 season was.
The Warmists make a big deal about sea ice loss overheating the planet.
If someday what happened in the Arctic in 2007 gets repeated in the Antarctic, that last effect we’ll get out of it is an overheating. It will be the Big Chill in the S. Hemisphere.
Next time you take a hot bath, perform this experiment. Grab a bucket of ice cubes and dump them in after you’ve settled in.
Thanks Steve. I have enough balls in the air to keep track of right now; so it is nice to have someone who understands it, explain what is going on.
George
The North pole will be “ice Free” in 2010 2% (3 votes)
Three trolls stopped by.
it’s good to see Steven Goddard back
he has a good track record for predictions too
This may be a dumb question, but if there is less Arctic drift, could that account for the record warmth in Jan. that is due to warmer oceans? Less drift would mean less ice melting and cooling the oceans. Or am I full of it?
http://portal.fma.fi/sivu/www/baltice/ice_forecast
http://www.smhi.se/oceanografi/istjanst/produkter/icechart.png
The bay of Bothnia has already frozen over
The Bothnia sea is freezing more and more every day now.
The bay of Finland is frozen .
In a few more weeks with this cold we can walk from Stockholm
to St. Petersburg on ICE.
//Lars
Anyone who has been on sea ice knows it is always headed somewhere. It is not like the impounded pond ice. Ice extent is a non-static balance between outflow and refreeze. So now the conveyor belt has slowed down a little and ice manufacture is getting the upper hand. My guess is that arctic ice loss in summer is 20% melt and 80% transport.
Marcia,
Thanks. I’m enjoying writing again for the #1 science blog.
Anthony’s blog has even educated the Guardian and NYT – no small feat.
For me all I see is the little red 2010 trend down below or level with 2007, so I cant see the positives here? Unless we are talking thickness (something positive in another area of every mans life….)
TA,
My theory about January TLT warmth (I may write an article about this) is that a combination of El Nino and a deeply negative AO drove the temperatures at 14,000 upwards. A negative AO means that cold air is sinking from higher elevations and is being replaced by warm air from the ground. As dramatized in the movie “The Day After Tomorrow.”
http://nsidc.org/arcticmet/patterns/arctic_oscillation.html
Note the very warm spot over Canada and Greenland at + 4C.
http://www.remss.com/data/msu/graphics/tlt/medium/global/ch_tlt_2010_01_anom_v03_2.png
Ground temperatures in Canada and Greenland were above normal, but not that much. Also, the MSU near-surface readings had a much lower anomaly than TLT.
My point is that I think the satellite TLT readings are exaggerated for January because of the elevation they are measured at. In 1998, UAH and RSS showed a much larger spike than GISS or Had-Crut.
After reading the predictions of the (professional) experts last summer, I am convinced that nobody has a clear idea what is going on. Furthermore, the extend of September 2010 depends mainly on what is happening in July-August 2010.
Up to now the ice minimum has never grown 3 years in a row (“never” meaning: since 1979). Therefore the safest guess seems to me about 4.8 M sq km.
Steve Goddard (09:23:51) :
Temperatures in the Arctic have been plenty cold, averaging close to minus 30C.
http://ocean.dmi.dk/arctic/meant80n.uk.php
They’ve only been about 5ºC warmer than average for the last 6 months.
The key thing which determines growth in ice thickness during the winter, is drift. During 2007, lots of older ice melted during the winter because it blew out into the warm waters of the North Atlantic (remember the crusty ice that summer?) This year, drift is light because of the negative Arctic oscillation. So the ice is largely growing thicker in situ.
What makes you think drift is light? Here’s a comparison between the last week of Jan this year and in 2007.
http://i302.photobucket.com/albums/nn107/Sprintstar400/Drift2010vs07.jpg
I’d be very surprised if the arctic sea ice minimum isn’t at or below 2007 levels. The SST near the edge of the sea ice on the Atlantic side has been well above normal all winter hence the low extent this winter. Drift out off the Fram has been normal to high starting with younger, more fragmented ice. It will need some freaky summer weather to be otherwise I think.
If this article is right, the arctic ice will increase for the third year in a row for the first time since 1979.
Phil,
Is minus 30C cold enough to freeze seawater?
The 2007-2009 minimums have been dominated by loss of ice in the western Arctic, not the east. Drift in the western Arctic has been close to zero this winter, and Bering Strait ice is above normal.
My guess is slightly less than 2009. This is based on pure gut feeling and a guess that the Arctic polar vortex will have a weaker than average winter, spilling cold air further down the NH than happened in 2009.
I think even the experts are going to have a tough time calling this one!
Phil,
WUWT predicted 2009 ice correctly last March – while NSIDC was still mulling about a possible record minimum as late as July.
http://wattsupwiththat.com/2009/03/02/poll-and-polar-ice-trends/
I also called Serreze on his ice free North Pole prediction in 2008.
http://www.theregister.co.uk/2008/07/03/goddard_polar_ice/
But it’s only going to be 3 year old ice! The New Rule this year is that only 4 year old ice Counts!!!
Steve Goddard (10:27:09) :
Phil,
Is minus 30C cold enough to freeze seawater?
It depends how deep and warm the sea water is and how thick the ice is,
ice thickness depends on heat conduction through the ice, 5ºC smaller T differential across the ice would be about 20% less heat conduction.
The 2007-2009 minimums have been dominated by loss of ice in the western Arctic, not the east. Drift in the western Arctic has been close to zero this winter, and Bering Strait ice is above normal.
The drift data I’m looking at doesn’t support your assertion.
Does this mean we don’t have to worry about polar bears drowning?? Thank GOD, I haven’t been able to sleep for months!!
Steve Goddard (10:36:56) :
Phil,
I also called Serreze on his ice free North Pole prediction in 2008.
http://www.theregister.co.uk/2008/07/03/goddard_polar_ice/
Actually you didn’t, read it again!
Just to remind, that temperatures in 2005 reached 1940s level and now are heading down again.
http://climexp.knmi.nl/data/icrutem3_hadsst2_0-360E_70-90N_na.png
All this happening in Arctic, where dry cold air should allow CO2 to manifest its warming potential. How anyone dared to attribute 1980-2005 warming to CO2, not explaining ups and downs before? There is NEVER such graph shown in any newspaper article, except “unprecedented warming” hysteria. Btw, Arctic ice extent follows the temperatures inversely, NW passage being passable in 1942-44 just as in 2007-2009. I bet some fools on ships will stuck in ice there this summer.
Phil,
This is what I am looking at:
http://iabp.apl.washington.edu/DAILYMAPS/dailymap.60day.jpg
What is your source?
Phil. those charts showing drift you posted are interesting. The one thing I noticed was the flow in 2007 was strong into the Atlantic, where this year the flow is stronger within the Arctic basin, and not flowing out as in 2007.
Phil,
Did you miss this sentence?
“Secondly, the likelihood of the North Pole being ice free this summer is actually quite slim. There are only a few weeks left where the sun is high enough to melt ice at the North Pole. “
Somebody said that as the jet stream went southwards north pole will be relatively warmer while the US will be cooler. Is it true?
Isnt the planet itself displaying an enourmous experiment, showing us the difference of air effect versus sea effect on ice?
Isnt the result there, for all of us too see?
Antarctica versus the Arctic?
It depends on where the temperature’s artic will be located and it does not necessarily corresponds with the geographical pole.
Interesting and informative post. Certainly the negative AO of this winter has kept the ice in place and will preserve more multi-year ice, making it harder to melt during the summer, however, the negative AO has also kept the water warmer near Greenland. On balance, this will still slightly favor the multi-year ice.
Prediction: Summer sea ice minimum of Sept. 2010 will be lower than 2009 or 2008, but not as low as 2007. However, 2011 summer arctic sea ice minimum will be at a record low of somewhere around 2.5 million sq. km. As we head toward the solar max event of 2013, the increasing interplanetary A index, decreasing GCR, warmer oceans, decreasing cloud cover globally, increasing CO2 and methane levels could combine to see consecutive record low summer sea ice minimums in 2011, 2012, and 2013…but not 2010. Though 2010 will be the warmest year on record in the troposphere, baring any Mt. Pinatubo type eruptions…
Let me refer people to
http://wattsupwiththat.com/2009/09/07/how-have-the-scientists-done-on-arctic-sea-ice-forecasts-this-year-maybe-not-so-good/#more-10648
Here we had forecasts for the minimum extent of sea ice for Septemebr 2009. We now a one forecast for September 2009. Is it possible to make a collection of forecasts for 2010 as was done for 2009?
Steve Goddard (10:13:13) :
Steve, thanks for the link to the helpful grpahic showing why january 2010 showed record warmth even in the northern hemisphere http://www.remss.com/data/msu/graphics/tlt/medium/global/ch_tlt_2010_01_anom_v03_2.png.
Correct me if I am wrong but it appears to me that much of the northern hemisphere land mass temperature was well above normal (e.g Canada, Greenland, Africa, Middle East). The cooler parts, (USA and Europe), are where most of the readers to this blog are located, so gave the impression to many on this blog at least that Dr Spencer’s satellite data did not match reality on the ground.
My choice of between 2008 and 2007 is not available. Most melting occurs on the Russian side so the ice age on the Canadian side has less bearing than it would have if melting was uniform. As the Russian side has more sea then it gets a positive weighting on total melt and as Phil has said, there is no evidence that the Barents and seas eastwards are a tougher nut to crack than last year.
The SST’s are still high in the North Atlantic too and show no sign of changing.
Recovery in summer 2010 will be same wishful thinking as the rapid refreeze and Winter maximum increase claims we have seen recently dashed.
Andy
Brian,
Phil posted vectors for one (carefully chosen?) week. The 60 day drift maps show the sum total movement of buoys since early December.
http://iabp.apl.washington.edu/DAILYMAPS/dailymap.60day.jpg
Scarcely any movement outside of the Fram Strait.
Phil. (10:20:03) :
http://ocean.dmi.dk/arctic/meant80n.uk.php
They’ve only been about 5ºC warmer than average for the last 6 months
Here’s a graph from 1974. Pick any other one. They all show temps above and below the “average line”. Temp appears to normally be erratic, indicating drift, or other factors, may be more important.
http://ocean.dmi.dk/arctic/meant80n.uk.php
Remember, the “record” low ice in 2007 was due to a wind pattern that blew more ice out of the Arctic than normal, not unusually warm temperatures.
Below is a video link for the entire record of NSIDC sea ice. North and South pole together. The video was current at the time of Copenhagen. I’ve never tried to embed a video in a comment and don’t know the WUWT policy but here it is:
[youtube=http://www.youtube.com/watch?v=GMcxri_f1rw&color1=0xb1b1b1&color2=0xcfcfcf&hl=en_US&feature=player_embedded&fs=1]
Yeah, Steve, I know. But just using what he posted, the movement is more confined within the basin, and not so much out as in 2007. That’s what I was trying to get at.
Juraj
‘Just to remind, that temperatures in 2005 reached 1940s level and now are heading down again.
http://climexp.knmi.nl/data/icrutem3_hadsst2_0-360E_70-90N_na.png‘
That chart has one mega warm blip just before 1880.
Any indications as to what arctic sea ice was like that year?
MJK,
The large TLT January NH land anomaly is due mainly to Canada and Greenland. I’m hypothesizing that temperatures on the ground were not as anomalously high, and UAH Channel 4 seems to confirm this – as does weather underground stations I have looked at.
Anthony/Steve–
I hope you guys are right, and I’m wrong –tho I was pretty darn close last year and months in advance…
I’ll read your analysis, ponder it, and see if it changes my mind. I’m certainly not liking what we’re seeing so far this winter re the extent graphs at nsidc and ijis. For the moment I picked “More than 2008, but less than 2009”. More multi-year certainly helps limit your losses in the summer, but right now I’m sticking with the theory that even now the multi-year will not be recovered back to 2005 or 2006 levels, so we’d need significantly more maximum extent @mid-March to make up for that to get back to minimum extent for 2005 or 2006, which would be implied (by me anyway) in your prediction for “greater than 2009”.
Since I’m not seeing that happening at the moment (I’d love to see some acceleration in the next month, obviously, to make it possible), so currently I’m leaning towards a bit (not massively, but a bit) lower than 2009 but comfortably ahead of 2008.
Steve Goddard (11:02:15) :
Phil,
This is what I am looking at:
http://iabp.apl.washington.edu/DAILYMAPS/dailymap.60day.jpg
What is your source?
http://cersat.ifremer.fr/news/scientific_results/global_mapping_of_arctic_sea_ice_drift_a_unique_database
Brian D (11:09:40) :
Phil. those charts showing drift you posted are interesting. The one thing I noticed was the flow in 2007 was strong into the Atlantic, where this year the flow is stronger within the Arctic basin, and not flowing out as in 2007.
It varies from week to week, particularly when a weather system moves through, the flow out of the Fram, the major exit route for multi-year ice, has been consistent.
Steve Goddard (11:43:05) :
Brian,
Phil posted vectors for one (carefully chosen?) week.
Chosen at random, it doesn’t make much difference.
The 60 day drift maps show the sum total movement of buoys since early December.
http://iabp.apl.washington.edu/DAILYMAPS/dailymap.60day.jpg
Scarcely any movement outside of the Fram Strait.
And there they show very strong outflow, mostly multi-year ice.
Steve Goddard (11:10:37) :
Phil,
Did you miss this sentence?
“Secondly, the likelihood of the North Pole being ice free this summer is actually quite slim. There are only a few weeks left where the sun is high enough to melt ice at the North Pole. “
No I didn’t, why do you think it’s relevant!
Some explanation of the Arctic and Antarctic Oscillations and how the AO affects ice formation, albeit with the usual AGW padding, courtesy of NCAR:
http://jisao.washington.edu/wallace/ncar_notes/
‘Just to remind, that temperatures in 2005 reached 1940s level and now are heading down again…
??? Janaury 2010 the warmest on record in the troposphere. How is that “headed down again”???
What amazes me is that all the climate scientists contributing to IPCC reports must understand the effects of ice drift and the effects of winds and currents on Arctic sea ice extent (and if they don’t what does that say about their knowledge of their subject).
Yet all public pronouncements seem designed to give the impression that the only factor that affects ice extent is average global temperature. This is so intuitive to the man in the street that it is unlikely to be questioned.
It’s a master-stroke of spin, but totally dishonest and completely unworthy of any true scientist.
If any fair-minded journos are reading this thread, then they could do their readers a great service by explaining that most arctic ice has to be moved out of the arctic before it will melt.
Hey isn’t near normal and more than 2009 about the same thing???
Steven, you said about the january NSIDC article that
” Oddly (but not surprisingly) the article failed to mention how this [the strong negative OA] affects drift”
however the mentioned article clearly states
“While a negative AO leads to warmer temperatures over the Arctic, it also tends to reduce the flow of sea ice out of the Arctic by affecting the winds that can export the ice to warmer waters, where it melts. In this way, a negative AO could help retain some the second- and third-year ice through the winter, and potentially rebuild some of the older, multiyear ice that has been lost over the past few years.”
so what is motivating your comment, exactly?
Great post and comments, Steve.
Klyashtorin and Lyubushin found Arctic sea ice coverage to be cyclical, and negatively correlated to global temperatures, but with an approximate 8 year lag.
http://alexeylyubushin.narod.ru/Climate_Changes_and_Fish_Productivity.pdf?
@ TA (09:54:34) :
This may be a dumb question, but if there is less Arctic drift, could that account for the record warmth in Jan. that is due to warmer oceans? Less drift would mean less ice melting and cooling the oceans. Or am I full of it?
Sounds like a smart question to me.
-psi
But early springs are messing up the food chain in the UK.
http://news.bbc.co.uk/1/hi/sci/tech/8506363.stm
You need another option on your poll; “It depends on the wind and currents”.
Mike Ramsey
This notion that AO correlates directly with arctic ice oscillations does not match what the record shows.
I have some comments / questions.
According to JAXA, the peak for 2008 was greater than 2009 so the second choice in the poll doesn’t make any sense.
What is “normal”?
I think it’s wishful thinking that there will be 500,000 km2 more ice than last year. At the rate the 2010 ice extent is growing, it will be lucky to be greater than the 2005-2007 group. If you look at the sea surface temperature anomoly on DMI, the water is unusually warm in the North Atlantic west of Greenland and in the Barents Sea, which are the two areas where the sea ice extent anomoly is is greatest.
I received this e-mail this afternoon
“PEW ENVIRONMENTAL REPORT SAYS MELTING ARCTIC COULD COST $2.4 TRILLION BY 2050
Contact: Ruth Teichroeb in Iqaluit, 867.979.2878 and Brandon MacGillis in Washington, DC, 202.887.8830
Iqaluit, Nunavut, Canada – 02/05/2010 – The Pew Environment Group today released a report that for the first time quantifies the global cost of the Arctic’s declining ability to cool the climate, indicating that the rapid melting of the region could carry a minimum price tag of $2.4 trillion U.S. by 2050.
The report, issued as G7 finance ministers began a two-day meeting in this southeast Baffin Island town, estimates that this year alone the climate cooling value lost by retreating Arctic sea ice and snow and thawing permafrost could be an estimated $61 billion U.S. to $371 billion U.S. On the low end of its projections, the report estimates that these costs could accumulate to almost $5 trillion U.S. by the end of the century if climate change is not abated.
“Putting a dollar figure on the Arctic’s climate services allows us to better understand both the region’s immense importance and the enormous price we will pay if the ice is lost,” said Dr. Eban Goodstein, co-author of the report and an economist who directs the Bard Center for Environmental Policy at Bard College in New York. “At the mid-range of our estimates, the cumulative cost of the melting Arctic in the next 40 years is equivalent to the annual gross domestic products of Germany, Russia and the United Kingdom combined.”
To arrive at the economic cost of Arctic melting, the report’s authors converted projected trends in snow and ice loss and methane releases into carbon dioxide emissions equivalents. Those were multiplied by the social cost of carbon, an estimate by economists of impacts from climate change on agriculture, energy production, water availability, sea level rise and flooding and other factors. This calculation produced the range of initial dollar estimates cited in the report.
The report “An Initial Estimate of the Cost of Lost Climate Services Due to Changes in the Arctic Cryosphere” notes that this region is warming at twice the rate of the rest of the planet. The loss of heat-reflecting sea ice and snow results in the absorption of more solar energy leading to warming. The thawing of permafrost, or permanently frozen ground, releases methane, a potent greenhouse gas. Increased warming from these effects, in turn, leads to more melting and thawing in a feedback loop.
The report calculates that this year alone, Arctic melting may warm the Earth an amount equivalent to pumping three billion metric tons of CO2 into the atmosphere. “That’s equal to forty percent of all U.S. industrial emissions this year or bringing on line more than 500 large coal-burning power plants,” said Dr. Eugenie Euskirchen, co-author of the report and a scientist from the University of Alaska at Fairbanks’ Institute of Arctic Biology.
“The preliminary results in this report show that as the Arctic melts we are losing a hidden treasure: the far north’s crucial capacity to cool the earth,” said Scott Highleyman, international Arctic director for the Pew Environment Group. “We urge the G7 finance ministers to commission a full economic analysis of the global climate services provided by a frozen Arctic and what losing the planet’s ‘air conditioner’ will cost all of us.”
The report was released by the Pew Environment Group’s Oceans North campaign which promotes sound stewardship of the Arctic Ocean. The authors are solely responsible for its content, which was reviewed by more than a dozen economists and Arctic scientists.
===============================================================
Resources:
Dr. Eugenie Euskirchen, University of Alaska at Fairbanks, Institute of Arctic Biology, 907.687.3864, seeuskirchen@alaska.edu
Dr. Eban Goodstein, director, Bard Center for Environmental Policy, Bard College, New York, 503.806.6370, ebangood@bard.edu
Scott Highleyman, Pew Environment Group’s International Arctic director, 360.715.0063, shighleyman@pewtrusts.org”
No comment. Murray
Bets on when the Port of Churchill, Manitoba (on western Hudson Bay) will open for business in 2010, coinciding with sea ice breakup?
In 2009, an early opening was predicted (July 1) but the ice was actually 6 weeks later than that breaking up (Aug. 12), which was 3 weeks later than the average (July 21).
We heard about the late opening in 2009 but not about the fact that an early opening had been anticipated.
“Steven Goddard writes below that he agrees with the prediction I made in late 2009 that we’d see another 500,000 km2 of Arctic sea ice recovery in 2010. The Arctic Oscillation seems to be negative again…” — Anthony
———-
Despite so many predictions going awry when there’s so many variables, especially when it comes to climatic changes, I’m going to have to disagree with both Anthony and Steve Goddard, and say that the warmer winter with the extreme negative AO will bring less sea ice extent in 2010.
It also seems as if roy spencer is amazed at the +0.72 C global temperature anomaly for Jan. 2010, almost exactly where we saw global temperatures during the extreme el Nino year of 1998.
http://www.drroyspencer.com/latest-global-temperatures/
Plus, it certainly appears as if Solar Cycle 24 will be giving us a bit more solar irradiance with the return of sunspots after such an extended solar low for the last few years, with a solar flux in the 90’s and M-class flares.
http://solarcycle24.com/
Rob,
Interesting. I actually wrote this piece about a month ago, and didn’t see that NSIDC AO drift discussion at the time. I wonder if the discussion has been updated since then? The web page has a more recent time stamp than the date of the article.
I guess I’m not getting the finer points of the discussion between Phil and Steve Goddard. Having never been that far up in the arctic (made it to Circle City, in July 1967 (mid summer)) so I couldn’t see the arctic ocean from there; I’m not up on the geography they are talking about.
But a colleague who was in the Submarine Navy is quite familiar with the ice up there including from above and below; and he says, when the sea starts to freeze, it gets really weird, and huge areas can “come and go” in a matetr of an hor or so.
Unless it is really salty up there, I would imagine that the sea freezing point is about -2.5 C; so I guess -3 deg C is a pretty safe freezing temperature.
And unless I am mistaken; the “ice coverage” numbers that at least JAXA is reporting are really areas where at least 15% of the area is actually ice, so as much as 85% could still be open water.
So it seems to me that the biggest changes are actually open water turning to thin first year ice; when the air temperature goes well below -3 deg C, and the temps seem to have been up and down around -20, -25, -30 C; so I would think that the first year ice coverage can be growing, uninhibited by the lower conductivity of thick multi-year ice that Phil seems to be referring to when he talks of the ice being a good insulator.
So isn’t the acreage increase somewhat independent of the thickness increase ?. There’s not much to stop the air water interface from freezing.
Well maybe there’s something I am missing here.
I think Doc lacota has it right. Increasing solar activity means:
1. Greater solar irradiance
2. Less GCR’s
3. Less cloud cover
4. More energy to troposphere & oceans
All this, combined with record amounts of CO2 and methane. Though I still think 2010 summer sea ice mimimum will come in right around 3 million sq. km, but a tiny bit above 2007’s summer minimum. But watch out for 2011, 2012, & 2013. I think we’ll hit 3 successive record lows in a row leading up to the solar max in 2013.
Vincent (09:08:33) :
“It still don’t get why drift favours thinner ice over thicker.”
Heat exchange is a function of volume and surface area. I.E Crushed ice melts faster then an ice cube as crushed ice has a larger surface area as a function of it’s volume. The radiator in you car has a gazillion little fins to maximize surface area.
A single 1″ square ice cube has 6 sq inches of surface area and a volume of 1 cubic inch. A Ratio of surface area to volumeof 6 to 1.
A single 2″ ice cube has 24 sq inches of surface area and a volume of 8 cubic inches. A ratio of surface area to volume if 3 to 1.
Hence, if the wind is blowing the sea ice apart(breaking it into smaller pieces), then it will melt faster.
“”” Harry (14:54:41) :
Vincent (09:08:33) :
“It still don’t get why drift favours thinner ice over thicker.”
Hence, if the wind is blowing the sea ice apart(breaking it into smaller pieces), then it will melt faster. “””
Which means that having a bunch of busibodies charging around the arctic ocean on an icebreaker, carving up the sea ice, is not such a good, or a green idea.
Rob Vermeulen
Hmmm…. I missed the paragraph you quoted when I read the NSIDC news in January. Weird. They didn’t mention anything about drift in the February article.
My bad.
R. Gates (12:25:35) :
??? Janaury 2010 the warmest on record in the troposphere. How is that “headed down again”???
Dear defense secretary, I meant Arctic.
http://climexp.knmi.nl/data/icrutem3_hadsst2_0-360E_70-90N_na.png
But northern hemisphere is heading down as well, now reaching temperature of 1990. If 3-7C warming predictions till 2100 are correct, it should warm during these two decades by 1-3C (northern hemisphere should warm twice the global average).
http://climexp.knmi.nl/data/icrutem3_hadsst2_0-360E_23.5-90N_n_1980:2010a.png
As Rob points out above, NSIDC did address the issue of drift in their January piece. My apologies for having overlooked it, though it definitely supports my conclusions.
Drift favors thinner ice because the mass to surface area ratio is less and it is more easily moved by the wind.
OK, so are the buoy movements normal, or not for a winter season? Is the outflow from the Arctic been normal, or not? Or is this all just a best guess game, like the climate?
R. Gates (14:44:43) :
I think Doc lacota has it right. Increasing solar activity means:
1. Greater solar irradiance
2. Less GCR’s
3. Less cloud cover
4. More energy to troposphere & oceans
All this, combined with record amounts of CO2 and methane. Though I still think 2010 summer sea ice mimimum will come in right around 3 million sq. km, but a tiny bit above 2007’s summer minimum. But watch out for 2011, 2012, & 2013. I think we’ll hit 3 successive record lows in a row leading up to the solar max in 2013.
But, but, but surely your IPCC bible says that the natural phenomena you cite above have no effect on climate?
If they do then CO2 has almost no effect, not to forget that industrial contribution to CO2 is ( and this is generous ) 3.3%.
How can you eat your dinner at a table without legs?
George E. Smith (14:42:15) :
See here George:
http://nsidc.org/seaice/processes/thermodynamic_growth.html
Note that ice thickens from below so the heat is lost through the ice to cool the layer of water just below the ice, as the ice thickens the rate of conduction drops therefore slowing the rate of ice accumulation. Also for the fresh ice to form a layer of water must first be cooled since the denser, cooler surface water sinks before it freezes.
A point not noted by any comments so far is thet the scale against which the NAO is measured was extended in December to read as low as -6, previously it measured to -5 and that had never been reached.
As for those suggesting the Solar max causing record melt. Although the sun looks as though it is waking from i’s slumber with a succession of sunspots this year, the Sloar Maximum will still be much lower that the last 3 cycles, so the effect will be less pronounced, also, why do people think we have a 5 year lag in cooling but no lag on warming? The Solar max will not help stabilise temps much before 2015
I’ve never seen any evidence of sunspot count affecting ice extent. Antarctic ice has been increasing and Arctic Ice has been decreasing over the last 30 years. The 1980s had unusually high ice extent and age, when solar activity was at a 300 year high.
2007 was an unusual year because of all the older ice which blew into warm waters of the North Atlantic.
Where’s Pen Hadrow when you need him? Send in Pen and his crack team of ice measurers… They’ll sort it out!
“”” Phil. (15:47:49) :
George E. Smith (14:42:15) :
See here George:
http://nsidc.org/seaice/processes/thermodynamic_growth.html
Note that ice thickens from below so the heat is lost through the ice to cool the layer of water just below the ice, as the ice thickens the rate of conduction drops therefore slowing the rate of ice accumulation. Also for the fresh ice to form a layer of water must first be cooled since the denser, cooler surface water sinks before it freezes. “””
Well I don’t have a problem with any of that Phil; my point was that increases in area of sea ice, rather than increases in thickness, must be largely due to open water freezing at the surface. Certainly if it tried to freeze under water, the lower density ice would immediately rise to the surface; so yes I believe that the surface water must get down to freezing, and the water below that is presumably denser for some reason; such as the sinking your describe. I assume that increase in pressure with depth lowers the freezing point further , so the deeper water can’t freeze before the surface water.
Once you have surface ice, I don’t have a problem with the growth process slowing due to the ice insulation. I presume that the expulsion of salt from the ice raises the salinity of the boundary layer, and also lowers the freezing point.
I’ve heard a few people comment about the “unusual” nature of 2007’s low sea ice anomoly as it relates to ice getting “blown” into the warm waters of the arctic. As though it was all wind (and not any temperature anamolies) that caused the low ice levels. Of course it was both. See:
http://nsidc.org/news/press/2007_seaiceminimum/20071001_pressrelease.html
For a nice analysis of what happened.
But whether it be solar radiation, wind, or warmer oceans in the arctic region, they all ultimately represent energy, and AGW (whether it exists or not) is fundamentally about the energy budget of the earth. Wind is just one form of that energy budget.
If we don’t hit a new record low arctic summer sea ice minimum in the next 5 years, (and I maintain we will in 2011, and then again in 2012 & 2013) then I would have my serious doubts about the ability of human activity to seriously impact earth’s energy balance in any meaningful way, and even concede that all natural variability far outweighs any human forcings to the energy balance. i don’t however, think that is the case. We haven’t had a significant positive arctic sea ice anomoly since 2003, and have in fact averaged around a million sq. km in the negative or under the normal levels based on the average over the previous 20 years:
http://arctic.atmos.uiuc.edu/cryosphere/IMAGES/sea.ice.anomaly.timeseries.jpg
If would take a huge amount of energy to be “pumped” out of the arctic, to reverse the negative trend. I don’t see that happening, in fact, with the negative AO’s of this winter, quite the opposite…energy is being pumped into the arctic and in general have been warmer than average in the region, especially over Greenland. Yesterday is was warmer in Greenland than in Nashville and Memphis.
Daryl M (13:52:47)
I have some comments / questions.
According to JAXA, the peak for 2008 was greater than 2009 so the second choice in the poll doesn’t make any sense.
++++
Peak? Did you notice the poll question said “summer”? We’re discussing predictions for minimums reached in September, not maximums reached in March.
Can they be related? Sure. I made that point upstream when I declined to go along (yet) with a prediction of > 2009. But the March peak is not the only factor in the eventual September minimum. . . multi-year ice, winds, tide, cloud cover in the summer, and (of course) summer temperatures and the early/late/average onset of Fall all play a role.
“Ground temperatures in Canada and Greenland were above normal, but not that much. Also, the MSU near-surface readings had a much lower anomaly than TLT.
My point is that I think the satellite TLT readings are exaggerated for January because of the elevation they are measured at. In 1998, UAH and RSS showed a much larger spike than GISS or Had-Crut.”
I know it’s only one station, but the Summit camp station on the Greenland Ice Cap has had an outlandishly warm winter. Although I have been unsuccessful in finding climate normal info for Summit, the mean temperature for the month of Januarywas around -29 C. My best guess as to the avg Jan tmean temp is -40 C. January was warmer than December, which was warmer than November!.
R Gates,
In 2007, the ice started in a “weakened state” (as NSIDC put it.) That was because much of the older ice was carried away by drift during the winter, leaving large areas of thin, first year ice that had formed late in the winter.
The point is that this year both the new ice and old ice has not been moving very much, and should be thicker than 2007. BTW WUWT predicted growth in multi-year ice for 2010 nearly a year ago.
http://wattsupwiththat.com/2009/04/15/why-third-year-arctic-ice-will-increase-next-year/
1962-1987 Last cool period [winters only]
Total number of winters 26
Number of winters below base line norm 1961-1990 18 or 69 % [say 70%]
Number of winters where AMO is negative 23 or 88%
Number of winters AO is negative 19 or 73%
Number of winters with AO negative all winter 10 or 38% [during 1988-2008 only 3 winters had negative AO all winter]
Number of winters where PDO is negative 15 or 58 % [Mostly early part 1962-1976] [affects jet streams and strength of westerlies?]
Number of winters NAO is negative 13 or 50 % [mostly 1960’s -8]
AO 1950-2009 [60 years]
Number of winters [DEC, JAN, FEB] negative all winter 18 or 30%
Of the 18 all negative winter AO 11 or 61% went negative to March as well[cool spring?]
Of the 18 all negative winter AO 13 or 72 % had negative months into the spring and summer [cool year?]
Severity of winter climate during the past cold spells was stongly influenced by the presence of negative AMO and AO and PDO
If a similar cool pattern develops for the next 20-30 years . then there will plenty of ice to go around in the Arctic.
cmbclean,
Summit Camp is above 10,000 ft. elevation which is close to the TLT 14,000 ft. height. Most of the Canadian Arctic is close to sea level.
cbmclean:
I was reading your post and noticed Yellowknife Canada is very much above its normal temp. On this webpage you can see current temps and look at the almanac for normal temps.
Current temp:
http://www.myforecast.com/bin/detailed_forecast.m?city=54390&metric=true
Historical information
http://www.myforecast.com/bin/climate.m?city=54390&metric=true
I can see that Yellowknife is well above normal temps at this time. I just do not undrestand this phenomena. I live close to Omaha Nebraska which is below normal temperatures at this time, the cold air we are receiving is coming from Central Canada. But the temps in Canada are well above their normals. I don’t know why this happens.
Re: Tenuc (10:34:25)
I have a gut feeling you are right. There’s only so much cold air to go around and it seems to be getting blown out regularly in this present weather pattern. Of course, that could stop at any time and we could get calm conditions in the arctic, but I’m just guessing we won’t have that happen soon.
pt 1. Steve, you da man. Solar anything has nothing to do with Arctic Ice. The tilt of good ‘ol planet Earth drives Arctic ice formation.
pt 2. The AO does INDEED have lots and lots to do with Fram Strait ice exit. Maybe all the greenies can go up there and twirl their fingers really fast (before they freeze off) the other way and turn the wind around to send ice out of the Arctic basin. Then they can say, “See? I told you so!” What exactly that is I haven’t figured out yet, other than to surmise GIGO.
pt 3. Anybody worth a tinker’s dam should be coming up with a study on the AO, including 3 month running average, short term and long-term oscillations, and side indicators of change, along with a nifty name for positive and negative events and conditions. I think we should use names from the Eskimo language in the area in honor of the hearty souls who withstood this environment well enough to have babies in it. Anybody here know Eskimo?
SO….somebody download the AO data and get cracken on the 3 month running average thingy, stealing methodology unashamedly from ENSO (but with atmosphere data, not SST data), to come up with understandable understandings about the AO. And you have to be creative enough to come up with cute names that can withstand the cuteness of El Nino and La Nina.
Ready, set, go……….!
Steven Goddard,
Thanks for the informative article. At times I get a little tired of articles about Climategate hoaxes, as they are depressing, while articles such as yours, about our world as it is, fill me with wonder.
You’re a brave man to make a forecast. I do it too, but usually don’t tell anyone. If I do, I make sure not to bet more than a nickel. For every one thing I’ve learned about meteorology I have five new questions. I’m fairly certain our world’s weather will forever surprise people who think they have it all figured out.
R. Gates: You’re also brave to venture a prediction. However make sure to avoid the word “unprecedented.” Studies of the arctic shoreline by geologists show there have been times when it was shaped by surf, rather than ice, in the past.
Also archeologists have studied the campsites of the very first people to walk the shores of the Arctic Ocean after the last ice age, and, in a treeless landscape, these ancient people burned driftwood for heat and cooking. This suggests arctic rivers were washing wood northwards from southern lands, and dumping the wood into an Arctic Ocean which was ice-free enough of the time to allow driftwood to collect along its shores.
If the reduced abedo-effect of an ice-free arctic didn’t destroy the earth back then, why should it now?
I’d like to see some calculations of what the albedo-effect actually is. For example, there was a nearly 2 million square km difference between ice extent between 2003 and 2007. What was the difference, in terms of energy bounced back to space?
Don’t forget that ice extent is at its lowest in September, when the sun is right down on the arctic horizon. It seems even the sea surface would reflect a lot of sunlight, at that angle.
Compare that with the angle of the sun over Washington DC right now. How many square km of the USA are covered with snow? How much heat is reflected back into space?
Until I see actual numbers, the albedo-effect seems nothing but a vague theory to me, and may indeed be nothing but an old maid’s worry.
None of these really roll off the tongue do they.
Added – illaksak (eellaksak)
Adrift – savidyauyok
Blows (wind) – subluarpok
Blows a little – subluksungnartok
Coming (is) – krainyok
Departs (leaves) – audlarpok
Klingon:
In – ‘el
Out – lel
Ref – It’s always Marcia, Marcia (09:52:21) :
“The North pole will be “ice Free” in 2010 2% (3 votes)
“Three trolls stopped by.”
____________
The “Trolls” are up a little as I type. I think you’re mistaken in your characterization however, at least I claim exception, and I doubt that any real trolls hang around in these temps for very long. I felt uneasy about the choices. I guess they didn’t give me enough choice and when I reached the last I thought for a moment about the old advice about taking the road less traveled. “D”, for a very brief instant, seemed the most likely to be true if you remember that we seem to know so little –no offense to anyone– about how climate works. Isn’t it amazing that we can (or could) walk on the Moon but we can’t be very precise about how much more or less ice we’ll have in the Arctic for the 2010 season? I guess I tend to be contrary at times. It seems, for all we “know”, that the Arctic could just as easily be iceless during most of an ice age:-)
How else do we explain all those glaciers? The cold must be down here and not up there.
I’m contrary tonight not trollish.
I want to understand the AO a bit more before I feel I have what it takes to predict it’s winds and pressure systems that long out. What do we know about the predictive signs of this thing going positive or negative? It is quite obvious that NOAA/NASA hasn’t got it down.
geo (17:17:21) :
Daryl M (13:52:47)
I have some comments / questions.
According to JAXA, the peak for 2008 was greater than 2009 so the second choice in the poll doesn’t make any sense.
++++
Peak? Did you notice the poll question said “summer”? We’re discussing predictions for minimums reached in September, not maximums reached in March.
Can they be related? Sure. I made that point upstream when I declined to go along (yet) with a prediction of > 2009. But the March peak is not the only factor in the eventual September minimum. . . multi-year ice, winds, tide, cloud cover in the summer, and (of course) summer temperatures and the early/late/average onset of Fall all play a role.
Doh! I never noticed the poll was for the summer minimum. I jumped to the conclusion we were talking about the winter maximum since we are coming up on it soon.
Notwithstanding that, I still question whether we are heading for an increase in the summer ice, since the winter maximum is not looking like it will it will set any records. In fact, it looks like it will be on the low side. So if the 2010 winter maximum is lower than normal, the summer minimum will be disadvantaged out of the gate.
Here the latest SST Anomaly from UNISYS-I like to use them because they
don’t use screaming NOAA yellow and oranges for normal to slightly
above normal:
http://weather.unisys.com/surface/sst_anom.html
My own take-an layman’s point of view-but El Nino’s going to augur in by the
end of Feb or first of March.This isn’t the Mulit-year El Nino of Warmists dreams….
I’d cheer for the ice trying to break above 16 on the graph, but I haven’t done the math to see if that would freeze Paris. I’m not worried about the Thames or the Low Countries, as they have cold-weather traditions already.
Steve Goddard (18:04:47) :
cmbclean,
Summit Camp is above 10,000 ft. elevation which is close to the TLT 14,000 ft. height. Most of the Canadian Arctic is close to sea level.
Yes, RSS don’t use data from that location because it is over 3000m ASL.
TLT altitude is lower than 14,000 ft, that is the weighting function for channel 5, TLT is a composite channel (weighted difference of near-limb and near-nadir views done to remove the interference from the stratospheric cooling).
Phil,
Looks to me like TLT is 14,000 feet?
TLT = Temperature Lower Troposphere MSU 2 and AMSU 5
http://www.remss.com/msu/msu_data_description.html
Daily global average temperature at: 14,000 ft / 4.4 km / 600 mb (ch05)
http://discover.itsc.uah.edu/amsutemps/data/amsu_daily_85N85S_ch05.r002.txt
Caleb,
I’m a scientist/engineer and I personally find the science more interesting than the politics, but ultimately politics always drives science. The National Labs were created out of political expediency (to make the bomb) and they still switch direction with each new administration.
What is interesting about the IPCC disaster is It’s historic nature, on a scale not seen in centuries. I suspect it won’t be long before people like Phil Jones start talking about the political pressure they were under. What does he have to lose at this point?
Two claims here which are not quite accurate without addendum
1) Antarctic sea ice is increasing. The trend is very slightly up, but still not by very much at all. the last two years have been on the average for instance.
2) The exceptional melt of 2007 was not just caused by wind patterns, it was coupled with exceptionally clear sunny days too. The latter keeps getting forgotten in some quarters.
Andy
rbateman: “Next time you take a hot bath, perform this experiment. Grab a bucket of ice cubes and dump them in after you’ve settled in.”
I’ll take your word for the experiment. Not gonna try it. (Shrinkage Warning in effect).
Chris
Norfolk, VA, USA
Caleb (18:19:35) : “If the reduced abedo-effect of an ice-free arctic didn’t destroy the earth back then, why should it now?…Don’t forget that ice extent is at its lowest in September, when the sun is right down on the arctic horizon. It seems even the sea surface would reflect a lot of sunlight, at that angle.
“Until I see actual numbers, the albedo-effect seems nothing but a vague theory to me, and may indeed be nothing but an old maid’s worry.”
Quite right. In the early days of AGW, warmist think tanks flogged their members until the latter could come up with reasons why warm would be bad. Vicious circle albedo decrease was one of the first straws they grasped at.
But the albedo of open sea water at high zenith angles overlaps that of ice. Old ice is pretty dirty, pockmarked, and is not the best reflector. The emittance of seawater is about 0.997, essentially a black body, and it is radiating to a night (winter) sky at about 4°K. It rapidly ices over. Have you ever driven down to the sea in the afternoon and looked out at the water? A bright image of the sun reflects off the waves, almost too intense to look at. There will always be Arctic ice in winter.
Daryl M (19:53:18) :”…I still question whether we are heading for an increase in the summer ice, since the winter maximum is not looking like it will it will set any records. In fact, it looks like it will be on the low side. So if the 2010 winter maximum is lower than normal, the summer minimum will be disadvantaged out of the gate.”
Note that winter maximum ice is geographically constrained, since ice growth in most directions is obstructed by coastline. Also, the mechanisms for growth and recession are vastly different. Winter maximum is not a perfect predictor of summer minimum.
Pamela Gray (19:40:29) :
“I want to understand the AO a bit more before I feel I have what it takes to predict it’s winds and pressure systems that long out. What do we know about the predictive signs of this thing going positive or negative? It is quite obvious that NOAA/NASA hasn’t got it down.”
True. I wish they would take some time to explain this:
http://www.cpc.ncep.noaa.gov/products/precip/CWlink/daily_ao_index/hgt.shtml
Fascinating.
Chris
Norfolk, VA, USA
“The exceptional melt of 2007 was not just caused by wind patterns, it was coupled with exceptionally clear sunny days too. The latter keeps getting forgotten in some quarters.”
While it is true that the weather was sunnier than normal, the ice did not melt in place. The transportation of ice past Greenland into the Atlantic was quite dramatic. Sunshine notwithstanding, wind was the primary cause. Also note that while is was sunnier, it was also a colder than normal summer.
2008, for example, was a warmer summer than 2007 was.
Lars (09:56:56) : In a few more weeks with this cold we can walk from Stockholm to St. Petersburg on ICE.
So, should we tell them to get “pointers” from the Danes about how to handle the situation? “Swedes on Ice” have an interesting history
😉
Steve Goddard (10:27:09) : The 2007-2009 minimums have been dominated by loss of ice in the western Arctic, not the east. Drift in the western Arctic has been close to zero this winter, and Bering Strait ice is above normal.
Um, from the North Pole, which way is “East” and which is “West” ??!?
Does “west” mean Alaska or Kamchatca? Does “east” mean Greenland or Svalbard? Or is Siberia “east” while Canada is “west”…
I guess “normal” here means the average of the years 2002- 2009?
“Normal” is lay mans term, approximately meaning “what I can remember and liked”.
Why is the extent of the current ice only higher than the 2007 satellite record minimum? If it isn’t floating/blowing out to the Atlantic, and the temperatures are well below freezing where’s the ice?
Show me the Ice!
E M Smith,
East/West is defined by the Greenwich Meridian. West of London are west longitudes, and east of London are east longitudes. Barrow, Alaska is at 71N 156W. Svalbard is at 76N 19E.
Norm,
Ice extent this time of year is not a good indicator of summer extent. Note that 2006 was lowest in February and second highest in September.
http://www.ijis.iarc.uaf.edu/seaice/extent/AMSRE_Sea_Ice_Extent.png
I’ve made available a simple version of a spreadsheet which is DIY calculation for Arctic sea ice deviation.
You have to download and add the new IJIS data, extend a couple of columns copy/fill and magic.
What you do with the result is your business. Plot of the whole set may pose a problem.
This is _daily_ data 1978 to date, long story which I won’t go into now, other than is compensated NASA stereo joined over common period 2003..2007 and IJIS continues. Can’t both be right and must be different projections, compensations works well.
Ice is low right now.
http://www.gpsl.net/climate/data/sea_ice/sea-ice-np-ext-daily-pub.zip
300k zip of .xls, no macros, is minimal data otherwise is large
>>Here’s a comparison between the last week of
>>Jan this year and in2007. >>http://i302.photobucket.com/albums/nn107/Sprintstar400/Drift2010vs07
Nice pictorial.
I bet all that movement towards and into N Canada and N Greenland is going to create a whole raft of very thick pressure ice.
.
Predicted value of the Sea Ice Index (extent) for September 2010 , estimated by the statistical method , is 5.55 (±0.62) x 10^6 km2 The method of the prognosis of the ice-extent in the Arctic was worked out (and is applied) in Dpt. Meteorology and Nautical Oceanography, Gdynia Maritime University (Poland).
Predictor for the prognosis is the index characterizing signal of the heat content in the subtropical zone of Northern Atlantic (DG3L – about the index DG3L and mechanisms of changes of the temperature in Arctic – look “Oceanic control of the warming processes in the Arctic – a different point of view for the reasons of changes in the Arctic climate” http://ocean.am.gdynia.pl/p_k_p/pkp_19/Marsz-Stysz-pkp19.pdf
Regards
aamarsz
My guess for the parlor game as of today is. . . . 4.85M km2 (2009 = 5.1M, 2008 = 4.67M). But sure, this year will be an interesting test that will add to our knowledge of AO impact and the maturation of “multi-year ice”.
At what point does “multi-year ice” become fully “mature” (as an insurance guy I think of this in claims-made risk rating terms for you medical doctors and dentists out there). My suspicion is it is around year four, but that is a gut feeling rather than a scientific analysis.
DMI shows 2006 February extent as the lowest on record and 2006 September extent as the highest.
http://ocean.dmi.dk/arctic/icecover.uk.php
Point is again that February extent tells you literally nothing about the thickness of the perennial ice – which is a key factor in how much ice melts during the summer. The extent graphs don’t provide much useful information until mid-June, when the years start to diverge.
‘Drift’ is this context is the movement of ice out of the Arctic Ocean into the North Atlantic as icebergs or sea ice flows. When the weather conditions are appropriate, lots of Arctic sea ice ends up in the North Atlantic flows South into warmer water and then melts.
Depletion of Arctic ice under such consditions is NOT A MELTING condition. It is an ice movement or ‘drift’ situation.
Thanks for the interesting data and analysis, and prediction Steven.
I find the use of anomalies regarding the Arctic somewhat specious. This is because it is largely landlocked. This means that as the ice fills the Arctic basin the area available for further ice extent is minimized. This biases the anomalies to be more weighted in the negative range. Since even no ice has occurred in the past, without NH glaciation, the upper boundry, or maximum, is limited. It is not a gaussian distribution.
The depiction of ice at CT for Feb. 9th in ’07 and ’10 seems to show far more density now as opposed to ’07.
http://igloo.atmos.uiuc.edu/cgi-bin/test/print.sh?fm=02&fd=09&fy=2007&sm=02&sd=09&sy=2010
I have complained about CT in the past, and notice it is rarely referenced by WUWT folks anymore. What I noticed in the past was the encroachment of the addition of snow into the arctic basin, making the sea smaller. That was in 2004, the loss of sea area pixels is ‘coincidentally’ equal to the step change in sea ice after 2004. In 2010, they have increased the size of the earth, but changed the perspective, it is not simply scaled larger. I will do a pixel count at some point and see if the scale of the sea matches that of the earth.
Steve Goddard (21:30:14) :
Phil,
Looks to me like TLT is 14,000 feet?
TLT = Temperature Lower Troposphere MSU 2 and AMSU 5
http://www.remss.com/msu/msu_data_description.html
Daily global average temperature at: 14,000 ft / 4.4 km / 600 mb (ch05)
http://discover.itsc.uah.edu/amsutemps/data/amsu_daily_85N85S_ch05.r002.txt
The 14,000ft refers to the straight-down view, however the weighting function for that view gives too big a contribution from the lower stratosphere. For each channel there are is a series of side views at various angles that shift the weighting functions to lower altitudes, the MSU TLT was made from a combination of these views to eliminate the stratospheric cooling. AMSU have a similar arrangement (more views), RSS have a link to a paper on their website describing the procedure they used to derive a comparable AMSU TLT. UAH does something similar for their monthly update but the daily on-line data is the unmodified channel 5 (see Spencer’s website).
This procedure is invalid near the poles which is one reason why data is not reported from there. The maximum in the TLT (MSU) weighting function is close to 2km over land and drops off to about 10% of max at ~10km.
Steve Goddard says:
“I’ve never seen any evidence of sunspot count affecting ice extent. The 1980s had unusually high ice extent and age, when solar activity was at a 300 year high.”
——————
Steve, not necessarily “sunspot number,” but a more active sun, especially since our sun has been so cool for an extended solar cycle low, which had many starting to talk about the Maunder Minimum. Most scientists will admit an active sun will surely emit more energy, even if the CME’s and other solar flares are not in the direction of our Earth, there still must be an increase in irradiation, no matter how small.
I beg to differ with your remark about the 1980’s being the 300-year high of solar activity, since Solar Cycle 19 peaking about 1958 was the record, and we saw solar maximum activity between 1950-2004. Reconstructions of TSI goes back to 1611, and there is little doubt that the second half of the 20th century was by far the most active for TSI in the past 400 years.
While you might disagree with certain global temperature measurements by NASA/NOAA, the latest +0.72 degree C. Jan. 2010 global temperature anomaly that dr. roy spencer just added to his graph is quite telling, and even has amazed him. To me, this is quite interesting while at a time of such low solar activity and TSI. http://www.drroyspencer.com/latest-global-temperatures/
My point is, the general consensus of the cause of the Maunder Minimum was extremely low solar activity and TSI coupled with above average volcanic effects, the possible increase in solar irradiance just since the 17th century — as small as it might be — seems to be having an effect of warming our planet. While it seems to also be the consensus that the Arctic is warming much more than the planet as a whole, especially during this winter of extreme negative Arctic oscillation, I seem to think that we’re about to experience some more rapid changes now that the sun has emerged from its funk, and Solar Cycle 24 is headed upwards to the high — maybe not in 2010, but surely in 2011, 2012 and 2013. We’ll see.
Oh. Hmm. I just realized the implication of a change from positive to negative of the AO is actually a reduction in what the March maximums would otherwise be (and alternately a change from negative to positive would tend to increase the March maximum).
So being on a trend for a lower March maximum this year (negative AO) than last year (positive AO) could *possibly* be explained by that, while still tending towards a greater minumum.
Still sticking with my 4.85M prediction for now, but I’m a little more comfortable that Anthony and Steve may prove to be right in the end.
Here is the link showing the extension of the plot below (-4). It briefly hit (-5) and currently at about (-4.3).
http://www.cpc.noaa.gov/products/precip/CWlink/daily_ao_index/ao_index_mrf.shtml
So if there was a positive AO all year until about early August and then a negative AO until late September that would maximize this totally artificial and almost absurd metric “15% coverage ice extent” that only exists because of our limited ability to technologically have *some* historic (hah! Decades “historic”) metric to hang our hats on.
Oy vey.
No problem, Steve and like you say, it supports your analysis.
Steve Keohane,
That CT map does show very clearly how concentrated the ice is now, thanks.
Well I look at the JAXA ice graph more or less daily; mostly out of fascination; and no way do I want to get in the game of prediction of future data. I’m just looking at what has apparently happened since 1979. So I’ve read most of the explanations for the 2007 summer minimum (actually fall), and all that is interesting. I’m happy that people keep track of that. I also look at the DMI Arctic temperature which is even more fascinating; specially those wild five degree up and five degree down daily swings. Dare I suggest that those graphs scream of Nyquist sampling violation ? The whole of the Arctic can jump five degrees C in a day. Well I guess it is only north of +80 Latitude, so not really the whole of the Arctic.
Almost seems like just weather moving in, rather than climate change.
Phil talks about the ice thickening slowing due to the insulating effect of the thick ice abobe the ice/water interface; which almost by definition is underwater; and that doesn’t seem to be a debatable issue. Along the same line though, the growth of ice at that underwater interface; which by definition should be at the freezing point of sea water; also results in the expulsion via the segregation coefficients, of both salts, and CO2 from the growing solid. So I believe the boundary layer must be somewhat more saline than the bulk of the sea, and that is going to depress the freezing point of the boundary layer even further, so that too, must be a factor in the slowing of thickness growth, once a surface ice layer is formed.
I would think that the open surface water, should be somewhere near Henry’s law equilibrium as far as dissolved CO2 goes, so the expulsion of CO2 from the growing ice, could result in venting to the atmosphere, of excess CO2. Well we know from NOAA three D graphs, that the atmospheric CO2 over the North Pole cycles with about 18 ppm p-p amplitude. That 18 ppm decline seems to happen in about 5 months, while the recovery; presumably during the melt season takes seven months.
That doesn’t look like any 200 year residence time to me. If I took “residence time” to mean about five time constants, that would make for a 40 year time constant, and there’s no way, that a reduction of 18 ppm in 5 months, can go on for 40 years.
Remember in ordinary exponetial decay, that governs many kinds of physical processes, the INITIAL rate of change following a step change in the driving force, is such as to complete the complete transition to the new state in one time constant. So if that 18 ppm in 5 months was a linear decline, it would go 100 ppm (the present excess roughly) in 5.5 times five months or two and a bit years. But that 5 months fall is a bit curved rather than straight so the initial rate is even faster. So I would say the time constant is more like two years, than 40 years.
However a friend at Scripps in La Jolla, who is a CO2 expert, says that that NOAA graph is simulated, and not really measured data; so it is more of an “artists impression” than real scientific data. Maybe the Mauna Loa Data is real, but that global pole to pole 3-D graphs is not. Maybe that is why NOAA pulled it, and hid it away. But I have about a dozen hard color copies of it, so it isn’t going to stay lost.
John Silver:
“I guess ‘normal’ here means the average of the years 2002- 2009?”
————
Why would anyone only incorporate the last 7 years, when scientists at the NSIDC have been using satellite imaging since 1979 to monitor the Arctic sea ice extent?
——-
Looking over the entire season, this winter continues the recent trend of slower Arctic ice growth. During the 1980s, the average rate of ice growth for January was approximately 90,000 square kilometers (35,000 square miles) per day. In comparison, during the 1990s, the average rate of January growth fell to about 40,000 square kilometers (15,000 square miles) per day. Including 2010, the average for the 2000s is 39,000 square kilometers (15,000 square miles) per day. http://www.nsidc.org/arcticseaicenews
——–
During January 2010, ice extent grew at an average of 34,000 square kilometers per day, continuing the 3.2% decline per decade.
re: your poll of vistors (“What will the 2010 Summer Arctic Sea Ice Extent Be?”)
One of the options is “It will be normal.” Like Daryl M and John Silver, I’d like to know the definition of normal. I imagine most WUWT readers (and those expected to pay for “carbon reduction strategies, too) would like to know as well.
I contend that we don’t know what the “normal” extent of Arctic sea ice is, nor do we know it’s full range for a reasonable period of time (beyond 30 years)…
What we DO have is a very short period of “comprehensive” historical records, with NASA’s (the AMSR-E data) being the shortest, but most accurate (reportedly), and the military’s (NSIDC) being longer but less accurate. (This short history of direct measurements is also the case with instrument records for temperature and atmospheric CO2.)
The satellite records only go back 30 YEARS [as pointed out by Alexej Buergin as well]. That’s far too short to really make any realistic assessment as we have nothing of similar accuracy or precision against which to compare for other periods, such as the 30’s and 40’s, but also versus the LIA, MWP & RWP. As I’ve tried to research the ice extent issue for some time, it’s clear that even choosing which statistical analyses to run is problematic. Do we, for example, assume that either the NSIDC or AMSR-E records reflect the REAL range, average and standard deviations for the entire range of conditions that have ever existed,or are they merely a subset of a larger collection for which we simply do not have records? If it’s the latter (which is I believe is more likely the case), how variable is the extent of ice in the Arctic? That’s the $10 billion question.
Statistical measures are based on assumptions of what the underlying date MIGHT look like, assumptions that could well be quite wrong. And we do know what may happen when we “assume” things. Plus, what period to pick — IFF we could just step into the time machine and create a dataset in the past– is problematic too. Hypothetically (this is a rhetorical question), would we expect that there was a small amount of Arctic Ice 70,000 years ago when the Wisconsonian Glacier was modifying the path of Ohio River at Cincinnati? Does using data such as that starts at the Little Ice Age make sense (since it’s been “warming” since)? Or would we want data that go back only somewhat farther, such as back to the MWP or the Roman Warm Period?
Unfortunately, we simply do not have comprehensive accurate and precise measurements (not proxy data) for Arctic Ice Extent for more than 30 years. We cannot therefore compare and contrast different periods of ice extent against each other or against other data (atmospheric temps and CO2, for example) as a means to see if there might be correlations.
———–
There’s also one other little, itty, bitty problem: “long-term” decreases in Arctic sea ice extent over time merely indicates “warming” but not the CAUSE of the warming, just as increases in ice extent might indicate “cooling.” Causation remains the object of hypothesis, conjecture, theory and great debate. Ice extent records, short as they are, tell us nothing about the cause, be it natural, anthropogenic, or some mix of the two.
Eugene Langschwager, Executive Director
Climate Science Coalition of America
http://www.climatescienceamerica.org
AndyW:
“Antarctic sea ice is increasing. The trend is very slightly up, but still not by very much at all. the last two years have been on the average for instance.”
————–
Again, why would anyone want to take a year or two out of context of the past 30+ years of satellite imaging to get an increase in Arctic sea ice extent?
The overall trend is a steady decline, whether it’s 30+ years of winter maximum or summer minimum, so comparing 2009/2010 to one or two years previous, is hardly scientific — just skewed results.
While I certainly don’t think we’ll see anything close to a record minimum in 2010, I’ll have to disagree on the prediction of Arctic sea ice recovery this year, even with more second-year, thicker ice.
To use a tired cliche here, is there not a 600 pound gorilla in the room: ocean and ocean currents, and their decadal variations? Not SST – which comes from the upper 1mm of the water column – the rest of the water column from 2mm depth to the bottom, where practically all the climate energy resides. All this discussion about Arctic ice seems to assume only air temps and solar variations were significant. Ocean currents at all depths (deep circulation can be very different from upper circulation) will transfer much more energy around the Arctic than air or even sun in terms of rate at a given time.
Barents Sea variation of up to 4C (upper few 100 m) in correlation with the AMO indicates the oscillation is linked variation in the North Atlantic Drift. Other currents no doubt vary cyclically around the Arctic.
Solar input will of course affect ocean heat over long timescales. The atmosphere may be a passive player between ocean and sun.
doc lakota,
It would appear that the minimum of 2007 was the result of a mostly positive Arctic Oscillation since 1989. It’s not much of a stretch to suggest that this was caused by a multidecadal process which now seems to have swung the other way. I understand why you say the long term trend is down, but if someone identifies why it was down and then changed to up in the last couple of years and that it will continue an upward trend for the same reason then that’s fine too.
Personally I think that very thick ice was formed this year and that Mr. Goddard’s prediction will be fulfilled.
Crosspatch said
“While it is true that the weather was sunnier than normal, the ice did not melt in place. The transportation of ice past Greenland into the Atlantic was quite dramatic. Sunshine notwithstanding, wind was the primary cause. Also note that while is was sunnier, it was also a colder than normal summer.”
From NSIDC
“Another factor that conspired to accelerate the ice loss this summer was an unusual atmospheric pattern, with persistent high atmospheric pressures over the central Arctic Ocean and lower pressures over Siberia. The scientists noted that skies were fairly clear under the high-pressure cell, promoting strong melt. At the same time, the pattern of winds pumped warm air into the region. While the warm winds fostered further melt, they also helped push ice away from the Siberian shore.”
http://nsidc.org/news/press/2007_seaiceminimum/20071001_pressrelease.html
So the actual main melt reasons was not ice being pushed past Greenland and out, it was due to clear skies, warm winds ( melting in situe) and those same winds pushing ice away from Siberia to the north so reducing the extent.
Andy
Do we know what the AO was like in 2006? Because 2006 is an interesting comparison if you look at JAXA. It’s the lowest March maximum in the 2002-2009 record, but well above 2007-2009 September minimums.
geo (22:32:20) :
Do we know what the AO was like in 2006? Because 2006 is an interesting comparison if you look at JAXA. It’s the lowest March maximum in the 2002-2009 record, but well above 2007-2009 September minimums.
As pointed out above the March maximum doesn’t tell us much, 2006 and 2007 were very close in March: 13.78 vs 13.94 but quite different in the summer.
Here’s an addition to the Ice Age figure to include 2009, note that all the ice flowing out of the Fram is multi-year ice which will necessarily be replaced with first year ice.
http://nsidc.org/images/arcticseaicenews/20091005_Figure5.png
Phil,
The ice flowing out into the Fram Strait is almost always multi-year ice. That is why Arctic ice never gets to be much more than about five years old.
Steve Goddard (08:16:39) :
Phil,
The ice flowing out into the Fram Strait is almost always multi-year ice. That is why Arctic ice never gets to be much more than about five years old.
Exactly, and there’s less and less of that every year so the amount lost through the Fram in winter is a larger fraction of what’s left, which is being replaced by first year ice.
Phil,
3+ year old ice is most likely going to be more extensive in 2010 than it was in 2009.
Steve Goddard (09:55:27) :
Phil,
3+ year old ice is most likely going to be more extensive in 2010 than it was in 2009.
Not a chance Steve.
I haven’t spent any time looking at the arctic detail geography, or where and when the multiyear ice forms or gathers; and frankly I don’t intend to much, because there is only so many hours in a day; so I’ll leave that to those who are up on it.
But it does seem to me, that the basic question of whether the arctic sea ice acts as a significant contributor to the albedo, or whether the open water acts as a significant near black body radiation sink, is largely a question of ice acreage, and so far, even in 2007, despite the large ice loss, the fall/winter period, did grow lots of first year ice; which basically switches the BB sink to an albedo reflector.
Then if the area of open sea does increase, and its temperature, that would seem to encourage, more evaporation, which presumably becomes precipitation somewhere; possibly depositing lots of snow, either on existing sea ice, or the surrounding land; of which there is an abundance in the arctic. So what really happens to the total planetary albedo, with that ice loss, and what of the increased CO2 uptake, in the larger open water areas (cold water too).
Well I’m not into either prediction or projection; especially about the future; but I will watch with interest.
I’m presently reading Clive Cussler’s Arctic Drift “whodunit”, which he wrote along with his son Dirk.
I haven’t determined if Cussler is a AGW believer or not. He did make some mistakes in the book.
He has a German WW-II in his hangar garage, along with his Ford Trimotor,a nd a lot of antique or classic cars; but it isn’t an ME-162 as he says in the book; more likely to be an ME-262.
Then he has Dirk Pitt’s son and daughter measuring CO2 laden water sampled from the inside passage off Vancouver (where it is now snowing); and declaring it to be as acidic as “battery acid”.
I’m not a chemist; but I somehow don’t think you can get enough CO2 fizz into water, to give it the same pH as H2SO4 in a car battery.
Maybe some of the Chemexperts, can clue me in on the truth about carbonic acid.
And Cussler seems to think that you can get hydrogen out of water, and carbon out of CO2 without expending more energy than you get if you burn either of those as a fuel. Now even catalysed and sunlight aided; those decomposition processes (if real) still don’t overcome the basic problem of free clean green renewable solar energy (sunlight); It is too damn diffuse to collect any sizeable amount of it economically; well without totally destroying the pristine environment of course.
It will be interesting to find out if Cussler can get us out of this fix. In the course of his book, he did manage to nearly wipe out those crazies who went ice fishing back in 2008 or whenever that was to measure the ice thickness; was that the Donner party ? In the book, the twin Otter never picked them up, but a renegade warship ran right through their science lab out there on the first yeqar ice. Unfortunately or maybe not, three of them were picked up by the books heroes.
I’m going to say slightly less than 2009 but more than 2008. I’m basing this off of two reasons.
The first is persistence. The long term trend puts us slightly below 2009. Also, ice has never recovered a million sq km and remained at such high levels. All previous 1 and 2-yr increases in ice extent were followed by a decrease. Through the 30 yr NSIDC record it has never increased for 3 straight years.
The second is the El Nino state and high global temperatures. The past 5 years ice has tracked the ENSO index perfectly. Nino summers had less extent than the previous year, Nina summer has more. Summer 05 was a fading Nino, ice extent decreased. Summer 06 was a fading Nina, ice extent was higher than previous years. Summer 07 was a fading Nino, ice extent decreased (dramatically). Summer 08 was a Nina, ice extent increased. Summer 09 was a fading Nina, ice extent increased. If you go back far enough in time this correlation breaks (03 was a mod-strong Nino and had very high extent). But it seems to have worked for the last 5 years particularly well, and there may be a significant correlation on longer timescales but I haven’t seen such a study. The relationship between high global temperatures and ice melt is obvious.
Phil,
There is no question that there will be more three year old ice than last year.
In 2007, essentially all of the first year ice melted. That led to there being almost no three year old ice in 2009. In 2010, the 2008 first year ice has it’s third birthday. So yes, we will see an increase in three year old ice in 2010.
@Phil. (05:50:21) :
AO status + March maximum should tell us something tho, right? That’s why I want to know if the AO was positive or negative in the winter of 2005-2006.
If I have grokked the conversation thus far, for a given March maximum amount if you know that’s been compacted by a negative AO, or spread by a positive AO, then you can say something useful about its comparison to other March maximum amounts as to their impact on the September minimums. . . if you know those other March’s AO status as well.
Said another way, presumably a larger March maximum is still good if it goes along with a strongly negative AO –that’s “best of both worlds”. And a small March maximum with a strongly positive AO would be “worst of both worlds”.
FergalR:
“Personally I think that very thick ice was formed this year and that Mr. Goddard’s prediction will be fulfilled.”
———–
You could very well be correct here, especially since the negative AO favors more multi-year ice, depite the warmer winter. Also, even though the Arctic sea ice extent was lower at the end of January than it was in Jan. 2007, there’s still one and half months of growing this winter.
What also has me concerned is the relative thickness of the ice, which is also in decline, no matter whether it is first-year or multi-year ice according to NOAA. I hadn’t seen the longer historical record of ice thickness from declassified sonar measurements from US Navy submarines, which indicates a decline in thickness. The overall mean winter thickness of 3.6 m in 1980 can be compared to a 1.9 m mean during the last winter of the ICESat record—a decrease of 1.7 m in thickness.
While the multiyear ice extent was similar in March 2008 and 2009, its distribution was quite different. More specifically, in 2008 there was a significant amount of multiyear ice the Beaufort Sea and in 2009 there was a large amount of multiyear ice the central Arctic Ocean.
http://www.arctic.noaa.gov/reportcard/seaice.html
Steve Goddard (12:45:31) :
Phil,
There is no question that there will be more three year old ice than last year.
In 2007, essentially all of the first year ice melted. That led to there being almost no three year old ice in 2009. In 2010, the 2008 first year ice has it’s third birthday. So yes, we will see an increase in three year old ice in 2010.
Maybe so but that wasn’t the original statement.
I’m not sure where people are getting the idea that the Arctic has been warm this winter. NSIDC says in their February news report that there were “cool temperatures over most of the Arctic Ocean in January”
February 3, 2010
Despite cool temperatures over most of the Arctic Ocean in January, Arctic sea ice extent continued to track below normal.
http://nsidc.org/arcticseaicenews/index.html
In mid January, the Arctic had the coldest average temperature it has seen since 2004.
http://ocean.dmi.dk/arctic/meant80n.uk.php
Phil,
3+ year old ice should nearly double this year.
http://nsidc.org/images/arcticseaicenews/20090406_Figure5_thumb.png
Look at the right edge of the lower graph to see why.
Steve Goddard (18:40:35) :
I’m not sure where people are getting the idea that the Arctic has been warm this winter. NSIDC says in their February news report that there were “cool temperatures over most of the Arctic Ocean in January”
Maybe because this site links to a site that shows that the last ~100 days of 2009 was ~5ºC over average? Not to mention the MSU data.
Phil,
MSU doesn’t cover much of the Arctic Basin, and the DMI graph looks neutral for January.
Are you always this contrary?
Is there a URL or two where a readable table of the numeric values of daily ice extents (or areas) is updated daily? There must be somewhere, because the charts are updated daily, but I haven’t been able to find a readable source for the data the charts are based on. TIA.
Roger,
So far as I know only the IJIS/JAXA data is published daily.
There is a provisional figure in plain view on the web page, plus the whole data in CSV format directly available. This is for Arctic extent only.
Work I have done shows that ice area and extent deviation figures are the same. Antarctic sea ice, a ring around a large landmass, is of low interest, doesn’t change much.
If you look further up this web page I posted reference to a dataset I have made available. This is so far as I know the only complete 1978 through to current daily dataset. This was done by joining a stale dataset (ceases Dec 2007) with IJIS/JAXA data and can be validly updated every day by you if that is what you want. Validity/accuracy: best I could do at the time but it hasn’t been reviewed by others.
Producing plots seems somewhat pointless. It takes time in return for nothing. A better move is try and make things easily accessible, enable other people. Not many will actually do anything.
A long discussion here is inappropriate. If you want to talk privately about this email me tc gpsl.net if you can get past the spam shark, if not, try again.
Tim,
Antarctic sea ice changes by nearly 14 million km2 between the winter maximum and the summer minimum.
http://arctic.atmos.uiuc.edu/cryosphere/IMAGES/seaice.recent.antarctic.png
Arctic ice changes by less than that – about 11 million km2.
http://arctic.atmos.uiuc.edu/cryosphere/IMAGES/seaice.recent.arctic.png
Antarctic ice, being further from the pole, reflects more sunlight than Arctic ice, and thus has a stronger influence on the earths radiation balance.
Steve Goddard (22:07:46) :
Phil,
MSU doesn’t cover much of the Arctic Basin, and the DMI graph looks neutral for January.
MSU covers up to 82.5ºN which covers virtually all the Arctic that melts, and ‘winter’ is more than just January. And a week below average in January doesn’t fit a description of ‘neutral’ (for the first time since September). The parameter that is correlated with sea ice thickness is freezing degree days:
thickness ≅ √FDD
So since September the FDD is ~500 degree days below average which should lead to less ice growth.
http://nsidc.org/seaice/processes/thermodynamic_growth.html
Are you always this contrary?
You asked a question and I answered it, what’s contrary about that?
Roger Knights (02:38:00) :
Is there a URL or two where a readable table of the numeric values of daily ice extents (or areas) is updated daily? There must be somewhere, because the charts are updated daily, but I haven’t been able to find a readable source for the data the charts are based on.
http://www.ijis.iarc.uaf.edu/seaice/extent/plot.csv
See here for site policy:
http://www.ijis.iarc.uaf.edu/en/sitepolicy.htm
Steve,
The annual change tends to constant.
I have used shorthand but without a suitable upload facility here I could not show the reason why I said that. I did consider a paper, doesn’t seem any point.
Quick check here nothing public so I’ve put up a quick page here
http://daedalearth.wordpress.com/sea-ice-variation/
Of course I might be wrong.
Phil,
Serreze predicted that 90N would be ice free in 2008.
Steve Goddard:
“I’m not sure where people are getting the idea that the Arctic has been warm this winter.”
“Ground temperatures in Canada and Greenland were above normal, but not that much.”
—————-
Steve,
Is it all semantics to figure out the difference between warm, cool and cold? Obviously, it should be downright cold during polar darkness, and low temperatures mean that the ice generally refreezes to about the same boundaries each winter. You seem to repeat over and over again about multi-year ice, which I have to agree we’re seeing in the Arctic, but nobody has addressed the fact of the decline in thickness of all Arctic ice, whether it is first-year or multi-year ice. Do you disagree with that decline since 1980 according to this NOAA report card?
http://www.arctic.noaa.gov/reportcard/seaice.html
January 2010 Global Tropospheric Temperature Map
February 9th, 2010
Here’s the UAH lower tropospheric temperature anomaly map for January, 2010. As can be seen, Northern Hemispheric land, on a whole, is not as cold as many of us thought. Below-normal areas were restricted to parts of Russia and China, most of Europe, and the southeastern United States. Most of Canada and Greenland were well above normal.
The global-average lower tropospheric temperature anomaly soared to +0.72 deg. C in January, 2010. This is the warmest January in the 32-year satellite-based data record.
http://www.drroyspencer.com/
According to roy spencer, “most of Canada and Greenland were well above normal” (+7.5 C in places) so I’m not sure what your “not that much” really means. Personally, I guess I’m not quite as obsessed with Arctic sea ice extent as you appear to be, and just don’t have the time to devote comparing data from different sources. Seems as if many like to deride the NSIDC for some reason, but I’ve seen apologies to scientists at the NSIDC for wrongful blame as well.
February 3, 2010
Despite cool temperatures, ice extent remains low
Despite cool temperatures over most of the Arctic Ocean in January, Arctic sea ice extent continued to track below normal. By the end of January, ice extent dropped below the extent observed in January 2007. Ice extent was unusually low in the Atlantic sector of the Arctic, the one major area of the Arctic where temperatures remained warmer than normal.
Ice extent remained below normal over much of the Atlantic sector of the Arctic, including the Barents Sea, part of the East Greenland Sea, and in Davis Strait. The only region with above-average ice extent was on the Pacific side of the Bering Sea.
http://nsidc.org/arcticseaicenews/
So to answer your question, I guess I’m getting the idea of a warmer than normal Arctic from both the NSIDC and Roy Spencer, and although we can both agree that it’s too early to make predictions of how the rest of the winter will play out in the Arctic, there’s going to be quite a bit of speculation as to what September 2010 will look like. Seems as if a simple coin toss would work right now with all the different variables and opinions.
Steve Goddard (07:19:23) :
Phil,
Serreze predicted that 90N would be ice free in 2008.
Are you sure? According to your link above what he said was:
“The issue is that, for the first time that I am aware of, the North Pole is covered with extensive first-year ice – ice that formed last autumn and winter. I’d say it’s even-odds whether the North Pole melts out,” said Dr Serreze.
Phil,
Mark Serreze posted a comment on one of my articles a couple of years ago either on WUWT or The Register, that he got that prediction wrong. I don’t have time to search for it now though.
I did find this :
http://alaskareport.com/news68/x61385_north_pole_ice.htm
doc,
Land temperatures in Canada and Greenland have been above normal. That isn’t the same as the Arctic Basin above 80N where the sea ice forms though.
Phil:
“So since September the FDD is ~500 degree days below average which should lead to less ice growth.”
http://nsidc.org/seaice/processes/thermodynamic_growth.html
———-
Since the only region with above-average ice extent was on the Pacific side of the Bering Sea during January, I’m thinking that all this talk about multi-year ice is completely overblown. Even if there is more multi-year ice by the end of March 2010, wouldn’t NOAA’s assessment of a decline in ice thickness since 1980 be a factor, especially with the trend over the past decade of reduced extent of multi-year ice?
Seems as if some need to jump on the bandwagon of taking a couple of years out of context of the entire picture, even if it is only 30+ years of satellite imaging. I for one, would rather continue looking at the entire “big picture” and use all the data available, instead of using a starting point of 2002, 2005 or even 2007.
If multi-year ice is thinning like NOAA is reporting, and just not having the resilientcy it had decades ago, I would think that even multi-year Arctic ice would be more susceptible to a warmer year after a couple of cooler years.
“The declines in total volume and average thickness are explained almost entirely by thinning and loss of multiyear sea ice due to melting and ice export. These changes have resulted in seasonal ice becoming the dominant Arctic sea ice type, both in terms of area coverage and of volume.”
http://www.arctic.noaa.gov/reportcard/seaice.html
“”” Steve Goddard (06:18:54) :
Tim,
Antarctic sea ice changes by nearly 14 million km2 between the winter maximum and the summer minimum.
http://arctic.atmos.uiuc.edu/cryosphere/IMAGES/seaice.recent.antarctic.png
Arctic ice changes by less than that – about 11 million km2.
http://arctic.atmos.uiuc.edu/cryosphere/IMAGES/seaice.recent.arctic.png
Antarctic ice, being further from the pole, reflects more sunlight than Arctic ice, and thus has a stronger influence on the earths radiation balance. “””
Steve, the Antarctic Winter nights, also have the earth further from the sun; which might encourage more ice (extent) but lower sunlight to reflect off it. Then in the summer you would have the reverse, of a higher southern summer irradiance. I have also wondered about the annual loss of Antarctic sea ice, simply from the fact that the southern ocean sloshes all around it along with daily tides; whereas, the Arctic ice perimeter, is largely land locked.
Can you make anything of those specific differences; or is there data to take those into account ?
doc lakota (08:27:33)
“So to answer your question, I guess I’m getting the idea of a warmer than normal Arctic from both the NSIDC and Roy Spencer, and although we can both agree that it’s too early to make predictions of how the rest of the winter will play out in the Arctic,”
I agree that Steve’s imprecise remarks regarding arctic cold/warm and ice cover aren’t very helpful. But he is not wrong about NSIDC bias toward warming. Even though surviving summer ice extent expanded in 2007-08 and again in 2008-2009, they downplayed this in their reports by stating they are the second lowest and third lowest rather than saying there has been some 25% ice area recovery which is substantial. I have lost the link but the Wegener Institute in Germany did a broad regional survey at the same time the ridiculous Catlin Arctic survey was reporting all the thin ice over the Arctic basin. The German team found that the arctic basin ice was much thicker than they had expected. Believe me this thin arctic ice stuff was only cooked up by NSIDC when they were broadsided by rapidly expanding ice in the 2007-2008 winter and then again in the following winter.
The logic here is simple. First year ice that survived in the summer of 2008 became second year ice in 2000 freezup and I think to steal part of Sereze’s quote “I’d say it’s even-odds …” that it will become 3rd year ice in freeze-up, fall 2010 , the 2009 would become 2nd year ice. Check out the Wegener Institute who did a real survey last winter and don’t buy into this thin ice rationalization,
Steve Goddard (09:09:42) :
doc,
Land temperatures in Canada and Greenland have been above normal. That isn’t the same as the Arctic Basin above 80N where the sea ice forms though.
But that’s exactly where DMI says it’s been significantly above normal since September!
Steve Goddard:
doc,
“Land temperatures in Canada and Greenland have been above normal. That isn’t the same as the Arctic Basin above 80N where the sea ice forms though.”
———–
Now wait just a cotten-pickin’ minute….is that your arbitrary line or the generally accepted demarcation line, since there’s open seas much further south all the way to the Arctic Circle, like the Beaufort Sea, East Siberian Sea, Barents Sea, Lapter Sea, Kara Sea, Greenland Sea and even the Chukchi Sea and Baffin Bay? I’ve always been under the assumption that “the Arctic” was all that land and sea above the Arctic Circle at 66.56083° north of the Equator.
Also, do you agree or disagree with NOAA’s claim that there exists a downward trend since 1980 of the thickness of all Arctic ice, no matter whether or not it is first-year or multi-year ice?
I found the Mark Serreze post where he says that he bet on an ice free North Pole.
http://wattsupwiththat.com/2008/08/15/arctic-ice-extent-discrepancy-nsidc-versus-cryosphere-today/
doc,
Arctic ice thickness and extent decreased significantly leading up to 2007, and has been increasing again since then.
Phil,
We are entering the coldest part of the Arctic winter now and temperatures are plenty cold in the Arctic.
http://ocean.dmi.dk/arctic/meant80n.uk.php
The point of this article is that a key factor in predicting summer ice extent is winter drift, rather than winter temperature. It makes little difference if the air temperature is minus 30 or minus 35 C during February.
@Tim & Phil:
Thanks. I’ve managed to open the file below using text edit:
http://www.ijis.iarc.uaf.edu/seaice/extent/plot.csv
But the numbers lack internal commas and are hard to read out of the box (small size). Is there a better program I could use to open the file with?
Roger Knights (10:49:35) :
@Tim & Phil:
Thanks. I’ve managed to open the file below using text edit:
http://www.ijis.iarc.uaf.edu/seaice/extent/plot.csv
But the numbers lack internal commas and are hard to read out of the box (small size). Is there a better program I could use to open the file with?
It opens fine with Safari for me but since you’re having trouble open it the way you’re doing now then save it as a ‘.csv’ file which you can then open with Excel and format any way you want.
@Phil.: Thanks, I’ve opened it in both Excel and Safari.
The pack is starting to grow again at a better rate, even tho the AO is still strongly negative, which I feel better about. Logically you’d expect a transition in the AO from positive to negative to reach some practical limit of compaction and then start to grow faster in total extent again –wouldn’t you?
Thanks, nice!
I think that this year will show lower sea ice in the Arctic , but not record lows , but could be close the thicker ice will slow the melt , the big variable will be if the wrmer water sitting off the pacific coast makes its way further north we have had a much warmer sea this winter on the pacific, the atlantic is mising ice allowing the sun again to warm the water open water heats ice reflects, Allso Canada on a whole has experianced the warmest winter on recoerd as a country and has extremly low snow levels on land so the continent will heat more than usuall this summer so the big facter will be air and ocean currents. I work on the water everyday and all I know is we are seeing much warmer water last summer was crazy warm in Canada yes -30 is cold but nothing to what we are used to