UPDATE: Easy come, easy go, the sharp decline has popped back up to near normal in the space of a couple days. See the end of the story for update.
According to the Danish Meteorological Institute, Arctic temperatures are currently below 238K (-35.15 degrees Celsius or -31.27 degrees Fahrenheit)
That is more than five degrees below normal (the green line) and the lowest reading since 2004. The slope of decline has also recently been quite sharp, dropping from 252K on January 1, a drop of 14 degrees in 22 days.

Source: http://ocean.dmi.dk/arctic/plots/meanTarchive/meanT_2010.png
For an interactive view, showing historical data see:
http://ocean.dmi.dk/arctic/meant80n.uk.php
The last time temperatures were this low in the Arctic was in February, 2004, where the 80N temperature reached 236K.

Source: http://ocean.dmi.dk/arctic/plots/meanTarchive/meanT_2004.png
In other news, temperatures in both the Arctic and Antarctic are well below normal.

Source: http://www.esrl.noaa.gov/psd/map/ANIM/sfctmpmer_01a.fnl.30.gif
h/t to Steve Goddard
UPDATE: Quick rebound from the coldest temperature since 2004, will it oscillate back?

It’s weather; not climate. Move on. Nothing to see here 😉
Now we check Hansen’s maps for the real truth…
But what about the UAH satellite? Still way above 20 year record territory.
yes, this morning I was looking at this, however still few years, isn’t it?
1992-1994-2004, …
and moreover there are sharpest moments in previous years.
no conclusions by now, I think.
Seems like the cold we had in the middle lattitudes has retreated back to Arctic.
US, Siberia and southern Canada aren’t as cold as they were a couple a weeks ago.
Arctic ice coverage looks normal..
http://www.ijis.iarc.uaf.edu/en/home/seaice_extent.htm
The real test this year, will to be see what the summer ice minimum is !!
Remarkable indeed (along with the generally cold NH winter) in a year with perihelion on Jan 7.
Funnily enough I was looking at the last few years of these graphs just today. 2007 was the same as every other year in the decade. Doesn’t that kinda prove that it was nothing to do with any kind of warming?
Sorry O/T. Battery problem doesn’t stop declaration of proof of rapid melting in the arctic! http://www.telegraph.co.uk/earth/earthnews/7053637/Pen-Hadow-admits-battery-was-the-problem-on-Arctic-climate-change-expedition.html
Remember the “Watts effect”? You posted about this site last year (late spring?), when it had been hovering around 273 (freezing/melting) as the cause for arctic ice recovering almost to normal. Boom; within a day or two, the trace moved up to the green line, and ice melt resumed.
I wouldn’t get too worked up about a short up or down spike. It’s a global shell game (not meant to be derisive). If the colder air floods south and freezes Chicago and all the way down to Florida, plus Europe and China, then warmer air moves into the polar regions. When the cold air returns north, the polar area cools off, but the temperate zones warm up to normal levels.
Interesting that ice cover extent slowed down despite the cold. Probably the ice is being compacted by winds. This generates thick ice and open water, exposed to severe cold, will freeze very quickly as soon as winds stop. We are on a good way to see summer minimum above 2007, 2008 and 2009.
And the green, “normal” line is a 50 year average, from 1958 to 2008.
At the same time the European arctic has been very warm. The weather this winter has pushed cold air into much of Europe, while warm air has made it into the arctic. So far in January the temperature has been more than 10C warmer than usual at Svalbard airport (78N). The previous precipitation record for January for this arid place has been shattered. It was 36.1 mm and has of yesterday, more than a week remaining, it was 56.1 mm. The old daily record, 11.2 mm, was also shattered: 16.9 mm. Temperatures have reached +5.0C. This sometimes happens this far north in January, but it’s not that common. Much rainfall has frozen on the ground and has shut down the airport for days.
If we are to believe that the weather and climate have been dead stable since the last ice age, this is certainly alarming. Or perhaps this is simply ordinary weather that climate models fail to model.
Now it is low after having been several degrees over the reference for the last part of 2009. Don’t make the same blunder as the warmists. How about the sea ice extent for example?
” The slope of decline has also recently been quite sharp, dropping from 252K on January 1, a drop of 14 degrees in 22 days.”
Has anyone else noticed that the last daily temperature on the DMI graph for 2009 appears to be equal to the mean, 243K, yet the next day (Jan 1 2010) the temperature jumped to over 250k.
Jumping from 243K on 31 December 2009 to 252K 24 hours later, with the 1 January value suggesting that the day previous was 251K.
One of these graphs is wrong.
Remember this is modeled data! so beloved of AGW
If you check out the last few months of 2009 on the COI page it is notable that the modeled temps are way above average!!
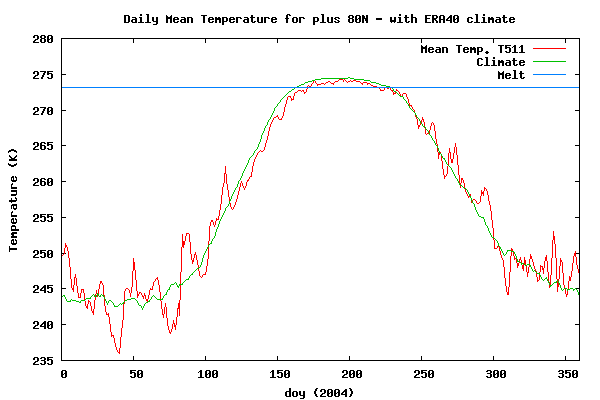
Calculation of the Arctic Mean Temperature
The daily mean temperature of the Arctic area north of the 80th northern parallel is estimated from the average of the 00z and 12z analysis for all model grid points inside that area. The ERA40 reanalysis data set from ECMWF, has been applied to calculate daily mean temperatures for the period from 1958 to 2002, from 2002 to 2006 data from the global NWP model T511 is used and from 2006 to present the T799 model data are used.
Ice is supposed to have the black body constant. Where it is the long night plus ice, the globe is radiating and no watts/metersquare are coming in at all. How much is that? At 252K 225watts/met^2 are radiated from the ice to space, at 238K 182watts/m^2. No radiation is coming in, the only efficient way the temperature can go up in the long night is by convection.
My interpretation of the plot is that the wind has stopped and the ice is happily radiating away.
The arctic is “recharging.” Pretty soon this supply of fresh, cold air will head south, and the graph will spike back up at the pole, as folk further south shudder in the cold, and a bunch of new record cold temperatures are reported.
I’m interested in the up-spike of the UAH world-wide temps. How much of the very cold air is “missed,” as it is “underneath” the part of the lower tropasphere the satellite measures?
When world-temps jump up or plunge down by an entire half-degree, you can’t really blame CO2, which shows no similar jumps up and down. I think it will be interesting to hear theories about what causes such jumps.
Here is the graph for 2009. to put that in perspective.
Actually, if it remains cold in the arctic it might be a good test for GISS temperature measurements. On other threads we’ve been discussing possible reasons for the discrepancies between GISS and other metrics. A possible reason for the relatively higher GISS anomalies (over the past 6 years) is the arctic extrapolation used by GISS. If the arctic remains cold, a significant contributor to the GISS anomaly should be cooler. This should result in GISS monthly anomaly being relatively cooler than the others.
Unfortunately the arctic looks to have been quite warm in the early part of the month so the overall monthly anomaly might not be particularly unusual.
South Eastern Canada (and I don’t mean Florida) has had a mild Jnuary so far; perhaps this indicates impending cold in a couple of weeks?
I have just come across this NSF news article:
“Global Ice Age Climate Patterns Influenced by Bering Strait”
Dated: January 10, 2010
“In a vivid example of how a small geographic feature may have far-reaching impacts on climate, new research shows that water levels in the Bering Strait helped drive global climate patterns during ice age episodes dating back more than 100,000 years.”
http://www.nsf.gov/news/news_summ.jsp?cntn_id=116189&WT.mc_id=USNSF_51
It would be interesting to me to see a lot of thermometers in the water at the Bering straight. I have sailed for nearly 40 years and see currents effect surface temps and changes in weather. Even when the surface is frozen, currents underneath keep moving. The Met Office boasts of huge computors that calculate wind direction and speeds at many altitudes to optimise Comercial aviation. If we have the same at many depths for currents, we can get more inputs for the PDO.
In terms of weather, we are just beginning to learn what we do not know.
Al Gore notices the orange in the middle of Greenland and immediately seizes on it for a new film with Michael Moore on how the ocean levels will increase 2,000 feet due to the melting of Greenland.
The arctic was overly warm with the AO in December and now has swung the other way, then threads were posted on how cold Europe was, now it is how cold the Arctic is since Europe is more normal again.
Stop cherry picking!
Andy
The El Nino is fading a bit and the sun was recently a little more active so the Arctic Oscillation became a little less negative for a while and allowed a slight movement poleward in the jets.
That results in a tighter air flow around the poles and a cooling of the poles with less breakouts of cold air equatorward.
As I said before a quiet sun reduces the rate of energy loss to space from the stratosphere whilst ENSO controls the rate of energy transfer from surface to stratosphere. The combined effect dictates the state of the Arctic Oscillation. The AO is biased towards negative when the sun is inactive because instead of energy escaping to space it tends to be redirected back downward through intensification of the Arctic high pressure cells which then move equatorward.
A negative AO pushes the jets equatorward whilst a positive ENSO pushes them poleward. All subject to a degree of short term chaotic variability.
So the situation remains for a continued slow overall cooling of the troposphere with, for the moment, strongly cooling poles and a continuing cooling of the northern continental interiors during the current winter season.
So, looking forward, the continued cooling of the northern continents may soon be supplemented by further breakouts of cold air from the Arctic region but at this point I cannot predict the direction of breakout. It could be across China, N. America or Europe or a mixture depending on future synoptics.
I look at the DMI arctic temp chart and the AMRS-E chart every day out of habit – as a curious amatuer. In the past several days the DMI chart went 5K below mean and I was curious to see the reaction on the AMRS-E chart. Behold… cold temperatures cause a decrease in artic ice extent. Sure there are other factors at play but it seems odd to me.
Old saying: Once bitten, twice shy. So much of the temperature record everywhere seems to be in doubt, especially with the closing down of so many ground weather stations, that I am gun shy of any purported temperature data. And so, I wonder about the data provided by the Danish Meteorological Institute. “tfp” provided an overview of the process used to produce the numbers and graph at (04:11:58) :
“The daily mean temperature of the Arctic area north of the 80th northern parallel is estimated from the average of the 00z and 12z analysis for all model grid points inside that area. The ERA40 reanalysis data set from ECMWF, has been applied to calculate daily mean temperatures for the period from 1958 to 2002, from 2002 to 2006 data from the global NWP model T511 is used and from 2006 to present the T799 model data are used.”
This doesn’t say how many thermometer sites (satellite data??) were used, so I have to question if the calculations are similar to the “fill-in-the-box” method criticized for the Steig warming “revelations” from Antarctica. I do not believe in the AGW story, but I want to be on solid ground when I argue any other point of view. Can anyone certify that the Danish calculations are valid? (I want to believe them!!)
IanM
ShrNfr (06:47:07) :
Al Gore notices the orange in the middle of Greenland and immediately seizes on it for a new film with Michael Moore on how the ocean levels will increase 2,000 feet due to the melting of Greenland.
2,000 feet? Do you have a reference where that number comes from?
“SlylyForward (08:12:32) :
ShrNfr (06:47:07) :
Al Gore notices the orange in the middle of Greenland and immediately seizes on it for a new film with Michael Moore on how the ocean levels will increase 2,000 feet due to the melting of Greenland.
2,000 feet? Do you have a reference where that number comes from?”
From the documentary “2012” by Dr. Emmerich.
S Thompson,
All of the Arctic above 80N is already saturated with ice. Cold temperatures there won’t change the sea ice extent.
anna v (04:50:25) :
Ice is supposed to have the black body constant. Where it is the long night plus ice, the globe is radiating and no watts/metersquare are coming in at all.
Actually there’ll be long wave coming in, probably around 100+ W/m^2.
How much is that? At 252K 225watts/met^2 are radiated from the ice to space, at 238K 182watts/m^2. No radiation is coming in, the only efficient way the temperature can go up in the long night is by convection.
Since most of the time there is a surface temperature inversion convection isn’t likely, more likely advection.
For those of you wondering about the UAH January 2010 anomaly, there is a post bye Luboš Motl over at The Reference Frame that talks about the latent heat of snow.
http://motls.blogspot.com/2010/01/warming-induced-by-latent-heat-of-snow.html?
Interesting read.
MrC
It’s amusing and rather predictable that ~100 days of ~5º above the average excites no comment on this board but a couple of days below gets a headline.
Juraj V. (03:34:22) :
Interesting that ice cover extent slowed down despite the cold. Probably the ice is being compacted by winds. This generates thick ice and open water, exposed to severe cold, will freeze very quickly as soon as winds stop. We are on a good way to see summer minimum above 2007, 2008 and 2009.
So you think that a few cold days will reverse the effects of the last 100 days? With the continued drift out of the Fram I’d be very surprised to see a minimum that high.
AndyW,
Obviously you are not in Europe. Temperatures are running near record cold.
http://wxmaps.org/pix/temp4.html
Phil,
The coldest temperature in six years what this article is about, not “a few days below normal.”
By the way, UAH are probably guessing the temperatures above 82 degrees North by interpolating the temperatures around that region, so they’re likely not seeing the recent cooling in the extreme Arctic.
The disk around the North pole up to 80 degrees North is 0.75% of the surface of the Earth, so if the Danish far Arctic temperatures were added into a weighted average, those 14 degrees in 3 weeks would subtract about 0.1 deg Celsius from the global average. See more comments
http://motls.blogspot.com/2010/01/extreme-arctic-cooled-quickly-reduces.html
MrCannuckistan (08:47:46) :
For those of you wondering about the UAH January 2010 anomaly, there is a post bye Luboš Motl over at The Reference Frame that talks about the latent heat of snow.
Interesting read.
The usual Motl stuff, ‘a little knowledge is a dangerous thing’ with him. He forgets that there’s another hemisphere where ~2million square km of ice melted in the same time. But even ignoring that, the latent heat warming will be confined to the NH over the period of a month so when we look at the monthly data from UAH we’ll be able to see if he’s right and there is a huge increase in the NH ExtraTropical contribution.
Does warmer air in the arctic result in heat being lost from the total global energy budget?
P Gosselin (02:36:21) :
Seems like the cold we had in the middle lattitudes has retreated back to Arctic.
US, Siberia and southern Canada aren’t as cold as they were a couple a weeks ago.
This moderation of temperature in Southern Canada at this time is completely normal. We have a well defined period of “January thaw” that varies some with degree and timing but remains consistent. If there has been a sufficiently cold enough period to begin significant freeze over of portions of the lower Great Lakes (variable in extent from year to year), then we lose lake-effect snows, and tend toward drier, clear nights. This usually heralds a run of deep dry cold through February, which breaks with the arrival of the spring sun and associated seasonal weather.
*******
Caleb (04:55:21) :
I’m interested in the up-spike of the UAH world-wide temps. How much of the very cold air is “missed,” as it is “underneath” the part of the lower troposphere the satellite measures?
*******
I’m pretty sure sat measurements do indeed miss temp anomalies on the ground, especially at higher latitudes where shallow, cold temp inversions are common during the long nights. Perhaps Dr Spencer could chime in.
Looking at noise in the red data vs the green average, the current temperature looks like two sigma from the mean. Assuming the max for the year is coming up, it looks like a one-in-twenty-year event (i.e., two sigma).
Not spectacularly scary.
REPLY: It was never portrayed as scary, just interesting – A
Phil doth quote:
Actually there’ll be long wave coming in, probably around 100+ W/m^2.
Can you help me understand from where? At 80N the inclination of the Sun is nasty. You would be lucky to get 10% of the solar constant of 1365 w/m2 and then divide by 2 because the sun takes nights off, less another 30% for that albedo thing…leaves about 50 watts? Water vapor almost absent due to cold and we know about the hole in the ozone layer, so greenhouse effects from those two also way down, radiance from ice just leaking out lickety split. ERBE data shows earth losing about 120 watts/m2 or so at in the arctic
so Ana’s 180 – 50 = about right?
The other area to watch during 2010 is what happens to crops in North Asia. Ithas been like this since mid Decemebr. Daily Average temperatures were running 20-25 Below Normal . Normals run -5-10C tHIS COLD IS
http://www.findlocalweather.com/weather_maps/temperature_north_asia.html
So Phil, 14.25% of Antartica has melted? Or was the southern ocean? or was it ?
h/t to Steve Goddard
Thanks Steven Goddard.
Luboš Motl (10:02:06) :
By the way, UAH are probably guessing the temperatures above 82 degrees North by interpolating the temperatures around that region, so they’re likely not seeing the recent cooling in the extreme Arctic.
Presumably, if UAH missed the recent cooling, they also missed the much warmer arctic temperatures over the past 5 or 6 years. Perhaps that explains why there has been no ‘cooling’ in the GISS record since 2003.
this should mean thicker ice that will melt a bit slower in the summer
This is more fuel for miserable weather through the U.S. midsection in coming weeks. Maybe South Florida again as well.
By the way, if you look at the data for years like 1961 or 1963 you will see very cold arctic temperatures below 230K, and the wild jumping back and forth that the Arctic seems to do each winter. Wind in one sector brings in “warm” air from the south at the same time cold air is flowing south in some other sector. Then the Arctic goes calm as AnnaV says, and radiation takes over.
I haven’t found out why 2009 ended at roughly 245 K and the next day 2010 began at about 252 K.
Seven degrees is possible but it is quite a jump for one day. Did they recalibrate at that time?
I believe Nick asked this question a week ago and got no answer.
See Nick Stokes at 4:47:12 for a link to the 2009 graph. Or go here
http://ocean.dmi.dk/arctic/plots/meanTarchive/meanT_2009.png
It doesn’t look too warm in northern China at the moment, either, according to TVNZ.
http://tvnz.co.nz/world-news/sea-ice-pack-grows-in-north-china-3340398
Steve Goddard (08:30:49) :
All of the Arctic above 80N is already saturated with ice. Cold temperatures there won’t change the sea ice extent.
However, it should increase the thickness, and as we’ve been told lately that is the most important metric. Or, at least it will be until the extent drops down again.
Does anyone else think the Siberian hot spot is a little odd. It is bracketed by colder than normal temps on the north and south. Where did the heat come from?
We had a disconnect between the tropics and the poles.
The jetstreams in the N hemisphere moved south and stopped waving, preventing tropical air from being drawn up into the higher latitudes. This caused cool weather in northern latitudes (all that snow), and no doubt allowed the poles to cool off even more than usual.
Future trends?
We have had a few low pressures sneak northwards, bringing some warmer weather northwards, but not as many as usual, nor as active. So my estimate is that the N Pole will continue cooling, but not as fast as previously.
.
This should result in ice being much thicker this spring than in recent years. It will be an interesting September.
Walter Dnes
” If the colder air floods south and freezes Chicago and all the way down to Florida, plus Europe and China, then warmer air moves into the polar regions.”
But that didn’t stop the environment correspondents here in the UK, notably the Guardian and the BBC, emphasising that the Arctic was warmer than usual in any piece they did on the cold spell in the UK and Europe. Keeping the meme going about Arctic warming is always more important than describing what is happening weather wise.
I have watched this graph closely over the last few years. I regularly compared this data to the values here:
http://www.athropolis.com/map2.htm
and I’ve become convinced that there is a high amount of random, unbiased fluctuation/error in the DMI plot. Some of the jumps are downright stunning.
I realize that the Alert location is the only one in the athropolis map that’s north of 80 degrees but the temp for Alert doesn’t fluctuate wildly. In fact it fluctuates less than, say, Murmansk or Resolute. I would expect the wide area average in the DMI plot to fluctuate even less, yet it seems to fluctuate more.
Lots of raw data is smoothed because of measurement limitations and this data is obviously unsmoothed and should be viewed as such. I’m not saying the data is wrong but I am saying that significant smoothing would be appropriate to reduce the noise.
Thus, this minimum becomes a lot more interesting if it hangs on for a few more days.
That said, I would just love to see data on how cloudy it’s been north of 80 degrees. This time of year, a clear sky would reduce temp. The athropolis data includes wind and clouds but it’s not enough locations.
Recharging the Polar Express for another plunge.
Assuming that an Arctic High is parked over Greenland & Siberia..
Also notice the cold anomaly over the South Pole in it’s summertime, consistent with the shortened melt season we had in the Arctic last summer.
Can you say “Leapfrog”?
crosspatch (13:09:08) :
This should result in ice being much thicker this spring than in recent years. It will be an interesting September.
It will increase the thickness of the ice. However, if you have ever examined what is known as the “Stefan Problem” you’d see that the increase is with the square-root of time and so the thickening slows and slows, and…
I won’t be surprised to see not all that great a thickness increase by spring, let alone September.
GISS will have the Arctic anomaly a new color I like to call ‘climate red’. I mean, the ice is melting for God’s sake! Haven’t you seen the huge spike in the summer temperatures to support this theory?! No? I’ll show it to you:
/
/
/
/
/
/
/
/
I didn’t even make it up or anything.
Darn. My sarcastic graph unformatted. Oh well. Still, I don’t really see much of a difference in the summer temps up in the Arcitc year to year.
Summer temperatures in the high Arctic are controlled by the freezing point of water. It is impossible to get temperatures much above freezing over a large body of ice, because the melting of ice absorbs a lot of heat. If the North Pole was ice free as Mark Sereeze predicted for 2008, or the Arctic was ice free as another “expert” predicted for 2008, then Arctic temperatures could have gotten much higher.
photon without a Higgs (11:49:03) :
this should mean thicker ice that will melt a bit slower in the summer
Only if it lasts for a while, it has about 100days of 5º above average to take care of.
I read through all the comments now, and having not seen it, I must ask. Are these rotten Kelvins?
All of this emphasizes the stupidity of trying to attribute a “global temperature” to the Earth’s climate system, ignoring humidity and elevation issues, and the fact that the oceans have almost 1200 times the heat capacity of the atmosphere. It’s like astrology. Small wonder that UEA staff played little games with their dendroclimatology studies. If you’re selling horoscopes, what does it matter?
Dave Andrews (13:13:52) :
They just don’t get it, plain and simple. If you take the Polar Air and blow it down on the temperate zones all winter, it makes for one heck of a climate change. Who cares if the Arctic is above normal in the winter, where nothing can melt and nobody live there, but we sure as heck do care that things are well below normal in the Northern Temperate zone where billions of people live.
Good, let it stay up there. Vancouver can use straw and fake snow. If this bit of a cold snap next week is the last of the Arctic blasts for the year, that would suit me fine. The snow we are going to get before April will be quite enough for us on the Northern Plains.
It will be interesting to see what the ice minimum is with the brutish stuff magnified up there this winter instead of getting pushed South … yet :~/
The AGW skeptic crowd nailed the AO blocking over Christmas. What are they saying for the rest of the winter?
MrCannuckistan (08:47:46) :
It was good to see Lubos mulling over the release of latent heat that may be involved in the formation of above-normal snow cover.
It seems to be a calculation ignored by Alarmists, when they note a temperature rise.
Hansen actually did mention latent energy once, but it was while trying to explain why temperatures were NOT going up. He stated a lot of actual heat might be turned into latent heat, as ice caps melted.
However the knife cuts both ways.
Phil. (10:02:17) :
When you state, “But even ignoring that, the latent heat warming will be confined to the NH over the period of a month…” I find myself thinking that only a month ago the UAH figures were below +.3, and now they’ve zoomed up towards +.7.
It’s quite a jump in “only a month,” and begs us to think of possible causes. There are probably a combination of causes, but latent heat is worth considering.
Also consider the fact the southern hemisphere is largely ocean, and therefore can’t build up the same sort of snow-cover as the northern hemisphere.
Perhaps this explains why there is usually a rise in world temperatures during the northern winter. (I used to think it was simply because that is when the earth is closest to the sun, but the current jump in temperatures seems too large to be covered by that explaination.)
I’m curious. Do you have any ideas of your own about what may have caused the spike in temperatures?
Caleb (17:51:40) , the UAH anomaly last month was .28C. When you look at the daily numbers the difference value at the bottom of the chart is .52 F.
While I think the anomaly will increase in January it isn’t going to be near .7C.
KTWO (12:01:21) :
I haven’t found out why 2009 ended at roughly 245 K and the next day 2010 began at about 252 K.
Seven degrees is possible but it is quite a jump for one day. Did they recalibrate at that time?
I commented on this a ways back. DMI, for some reason, only has data through the 360th day of the year shown on the graph. They told me when I queried them about it 6 weeks ago that they were working on fleshing out each year in the record. I may ask again soon.
Anthony,
On January 21st I blowed the whistle about the Danish Center temperature graphs in Climate Sceptics debate list, and I guess Warwick and Lubos (members of CS) took my advice to check the graphs and made they excellent job.
So I make my own h/t to myself about this matter 😉
If you look at the arctic temperatures from 2005-09 you will note that most of the non-summer months are tending to above the long term average, yet the summer months are slightly below the long term averages.
OT (maybe).
Has anyone ever challenged Hansen on his being in a position of conflict? I mean the guy adjusts the data, bitches about it yet we’re supposed to think he’s reporting it as a neutral scientist. If this was business he’d be in court defending his manipulating of data for personal gain!
Steve Goddard (09:48:41) :
Phil,
The coldest temperature in six years what this article is about, not “a few days below normal.”
A couple of days at 5ºC below vs. ~100 days at 5ºC above doesn’t seem that worthy of note.
davidmhoffer (11:25:30) :
Phil doth quote:
Actually there’ll be long wave coming in, probably around 100+ W/m^2.
Can you help me understand from where?
Clouds, long wave isn’t solar (no sun there at present).
OK, I found it myself …
http://www.accuweather.com/ukie/bastardi-europe-blog.asp?partner=accuweather
The West might be spared somewhat and the Northern Plains as well but the cold conveyor belt through Winterpeg is forming to deliver a February onlslaught to the East Coast of North America. Good for Chicago Hub Nat Gas prices anyway.
I guess we will get some sealing ice … maybe I’ll leave that topic alone 😀
Phil. (20:49:51) says:
Phil. seems correct. For something like the last 130 days or so Arctic temperatures have been at or below 270K(-3C), but for something like 100 of those days they have been above the average of the recording period by several degrees, perhaps as much as 5K(C).
Phil,
The coldest day in the Arctic out of the last 2,100 days, is definitely worthy of note.
Not really, it’s really no colder than it was 2 years ago.
Another reason for the recent cooling is extra albedo.
The N hemisphere has been covered in snow for four weeks, reflecting all incoming solar energy. Likewise, there have been large saturated anticyclones. Even now, there is low stratus stretching from Bulgaria to France, with 99% reflectivity.
The higher latitudes have been starved of solar radiation for four weeks. That has to reduce the amount of energy reaching the pole.
.
>>Actually there’ll be long wave coming in, probably around 100+ W/m^2.
>>Can you help me understand from where?
>>Clouds, long wave isn’t solar (no sun there at present).
Not sure about that. Clouds reflect (absorb-transmit) back what is coming up from the surface – they are an insulator, not a heat source. The polar surface will be COLD, so will the clouds.
In Europe, the daytime surface temperature is about -5oc. The clouds at 1000ft are about -2oc (slight inversion). There will be precious little LW radiation returned from them (but they will prevent night temperatures dropping to -20oc).
.
Suppressed by the 31-year AO negetivity, the arctic is damned for everything – melting ice, global warming, endangering species and all other that can be, or cannot be named.
Now, the suppressed arctic is in a revolution, and the revolution is all but complete, arctic recharged, bringing back the arctic that was, shockened the arrogant human that believed in global warming, and return everything that the arctic have been damned for.
C’est la lutte finale, groupons-nous, et demain, l’internationale, sera le genre ARCTIQUE.
” The slope of decline has also recently been quite sharp, dropping from 252K on January 1, a drop of 14 degrees in 22 days.”
At the end of December the graph was down at about 244K. The 2009 graph stayed up for several days and when the 2010 graph came up at 252K I wondered what was going on, but graphs are usually quite spiky, so I didn’t pursue it. If you go back through the archived graphs the present temp is not that unusual, except for the most recent years temps at or below the present number are there in the majority of years, usually as spike, but sometimes lasting longer.
Richard M (18:40:46) :
Thanks for pointing that out
Phil,
I superimposed the 2010/2008 plots, and it is more than half a degree colder in 2010 than the coldest in 2008.
rbateman (15:40:54) :
“Dave Andrews (13:13:52) :
They just don’t get it, plain and simple. If you take the Polar Air and blow it down on the temperate zones all winter, it makes for one heck of a climate change. Who cares if the Arctic is above normal in the winter, where nothing can melt and nobody live there, but we sure as heck do care that things are well below normal in the Northern Temperate zone where billions of people live.”
You’ve hit the nail on the head!
The NH is by far the most important part of the world as far as population density is concerned, and a couple of degrees Celsius colder than recent years will have a significant negative impact upon us. However, a few degrees increase in temperature will have many positive benefits for agriculture and reduced energy use.
The whole idea that global average temperature is important is a complete myth.
AndyW (07:16:43) :
The arctic was overly warm with the AO in December and now has swung the other way, then threads were posted on how cold Europe was, now it is how cold the Arctic is since Europe is more normal again.
Stop cherry picking!
It is in the weather not climate forum. The warm Arctic/cold mid NH and cold Arctic/warm mid NH has already been remarked upon. The interesting point is when we have a “warm Arctic/frozen EU/USA” is the earth radiation more energy than normal?
Heh, interesting, now that it is “Cold” it makes the blog, but when it was “warm” for the last 1/3rd of 2009 not a peep.
http://ocean.dmi.dk/arctic/plots/meanTarchive/meanT_2009.png
and imagine that, cold in the Arctic in winter! Shocking.
REPLY: If the temperature had dramatically shot up, we’d be covering it. WUWT has covered a number of “warm” stories recently:
http://wattsupwiththat.com/2010/01/22/warmest-decade-on-record/
http://wattsupwiththat.com/2010/01/08/high-fire-danger-in-south-australia-as-temperatures-soar/
http://wattsupwiththat.com/2010/01/15/uah-satellite-data-has-record-warmest-day-for-january/
Your complaint is nulled. – A
and since the temp just whipped back up to pretty much normal…do we now debate if wuwt does articles on normal? sorry, couldn’t resist.
REPLY: If the temperature had dramatically shot up, we’d be covering it. WUWT has covered a number of “warm” stories recently:
You mean like this…..
http://ocean.dmi.dk/arctic/meant80n.uk.php
REPLY: Thanks for pointing that out, hadn’t checked it today yet. -A
Oh sorry, I was specifically talking about the DMI data Anthony…which seemed relevant given the topic of the post.
So…maybe not nulled?
REPLY: Still nulled, your argument is that I don’t report “warm” things, and I’ve illustrated 3 stories this month on “warm” things, plus an update to the current story. Still doesn’t change the fact that the temperature dip is the lowest since 2004, which is noteworthy. If you don’t want to see these things visit another blog. – A
I’m not sure where the idea came from that temperatures in Europe have moderated. Temperatures across Europe are very cold, and forecast to get even colder. Berlin is forecast to go below 0F this week.
http://wxmaps.org/pix/temp4.html
http://www.wunderground.com/global/stations/10385.html
Average temperatures in the Arctic have ranged this year from a high of -25C to a low of -35C. Currently they are -30C. Anyone who considers these temperatures to be “warm” must be living in an alternate reality. I was in -23C weather a couple of weeks ago and it is painful bone chilling cold.
Ralph (00:26:44) :
>>Actually there’ll be long wave coming in, probably around 100+ W/m^2.
>>Can you help me understand from where?
>>Clouds, long wave isn’t solar (no sun there at present).
Not sure about that. Clouds reflect (absorb-transmit) back what is coming up from the surface – they are an insulator, not a heat source.
We’re talking about the Arctic in winter, the clouds act as black body radiators.
The polar surface will be COLD, so will the clouds.
The Arctic atmosphere in winter is in an almost permanent strong inversion.
Surface temps ~240K, top of inversion ~250-260K, that would amount to ~30% excess of down-welling over up-welling.
In Europe, the daytime surface temperature is about -5oc. The clouds at 1000ft are about -2oc (slight inversion). There will be precious little LW radiation returned from them (but they will prevent night temperatures dropping to -20oc).
We’re not talking about Europe in daylight.
I will forecast also:
The red line is going up to meet the average, which means warm air masses have arrived at the pole which means brutal cold air is replacing them in the more southern regions, and I can vouch for that since in Greece we are getting the first below zero C night measurements of the year.
OOOH! look! cold weather. See global warming isnt real its all a hoax. Oil companies are far more reliable that scientists.
Scientists and engineers at oil companies keep your car running, your house warm, and your store full of food. Without oil companies, society would collapse within a week.
On the other hand, the disappearance of climate science would no impact on your life whatsoever.
Steve Goddard (08:07:37) :
Phil,
I superimposed the 2010/2008 plots, and it is more than half a degree colder in 2010 than the coldest in 2008.
I did the same, maybe 0.5ºC max, however that temperature fluctuates by several degrees/day so not exactly significant!
Even less so now that it’s 2ºC above average.
Perhaps the title should be changed “to arctic-temperatures above 80°n are back above normal”? 😉
Phil,
I propose a different title. “Hansen’s Arctic amplification not happening.”
Ralph (00:20:54) :
Another reason for the recent cooling is extra albedo.
The N hemisphere has been covered in snow for four weeks, reflecting all incoming solar energy.
I have been reading Tim Flannery’s essay ‘Now or Never’ for the sake of balance (balance ?, a mangled term like ‘robust’) and he carries on about Arctic albedo. I can see how cloud in the Tropics and mid-latitudes can reflect light/heat before it reaches the Earth, but is Arctic albedo all that it is made out to be ?. I mean how much does light (really UV) have an measurable effect above 75degN ?
I mean (really IR)
Keith,
The Arctic ice minimum comes in September, when the sun is just above the horizon. So the albedo argument is a ruse.
I wrote about this last year.
http://wattsupwiththat.com/2009/01/10/polar-sea-ice-changes-are-having-a-net-cooling-effect-on-the-climate/
Keith when the day lasts for 6 months quite a lot!
Summer at the North Pole 2008 the measured solar at the surface was ~300W/m^2, that’s worth 600W/m^2 at the equator because it’s 24hrs not 12. As for IR there’s a measured ~300W/m^2 of that there too!
Phil,
There may be lots of sun at the North Pole in May, June and July, but there is very little year to year variation in ice extent during those months.
http://www.ijis.iarc.uaf.edu/seaice/extent/AMSRE_Sea_Ice_Extent.png
The 2007 minimum occurred in late September, after the sun had already set.
>>The Arctic ice minimum comes in September, when the
>>sun is just above the horizon. So the albedo argument
>>is a ruse.
I was not talking about Arctic albedo, it was the N hemisphere I was concerned about.
Many areas from latitude 45° north and above have been carpeted with snow and low stratus for weeks (more dumped on E Europe yesterday), and that must affect the amount of incident energy being absorbed in the N hemisphere. That must, in turn, affect the amount of energy available to migrate towards the poles.
.
What the heck is going on with Arctic ice coverage the last few days? Another satellite problem? It’s gone *down* (not just rate of increase flattened) according to NSIDC. That can’t be right at this time of year can it?
Steve, Keith’s question was “I mean how much does light (really IR) sic have an measurable effect above 75degN ?”, which my post was in answer to. Just because the extent minimum occurs in september doesn’t mean that the previous 6 months of sunlight have nothing to do with the melting. In fact the minimum will always occur after the refreezing has started. In further response to Keith as can be seen from the DMI plot the average temperature increases 30ºC in the 60 days following sunrise. Also while the sunsets in late September at the pole, at 80ºN there is plenty of sun through mid October (7 – 10 hours).
geo (06:38:39) :
What the heck is going on with Arctic ice coverage the last few days? Another satellite problem? It’s gone *down* (not just rate of increase flattened) according to NSIDC. That can’t be right at this time of year can it?
It happens all the time, just minor fluctuations at the margins at a time when the growth in extent is rather low, i.e. ‘weather’.
See below for evidence of such fluctuations in previous years.
http://www.ijis.iarc.uaf.edu/en/home/seaice_extent.htm
Phil,
At 80N, the sun’s elevation above the horizon in October ranges from 7 degrees to 0 degrees. The amount of solar radiation received is very small.
No one is disputing that the sun melts ice during the summer, the question was about albedo and reflected light.
geo,
Nothing wrong with the NSIDC plot, Winds are compacting ice in the Eastern Arctic.
http://nsidc.org/data/seaice_index/images/daily_images/N_daily_extent.png
I still think the temp shooting up 8 degrees centigrade in a single day is a bit much for such a large area. Smooth the plot with a two-week moving average and you’ve got a better view of the arctic temp.
http://www.bloomberg.com/apps/news?pid=20601088&sid=aSEEa_iSCC7Y
What about the Bears???
Running out of food, eating each other, no where to play, their world turning into shyte. I think i need a cup of Mogadon.
relax. relax.
regards