
We’ve been lectured time and again about the importance of having climate science work come from peer reviewed papers, saying that the work of dedicated amateurs has no place in climate science unless the work rises to publication/peer review level.
Yet that doesn’t seem to apply for United Nations science publications. Of course just one look at the front cover at left tells you its more about selling than science.
The cover image pulls at heartstrings, making the world appear as if it is running out of time before turning entirely into an inhospitable desert. That is an extreme view in my opinion.
Steve McIntyre’s blog discovery of UNEP’s folly bears repeating, because it shows the sort of sloppy science that is going into “official” publications.
This is much like the NCDC CCSP report just over a year ago where they used a photoshopped image of a “flooded” house.

In this case, the United Nations simply grabbed an image from Wikipedia that supported the view they wanted to sell. The problem with the graph in the upper right of page 5 of the UNEP report is that it itself has not been peer reviewed nor has it originated from a peer reviewed publication, having its inception at Wikipedia.
And then there’s the problem of “Hanno” who is an anonymous contributor. This is simply his/her artwork and interpretation. We don’t have any idea who “Hanno” is, nor apparently does UNEP.
Yet UNEP cites the graph as if it was a published and peer reviewed work as “Hanno 2009”. Yet UNEP doesn’t even get the year right as the graph was created in 2005:

But as Steve McIntyre shows us, this graph from “Hanno” is just another variation of Mann’s discredited Hockey Stick based on questionable mathematics, outright errors such as data inversions, and dubious or excluded proxies that may not reflect temperature change at all.
From Climate Audit:
The UNEP CLIMATE CHANGE SCIENCE COMPENDIUM 2009 on page 5 uses the following graph from Wikipedia (not the IPCC Fourth Assessment Report):

CO2 concentration and mean global temperature during the past millennium. CO2 levels (blue line, lefthand axis) are given in parts per million, temperatures (red line, right-hand axis) in degrees Celsius. Source: Hanno 2009 Page 5
Hanno is the pseudonym for a Wikipedia contributor. The graphic itself compares CO2 levels from Mauna Loa and Law Dome ice core to a splice of the HAdCRU temperature index and the Jones and Mann 2004 reconstruction (dominated by Graybill bristlecone chronology).
The latter splice is, of course, the splice that Mann has informed us is never done by responsible climate scientists, further informing us that the allegation that such splices are done is disinformation by fossil fuel companies.
No researchers in this field have ever, to our knowledge, “grafted the thermometer record onto” any reconstrution. It is somewhat disappointing to find this specious claim (which we usually find originating from industry-funded climate disinformation websites) appearing in this forum.
========
I’ve done some additional review and here is what I’ve found about “Hanno”
First here is the Wikipedia source for the image:
http://commons.wikimedia.org/wiki/File:CO2-Temp.png
The following 4 pages on Wikimedia Commons link to this file. UNEP likely got it from the first page during a Google search.
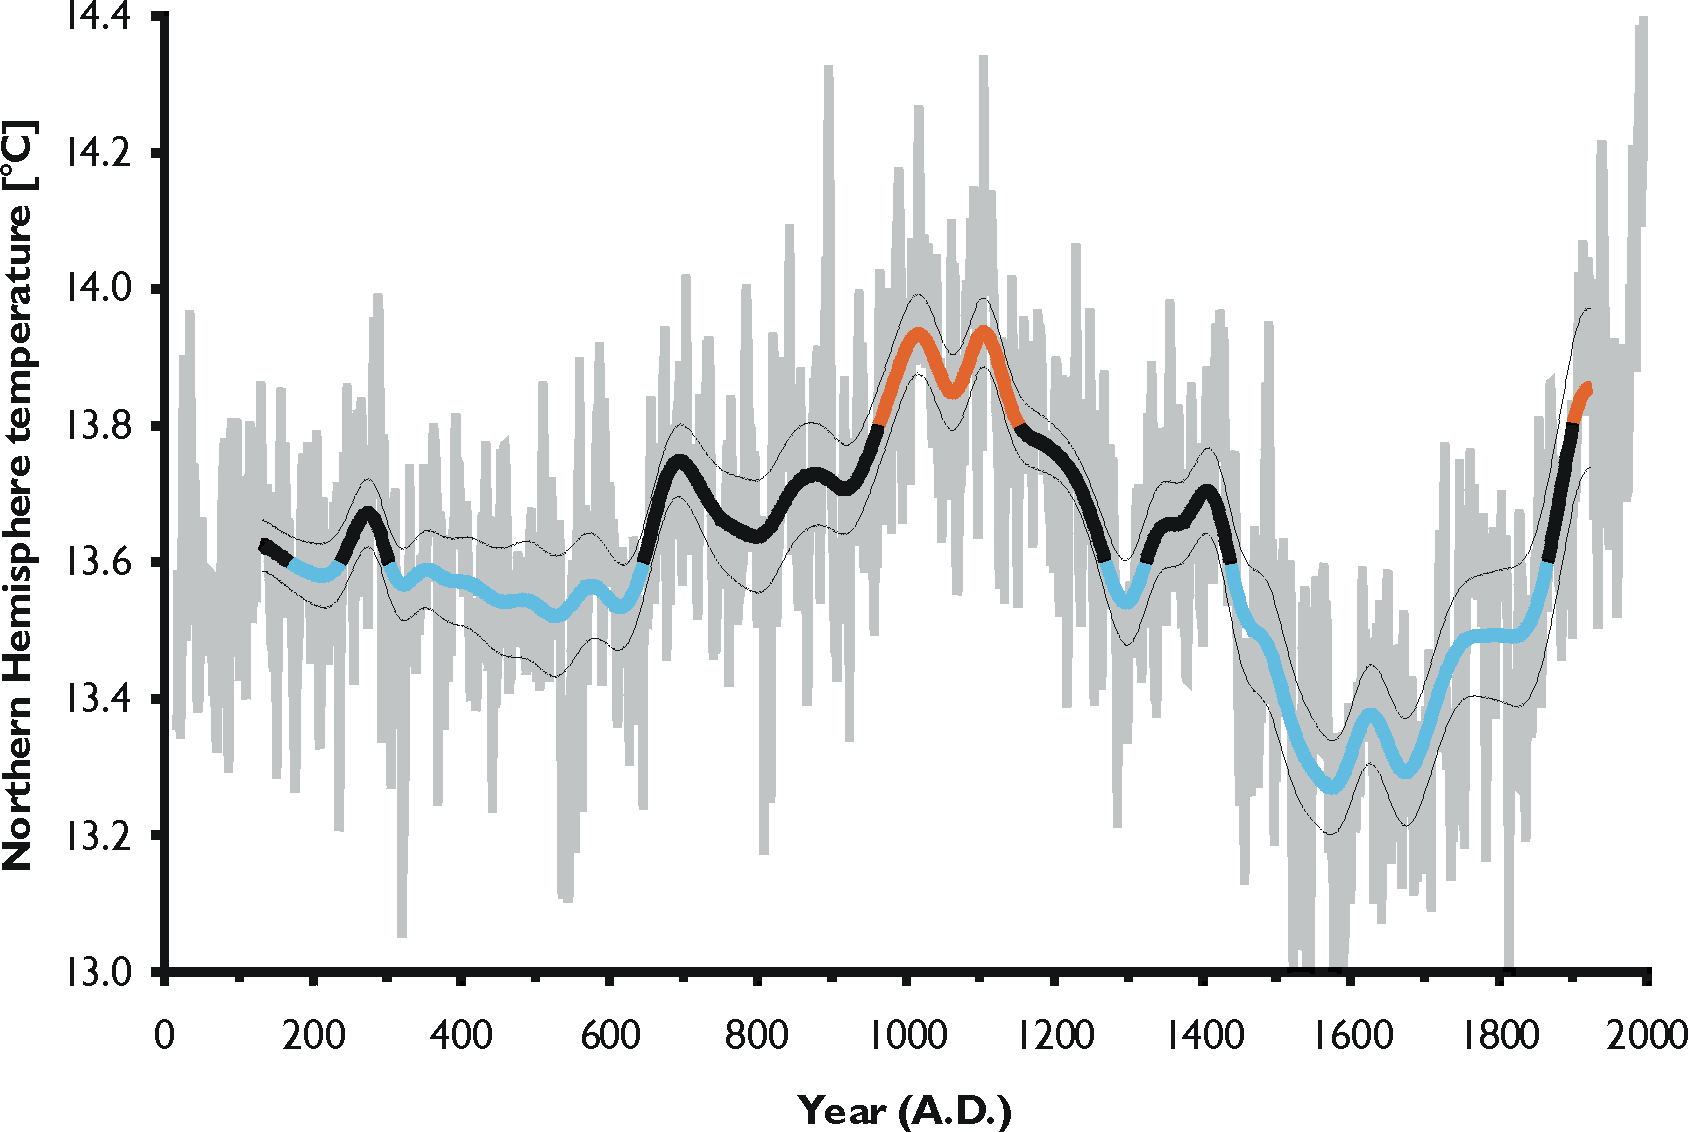
UPDATE: From a Climate Audit commenter “Feedback”: Hanno is also the author of a non-hockey stick graph that can be found in the Norwegian Wikipedia article about the Migration Period (Norwegian: Folkevandringstiden) that shows a more Lamb-like relationship between the MWP and the current warm period:
Source is said to be:
Source: graph drawn by Hanno using data published by A. Moberg, D.M. Sonechkin, K. Holmgren, N.M. Datsenko, W. Karlén, and S.-E. Lauritzen (2005, Highly variable Northern Hemisphere temperatures reconstructed from low- and high-resolution proxy data. Nature (London), 433, 613–617). Temperatures for the last three decades of the 20th Century were taken from P.D. Jones, D.E. Parker, T.J. Osborn & K.R. Briffa (2005, Global and hemispheric temperature anomalies – land and marine instrumental records. In Trends: A Compendium of Data on Global Change. Carbon Dioxide Information Analysis Center, Oak Ridge National Laboratory, U.S.
http://no.wikipedia.org/wiki/Fil:NH_temperature_2ka.png
So apparently “Hanno” contradicts himself with his own set of artwork.
UPDATE2: The Wiki “Hanno” user page is interesting. Thanks to commenter “Dr. Spock”.
Hanno!
http://translate.google.com/translate?hl=en&u=http%3A%2F%2Fno.wikipedia.org%2Fwiki%2FBruker%3AHanno
It’s a disgrace to deceive the public like that.
Thanks for publishing this.
Deceiving the public has happened before and we can learn from our history.
http://www.ecofascism.com/article20.html
http://factsnotfantasy.blogspot.com/2009/09/making-law-ignoring-science-taxing-via.html
I’ll say here what I said at CA: that is the most rediculous temperature reconstruction I’ve ever seen. It is so absurd, it really is insulting.
These are temperature graphs, in wide use until mid 1990s, also quoted by IPCC in their early publications.
http://www.vukcevic.talktalk.net/GraphA-B.jpg
Graph A was created by climatologist Hubert Lamb to represent the temperature variation of Central England over the last 1100 years. Graph B shows changes in regional temperature (Europe and eastern North America), compiled by R. S. Bradley and J. A. Eddy.
Graph A uses combination of thermometer readings for the last 300 or so years, and records of growing seasons before then to infer temperature. It was first published in 1965 and has been updated several times since.
Graph B published in Earth Quest in 1991 is heavily biased towards the North American temperatures.
It’s pound the table, argue the law time with these alarmists. They have to save their tax scam, now that Obama has signed on, one way or the other.
The ‘lies’ have it.
Comment 26 to Steve McIntyre’s discovery shows a much more accurate graph by the same Hanno. It’s interesting that the IPCC chose to use Hanno’s absurd hockeystick misrepresentation instead of this one.
“September 25th, 2009 at 2:29 pm
Interestingly (?), Hanno is also the author of a non-hockey stick graph that can be found in the Norwegian Wikipedia article about the Migration Period (Norwegian: Folkevandringstiden) that shows a more Lamb-like relationship between the MWP and the current warm period:”
REPLY: I had added that graph to the post about the same time you were typing. – A
At this point, with Copenhagen coming up and all, they’re more focussed on dramatizing. This though will only undermine their credibiliity.
Well..the silver lining is it was Hanno and not Hannibal!
Here’s more on Hanno
http://translate.google.com/translate?hl=en&u=http%3A%2F%2Fno.wikipedia.org%2Fwiki%2FBruker%3AHanno
The scary part is, that this “data” will be accepted by the masses.
Once again, this shows that wiki is baseless as a place of factual reference. If any article has reference to wiki then it is safe to assume it is not reliable and should be dismissed as such.
Another reason that I object to this figure, aside from the splicing data/hockey sticks, is that it displays CO2 concentration and not rate of CO2 accumulation. The rate is dependent upon many different factors, both geophysical and biological. One interesting correlation is that the year to year change in CO2 concentration varies with the ENSO and tropical lower troposphere temperature. Several reports have pointed this out, and IIRC has been discussed here.
The paragraph in the UNEP report describing of the flux of CO2 in and out of the atmosphere is so simplistic and incomplete to be laughable.
Gotta run to work……….
Hanno’s probably a german national. At a guess, “Hanno” might even be short for Hannover.
Looking at DrSpock’s link, there are quite a number of references to Germany and North Germany in particular. But the giveaway is Hanno’s phrase ” It can namely be some time between each time I visit “. A common error by german speakers to adopt “namely” where they would use “naemlich” in German. As they don’t transalate, the sentence looks fine to Germans, but odd to native english speakers.
OT. Is it anything wrong with the DMI polar temperature site at the right column? (just below the sea ice graph) it gives me a 404 not found error every time I click.
http://no.wikipedia.org/wiki/Fil:NH_temperature_2ka.png
So apparently “Hanno” contradicts himself with his own set of artwork.
Well, almost. The clue is in the filename: NH_temperature
I agree that the MWP is more global than Mann’s graph indicates, but strictly speaking, Hanno isn’t ‘contradicting himself’, as the Mann style graph is global temperature, and the other is Northern Hemisphere.
Either way, the UN has it’s trousers round it’s ankles.
Again.
My son has been told he must not use wikipedia for school work as it is unreliable.
Jordan (11:16:28)
Not a bad guess, he is german/norwegian Hanno Sandvik formerly Pichl.
He is a biologist and specialises in seabird ecology,
http://www.bio.ntnu.no/users/hannos/engelsk.htm
Jordan: “But the giveaway is Hanno’s phrase ‘It can namely be some time between each time I visit’. A common error by german speakers to adopt “namely” where they would use “naemlich” in German.”
The error is Google’s, and the original text was in Norwegian. The link is a machine translation.
If it supports “the agenda”, then it must be “truth” or at least “truthy”. If it is counter to “the agenda”, then it is the stuff of knuckle-dragging neanderthal “skeptics”. See how easy that is? The “fake but true” stuff is vital to “the agenda” and will be supported to the very end.
A couple of Google searches points this way:
http://www.bio.ntnu.no/users/hannos/engelsk.htm
Apologies if it is not the correct Hanno.
Wikipedia sales have become flat are need to boost numbers.
Remember this quote from Michael Coulter in Australian newpaper The Age?
“There is not, now, much value in arguing about the science of climate change. Even if it’s wrong, enough people now believe it that it may as well be right.”
Someone at UNEP must have read this, taken it to heart and then tried to demonstrate that even if a graph is purely made up, enough people now believe in man-made climate change that it may as well be published, peer-reviewed science.
The Norwegian http://www.forskning.no/ (=”reasearch.no”) has an article in 2005 called “Kan du stole på Wikipedia?” (“Can you trust Wikipedia?”)
http://www.forskning.no/Artikler/2005/desember/1133429879.66
In the article, Hanno is mentioned as “Dyktig Wikipedia-forfatter” (“skillful Wikipedia author”)
LOL HANNO 2009! This will be cited as scientific evidence in the future alongside youtube and wikipedia users girlpowerfan1987, greenman9610, mymomrules696969, downwithcapitalism and bleedingheartliberalheartsblackbabies. The new phase of the Enlightenment will be anonymously social generated content! 15 year olds of the world unite!
Hanno (Sandvik) has a web page here (in Norwegian):
http://www.bio.ntnu.no/users/hannos/index.html
He apparently is a scientist at the Institute of Biology at the Technical-Natural Science University in Trondheim, Norway, and there is even a picture of him. He is not as anonymous, after all.
For those who don’t understand Norwegian: Forskning means Research, Publikasjoner mean Publications (most of them with English titles), Vita means CV, and Medlemskap means Membership(s).
Ah Hanno has a face now. Well, at least that is sorted out but the UN certainly did not know his name or anything beyond the Wikipedia username.
We should know by now anything associated with the UN and IPCC is not to be believed so no surprises here.
At.what point do the people responsible for [snip] such as this get called to account? I can imagine that after the whole AGW scam has died this will simply be forgotten and the authors move on to some other ’cause’. But in perpetrating these fictions in an attempt to persuade governments to spend billions of our money they are behaving in a fraudulent manner. Is a defence of this such as ‘I believe in this cause’ enough? It smacks of religion but is dressed up as science and is therefore rather more deceitful.
http://www.bio.ntnu.no/users/hannos/engelsk.htm
wasn’t to hard to find him. here is a picture.
oops already posted sorry.
‘The content and views expressed in this publication do not necessarily reflect the views and policies of . . . the United Nations Environment Programme.’
Similar deceit on residence time of Atmospheric CO2 by the IPCC.
Complete denial of all the scientific studies that have been performed.
http://heliogenic.blogspot.com/2009/09/ipcc-outlier-as-usual.html
Well it would figure from the graph that this guy “Hanno” is an activist pushing his view of the climate agenda
A look at his “Membership” page says that he’s a member of:
Have a look at “Friends of the Earth” page and you’ll see the fire of some irrational activism at work:
http://www.foei.org/
The Norwegian section:
http://naturvern.no/
Here’s the Google translated version:
http://translate.google.com/translate?hl=en&sl=no&u=http://naturvern.no/&ei=c22-SoLaKZG-sgOLqbQ6&sa=X&oi=translate&resnum=1&ct=result&prev=/search%3Fq%3Dhttp://naturvern.no/%26hl%3Den%26safe%3Doff%26client%3Dfirefox-a%26rls%3Dorg.mozilla:en-US:official%26hs%3DCCy
And the German Section:
http://www.bund.net/
Translated:
http://translate.google.com/translate?hl=en&sl=de&u=http://www.bund.net/&ei=322-SpiXBo6csgPVg4hD&sa=X&oi=translate&resnum=1&ct=result&prev=/search%3Fq%3Dhttp://www.bund.net/%26hl%3Den%26safe%3Doff%26client%3Dfirefox-a%26rls%3Dorg.mozilla:en-US:official%26hs%3DKtI
The IPCC says its so, congress says its so, Obama says its so, Lisa Jackson says its so, NOAA says its so, GISS (James the statistician) says its so, Al Gore says its so, Kerry, Pelosi , Waxman …… common thread they want something from you, facts must be ignored.
This abstract of one of Hannos papers speaks for itself
http://www.springerlink.com/content/l7201j54p1w10805/
Another link, “Framtiden i våre hender” (The Future in our hands) is an environmental organization. A google translation of http://www.framtiden.no :
http://translate.google.com/translate?prev=hp&hl=sv&js=y&u=http%3A%2F%2Fwww.framtiden.no%2F&sl=no&tl=en&history_state0=
A headline “People’s Board, a climate threat?” suggest that democracy is a threat. (There was an election in Norway last week, and it become a close race between the left and the rigth; the right was supposed to win but didn’t.)
Another banner says “We’re seeing the connections – between economic growth and global differences [/injustice] and the environmental crisis.”
A kind of funny — or probably scary — article they link is “The unproductive gonna save us”, which says that those whi’s not study and doesn’t contribute to growth shall are the heroes that shall save our society (I havn’t read it all yet, but…) :
http://translate.googleusercontent.com/translate_c?hl=sv&sl=no&tl=en&u=http://www.folkevett.no/artikler/steinar-lem-i-utvalg/de-uproduktive-skal-redde-oss/&prev=hp&rurl=translate.google.com&usg=ALkJrhjZTvnH_15oGFVwhnt0YU1xNTzZgg
Also “Fair trade”, agriculture without fertilizers etc. the environmentalism of today. Do we have …a moonbat tsunami, or?
Carsten Arnholm, Norway (12:57:40) :
fascinating. Some branches of sociology try to emulate the “hard” sciences. Here we have a “hard”scientist trying to emulate the softer branches of sociology. If anyone can send me the full copy of Hanno’s article I’d be delighted to have a go at it. The guy’s out of his league.
Hanno’s graph is a complete hoax. Here the graphs from Möeberg’s database (red line) and Yang’s database (blue line):
http://www.biocab.org/Medieval_Global_Warming_Yang-Moeberg.jpg
Anthony, you probably did the wrong search for where the image is used. The “What links here” search only looks in the current site. Up at the top of the commons page is a tab which searches all Wikipedia sites. That search shows the graph is used on the “Global Warming” page of Wikipedia in several languages (but not the English version).
http://toolserver.org/~daniel/WikiSense/CheckUsage.php?i=CO2-Temp.png&w=_100000#end
REPLY: Good find, Wikipedia editors reading WUWT should probably work then to get this graph corrected. – A
Did anybody notice the UNEP document also had a full two-page spread where they confused weather and climate? It was titled “Significant climate anomalies from 2008 / 2009”
Hanno certainly is a most peculiar person. He has also written in Wikipedia about “motoring”, which he calls “a mental disorder which constitutes a special case of autism.”
http://translate.google.com/translate?hl=en&u=http%3A%2F%2Fno.wikipedia.org%2Fwiki%2FBruker%3AHanno
He really does live in his own little world.
Nasif Nahle (13:30:46) :
Why such a difference between the two graphs?
Stuart Huggett (12:26:47): “At what point do the people responsible for [snip] such as this get called to account? I can imagine that after the whole AGW scam has died this will simply be forgotten and the authors move on to some other ’cause’.”
At what point will you get called to account when it becomes painfully obvious that you’re wrong, that it’s not a scam, that AGW is very real?
There are other issues with the UNEP report.
It the world map at the beginning of the report, “Significant Climate Anomalies from 2008/2009”, a small paragraph says that
“Artic Sea Ice (Sep 09)
Second lowest extent on record behind Sept. 07”.
Maybe they finished the report before they could know, and based this on a guess.
Or maybe it’s just a “scenario”.
Ack (11:03:32) : The scary part is, that this “data” will be accepted by the masses.
Don’t be so sure Ack. It seems the general population would believe the harsher winters are saying global warming isn’t happening before a scientist who says global warming is happening.
ChrisM (11:30:31) : My son has been told he must not use wikipedia for school work as it is unreliable.
It’s a good reassurance that it’s generally understand that Wikipedia isn’t a reliable source!
But some have spent many, many hours of their lives over the past few years entering biased information at Wiki thinking that it will somehow change the public’s view of global warming. Sucks to be them.
Icarus (13:45:12) :
If you’re so sure of your position, why are you hiding behind a pseudonym?
Icarus.
I am not proposing to spend tens of billions of dollars of other people’s money on the basis of highly debatable climate ‘predictions’. Niether am I fabricating data to ‘prove’ those predictions. I am therefore very willing to be called to account for having asked questions – even if I am wrong.
This was noticed by one of my readers, not me.
Stuart Huggett (12:26:47) : At.what point do the people responsible for [snip] such as this get called to account? I can imagine that after the whole AGW scam has died this will simply be forgotten and the authors move on to some other ’cause’
History didn’t keep track of the names of people who said man was responsible for eclipses of the sun. So I agree with you, they will be forgotten.
Heck, people don’t even know who Michael Mann, Steven Schneider, William Connolley, and James Hansen (et al) are now, let alone in the future.
And you’re right about moving on to another cause—people don’t remember that Steven Schneider was part of the coming ice age scare.
I think the only name that will be remembered for global warming will be Al Gore.
When is all of the credibility left in science going to be sacrificed at the alter of the AGW hoax? Credibility is not a renewable resource, regardless how much grant money they shovel your way.
Wiki truly is a place where the inmates run the asylum
Icarus (13:45:12) : that it’s not a scam, that AGW is very real?
You are just saying that for comic relief, aren’t you?
Icarus.
One thing needed for more than one degree heat from by human added CO2 is reinforcement, i.e. total positive feedback. Positive feedback would mean that climate is quite instable, which it isn’t. Also many measures of the response on Earth’s temperature from e.g. volcanoes and changes in clouds has showed negative feedback, which reduces impact from CO2.
The CO2 impact without feedbacks ,or we can say neutral feedback, is about +1 degree C when CO2 concentration is doubled year 2100. But a delay should be there, so we’ll have +1 C in 200-300 years. This is if we have neutral feedback (it should be negative and result in lower temperature rise), and if we are able to increase the CO2 concentration that much. (Less human contribution and negative feedback produce only single tenth of a degree.)
Note that IPCC says +1 degree C is the temperature change if no feedback affect the system.
The feedback representation of clouds in the models is just a guess and not based on empirical knowledge. This is also the case for H2O and water vapor content in the atmosphere. The models are tuned in to result in a quite strong positive feedback, and that in a quite limited range. Models which falls outside this feedback range are discarded as non-consensus. Science is settled…
The AGW/left alliance never won a “battle” however with leftist gov. around the western world they probably win the “war”
Common sens and science can not defeat where the will is to destroy and rule.
Greenorblue (13:44:51) :
Nasif Nahle (13:30:46) :
Why such a difference between the two graphs?
The proxies, number of proxies, locations and number of locations make the difference. If one examines all the databases on paleotemperatures, one would find they all look different.
It seems that Hanno took a database from treerings (any) and only added the historical temperatures, without proportion at the right end of the graph with respect to the proxies database, however.
Carsten Arnholm, Norway (12:57:40) :
This abstract of one of Hannos papers speaks for itself
http://www.springerlink.com/content/l7201j54p1w10805/
“When communicating with the public, scientists ought to be aware of their responsibility to use a language that is understood by laypeople. ”
– Hanno –
“On the one hand, as scientists we are ethically bound to the
scientific method, in effect promising to tell the truth, the whole
truth, and nothing but – which means that we must include all the
doubts, the caveats, the ifs, ands, and buts. On the other hand, we
are not just scientists but human beings as well. And like most people
we’d like to see the world a better place, which in this context
translates into our working to reduce the risk of potentially
disastrous climatic change. To do that we need [Scientists should
consider stretching the truth] to get some broadbased support, to
capture the public’s imagination. That, of course, entails getting
loads of media coverage. So we have to offer up scary scenarios, make
simplified, dramatic statements, and make little mention of any doubts
we might have. This ‘double ethical bind’ we frequently find ourselves
in cannot be solved by any formula. Each of us has to decide what the
right balance is between being effective and being honest. I hope that
means being both.”
– Stephen Schneider IPCC lead Author: Stanford University –
Icarus (13:45:12) :
And, Icarus, even if you, Hansen, Gore, Mann and Schmidt, the IPCC and the One himself are all right about AGW, the cost in human lives, freedom and dignity are too much to pay to make the futile attempt to keep the climate at some “optimum” agreed upon by a grasping, selfish, greedy elite. If this was ever about science, that is long past. The AGW theory and its promoters need to kicked to the kerb and consigned to the trash bin of history. Humanity deserves better.
We should ask them to keep their word; they always said “global warming caused by greenhouse gases”, we must always remember them that, specially in colder times ahead. BTW: Where is that warming?
I had an honest LOL at the title of this one.
Wikipedia itself, on the page that generates citations cautions that it is a tertiary source, and thus not usually acceptable as a reference.
In other words, the latest UN paper on climate change probably would not have received a passing grade as a undergrad-level assignment. Bravo. I’ve been thinking for a while now that there must be some in the AGW camp that know the theory is bogus, but are aware that when the theory dies, it will take reputations (not to mention careers) with it. Seems like some must be in a hurry to do away with their reputation sooner than later.
Interestingly, this character even has a publication: Sandvik, H. (2008) “Etiske dilemmaer og filosifiske feilslutninger i klimadebatten” (Ethical dilemmas and philosophical fallacies in the climate debate)
Abstract:
The climate debate that has raged in recent years, is a good illustration of what happens when participants in a debate mixes (1) science, (2) philosophy of science, (3) science ethics, and (4) environmental ethics. All four factors are important in the climate debate, but all on their own (and not on each others) terms.
http://www.evol.no/hanno/08/FilSuppl.htm
Pathetic AGW propaganda masquerading as a science article. Funny guy, Hanno.
Hey, if Tony Blair can use a student’s dissertation to justify attacking and invading Iraq, and convincing the USA to do likewise, then I am sure that the UN can borrow a few Wiki graphs to frighten and tax us more.
http://en.wikipedia.org/wiki/Iraq_Dossier
Hell, we may as well run the law courts this way too. Wiki laws? Wiki judgements? Wiki sentencing?
Reply: I’m allowing this comment, but no subsequent debate on the Iraq war will be allowed. None, nada. Also, this is not an endorsement of the views expressed above. ~ ctm
Anthony
I hate to see people being talked about behind their backs. Perhaps you could let Hr Sandvik know of our concerns (by our, I mean all contributors to this thread with the exception of Icarus – and we all know what happened to him) and give him the opportunity to clear up the confusion over his material and clarify his sources.
I was going to do it myself, but an invitation from you would have considerably more conviction.
Peter Plail
It is extremely likely that Hr Sandvik has been notified about this thread by someone he knows. I don’t think anyone is talking behind his back. He is welcome to comment here just as Dr. Lund did a few days ago.
I take your point, Jeez, but, call me old-fashioned, I like to see a bit of courtesy. It sets an example to the AGW sites.
Peter Plail,
I’m not sure what you would want the letter to say.
“Is a defence of this such as ‘I believe in this cause’ enough? It smacks of religion but is dressed up as science and is therefore rather more deceitful.”
They’ll plead the precautionary principle.
As the person who raised this with Steve/CA – I’m glad the majority of comments on both blogs share my concerns.
I found the UNEP document via an article in the Daily Telegraph:
http://www.telegraph.co.uk/earth/earthnews/6228179/Climate-change-accelerating—UNEP.html
and this clearly suggests that the report is authoritative stuff (“400 scientific reports released through peer-reviewed literature, or from research institutions”) so I was just curious when I saw a reference to a 2009 hockeystick.
In fact I got completely sidetracked from my initial thought that there I’d spotted an anomaly between the DT headline:
“Climate change is happening faster than previously thought”
and the actual reporting:
“made a rise of between 1.4 and 4.3 degrees Celsius (2.5 to 7.75 F) above pre-industrial temperatures more likely”
I had thought this could be a case of the ‘future-present imperfect imperative” (courtesy of climate-resistance):
http://www.climate-resistance.org/2009/08/future-present-imperfect-imperative.html
always the same, how can we handle against it ?
go on street? damishe someone? how can we realy do something against al gore and friends bullshit propaganda?
i dont know, do you know ist better?
tarpon (14:21:11) :
When is all of the credibility left in science going to be sacrificed at the alter of the AGW hoax? Credibility is not a renewable resource, regardless how much grant money they shovel your way.
I fear that time is past (or at least fast approaching). It may take decades before the public regains its trust in science. And particularly so if whole nations are sacrificed in the name of AGW as the UNEP, IPCC and certain “progressive” politicians are demanding.
P R O V E . . I T . . ! ! !
No one has so far commented on the front page of the report, which is loaded with powerful metaphorics: The time is running out, our beautiful earth is going down the drain and will come out as a desert. The message here is clear and synthesized: We are destroying the planet, turning it into a desert. The desert sand in the bottom contrasts with the beautiful planet as we learned to see it from space, from the Apollon (though it’s true that we see large areas already consisting of desert, like the Sahara), and evokes old biblical wisdom like not to build your house on sand; in Norwegian we say “run out in the sand” (come to nothing), and also the expression “bury one’s head in the sand” comes to mind.
This is very professionally done, as opposed to the not-so-very-professional inclusion of the not-peer-reviewed hockey-stickish graph. They must have used true craftsmen in the field of advertising here, there is not much amateurish about this.
It reminds me of a comment from Green and Armstrong’s “forecasting audit” of the AR4:
“(…) the Chapter [8 of the IPCC report] reads in places like a sales brochure.”
I notice
Joel ShorePhil. hasn’t commented on the slickness of the report vs. the quality of the content.Great, jeez:
“For your editorial and marketing projects, turn to a pro. Joel Shore has the experience to create content that meets your needs ….”
http://www.joelshore.com/
That’s a different Joel Shore, but aside from that I erred, my post should have been as follows:
Jeez,
Phil… Jones?
Phil…Collns?
Phil…ippi?
Phil…Spector?
The truth in advertising: 4 out of 5 scientists recommend AGW gum for thier politicians who chew gum.
1 hated AGW gum.
3 weren’t totally convinced with the 1st serving.
1 liked the AGW gum.
So, since 3 of them didn’t say they hated AGW gum when it was tried out, then 4 out of 5 would probably say yes.
Warning: AGW gum is being recalled due to ABC contamination.
“Already Been Cooling”.
No problem, just repackage AGW gum and continue to peddle it.
Hanno: Watts in a name?
Stuart Huggett (14:08:11) : “Icarus.
I am not proposing to spend tens of billions of dollars of other people’s money on the basis of highly debatable climate ‘predictions’. Niether am I fabricating data to ‘prove’ those predictions. I am therefore very willing to be called to account for having asked questions – even if I am wrong.”
Saying “…the whole AGW scam” isn’t just asking questions or saying that the issue is ‘debatable’ – it’s flat-out denial. Are you so sure that it’s a scam? Have you spent years studying the physics involved? Are you certain that a dramatic increase in greenhouse gases is going to make no difference at all to the Earth’s climate? It’s not like this is just an experiment in a lab – we’re messing about with the planet we live on.
As far as I can tell, getting any country to spend any money at all on mitigation is like pulling teeth, but if there is money spent on switching to clean and renewable energy, reducing deforestation, averting ocean acidification etc., then surely these are good things anyway. Those ‘tens of billions of dollars of other people’s money’ won’t be entirely wasted… and it must surely be a drop in the ocean compared to the cost to us of dealing with dramatic changes in the Earth’s climate.
Icarus, your list:
is fraught with hidden assumptions, uncertainties, and unsupportable suppositions.
1. If CO2 is not a pollutant there is little unclean about a modern coal or natural gas power plant.
2. Renewable needs to be defined as something economically practical, not just cool and hip. Windmills and solar plants at this time, while they may improve in the future, do not compete in any economical way with fossil fuel energy production, nuclear, or hydroelectric. Should this change sometime in the future the switch will occur without the need for government mandate.
3. Massive amounts of deforestation are occurring now specifically to meet government mandates and artificial markets for biofuels.
4. Ocean acidification is a boogie man which will likely turn out to be nothing.
Those tens of billions of other money could be spent saving lives from inadequate water sanitation, building infrastructure, or developing agricultural technology instead of throwing it away down a government mandated rathole where any benefits are unlikely to be more than a small percentage of the costs. When you commit resources to be wasted you are just as likely condemning to death millions who could have had their cholera or starvation prevented as you think you are saving from your ill justified desire to save the planet.
Hanno has fabricated one of the most ginned up charts I’ve seen in a long time: click.
It has all the credibility of this chart: click.
Magnus A (14:31:11) : Icarus.
One thing needed for more than one degree heat from by human added CO2 is reinforcement, i.e. total positive feedback. Positive feedback would mean that climate is quite instable, which it isn’t. Also many measures of the response on Earth’s temperature from e.g. volcanoes and changes in clouds has showed negative feedback, which reduces impact from CO2.
There may very well be negative feedback mechanisms but that doesn’t mean there is a net negative feedback. For example, a warmer atmosphere and warmer ocean inevitably means an increase in atmospheric water vapour, which is of course a greenhouse gas – this is a positive feedback.
Let’s suppose that there is in fact a net negative feedback from forcings. In that case, the effect of the ~11-year solar cycle should be less than that predicted by straightforward radiative equilibrium calculations. This paper suggests the opposite:
http://arxiv.org/ftp/physics/papers/0411/0411002.pdf
The authors suggest that the effect of the solar cycle is actually twice as large as would be expected, which they attribute to net positive feedback.
Also, if you’re arguing that the Earth’s climate is very stable due to negative feedback mechanisms then it’s difficult to see how comparatively small changes in solar irradiance (Milankovitch cycles) have made such large changes in palaeoclimate – i.e. ice ages and interglacials. Don’t those changes suggest that the climate is actually quite sensitive to quite small forcings?
Icarus
Thank you for considering these things. Several points I should like to make:
1 When I talk about the AGW ‘scam’ I am referring to the alarmist rant we are continually subjected to in the MSM. Not to the many dedicated scientists an others who spend their lives collecting and interpreting dat.
2 Your long speech about forests, resources, fuel and the environment reflect my views entirely. Why wrap it all up in some specious and politically motivated clap trap? In the end the fallout will so degrade the credibility of science and the environmental movement that the problems in your list will be even more difficult to solve.
3 Icarus is a great pseudonym for someone who thinks that CO2 rather than the sun drives our climate. Please give me the actual data as you understand it that makes you think this.
Rather, call it “Summary Judgement” after having studied and reviewed the arguments, the basis and the ‘merits’ presented by both sides …
An aside, I cannot but help but see “Iscariot” (as in Judas ___) when cursorily inspecting your screen name … an intentional choice of same?
.
.
Robert E. Phelan (14:40:35) : Icarus (13:45:12) : And, Icarus, even if you, Hansen, Gore, Mann and Schmidt, the IPCC and the One himself are all right about AGW, the cost in human lives, freedom and dignity are too much to pay to make the futile attempt to keep the climate at some “optimum” agreed upon by a grasping, selfish, greedy elite.
It seems to me that at the moment at least, the ‘grasping, selfish, greedy elite’ are trying very hard to carry on with ‘business as usual’ and not spend anything at all on mitigation… but that aside, that ‘optimum’ climate you’re talking about isn’t just some arbitrary state, but the one that has supported all of human civilisation for the last 10,000 years or so. Don’t we at least have a responsibility to try to avoid causing dramatic changes which will have to be dealt with by future generations?
No-one disputes that there are billions of tons of greenhouse gases in the atmosphere which are the sole result of human activities in the last 250 years or so. We’re effectively conducting a substantial experiment on the planet we live on, without knowing for sure what the result will be. Is that responsible behaviour? Even it were true that this CO2 would have no detrimental effect at all, we don’t know that now, so considering the risk, shouldn’t we just not do the experiment?
Icarus:
Again fraught with hidden assumptions.
Let me rephrase. Simply spend trillions, condemning untold hundreds of millions of people to disease, premature death, and suffering, because there might be a problem. In case you don’t realize it, costs have costs.
Icarus (19:06:17) :
“… that ‘optimum’ climate you’re talking about isn’t just some arbitrary state, but the one that has supported all of human civilisation for the last 10,000 years or so…”
I may be offering a cultural anthropology class next semester; maybe you’d like to sign up for it and learn something real.
The same UNEP report has Figure 1.2 credited to two, the second being Rhode 2009. Who? Looks like it’s Wikipedia image http://commons.wikimedia.org/wiki/File:Mauna_Loa_Carbon_Dioxide.png with some background removed.
The report also uses illustrations from the other scientific sources “National Geographic” and “WWF”.
What is the U.N. position on copyrights and licensing?
Oops. Typo in Robert A. Rohde’s name.
Stuart Huggett (18:53:01) : Icarus
Thank you for considering these things. Several points I should like to make:
1 When I talk about the AGW ’scam’ I am referring to the alarmist rant we are continually subjected to in the MSM. Not to the many dedicated scientists an others who spend their lives collecting and interpreting dat.
Fair point. The ‘MSM’ as you call it are in the business of making money and that is all they care about – they will sensationalise, distort and invent information freely if they think it will make an extra quid. They will be controversial and contrary purely for the sake of it, regardless of the merit of any particular argument. Nevertheless, that doesn’t mean that any particular argument you see in the MSM is wrong or exaggerated. They could just happen to be right.
2 Your long speech about forests, resources, fuel and the environment reflect my views entirely. Why wrap it all up in some specious and politically motivated clap trap? In the end the fallout will so degrade the credibility of science and the environmental movement that the problems in your list will be even more difficult to solve.
I don’t know what ‘claptrap’ you’re referring to. I’m only interested in the science.
3 Icarus is a great pseudonym for someone who thinks that CO2 rather than the sun drives our climate. Please give me the actual data as you understand it that makes you think this.
I don’t think that at all – in fact I think the sun has quite a substantial effect on the climate with relatively small changes in solar irradiance, which makes it all the more alarming that we’re ‘twiddling the knobs’ by making substantial changes to atmospheric greenhouse gases when it appears that the climate is really quite sensitive to relatively small forcings, including greenhouse gases.
For example: The last glaciation is thought to have resulted from a forcing of around 7 W/m2 (causing about a 5°C change in global temperature), but that includes long-term feedbacks from ice sheets, vegetation changes etc. – the actual change in solar irradiance was maybe half that, or a 2% change in solar forcing.
The radiative forcing for a doubling of CO2 is estimated at 3.7±0.4 W/m2 – not much different from that 2% change in solar irradiance… and that is before the long-term feedbacks are taken into account. So, doubling CO2 is likely to have the same magnitude of effect (in the long term) as the difference between an ice age and an interglacial – perhaps a 5°C change in global average temperature. That’s pretty significant, isn’t it?
The “WWF”? The World Wrestling Federation has a dog in this fight?
Oops, sorry, name change – the WWF I refer to is now former, and now known as World Wrestlng Entertainment, http://www.wwe.com
.
.
.
Well, Icarus, with the planet cooling while CO2 rises you are at least in less danger of the sun melting your feather wax and causing your gross weight to exceed your coefficient of lift.
Icarus (19:57:35) :
The radiative forcing for a doubling of CO2 is estimated at 3.7±0.4 W/m2 – not much different from that 2% change in solar irradiance…
Estimated by whom?
What I have seen is it is the number needed so that the models could fit the temperature data ( they cannot fit anything else after all). It is in actuality a parameter coming out of a fit after innumerable assumptions, the main one being that “we want CO2 to be the culprit”.
Had they changed in the input to the models “cloud cover”, for example, which their output fits badly if you go and look in the IPCC reports, they could fit the temperature data by that “forcing” without needing CO2 at all. It would be hard though to create a chicken little syndrome in the general public by advising reducing water use.
It is all a huge video game based on General Circulation Models’ which are based on taking a linear approximations to solutions of fluidity equations at the boundaries of boxes that make a grid of 200km by 200km by 20km height of the globe, and anything they cannot compute entered as a parameter by hand.
With four parameters you can fit any function and with five an elephant. There are many more than that in the GCMs and the only thing they fitted successfully was the temperature ( check the AR4 chapter 8) and the data in this century does not follow their “predictions” as has been clearly documented in many places ( check Lucia’s the blackboard).
These GCM cannot predict the weather for ten days well: due to the highly non linear form of the solutions of the fluidity equations, after a number of time steps non linearity kicks in.
The same models with a change of time scale are supposed to work for climate, but the defect is the same: after a number of time steps non linearity, reality, steps in and diverges from the proposed extrapolations of fits to previous data.
Maybe here I should answer a question I was asked in another thread : maybe the models cannot predict the four seasons weather either ! But that even astrologists can predict: you will meet a handsome stranger and have a great date
And I will also enter in my diatribe about propagation of errors. There is no propagation of errors in the GCM outputs of the IPCC, and this is acknowledged in chapter 8 of the AR4, search for “likelihood”. The errors are estimated by the experience of the modelers!!!
If normal error propagation were used, i.e. the input parameters varied within their errors and a chisquare per degree of freedom error were given, I am guessing the solutions, and therefore predictions, would have at least 2C degrees error bars (otherwise they would have shown error bars).
What they show, i.e. the spaghetti graphs that fool the average scientist’s eye that they are error bands, are proposed to be a simulation of the chaotic nature of climate. I should love to see an engineer proposing a bridge with such methods.
The only effort at truly simulating the chaotic nature of climate that I have seen has been discussed here in the Tsonis et al paper thread, where they use the air and ocean currents to project future behavior. Imo that is the way modeling should go if we are to have any sense in this climate prediction mess ( they predict cooling the next 20 years or so).
Icarus. Anna V has put it far better than I could. We are expected to make major changes to our civilisation on the basis of highly disputed ‘estimates’ and ‘predictions’. We need better reasons and much less hysteria if this to be done effectively
ChrisM (11:30:31) : My son has been told he must not use wikipedia for school work as it is unreliable.
Too bad a video couldn’t be made of people’s reaction when they find that the UN uses material from a Wikipedia author.
jeez (15:37:52) : Oh and by the way they’ve also noted you’re a fanatic socialist ecofreak with delusions of ecotopia. Want to come by and comment on it?
Thanks for the good laugh!!
Icarus (19:57:35) : The last glaciation is thought to have resulted from a forcing of around 7 W/m2 (causing about a 5°C change in global temperature), but that includes long-term feedbacks from ice sheets, vegetation changes etc. – the actual change in solar irradiance was maybe half that, or a 2% change in solar forcing.
The radiative forcing for a doubling of CO2 is estimated at 3.7±0.4 W/m2 – not much different from that 2% change in solar irradiance… and that is before the long-term feedbacks are taken into account. So, doubling CO2 is likely to have the same magnitude of effect
You sound like quite an expert.
Say, have you done the math in this video to see if the man is right; that there can be no runaway warming from increasing amounts of co2 ? There has been an open challenge for 2 years for someone to show that he is wrong. Until now no one has done it.
Can you?
If you can’t then you shouldn’t speak with such certainty about what co2 does to the environment.
Miskolczi`s New Greenhouse Law
Here’s an insight into what’s going on at British science institutions. Apply it to alarmist nonsense for a clear picture of how scientists have become pimps and advertisers for 3rd parties
http://news.bbc.co.uk/1/hi/magazine/8270688.stm
“Steve McIntyre’s discovery of a UNEP’s folly bears repeating” –
shouldn’t have an “a” before “UNEP’s”.
>>>the cost in human lives, freedom and dignity are too much
>>>to pay to make the futile attempt to keep the climate at some
>>> “optimum” agreed upon by a grasping,
This has nothing to do with climate – they all know the science is false.
It is all about setting up a One World government. To do so, you need One World (Global) issues for this Global government to tackle. Which is why we now have Global Warming, Global Carbon Credits, Global pandemics (that never happen), Global financial crashes, Global depressions, Global terrorism, and recently we have Russia and China pushing for a Global currency.
It is all about politics, not science or climate.
.
An outstanding summary here:
http://www.americanthinker.com/2009/09/global_warming_science.html
Gene Nemetz (23:50:23) : Say, have you done the math in this video to see if the man is right; that there can be no runaway warming from increasing amounts of co2 ? There has been an open challenge for 2 years for someone to show that he is wrong. Until now no one has done it. Can you?
The argument states that the optical depth of the atmosphere is a constant. It isn’t. The addition of one kind of greenhouse gas isn’t magically and automatically counterbalanced by an equivalent removal of a different kind. There is no mechanism by which (for example) increasing atmospheric CO2 by 40%, as we have done, causes just the right amount of water vapour to drop out of the atmosphere to result in no change in the greenhouse effect. Indeed, the opposite is true – increasing atmospheric CO2 causes warming which in turn causes an increase in atmospheric water vapour (warmer oceans cause more evaporation and a warmer atmosphere holds more water), hence there is a positive feedback.
So, the argument is clearly nonsense.
If Icarus is so sure about CO2 causing positive feedback through increased atmospheric water vapor, perhaps he can expalin why we continue to have an equable climate even though past CO2 levels were as much as 100 times greater than today. What happened to the positive feedback back then?
Icarus
“that ‘optimum’ climate you’re talking about isn’t just some arbitrary state, but the one that has supported all of human civilisation for the last 10,000 years or so. Don’t we at least have a responsibility to try to avoid causing dramatic changes which will have to be dealt with by future generations?”
And just what optimum climate are *you* speaking about? The postglacial climate optimum? or the Preboreal cold event? or the 8,2 Kyr cold event? or the 4.2 Kyr cooling? or the Roman Warm Period? or the MWP? or the LIA? or….
For your information climate has changed a quite a bit during those 10,000 (actually 11,700) years since the last ice age ended. Generally speaking human civilizations have flourished best when it was warm.
Icarus,
This water vapour feedback argument is quite strange on three counts. The IPCC say that if the temperature increases by about 1.2C (the acknowledged temperature sensitivity to doubling CO2 without feedbacks) then the warming will lead to increased water vapour that will drive temperatures up by 3.5C. However, the first problem with this is that the global average temperature varies by 4C during a year. Could you explain why this does not invoke the water vapour feedback as described?
The second point about warmer air holding higher absolute amounts of water vapour is true as far as the train of thought goes, but it does not follow this to its conclusion. It ignores the fact that this water vapour eventually comes out as precipitation as warm fronts rise over cold air masses. This is basic meteorology. If this was not the case then there would indeed be a positive feedback that forces water to evapourate in ever higher absolute amounts, causing ever higher temperatures until the whole of the earth’s oceans will end up suspended above our heads. Such a thing has never been observed.
Thirdly, if CO2 has such a violent affect on climate, then can you explain why CO2 levels averaged around 2000ppm during the Mesozoic without the catastrophic effects you imply should happen? This is not 1 but 3 doublings. By your numbers this should have led to a temperature increase of 10C, utterly catastrophic!
Icarus,
When you highlight positive feedbacks in solar TSI, as you did when you cited the excellent paper by Douglass et al, and use that to make general extrapolations to conclude that positive feedbacks dominate the Earths climate, you are committing an error of logic.
Solar cycles may well cause temperature amplification by positive feedback. Indeed, this has been claimed by Svensmark’s GCR hypothesis. In that scenario, the higher solar activity would result in a reduction in cloud cover that allows more insolation of the Earths surface and subsequent warming.
Now, consider that the effect of this warming would lead to increased evaporation, formation of Cu Nimb clouds raising sensible heat to the tropopause, and consequent precipitation. The clouds increase albedo AND lift sensible heat where it can radiate into space. This would be a net negative feedback.
Of course, the two feedbacks do not happen contemporaneously. First there is the positive feedback as described by Douglass and there is a time lag before the oceans can warm sufficiently. Then the negative feedbacks increase and overwhelm the positive. Therefore it is perfectly possible to envisage positive feedbacks operating on particular forcing mechanisms while still having a net negative feedback operating on the climate at a later point in time.
There should be nothing strange or difficult to understand about this.
Icarus:
“The last glaciation is thought to have resulted from a forcing of around 7 W/m2 (causing about a 5°C change in global temperature), but that includes long-term feedbacks from ice sheets, vegetation changes etc. – the actual change in solar irradiance was maybe half that, or a 2% change in solar forcing.”
These figures don’t seem right to me. Indeed, they seem complete nonsense. My understanding is that the last glaciation was accompanied by a drop of insolation of about 60 Watt/Meter squared.
Can you please give a reference for your figure of 7 watt/meter squared?
I just love the way they say “Hanno 2009” as if the graph comes from a legitimate publication. Too bad Hanno’s user handle wasn’t something like “racoon37”
Seeing how we seem to have on-board at the moment a ‘live’ proponent of AGW, I wonder, what would our [presumably young] scribe proscribe or prescribe in the way of applying “The Precautionary Principle” SHOULD global cooling be indicated in the instrumental record to be underway, in say, another 10 years –
a) Campaign for an INCrease in the use of CO2 based fuels (thereby REVERSING the cooling)
b) Continue a push for a DECrease in the use of CO2 based fuels (thereby HASTENING the cooling trend, leading to potential crop failure et al)
c) Do nothing.
.
.
.
Icarus:
“It seems to me that at the moment at least, the ‘grasping, selfish, greedy elite’ are trying very hard to carry on with ‘business as usual’ and not spend anything at all on mitigation.”
Who are these ‘grasping, selfish, greedy elite?’
Do you mean Goldman Sachs who are actively lobbying Congress on a cap & trade mechanism to they can pocket billions running the trading markets?
Do you mean General Electric who is lobbying for Waxman Markey so that consumers would be forced into buying expensive GE products?
Do you mean General Motors who are taking tax dollars to manufacture so called “green autos”?
Do you mean the likes of Duke energy, Dow chemicals, Caterpillar, Deere, who are actively lobbying congress to pass Waxman Markey for no obvious gain?
Do you mean Al Gore’s company that trades emission trading certificates in London?
I’m not trying to score debating points here, I just want to know which companies you have in mind and why?
thechuckr (05:05:52) : If Icarus is so sure about CO2 causing positive feedback through increased atmospheric water vapor, perhaps he can expalin why we continue to have an equable climate even though past CO2 levels were as much as 100 times greater than today. What happened to the positive feedback back then?
I’ve never heard of it being anywhere near “100 times greater than today”. Cite, please? Certainly atmospheric CO2 has been several times higher than today at various times in the distant past (millions of years ago) and those periods correspond to a warm, ice-free Earth, very different from today’s climate – e.g:
http://www.sciencedirect.com/science?_ob=ArticleURL&_udi=B6V66-4K2SKCB-1&_user=10&_rdoc=1&_fmt=&_orig=search&_sort=d&_docanchor=&view=c&_acct=C000050221&_version=1&_urlVersion=0&_userid=10&md5=d55e961687e6b6641a794af56bd07707
So if the Earth is warm when CO2 is high, and cooler when CO2 is low, what exactly are you disputing? You have to remember that any increase in the greenhouse effect is going to result in a new equilibrium – i.e. the Earth warms up until it is once again radiating away as much heat as it is receiving. That is a long process (hundreds to thousands of years) and it is modified by feedbacks. If there is a net positive feedback then the equilibrium global temperature will be higher than it would otherwise be, from the effect of the greenhouse gas alone. Just because there is a net positive feedback, that doesn’t mean there will be never-ending warming – it just means that the final equilibrium reached will be higher.
Icarus:
“increasing atmospheric CO2 causes warming which in turn causes an increase in atmospheric water vapour (warmer oceans cause more evaporation and a warmer atmosphere holds more water), hence there is a positive feedback.”
What you describe is an unstable system. The cause of the intial warming in such a system, wheather it is co2 or solar, is immaterial, once started it will continue until some other factor intervenes. Where does it end ? It ends when the atmosphere saturates (clouds) and the water precipitates out (rain). What Miskolczi indicates is that we already have a runaway water vapor ‘greenhouse’. The addition of co2 just alters the distribution of greenhouse gases slightly. The system is completely dominated by water vapor. You might look up the changes over time of the water vapor at various altitudes. It has been decreasing as Miskolczi predicts.
Icarus: “There may very well be negative feedback mechanisms but that doesn’t mean there is a net negative feedback. For example, a warmer atmosphere and warmer ocean inevitably means an increase in atmospheric water vapour…”.
Without empirical proof you can‘t say H2O “inevitably” has to be a (strong dominating) positive feedback as the climate models suggest. It’s something more complicated. E.g. most GCMs (as well as proxy data) suggest that there will be increased rain in a warmer world. More rain may be a negative feedback on humidity so we got a very small positive H2O feedback. Clouds change in response to humidity and heat are other factors we don‘t know much about. Measurement in the troposphere shows water vapor decrease when temperatures increases. (Miskolczi’s theory seems to be very interesting.) Some satellite data however says H2O increases. Anyway we can’t for sure say H2O increases, and a strong positive feedback isn’t indicated in the responses from volcanoes and changes in clouds [2] (btw, the Douglass paper you linked suggests negative feedback from volcanoes).
Icarus: “Let’s suppose that there is in fact a net negative feedback from forcings. In that case, the effect of the ~11-year solar cycle should be less than that predicted by straightforward radiative equilibrium calculations. This paper … The authors suggest that the effect of the solar cycle is actually twice as large as would be expected, which they attribute to net positive feedback”.
Douglass et al looks at changes in irradiance. The solar cycle is an exception to other examples, such as volcanoes [1] and clouds [2], with contradicting feedback result. So is a supposed positive feedback something else? Changes in cloud cover strongly co-vary with CGR in the 11 year solar cycle [3]. Also Svensmark’s latest study shows in a full-scale atmospheric experiment that Forbush decreases strongly affect clouds [4], so we got a mechanism, where cloud is the driver, that explains the solar cycle exception.
A paper (besides Douglass et al) recently is Meehl et al 2009 [5], suggesting positive feedback from evaporation in cloud free East Pacific, as well as increasing ozone concentration (a greenhouse gas) in the upper troposphere. I don’t claim this isn’t real positive feedback components, but the counter argument is still valid: Response from other impacts suggests a total negative feedback. (Meehl et al don’t measure low level cloud coverage, or care about [2] and [3].)
Icarus: “Also, if you’re arguing that the Earth’s climate is very stable due to negative feedback mechanisms then it’s difficult to see how comparatively small changes in solar irradiance (Milankovitch cycles) have made such large changes in palaeoclimate – i.e. ice ages and interglacials”.
I agree that positive feedback should control large fluctuations in temperature during ice ages. In comparison with stable interglaciers ice ages are more volatile, and several degrees cooler temperatures suggests positive feedback. The ice reflecting sunlight should be a strong positive feedback. (Since Earth the last millions of years hasn’t plunge into a snowball Earth I guess that boundaries where negative feedback becomes as important as this positive feedback stop this.)
Also there’s no data that suggesting total positive feedback from CO2 some millions of years ago, with increasing temperatures of several degrees (in the by then normally slightly warmer ice free world).
[1] E.g. Barrett Bellamy at http://barrettbellamyclimate.com/page25.htm
[2] Palle et al 2004, “The Earthshine Project:…” http://solar.njit.edu/preprints/palle1266.pdf
[3] Palle/Butler/O’Brian 2004: http://www.arm.ac.uk/preprints/433.pdf
[4] Science Centric: “Cosmic meddling with the clouds by seven-day magic”
http://www.sciencecentric.com/news/article.php?q=09080111-cosmic-meddling-with-the-clouds-by-seven-day-magic
[5] http://wattsupwiththat.com/2009/08/27/ncar-spots-the-transistor-effect-small-solar-activity-fluctuations-amplify-to-larger-climate-influences/
tty (05:18:42) : For your information climate has changed a quite a bit during those 10,000 (actually 11,700) years since the last ice age ended.
By what measure has the global climate ‘changed quite a bit’ in the last 10,000 years? All the evidence shows just the opposite –
http://earthobservatory.nasa.gov/Features/Paleoclimatology_IceCores/
Icarus (03:57:19) :
There is no mechanism by which (for example) increasing atmospheric CO2 by 40%, as we have done, causes just the right amount of water vapour to drop out of the atmosphere to result in no change in the greenhouse effect. Indeed, the opposite is true – increasing atmospheric CO2 causes warming which in turn causes an increase in atmospheric water vapour (warmer oceans cause more evaporation and a warmer atmosphere holds more water), hence there is a positive feedback.
So, the argument is clearly nonsense.
—-
Er, uhm, no. Well, actually, yes.
Yes, we can prove your conclusion “So, the argument is clearly nonsense” by examining the evidence.
900 years ago, the earth was as warm (or warmer) than it is now. And it cooled off, dropping well below today’s temperatures. Clearly there was NO positive water vapor feedback mechanism.
70 years ago, the earth was as warm (or warmer) than it is now. And it cooled off, dropping well below today’s temperatures. Clearly there was NO positive water vapor feedback mechanism.
10 years ago, the earth was as warm (or warmer) than it is now. And it cooled off, dropping down to today’s temperatures. Clearly there was NO positive water vapor feedback mechanism.
—
Now let us examine the relationship between changing atmospheric CO2 levels and global temperatures over the past 120 years:
From 1890-1940 CO2 was constant, and temperatures rose.
From 1940-1973 CO2 was increasing, and temperatures fell.
From 1973-1998 CO2 was increasing, and temperatures rose.
From 1998-2009 CO2 was increasing, and temperatures fell.
So, the argument is clearly nonsense.
******
Icarus (19:06:17) :
It seems to me that at the moment at least, the ‘grasping, selfish, greedy elite’ are trying very hard to carry on with ‘business as usual’ and not spend anything at all on mitigation…
******
Do you have any idea of the money, effort and time that has been spent in the last 30 yrs in developed nations, and continues at increasing rates, for environmental “mitigation”? The cost-of-living has increased considerably in those nations due to “mitigation”. That’s been “business as usual” for decades.
What dimension do you live in?
In Icarus (03:57:19)
You said “There is no mechanism by which (for example) increasing atmospheric CO2 by 40%, as we have done, causes just the right amount of water vapour to drop out of the atmosphere to result in no change in the greenhouse effect”.
But that negates your prior claim of 3.7 w/m2 of forcing for CO2 doubling. For that claim to be true, there can be no increase in water vapor since the water vapor forcing will reduce the CO2 forcing to about half of your number.
For “Hanno 2009” they used his account name. For “Rohde 2009” they used his real name instead of the more consistent “Dragons flight 2009”.
Icarus (06:35:19)
The reference you cite is a strange one in relation to current CO2 ppm (take the ~385ppm level on the graph about which this thread is meandering) since the abstract states:
“For periods with sufficient CO2 coverage, all cool events are associated with CO2 levels below 1000 ppm. A CO2 threshold of below 500 ppm is suggested for the initiation of widespread, continental glaciations, although this threshold was likely higher during the Paleozoic due to a lower solar luminosity at that time.”
For modelled historic CO2 levels see Phanerozoic Carbon Dioxide graph as an example:
http://upload.wikimedia.org/wikipedia/commons/7/76/Phanerozoic_Carbon_Dioxide.png
The timescale is from right to left (present day) . And yes I did just reference a diagram on Wikipedia. For more academic detail with RCO2 not ppm see:
http://www.geocraft.com/WVFossils/Reference_Docs/Geocarb_III-Berner.pdf
(“Results are expressed as RCO2 which is defined as the ratio of mass of CO2 in the atmosphere at time t divided by the mass at present, and the results are compared to a standard run, where best estimates of the various input parameters are used. To convert RCO2 to CO2 concentration, because of
appreciable errors inherent in this kind of modeling, a rough value of 300 ppm can be used to represent “the present.””)
The Geocarb III model peaks about 520Mya with levels 26x current. Plenty of caveats for the unwary but still it’s interesting.
hmmm… maybe Icarus should change his anonym to “pinata”
Icarus (03:57:19) :
The nonsense is your reply that was found on some rebuttal web site.
Take up the challenge of doing the math instead of repeating troll rebuttals.
In trying to make a point about this issue elsewhere, I went to a random page in the document and picked a random paragraph. The first full paragraph on page 15 is
“Documentation of this trend has been building for the last century and studies of glaciers and ice caps are becoming more sophisticated with new satellite-based observation technologies and attempts to distinguish glacier responses to multiple variables (WGMS 2008a, WGMS 2008b, Braithwaite et al. 2009).”
The intent was to show that the bibliographic citations in the main body of the document are connected to bibliographic references in the nine page reference section. The only problem: Braithwaite et al. 2009 isn’t listed in the references.
I did not perform any other cross checks. The first and only cross check that I did perform showed a discrepancy. So, how many other citations in the main body are not listed in the references section? And how many of those nine pages of references are never cited in the document?
thechuckr (05:05:52) : If Icarus is so sure about CO2 causing positive feedback through increased atmospheric water vapor…
thechuckr,
I’d like to know which troll-based rebuttal Icarus will give to Roy Spencer’s work in this 2 part YouTube series on H2O and negative feedback.
Icarus is flying too high toward the heat of real data with his wax troll wings which are melting leaving with only a hard fall down in his future.
Why the IPCC models are wrong
Icarus (03:57:19) :
Troll,
The ad hoc assumption is made by the IPCC.
Miskolczi’s math still has not been found wrong.
If you have found it wrong then lay out your case. Leave it open to the entire math and science world as Miskolczi has done.
Also, send your work to Miskolczi. See what his reply is.
Submit your work to the public. Let’s see what we find.
David (13:54:34) :
In trying to make a point about this issue elsewhere, I went to a random page in the document and picked a random paragraph. ……. I did not perform any other cross checks. The first and only cross check that I did perform showed a discrepancy. So, how many other citations in the main body are not listed in the references section? And how many of those nine pages of references are never cited in the document?
—-
Please repeat this amazing observation as a comment at climateaudit.com; I think they will find it “interesting” ….
Vincent (05:19:16) : Icarus
This water vapour feedback argument is quite strange on three counts. The IPCC say that if the temperature increases by about 1.2C (the acknowledged temperature sensitivity to doubling CO2 without feedbacks) then the warming will lead to increased water vapour that will drive temperatures up by 3.5C. However, the first problem with this is that the global average temperature varies by 4C during a year. Could you explain why this does not invoke the water vapour feedback as described?
I haven’t read that the global average temperature varies by 4°C in the course of a year – can you find a reference for that? Regardless of the value though, it seems to me that any such temperature range would necessarily already include the water vapour feedback, since it responds on a very short timescale (a few days).
The second point about warmer air holding higher absolute amounts of water vapour is true as far as the train of thought goes, but it does not follow this to its conclusion. It ignores the fact that this water vapour eventually comes out as precipitation as warm fronts rise over cold air masses. This is basic meteorology. If this was not the case then there would indeed be a positive feedback that forces water to evapourate in ever higher absolute amounts, causing ever higher temperatures until the whole of the earth’s oceans will end up suspended above our heads. Such a thing has never been observed.
It’s precisely because of its short residence time in the atmosphere (a few days) that water vapour is a feedback, not a forcing, and therefore cannot have this ‘runaway’ effect that you suggest. On its own, any increase in water vapour in the atmosphere would have a negligible effect on global temperature because it would (as you say) precipitate out in at most a few days. A long-term forcing such as an increase in solar irradiance or long-lived greenhouse gases is necessary to support a long term change in water vapour in the atmosphere, with its resultant increase in greenhouse effect (positive feedback) added to the primary forcing.
Thirdly, if CO2 has such a violent affect on climate, then can you explain why CO2 levels averaged around 2000ppm during the Mesozoic without the catastrophic effects you imply should happen? This is not 1 but 3 doublings. By your numbers this should have led to a temperature increase of 10C, utterly catastrophic!
From what I’ve read, the Mesozoic was indeed up to ~10°C warmer, so this fits quite well – especially as the solar flux was at least 1% smaller than it is now (although I think your average CO2 of 2000ppmv is an exaggeration – I’ve seen quoted a *peak* of 1,130 ppmv). If the sun was weaker, the CO2 concentration was subtantially larger, and the global temperature was substantially higher, doesn’t that support the concern that anthropogenic increases in CO2 will cause climate change well outside the normal range of the last 10,000 years or so?
http://www.nature.com/ngeo/journal/v1/n1/full/ngeo.2007.29.html
mr.artday (21:25:09) : Well, Icarus, with the planet cooling while CO2 rises you are at least in less danger of the sun melting your feather wax and causing your gross weight to exceed your coefficient of lift.
The planet is actually warming at about 0.2°C per decade and has been doing so for several decades. What do you attribute this to, if not primarily the anthropogenic increase in greenhouse gases?
We would *expect* this substantial rise in greenhouse gases to cause a corresponding rise in global temperature (that’s why they’re called ‘greenhouse gases’, after all), so you have to be arguing that not only is this warming completely counteracted by some mysterious phenomenon, but there is also *another* mysterious phenomenon which just by sheer coincidence is causing this 0.2°C/decade rise in global average temperature at the very same time as we would expect a rise in temperature caused by the greenhouse gases.
Seems a bit of a stretch to me, but I’d be interested to hear the details of your argument.
auto249243 (06:46:15) : Icarus:
“increasing atmospheric CO2 causes warming which in turn causes an increase in atmospheric water vapour (warmer oceans cause more evaporation and a warmer atmosphere holds more water), hence there is a positive feedback.”
What you describe is an unstable system. The cause of the intial warming in such a system, wheather it is co2 or solar, is immaterial, once started it will continue until some other factor intervenes. Where does it end ? It ends when the atmosphere saturates (clouds) and the water precipitates out (rain). What Miskolczi indicates is that we already have a runaway water vapor ‘greenhouse’. The addition of co2 just alters the distribution of greenhouse gases slightly. The system is completely dominated by water vapor.
My understanding is that water vapour is a feedback, not a forcing, due to its very short residence in the atmosphere. While it’s there, certainly it is the single largest absorber of long wave radiation in the atmosphere, but it’s only there because other much longer-lived greenhouse gases create the right conditions for it to be there, warming the oceans and atmosphere so that evaporation can occur. The system is not ‘completely dominated by water vapour’ – far from it.
You’re right when you say “The cause of the intial warming in such a system, whether it is co2 or solar, is immaterial” – that’s the whole point. Turning up the CO2 isn’t much different from turning up the sun, and we all agree that turning up the sun would make the planet warm up.
You might look up the changes over time of the water vapor at various altitudes. It has been decreasing as Miskolczi predicts
One obvious result of AGW is that, in the short term, temperature in the lower atmosphere rises while temperature in the upper atmosphere falls (because less long wave radiation is reaching the upper atmosphere – instead it’s down here warming up the planet). Colder air in the upper atmosphere of course holds less water vapour, so this result actually confirms AGW.
Luke Warmer (10:11:12) : Icarus (06:35:19)
The reference you cite is a strange one in relation to current CO2 ppm (take the ~385ppm level on the graph about which this thread is meandering) since the abstract states:
“For periods with sufficient CO2 coverage, all cool events are associated with CO2 levels below 1000 ppm. A CO2 threshold of below 500 ppm is suggested for the initiation of widespread, continental glaciations, although this threshold was likely higher during the Paleozoic due to a lower solar luminosity at that time.”
Doesn’t this tie in rather well with Hansen’s view that anything above ~450ppm means an ice-free planet?
http://pubs.giss.nasa.gov/docs/2008/2008_Hansen_etal.pdf
The planet is actually warming at about 0.2°C per decade and has been doing so for several decades. What do you attribute this to, if not primarily the anthropogenic increase in greenhouse gases?
Multidecadal oceanic and atmospheric cycles.
The current round of warming began in the late 1970s. From that time until 2001, a half dozen or more of the primary oceanic-atmospheric cycles went from cool to warm phase, one by one, on schedule. Then temperatures leveled out for several years. In 2007, the PDO entered a negative phase and temperatures began to drop.
Yes, CO2 may have an underlying thumbprint, but the larger fluctuation is similar to the 1920s and ’30s (CO2 “took off” after WWII), which tracks the PDO and AMO.
If temperatures increase this century as much as last, or even at twice the rate, we are in no immediate danger.
The IPCC mainstream projection has us heating at 4 to 5 times the rate of the 20th century, and so far there hasn’t been any net warming from 2001. This is based on positive feedback loop projections which have been called into serious question. If CO2 forcing alone occurs, we will likely heat slightly, but not at the rate the IPCC projects.
So you’re concerned, then, about the irrelevance of the so-called “hockey stick” and why it’s still prominently used. Concerned about the withholding of data and methods by those prominent in climate science. You’re concerned about the lack of independent replication of paleoclimate reconstructions. You’re concerned about the lack of validation of tree rings as thermometers, or lake varve sediments as thermometers, or any other proxy as thermometers. Right?
Icarus
I see you failed to produce your proof work showing Miskolczi is wrong.
I still wait.
Icarus (16:22:54) : The planet is actually warming at about 0.2°C per decade and has been doing so for several decades
The earth is cooling troll.
Icarus (16:22:54) : What do you attribute this to, if not primarily the anthropogenic increase in greenhouse gases?
Natural variation causes the earth to warm and cool. But trolls can’t say the words ‘natural variations are the reason for climate change’. Because as soon as they say them they stop being a troll.
As soon as you want to become human Icarus say those words. It’s magic.
RACookPE1978 (08:07:22) : 900 years ago, the earth was as warm (or warmer) than it is now. And it cooled off, dropping well below today’s temperatures. Clearly there was NO positive water vapor feedback mechanism.
How does this follow? Since water vapour is a feedback, it will respond to forcings from other factors, e.g. solar irradiance. A positive feedback effect doesn’t make it impossible for temperatures to fall. Why would it?
Now let us examine the relationship between changing atmospheric CO2 levels and global temperatures over the past 120 years:
From 1890-1940 CO2 was constant, and temperatures rose.
From 1940-1973 CO2 was increasing, and temperatures fell.
From 1973-1998 CO2 was increasing, and temperatures rose.
From 1998-2009 CO2 was increasing, and temperatures fell.
Your first statement is simply false –
https://sites.google.com/site/europa62/climatechange/fig2-3
The mid-century cooling is accounted for by aerosols from dirty industry which has now been significantly cleaned up.
Since then global temperature is been consistently rising at 0.2°C per decade and is still doing so, as CO2 is rising at an accelerating rate.
Seems like the relationship between CO2 and global temperature holds pretty well.
Icarus (16:44:26)
You say: “Turning up the CO2 isn’t much different from turning up the sun, and we all agree that turning up the sun would make the planet warm up.”
The question is how much will it warm up. Your claim above was 3.7 W/m2 for a doubling of CO2. Not catastrophic. You then implied catastrophe would come from water vapor feedback. But an increase in water vapor will lower the 3.7 W/m2, cut it in half in a likely scenario. This is not difficult to understand, the spectral lines are filled with the extra water vapor.
So “scientists” on your side invented a new theory, CO2 GH effect in the upper atmosphere where there is less water vapor. You might want to read about it so you can add it to your spiel.
I used the word ‘claptrap’ some time back and it was picked up by Icarus and Jeff Alberts. Thinking about the alarmist ravings I believe that a quotation of Charles Darwin in 1871 is enormously relevant – even enjoyable! – in this context:
Ignorance more frequently begats confidence than does knowledge – Charles Darwin 1871
Icarus
I see you were back here again and still failed to produce your proof work showing Miskolczi is wrong.
If your findings show that his assumption is wrong than lay out the case here, with all its detail. Let us see if you work is correct.
Do you have proof work for your claim?
Icarus (17:42:54) : Seems like the relationship between CO2 and global temperature holds pretty well.
For a certain ilk it does.
You remind me a lot of a person I debated on YouTube for months. He made claims that he would never back with data. He would repeat claims made by people like Al Gore and just merely for the fact that people like Al Gore made the claims was evidence enough for him that the claims were true—or at least true enough to be repeated, repeated ad nauseum. His ID at YouTube was grastog1313 (among other ID’s he used). Are you grastog1313 ?
Jeff Alberts (17:26:47) :
You said it better than me!!
Slightly OT but I see that Google Earth is to do a version which will ‘show the effects of global warming on the earth’ Amazing!
Gene Nemetz, I asked the *inestimable (J.) Iscariot if he would be of mind to apply the “The Precautionary Principle” SHOULD global cooling be indicated to be underway by instrumental record , in say, another 10 years … still no reponse.
I queried him/her what would be a possible choice of action, and further proferred three options as detailed again below:
a) Campaign for an INCrease in the use of CO2 based fuels (thereby REVERSING the cooling)
b) Continue a push for a DECrease in the use of CO2 based fuels (thereby HASTENING the cooling trend, leading to potential crop failure et al)
c) Do nothing.
and to this point, no response. I surmise he/she has not even considered the possibility of cooling, such has been his/her steeped indoctrination into/with AGW.
.
.
* inestimable: that [which] cannot be estimated or measured
.
.
A person whom I don’t know (or, to use this site’s terminology, “an anonymous author”) has drawn my attention to this URL. Reading this item and its commentary has been a Kafkaesque experience. At least as bizarre as the guesswork about my person, however, is the density of miscomprehensions about the logics of attribution, the aims of wikipedia, and the methods of science. The following remarks address some of them.
About attribution:
1) I have no connection with UNEP and have not been involved in the preparation of their Climate Change Science Compendium, nor was I even aware of its existence before this site was brought to my attention.
2) Having said this, UNEP was free to use the material because it was released under an open licence.
3) A quotation of a source does not indicate that the originator agrees in the conclusions drawn from it in the secondary publication.
About wikipedia and wikimedia:
4) Use of wikipedia as a source of illustrations (or other information) is not objectionable per se, it is so if and only if the validity of the information has not been verified using other reliable sources.
5) By creating or uploading images to wikimedia, the creator or uploader does not express agreement with the information displayed by the image, but may wish to (a) present influential (and potentially mutually exclusive) views for a balanced presentation of a controversial topic, (b) show earlier views to describe the history of a debate, (c) illustrate falsified ideas in order to explain common misunderstandings.
6) How well-accepted the information displayed in a figure is, cannot, therefore, be inferred from the mere fact that it is available at wikiMedia, it should be inferred from the text in the encyclopedia entries in wikiPedia that use this figure.
About science:
7) The figures that I have uploaded to wikimedia are not, and do not claim to be, anything but correct representations of the data they explicitly cite as their source.
8) The sources I have used are publicly available data from peer-reviewed scientific articles.
9) I do not and cannot guarantee the correctness of scientific articles that I have not authored or co-authored myself.
10) If anyone thinks to have found errors or weaknesses in any of my own publications, he or she is welcome to point out these mistakes by submitting an article to the journal were my original research has been published.
About global warming:
11) The conclusions arrived at by the IPCC or the UNEP do not critically depend on the curve colloquially referred to as the “hockey stick” nor an any other specific reconstruction of the climate of the past, but on the cumulative body of peer-reviewed knowledge.
12) The effects of global warming cannot be mitigated by censoring science, nor by threatening messengers to silence.
The level and tone of this debate (and of the enigmatic and intimidating e-mails that I have received lately) has not exactly increased my interest in participating beyond the above rectifications. I will therefore refrain from further comments.
Kind regards,
Hanno Sandvik
Hanno (01:57:08)
Thanks for commenting. I am sorry that you received intimidating emails. I do not believe they are representative of the vast majority of readers or commentators of this site.
Icarus,
“I haven’t read that the global average temperature varies by 4°C in the course of a year – can you find a reference for that?”
http://adsabs.harvard.edu/abs/2006AGUFM.A13D0970S
This NASA site says that “The annual cycle in temperature is massive relative to most climate variations, generally exceeding even the amplitude of glacial-interglacial temperature changes.”
You then said: “Regardless of the value though, it seems to me that any such temperature range would necessarily already include the water vapour feedback, since it responds on a very short timescale (a few days).”
Then doesn’t it seem very strange to hypothesise a run away warming when global average temperatures exceed 2C (or whatever they regard as a tipping point) when the global average ocillates twice this amount annually?
@Hanno (01:57:08) :
Thank you for your post. I appreciate having the opportunity to read your views on the kerfluffle.
Sorry to hear about the enigmatic and intimidating e-mails. Speaking only for myself, I don’t condone or participate in such activity.
Icaraus:
“I think your average CO2 of 2000ppmv is an exaggeration – I’ve seen quoted a *peak* of 1,130 ppmv). ”
It is not an exaggeration, I assure you. See below:
http://web.me.com/uriarte/Earths_Climate/Abundant_CO2.html
Your quotation of 1,130 ppmv seems to have been lifted from a paper called “Atmospheric carbon dioxide linked with Mesozoic and early Cenozoic climate change”. It appears they have used a new technique called carbon isotope fractionation.
Icarus:
“If the sun was weaker, the CO2 concentration was subtantially larger, and the global temperature was substantially higher, doesn’t that support the concern that anthropogenic increases in CO2 will cause climate change well outside the normal range of the last 10,000 years or so.”
During the late ordovician, CO2 levels climbed to 5,000 ppm yet the world entered a glaciation. Doesn’t that cast doubt of the claim that CO2 drives climate?
_Jim (22:06:45) :
I quit expecting much from AGW believers. They don’t know the logic of the arguments. They just have an environmentalist and political bias. Whatever helps their bias is what they will repeat.
Vincent (04:41:51) :
http://adsabs.harvard.edu/abs/2006AGUFM.A13D0970S
This NASA site says that “The annual cycle in temperature is massive relative to most climate variations, generally exceeding even the amplitude of glacial-interglacial temperature changes.”
Thanks for the link – very interesting. However, the paper appears to talk about the annual cycle in particular regions, not the planet as a whole. Of course we all know that in extratropical regions there is a large difference between the mean temperature of winter and summer months, but that doesn’t mean the planet is warming and cooling as a whole, in the course of a year. I’d be interested to find out whether it does.
You then said: “Regardless of the value though, it seems to me that any such temperature range would necessarily already include the water vapour feedback, since it responds on a very short timescale (a few days).”
Then doesn’t it seem very strange to hypothesise a run away warming when global average temperatures exceed 2C (or whatever they regard as a tipping point) when the global average ocillates twice this amount annually?
I think ‘oscillates’ is the key word here. If, for example, you had summer weather in the Arctic all year long then there would be no ice left in a very few years, but of course that is not the case – it gets cold again in the winter, and the ice reforms. When you’re talking about global warming you’re talking about a sustained rise in temperatures over decades and centuries, not something that oscillates around a mean. You’re talking about warming that isn’t counteracted by equivalent cooling (that’s the whole point) – Isn’t that why the glaciers are shrinking, the permafrost is thawing etc?
Icarus,
I think this discussion is beginning to veer into speculation. You refer to “sustained rise in temperatures over decades and centuries.” Do I need to remind you that this is the output from computer models, and that those predictions are controversial?
Hanno:
I join those who have expressed regret at the offensive emails you have received. Over the years I have obtained many such offensive emails from AGW-believers and I am shocked that you have received similar distressing messages from persons who disagree with your views. All such unsolicited messages should be condemned, and I condemn them.
Icarus:
You correctly say:
“Thanks for the link – very interesting. However, the paper appears to talk about the annual cycle in particular regions, not the planet as a whole.”
For actual source data go to
http://www.ncdc.noaa.gov/oa/climate/research/anomalies/index.php
It says there (I hope this will line up in this copy).
Global Mean Monthly Surface Temperature Estimates for the Base Period 1901 to 2000
Land Surface
Mean Temp. J F M A M J J A S O N D Annual
1901 to 2000 (°C) 2.8 3.2 5.0 8.1 11.1 13.3 14.3 13.8 12.0 9.3 5.9 3.7 8.5
1901 to 2000 (°F) 37.0 37.8 40.8 46.5 52.0 55.9 57.8 56.9 53.6 48.7 42.6 38.7 47.3
Sea Surface
Mean Temp. J F M A M J J A S O N D Annual
1901 to 2000 (°C) 15.8 15.9 15.9 16.0 16.3 16.4 16.4 16.4 16.2 15.9 15.8 15.7 16.1
1901 to 2000 (°F) 60.5 60.6 60.7 60.9 61.3 61.5 61.5 61.4 61.1 60.6 60.4 60.4 60.9
Combined Mean
Surface Temp. J F M A M J J A S O N D Annual
1901 to 2000 (°C) 12.0 12.1 12.7 13.7 14.8 15.5 15.8 15.6 15.0 14.0 12.9 12.2 13.9
1901 to 2000 (°F) 53.6 53.9 54.9 56.7 58.6 59.9 60.4 60.1 59.0 57.1 55.2 54.0 57.0
As you can see, global temperature rises by 3.8 deg.C from January to July and falls by 3.8 deg.C from July to January.
Please note that the highest global temperature is when the Earth is furthest from the Sun during each year and, therefore, it is an empirical fact that mechanisms within the climate system have much more effect on global temperature than change to incoming vs outgoing radiation.
And I wonder why some people think a rise of global temperature of 2 degC would pass a catastrophic “tipping point” when global temperature rises by nearly double that during each year and recovers within the same year, and it does this every year.
Also, you seem to think that transitions between glacial and interglacial conditions support your arguments. They do not.
The Earth is constrained within close limits of global temperature in each of two stable states; viz. glacial and interglacial. And its temperature has been the same within narrow bounds in each of those stable states throughout the ~2.5 billion years since the Earth gained an oxygen-rich atmosphere. Importantly, the Earth’s surface has had liquid water throughout that time, but heating from the Sun has increased by about 30% over that time. If that additional radiative forcing from the Sun had a direct effect on temperature then the oceans would have boiled to steam long ago.
Clearly, the climate system contains very strong constraints that keep global temperature within close boundaries in each of the two stable states.
So, I wonder why an increase to radiative forcing of at most 0.4 per cent from a doubling of atmospheric carbon dioxide concentration is supposed to threaten a “tipping point” when ~30 per cent increase to radiative forcing from the Sun has had no discernible effect on global temperature.
But the global temperature does constantly vary within the boundaries of its stable state. Its present state is the interglacial state and has been for ten millennia. At issue is why the global temperature varies within the boundaries.
There are many known and unknown reasons for the variations. But, clearly, atmospheric CO2 concentration is not a significant reason for the variations.
Richard
“I don’t know what ‘cap and trade’ means. I don’t think the average American does,” Kerry said. [source]
Vincent (05:08:48) :
During the late ordovician, CO2 levels climbed to 5,000 ppm yet the world entered a glaciation.
Cite, please?
Doesn’t that cast doubt on the claim that CO2 drives climate?
My understanding is that atmospheric CO2 is closely correlated with global temperature for many millions of years into the past, as demonstrated by several different data sets, e.g:
http://www.ipcc.ch/graphics/ar4-wg1/jpg/fig-6-3.jpg
It’s difficult to dispute this kind of evidence, unless you’re going to claim that the evidence is entirely fake – a complete invention. So, can we agree that generally when the world has been warm, CO2 has been high, and when the world has been cool, CO2 has been low?
Obviously in the distant past you had a cooler sun (which would mean higher levels of greenhouse gases to achieve a particular temperature than is the case today), you had very different arrangements of the continents (e.g. a large proportion of the Earth’s land mass centred on the South Pole), and so on – factors which make a direct comparison with today’s climate impossible. Saying that (for example) there was a particular time many millions of years ago when CO2 was higher and global temperature was lower doesn’t disprove this correlation between CO2 and temperature. It remains a fact that higher temperatures are correlated with higher CO2, and lower temperatures are correlated with lower CO2.
Agreed?
Vincent (11:14:15) : Icarus,
I think this discussion is beginning to veer into speculation. You refer to “sustained rise in temperatures over decades and centuries.” Do I need to remind you that this is the output from computer models, and that those predictions are controversial?
It was you who brought up the issue of a sustained rise in global average temperature (of 2°C or more), not me.
Icarus:
No. Because at times when CO2 has been many times its current concentration and rising, the Earth has descended into a severe Ice Age. So, can we agree that CO2 does not cause runaway global warming?
This graph shows CO2 levels over approximately the same time frame as your UN/IPCC graph: click. [click in the image to expand]
That chart shows that elevated CO2 levels have been many thousands of ppmv, for over a hundred million years at a time. During that time the planet both warmed and cooled.
And to find evidence of a ‘cooler sun’ you will have to go back billions of years, not millions.
Your understanding is wrong. The only correlation between temperature and CO2 is when rising CO2 follows rising temperature. There is no cause and effect between rising CO2 and subsequent rising temperature.
Finally, the R² correlation between recent increases in CO2 and the temperature is so low that it is indistinguishable from noise: click.
It wouldn’t be a bad idea for you to spend some time going through the WUWT archives, in order to get up to speed on the subject.
evanmjones (16:58:42) : [The planet is actually warming at about 0.2°C per decade and has been doing so for several decades. What do you attribute this to, if not primarily the anthropogenic increase in greenhouse gases?]
Multidecadal oceanic and atmospheric cycles.
Then how do you account for this? –
http://www.ipcc.ch/graphics/syr/fig2-5.jpg
Icarus
You still have not provided proof for your claim about Miskolczi.
How many times will I be asking for it? For how many years?
“Icarus (16:44:26) :
My understanding is that water vapour is a feedback, not a forcing, due to its very short residence in the atmosphere. While it’s there, certainly it is the single largest absorber of long wave radiation in the atmosphere, but it’s only there because other much longer-lived greenhouse gases create the right conditions for it to be there, warming the oceans and atmosphere so that evaporation can occur. The system is not ‘completely dominated by water vapour’ – far from it.”
There is a complex energy transport from the surface to space through the atmosphere. Considering the there is an order of magnitude more water vapor in the air than co2 and a broader spectrum of absorbtion, I think it is fair to say that water vapor is dominant through both radiation and latent heat/ convection . The ‘forcing/feedback’ is misapplied modeling. See some of Roy Spencer’s writing.
“Icarus:
…it’s only there because other much longer-lived greenhouse gases create the right conditions for it to be there, warming the oceans and atmosphere so that evaporation can occur.”
In other words, without other GHG we would not have water vapor/ evaporation ? Say what ! ? I think you might want completely reconsider that statement.
“Icarus:
You’re right when you say “The cause of the intial warming in such a system, whether it is co2 or solar, is immaterial” – that’s the whole point. Turning up the CO2 isn’t much different from turning up the sun, and we all agree that turning up the sun would make the planet warm up.”
Also albedo changes, land use, snow/ice, cloud cover, ect. The relative numbers are what is in contention.
‘You might look up the changes over time of the water vapor at various altitudes. It has been decreasing as Miskolczi predicts’
“Icarus:
One obvious result of AGW is that, in the short term, temperature in the lower atmosphere rises while temperature in the upper atmosphere falls (because less long wave radiation is reaching the upper atmosphere – instead it’s down here warming up the planet). Colder air in the upper atmosphere of course holds less water vapour, so this result actually confirms AGW.”
I did not say any thing about temperature. You are assuming the relative humidity stays constant.
On the subject of radiation; http://lasersparkpluginc.com/uploads/CO2_Absorption_Data.pdf
Smokey (15:37:27) : …can we agree that CO2 does not cause runaway global warming?
Two different issues here:
1: Whether CO2 causes warming at all;
2: Whether the right conditions exist for ‘runaway’ warming.
If there are ‘tipping points’ then an initial relatively small amount of warming can be magnified by positive feedback mechanisms (albedo, methane deposits etc.) and the cause of the initial warming is irrelevant. Therefore you only need to decide whether CO2 can cause warming. Since it is a greenhouse gas, the evidence suggests that it can.
…That chart shows that elevated CO2 levels have been many thousands of ppmv, for over a hundred million years at a time. During that time the planet both warmed and cooled.
To imply that you can take two data points 100 million years apart and draw a straight line between them, and just assume that represents reality, is clearly absurd. The IPCC’s Figure 6.3 has many more intervening data points and shows a strong correlation between atmospheric CO2 and global temperature. Regardless of that, of course we know that there are numerous factors affecting global climate other than CO2. This is not news, and it certainly doesn’t represent any kind of argument against AGW.
And to find evidence of a ‘cooler sun’ you will have to go back billions of years, not millions.
Cite, please? This disagrees:
http://www.pubmedcentral.nih.gov/articlerender.fcgi?artid=1868609&rendertype=figure&id=fig2
“My understanding is that atmospheric CO2 is closely correlated with global temperature for many millions of years into the past… It remains a fact that higher temperatures are correlated with higher CO2, and lower temperatures are correlated with lower CO2.”
Your understanding is wrong. The only correlation between temperature and CO2 is when rising CO2 follows rising temperature. There is no cause and effect between rising CO2 and subsequent rising temperature.
So there *is* a correlation, which was what I said, and what this data shows:
http://www.ipcc.ch/graphics/ar4-wg1/jpg/fig-6-3.jpg
If you’re going to argue that there is ‘no cause and effect’ then you are of course arguing that CO2 is not a greenhouse gas. Care to support that claim?
Finally, the R² correlation between recent increases in CO2 and the temperature is so low that it is indistinguishable from noise
Oh dear. Are you *seriously* claiming to disprove a correlation between atmospheric CO2 and global temperature based on 10 years of data – a shorter period even than one solar cycle? You seem like a reasonably intelligent person, and this is just lame.
Icarus,
There is no cause and effect relationship between rises in CO2 and subsequent increased temperature: click.
You say that ten years is not sufficient to show a trend. Would 47 years suffice? The putative link between the “greenhouse” gas CO2 and warming has been falsified: click. The atmosphere is not a greenhouse. Unless you can show me a working greenhouse that is open to the sky, with no glass. But then, it wouldn’t be a greenhouse, would it? It would be, like, an open field.
Your UN/IPCC chart shows a cause and effect between a rising global temperature and rising carbon dioxide levels; that’s exactly what I stated above. But there is no cause and effect between rising CO2 and subsequent rising temperatures. That’s why CO2=AGW fails.
Finally, your assertion that I took only two points and drew a line between them is false. The question really is: was your statement delibearately false? Or did you just make a false assumption? I provided this chart: click. Does that look like two points with a line drawn between them? [click in the image to expand. Study it for a while. Learn.]
I notice that you also don’t answer the questions put to you by others. I suspect the reason is because you have no adequate response. The IPCC also has no adequate response to its failed prediction: click. Like you, they are wrong, and will not admit it. Just like James Hansen is wrong: click.
You’re in over your head here, Icarus. You should spend some time reading the WUWT archives, to try and get up to speed. The points you raise here have been raised and debunked previously. The UN is wrong. Skeptics’ questions have never been adequately answered by those pushing the repeatedly falsified CO2=AGW conjecture.
It’s our cross to bear that we must teach every new alarmist who shows up here that if CO2 has any empirically measurable effect at all, it is so small that it is indistinguishable from noise, and therefore can be disregarded for all practical purposes. So relax, CO2 isn’t gonna getcha.
Icarus
You continue to not provide proof for your claim about Miskolczi.
Since you have not provided proof should I assume you do not have backing for your claim?
Should I assume that what you said about it is something you found on a blog somewhere? Or in Wikipedia?
Is your claim something you say just to reject the science?
Is your claim about the work of Ferenc Miskolczi something you never did look in to for yourself?
Should I assume you are a troll with no real appreciation and respect for the data that is the real science of climate change?
Was Ferenc Miskolczi’s theory peer-reviewed?
Smokey (18:16:51) : Icarus,
There is no cause and effect relationship between rises in CO2 and subsequent increased temperature:
Then how do you account for this? –
http://www.ipcc.ch/graphics/syr/fig2-5.jpg
You say that ten years is not sufficient to show a trend. Would 47 years suffice? The putative link between the “greenhouse” gas CO2 and warming has been falsified: click.
That’s a fascinating graph. Can you explain to me what it shows, and its significance to our discussion? I’m not asking you to write a book – just a sentence or two. Cheers.
Your UN/IPCC chart shows a cause and effect between a rising global temperature and rising carbon dioxide levels; that’s exactly what I stated above. But there is no cause and effect between rising CO2 and subsequent rising temperatures. That’s why CO2=AGW fails.
At least we agree that there is a strong correlation – i.e. that higher temperatures are correlated with higher CO2, and lower temperatures are correlated with lower CO2. That’s a start.
Finally, your assertion that I took only two points and drew a line between them is false. The question really is: was your statement delibearately false? Or did you just make a false assumption? I provided this chart: click. Does that look like two points with a line drawn between them? [click in the image to expand. Study it for a while. Learn.]
I think you misunderstood – I wasn’t saying you did anything at all (unless you wrote the paper you linked to). Remember that you said: “That chart shows that elevated CO2 levels have been many thousands of ppmv, for over a hundred million years at a time”. Well, there is only one part of that graph that shows ‘elevated CO2 levels’ of anything resembling thousands of ppmv for a hundred million years – the period between about 200mya and 100mya. Agreed? You can’t possibly believe that taking two data points a hundred million years apart and drawing a straight line between them represents reality, and in fact when you look at a graph with many more data points (as I showed) it’s clear that there were substantial changes in CO2 and temperature between those points, and that those changes show a very clear correlation.
I do understand your point that CO2 rises always follow temperature rises rather than preceding them – we can get more into that later.
I notice that you also don’t answer the questions put to you by others.
I’ve no interest in responding to people who are (unlike yourself) rude and ignorant.
With regard to citing the graph as Hanno 2009, they are probably correct as the standard is to cite the date that the web page was last updated, i.e. 21 July 2009 and the date that the page was accessed. One can easily check this by referring to the list of references and seeing what dates they cite, except that Hanno 2009 does not appear in the references.
Smokey wrote, “The atmosphere is not a greenhouse. Unless you can show me a working greenhouse that is open to the sky, with no glass. But then, it wouldn’t be a greenhouse, would it? It would be, like, an open field.”
No one disputes the atmosphere is a greenhouse itself (it has to be, or we’ll have temperatures of -250F at night), the dispute is if mankind is the cause of any global warming. This can’t be proven to date based on such a small sampling of data (which is the main concern, as the data is quite limited and too narrow).
What I don’t see in these “debates” (they often are shouting matches instead) is how and why 1998 was the hottest year. Folks may not have been reviewing the Sun data enough, but if they did they’d find that that year was the peak year of solar X-Class flares (10 in that year alone). If folks also reviewed even the lay astronomy magazines like Astronomy, they would also have seen how these X-Class flares plow, distort, and “snap” the upper atmosphere way into space (and the funny editorial comment of, “There went the global warming idea”). This activity no doubt has some affect on our atmosphere (and I suspect the true cause the mysterious “ozone hole” that not so ironically not so large today).
The “sin” in all of this climate debate is the a too small sample size; too many jobs and reputations depending on the outcome; and trying to answer a question that we, in our lifetime, may never have an answer as we’re coming out of a 400 year “mini ice age”. It’s a classic “spinning of wheels” and slowing the funding of legitmate research (like finding a new home before the Sun does worse, like swallowing our planet as it goes nova!).
Icarus
You are just another case of stonewalling of data?
No, you’re not.
You are stonewalling your lack of data.
I think your findings absolutely rubbish.
Obviously, you don’t know nothing about the structure of international governance!!!
We can track all the findings from previous documents presented by the real authors in the STTMs meetings that happens every year in different locations. The problem is that there are people who copy these REAL reports without any regards to authorship and past straight in the Wikipedia.
Get informed!
UNEP has a data base – a real serious one – about all the resources used in their reports.
If they want, they could destroy your arguments within seconds…
I wonder what is the interest backing your shameful story: why are you interested in running the reputation of UNEP?
Or are you just trying to grab attention to yourself – an ego case that goes straight against the common/global interest of the wellbeing of LIFE ON EARTH?
Yes, by-the-way, these STTM reports are not just peer reviewed but also reviewed by Party members’ scientific staff. They also must be approved by the UN environmental scientific agency: http://www.unep.org/science/centres/index.asp
then, once the report is approved, it becomes a guide line to policy making
Obviously, if a country (Party) member is against a international policy – which later becomes international law – this country will do anything to destroy the arguments and recommendations of the report.
But, if this country is minority, this means, it is not convincing to other countries, its action will not mean anything: the report will still be valid.
For instance, although the USA administration has done anything to destroy the liability of the Brundtland commission report, which was the basis of the UNEP, UNFCC, SCBD, etc., the Conventions has been signed in 1992 during the Earth Summit, and are still valid, BECAUSE the international scientific community outside the USA still approves and backs the Brundtland.
Someone must be really “arrogant” to think that s(he) knows more than the majority of scientists of the world!
A look at the UNEP report (5 Oct 2009) shows a different graph in place of Hanno on page 5. It is Hansen, et al. Perhaps the scientific community does listen.
amil, were it not for the case of ‘it has happened before’ (errors in science), we might not be discussing these issues; chalk it up to the limits/fallibility of mankind, his corruptable nature, and more recently, monied interests who now see the ‘green’ (old slang term for MONEY as in green backs) of new markets including carbon-credit trading.
.
.
.
@ -Jim,
do you like statistics, -Jim? – I do. When I say “majority”, I am saying “more than half of the scientists in the whole World”. Thus, the statistical chances of error is low.
Moreover, who has “monied interests” in destroying arguments and evidences supporting GREEN policies? It is obviously not the poor countries of the world, as they are the ones who are suffering the most with Earth’s ecosystems degradation.
Interesting: The vast majority of scientists of the world have “monied interests” in supporting poor – penniless – populations/countries. Are poor countries “paying” these scientists (and they are a lot, thus it must be a lot of money!)? But they don’t have money… : _Jim, with all respect, your reasoning concerning “monied interests who now see the ‘green’ of new markets including carbon-credit trading” is fallible and illogical.
Nevertheless, there are enormous “monied interests who now see the ‘green'” as an obstacle to endless accumulation of capital, such as the oil industry. And this industry has the capability of paying anything to block the work of the Majority of Scientists of the Planet, and of the UNEP, because they – the most CO2 producers/industries of the entire world – are RICH.
The fact that a same graph was found in the report of United Nations Environment Programme and the Wikipedia may just be a form of synchronicity, that being the experience of events which are causally unrelated, and yet their occurring together carries meaning to the person observing the events.
Some people tend to search for or interpret synchronicity in a way that confirms one’s preconceptions and avoids information and interpretations that contradict prior beliefs. This is defined by the cognitive science as the “confirmation bias”.
In the context of “confirmation bias”, coincidences sometimes lead to explanations that a person or persons intentionally acted and the syncronicity is the evidence these actions. That is the beginning of “conspiracy theories”, this means fringe theories which are used to explain a historical or current event as the result of a secret plot by usually powerful Machiavellian conspirators, such as a “secret team” or “shadow government”, rather than broad social forces and large structures of human collectivities.
We may be watching an example of conspiracy theory happening right now in structure of the conservative belief that the “climate change issue” is a part of a organized plan of the international governance (UN, World Bank, IMF, etc.), and/or developing countries to run the world… or, still, in the opinion that “monied interests who now see the ‘green’ (old slang term for MONEY as in green backs) of new markets including carbon-credit trading.”
Finally, the White Queen says to Alice: “It’s a poor sort of memory that only works backwards” (Through the Looking-Glass by Lewis Carroll)