UPDATE: 9/8/09
The University of Colorado made a serious mistake in the press release that I cited. This press release was issued well before the paper was available, and of course the paper itself was not made available to journalists. It was hidden behind the AAS paywall.
I wrote to the press officer at UC on Friday, he responded Saturday night, on a holiday weekend, to his credit, here is my exchange:
Re: question about press release
From: Gifford H. MillerSent: Saturday, September 05, 2009 8:02 PMTo: Anthony Watts – mobileSubject: Re: question about press releaseIndeed, this is a typo, Anthony. Not sure how it escaped my attention.The sentence should read: “The research team assembled high-resolution records of climate for the past 2,000 years and found that the cooling trend reversed in 20th Century.“I have passed the correction to our PR folks and it should be fixed soonThanks for catching thisGifford Miller
Hello,
I looked at the Kaufman paper press release on EurekAlert as well as here:http://www.colorado.edu/news/r/bff9b4f453f2f9e1aa1e5d1b699d8525.html
In the second paragraph there is this sentence:“The research team assembled high-resolution records of climate for the past 2,000 years and found that the cooling trend reversed in the mid-1990s.”Is this correct? Is this a typo and instead should it say “mid-1900’s ” ?
Thanks for your consideration. Anthony Watts
UC has updated their press release here on 9/7 and was able to persuade EurekAlert to fix it on their website also.
The last sentence of paragraph 2 now reads:
“The research team assembled high-resolution records of climate for the past 2,000 years and found that the cooling trend reversed in the 20th century.”
It was originally stated as:
The research team assembled high-resolution records of climate for the past 2,000 years and found that the cooling trend reversed in the mid-1990s.
I’ve received some criticism for using the press release and acting on it to look for such a change in the 1990’s per the press release. While that criticism would be valid if the press release and the paper were both made available to me at the same time, the fact is they were not.
This method of pushing a scientific paper via press release, ahead of the paper’s actual journal release, and then hiding it behind a paywall is unprofessional and stinks. If the science organization wants to be seen as credible, then they need to make both the press release AND the paper available to journalists at the same time.
This idiotic “press release but no sci paper” policy needs to be changed. I’ll have more on this soon. As it stands, I’ve going to avoid UC press releases until they change the policy and I encourage others to do the same.
– Anthony
==========================
There’s a lot of buzz about regarding the Kaufman et al paper published today in Science which claims a recent reversal on a long term Arctic cooling trend and “found that the cooling trend reversed in the mid-1990s.” In the NOAA internal newsletter I cited yesterday, NOAA claims that the “According to the most recent Arctic Report Card, the Arctic Ocean continues to warm”. OK fair enough, we’ll have a look.
NOAA based this on Hadley’s CRU dataset, which of course Hadley refuses to show any raw data for or methodology despite repeated FOI requests, making verification impossible. (read more here)
 |
| Figure A1. Arctic-wide annual averaged surface air temperature anomalies (60°–90°N) based on land stations north of 60°N relative to the 1961–90 mean. From the CRUTEM 3v dataset, (available online at www.cru.uea.ac.uk/cru/data/temperature/. Note this curve does not include ship observations. |
Note the trend from 1980 to present. Note also that there are few weather stations above 60N and even fewer on the Arctic Ice itself. The data is relatively sparse and interpolation/gridding/averaging is employed to come up with the coverage all the way to 90N. We’ll get back to this.
Let’s first get an understanding of the Kaufman paper. Here’s the abstract. We can’t get a look at the full paper or publish it here yet since it is behind the AAS paywall. If somebody has an external link to it, please advise.
Recent Warming Reverses Long-Term Arctic Cooling
Darrell S. Kaufman,1,* David P. Schneider,2 Nicholas P. McKay,3 Caspar M. Ammann,2 Raymond S. Bradley,4 Keith R. Briffa,5 Gifford H. Miller,6 Bette L. Otto-Bliesner,2 Jonathan T. Overpeck,3 Bo M. Vinther,7 Arctic Lakes 2k Project Members
The temperature history of the first millennium C.E. is sparsely documented, especially in the Arctic. We present a synthesis of decadally resolved proxy temperature records from poleward of 60°N covering the past 2000 years, which indicates that a pervasive cooling in progress 2000 years ago continued through the Middle Ages and into the Little Ice Age. A 2000-year transient climate simulation with the Community Climate System Model shows the same temperature sensitivity to changes in insolation as does our proxy reconstruction, supporting the inference that this long-term trend was caused by the steady orbitally driven reduction in summer insolation. The cooling trend was reversed during the 20th century, with four of the five warmest decades of our 2000-year-long reconstruction occurring between 1950 and 2000.
Here’s the press release from EurekAlert:
Long-term cooling trend in Arctic abruptly reverses, signaling potential for sea rise
 |
||||
A new study led by Northern Arizona University and involving the University of Colorado at Boulder indicates Arctic temperatures have reversed from a long-term cooling trend and are now the warmest they have been in at least 2,000 years, bad news for the world’s coastal cities facing rising seas in the coming decades.
High northern latitudes have experienced a long-term, slow cooling trend for several millennia, the result of a wobble in Earth’s rotation that has been increasing the distance between the sun and Earth and decreasing Arctic summer sunshine. The research team assembled high-resolution records of climate for the past 2,000 years and found that the cooling trend reversed in the mid-1990s.
The decade from 1999 to 2008 was the warmest in the last 200 decades and corresponds with a continuing buildup of human-generated greenhouse gases in Earth’s atmosphere, said lead author Darrell Kaufman of Northern Arizona University. “Scientists have known for a while that the current period of warming was preceded by a long-term cooling trend, said Kaufman. “But our reconstruction quantifies the cooling with greater certainty than ever before.”
Since the Earth is still moving away from the sun — it’s about 0.6 million miles further during the Northern Hemisphere summer solstice than it was in 1 B.C. — it appears greenhouse gases began “overriding” the natural cooling of Earth in the middle of the last century, said Professor Gifford Miller of CU-Boulder’s Institute for Arctic and Alpine Research, a study co-author. “We expect the Arctic will continue to warm in the coming decades, increasing land-based ice loss and triggering global increases in sea-level rise,” he said.
The study was published in the Sept. 4 issue of Science. Other institutions participating in the study included the National Center for Atmospheric Research in Boulder, the University of Arizona, the University of Massachusetts, the University of East Anglia in Norwich, England, and the University of Copenhagen in Denmark. The study was funded by the National Science Foundation.
The research team reconstructed past temperatures on a decade-by-decade basis during the past 2,000 years using information gleaned from ancient lake sediments, ice cores, tree rings and other samples. As part of the study, the decade-by-decade climate data reconstruction was compared with sophisticated climate model simulations run by NCAR researchers.
The NCAR climate simulations agreed closely with the ground-based Arctic data used in the study, said NCAR scientist David Schneider, a co-author on the study. “This result is particularly important because the Arctic, perhaps more than any other region on Earth, is facing dramatic impacts from climate change,” Schneider said. “This study provides us with a long-term record that reveals how greenhouse gases from human activities are overwhelming the Arctic’s natural climate system.”
The new Science study dovetails with a report published earlier this year by the U.S. Climate Change Science Program on changes in the Arctic and at high latitudes. The CCSP study’s five lead authors — including Miller and CU-Boulder INSTAAR Director Jim White — concluded climate warming in the Arctic and at high latitudes likely will continue at a rapid pace given human-caused changes in Earth’s atmosphere.
Arctic temperatures have reached their highest level in the past decade, averaging 2.5 degrees Fahrenheit higher than would have been expected if the 2,000-year cooling trend had continued through the latter part of the 20th century and into the 21st century, said Kaufman. Kaufman received his doctorate from CU-Boulder in 1991 while studying under Miller at INSTAAR.
Previous research has shown that Arctic temperatures increased three times faster during the 20th century than temperatures in the rest of the Northern Hemisphere — a phenomenon known as “Arctic amplification,” said Miller, also a professor of geological sciences at CU-Boulder. The amplification is caused by decreased Arctic sea ice and an increased absorption of the sun’s heat by exposed ocean as well as “darker” land areas caused by decreases of Arctic snow and ice, he said.
“With less sea ice in winter, the ocean returns the heat stored in summer to the atmosphere, resulting in warmer winters throughout the Arctic,” said Miller.
“Because we know that the processes responsible for past Arctic amplification are still operating, we can anticipate that it will continue into the next century,” said Miller. “The magnitude of change was surprising, and reinforces the conclusion that humans are significantly altering Earth’s climate.”
“As we are confronted with evidence of global warming, it is extremely helpful to be able to use paleoclimate data to provide context for today’s climate relative to the range and trajectory of recent climate regimes,” said Neil Swanberg, director of NSF’s Arctic System Science Program.
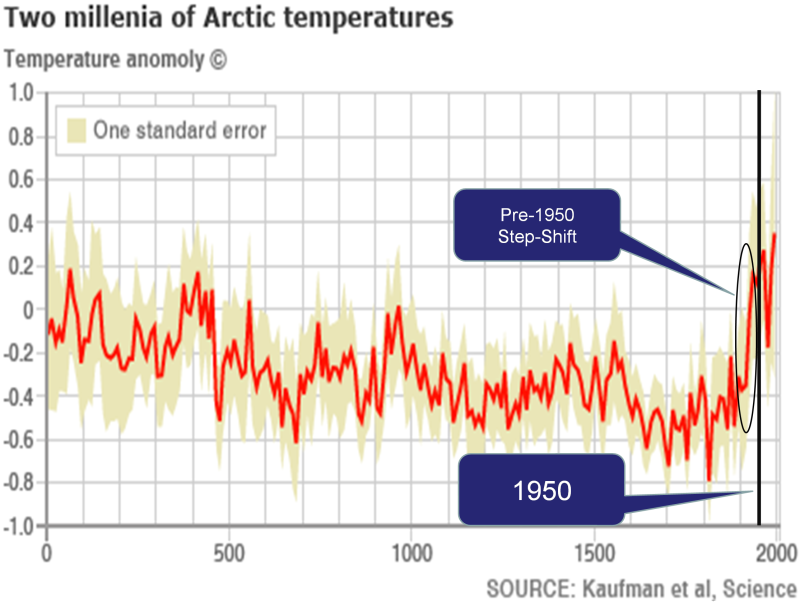
The BBC did a better job of reporting the story and included a graph from the paper. This paper supposedly ties all of the 20th century Arctic warming to greenhouse gas emissions… There’s one tiny problem with the paper’s claim…All of the anomalous warming occurred in one “step shift” before 1950; while most of the increase in atmospheric CO2 has occurred since 1950…
Kaufman et. al. w/ my annotations
And here is that graph Dave annotated:

OK that’s one problem. Here’s another. Both Kaufman et al and NOAA claim recent Arctic warming. In the case of the Kaufman paper, they specifically claim they “found that the cooling trend reversed in the mid-1990s.”
Since we can’t really look at the Hadley CRU data since it is held under lock and key despite the repeated FOI requests so that analysis and verification can be performed, we can’t really analyze it pertaining to NOAA’s claim of warming. Since NOAA and HadleyCRU use many of the same stations above 60N (they’d have to since there are so few) it seems reasonable to assume they share similar data in the Kaufman et al paper.
Fortunately there is another Arctic temperature data source available we can look at to compare against. And that is from the Danish Meteorological Institute (DMI). Like NOAA, they offer a dataset that shows temperature in the high latitudes.Here is what they say about that dataset and how it is obtained.
The daily mean temperature of the Arctic area north of the 80th northern parallel is estimated from the average of the 00z and 12z analysis for all model grid points inside that area. The ERA40 reanalysis data set from ECMWF, has been applied to calculate daily mean temperatures for the period from 1958 to 2002, from 2002 to 2006 data from the global NWP model T511 is used and from 2006 to present the T799 model data are used.
The ERA40 reanalysis data, has been applied to calculation of daily climate values that are plotted along with the daily analysis values in all plots. The data used to determine climate values is the full ERA40 data set, from 1958 to 2002.
Here is the most recent DMI graph of Arctic temperature:

Note that the blue line represents the “melting point” of ice in Kelvin or 0°C/32°F The green line represents the average climate from 1958 to 2002, i.e. the “baseline”
I don’t have time to get into a detailed analysis of the raw DMI data this morning as I have other duties, but I do have time to do a visual check that is just as telling.
Kaufman et al claims they “found that the cooling trend reversed in the mid-1990s.” That should easy to spot in the DMI graphs if it exists. So I animated the entire set of DMI graphs from 1958 to 2009. See if you can spot the temperature spikes or the “…cooling trend reversed in the mid-1990s.” signature.
click for full sized animation
Watch the top of the bell curve above the blue line. See any big changes? I don’t. Note that in the animation above, due to a slight change in DMI’s graphical presentation for 2008 and 2009, I had to graphically fit 2008 and 2009 to match the rest of the animation framework so that there would not be a distracting jump at the end. The data is unchanged in doing this.
One of the most common claims of alarmists is that the Arctic is “melting” and that implies a temperature cause in their statements. But as we see, during the critical melt window, the DMI data seems to hold right along the climatic normal.
One thing about DMI, if you go to their main web page, http://ocean.dmi.dk/english/index.php you don’t find any alarming pronouncements about Arctic melting or temperature reversal like you do at NOAA.
Others like NASA say the wind pattern changes is more of an issue, blowing the sea ice southward. Perhaps NOAA and Kaufman should look more closely at before making grand claims.
Further reading:
NASA Sees Arctic Ocean Circulation Do an About-Face
Arctic Sea ice loss – “it’s the wind” says NASA
Arctic Sea Ice Time Lapse from 1978 to 2009 using NSIDC data
Watching the 2007 historic low sea ice flow out of the Arctic Sea
McIntyre versus Jones: climate data row escalates
The new Science study dovetails with a report published earlier this year by the U.S. Climate Change Science Program on changes in the Arctic and at high latitudes. The CCSP study’s five lead authors — including Miller and CU-Boulder INSTAAR Director Jim White — concluded climate warming in the Arctic and at high latitudes likely will continue at a rapid pace given human-caused changes in Earth’s atmosphere.
—
Question is: Since the US Climate Change Science Program’s most recent (propaganda-ridden) paper has been proved false and is presenting false data, how can “Science” magazine justify using a paper with false conclusions to confirm the same group of authors’ “new” Arctic conclusions?
the BBC have been full swing on the arctic warming thing.
They say ice, sedemant and tree ring data was used to prove it!
Just a question: are there any trees old enough in the arctic circle to support this claim???
Sure I can imagine so in temperate climates, but I thought the rctic was only pines?
Am I wrong, or more BBC lies?
Previous research has shown that Arctic temperatures increased three times faster during the 20th century than temperatures in the rest of the Northern Hemisphere — a phenomenon known as “Arctic amplification,” said Miller, also a professor of geological sciences at CU-Boulder. The amplification is caused by decreased Arctic sea ice and an increased absorption of the sun’s heat by exposed ocean as well as “darker” land areas caused by decreases of Arctic snow and ice, he said.
“With less sea ice in winter, the ocean returns the heat stored in summer to the atmosphere, resulting in warmer winters throughout the Arctic,” said Miller.
—
Further, we know this favorite little “Arctic amplification” theory of the AGW theists is false because the low sea in 2007 was rapidly re-frozen in 2008 when ice extents actually and measureably increased during the entire year. If this theory was correct, there should have been no way that one summer’s exposed “black surfaces” could be re-frozen the next winter. And, once re-frozen over the next winter, there is no “left-over albedo” to warm (re-melt) the following summer. (True, the AGW extremists claim that “this doesn’t matter, it is second-year ice which is thinner and more likely to melt over the third summer.” Except that didn’t happen either in summer 2009. The Caitlin (sp ?) expedition in spring 2009 was a specific attempt to show this theory of first-year/second-year ice existed. It’s rescue attempt of their theory failed as well, and the expedition itself required rescue – leaving tons of oil on the ice surface.)
Then, (today) in spring 2009 AMSRE sea ice extents in April and May were the highest ever graphed since 2000. Now, at the lowest part of their annual melting season, 2009’s sea ice extent’s are 33% higher than in 2007.
Paraphrasing Einstein when he was attacked by his politically-driven critics. “One thousand theories can claim I am wrong, and it means nothing. But it will only take one measurement to prove me wrong.”
If the data cannot be reviewed independantly and the method is not clear and reproducible independantly it isn’t science. I don’t know what it is, but it is of zero value in terms of scientific method.
By eye in the region above the blue line, it looks like the annual red lines are higher by a smidge than the green line average for many of the 1990s years and below it by a similar smidge during the 2000s. Maybe one degree K. The number of days above the blue line suggests the same pattern, but not as strongly. This is the “melt” region due to temperature and needs the daily data for analysis to verify the visual impression. Of course, wind and current affect ice cover too so this doesn’t tell the whole story.
Typo check — “Since we can’t really look at the Hadley CRU data since it is held under local and key despite …” Don’t you mean “lock” and key?
“One thing about DMI, if you go to their main web page, http://ocean.dmi.dk/english/index.php you don’t find any alarming pronouncements about Arctic melting or temperature reversal like you do at NOAA.”
Don’t let yourself get fooled by DMI english pages. The danish pages are filled with alarmism and standard warmist myths.
/Mikkel
REPLY: While I can’t fully read Danish, it appears you are correct. I wonder why they don’t bother in English? – Anthony
I wonder if anyone in this study group looked at the AMO cycle which also went warm or positive in 1995 . MOC[ Meridional Overturning Circulation] and the Atlantic THC also changed . There is a natural long term warming since the Little Ice Age , but there is also natural cyclic change due to SST changes. This appears to be another doomsday type of study that will be found to be wanting when global cooling becomes more evident the real causes of climate change are better understood and accepted.
The bells in the video look almost identical from beginning to end. About the only thing I noticed was the 1998 bell seemed a little fatter near the top part of it.
Good summary of the Team Members waterboarding their data to get the results they want.
http://www.climate-skeptic.com/2009/09/more-proxy-hijinx.html
and here.
http://www.climate-skeptic.com/2009/04/numbers-divorced-from-reality.html
ClimateAudit is all over it as well
From the BBC Arctic ‘warmest in 2,000 years’
http://news.bbc.co.uk/1/hi/sci/tech/8236797.stm
If we do have a period of time matching the worst of the little ice age (or worse) the one thing that will make me feel better will be listening to those “scientists”, those in the media and the politicians explaining themselves.
Kaufman et al appears to be in conflict with the historical records of Scandinavian exploration of the Arctic North Atlantic around 1000 – 1400 AD and earlier
A few months ago we discussed a paper about a Siberian ice core reconstruction that correlated a solar proxy (10Be I believe) to an oxygen isotope temperature proxy.
The paper claimed that the solar proxy fit the temperature proxy up until the 20th century and then the two deviated and CO2 must have caused the 20th century warming. But that reconstruction had a similar early 20th century step-shift from about ~1890-1930…
Eichler Modified
I don’t know if these “step-shifts” are indicative of an early 20th century northern latitude climate shift or if the scalar relationship between temperature proxies and temperatures changed. Maybe the oxygen isotope proxies haven’t been correctly calibrated for precipitation changes?
This could be me, but eyeballing the gif you can see that up till the mid 90’s you see large spikes downwards (troughs?) when compared to the median. From then on you see mainly (very) large spikes upwards from day 0-150 and 250-end. I’ve asked Anthony several times what was causing these big spikes, especially the ones in recent years. I understood that when the sea is refreezing after summer melt (counterintuitively) a lot of warmth is released in the atmosphere. The big refreezes of the last few years could explain part of the temperature increase trend in the Arctic.
Gosh, you would think there was an important piece of climate legislation pending before Congress or maybe some “important” climate conference about to happen considering the full-court press we have seen in the media lately.
Wtf? HadCRUT data for 70-90N:
http://www.climate4you.com/images/MAAT%2070-90N%20HadCRUT3%20Since1900.gif
Satellite UAH MSU Arctic+Antarctic temperatures:
http://www.climate4you.com/images/MSU%20UAH%20ArcticAndAntarctic%20MonthlyTempSince1979%20With37monthRunningAverage.gif
Some Greenland/Iceland/Arctic stations with long records (from NASA GISS page):
http://data.giss.nasa.gov/cgi-bin/gistemp/gistemp_station.py?id=431043600000&data_set=1&num_neighbors=1
http://data.giss.nasa.gov/cgi-bin/gistemp/gistemp_station.py?id=634010010003&data_set=1&num_neighbors=1
http://data.giss.nasa.gov/cgi-bin/gistemp/gistemp_station.py?id=431042500000&data_set=1&num_neighbors=1
http://data.giss.nasa.gov/cgi-bin/gistemp/gistemp_station.py?id=620040630003&data_set=1&num_neighbors=1
http://data.giss.nasa.gov/cgi-bin/gistemp/gistemp_station.py?id=620040300000&data_set=1&num_neighbors=1
http://data.giss.nasa.gov/cgi-bin/gistemp/gistemp_station.py?id=634010250000&data_set=1&num_neighbors=1
http://data.giss.nasa.gov/cgi-bin/gistemp/gistemp_station.py?id=634010010003&data_set=1&num_neighbors=1
http://data.giss.nasa.gov/cgi-bin/gistemp/gistemp_station.py?id=638221130005&data_set=1&num_neighbors=1
http://data.giss.nasa.gov/cgi-bin/gistemp/gistemp_station.py?id=634011520003&data_set=1&num_neighbors=1
http://data.giss.nasa.gov/cgi-bin/gistemp/gistemp_station.py?id=614028360003&data_set=1&num_neighbors=1
http://data.giss.nasa.gov/cgi-bin/gistemp/gistemp_station.py?id=638221650004&data_set=1&num_neighbors=1
How on Earth they were able to produce such a hockey stick?
Less Ice In Arctic Ocean 6000-7000 Years Ago
Source: Copyright 2008, ScienceDaily
Date: October 19, 2008
Original URL
Recent mapping of a number of raised beach ridges on the north coast of Greenland suggests that the ice cover in the Arctic Ocean was greatly reduced some 6000-7000 years ago. The Arctic Ocean may have been periodically ice free.
see full story here http://www.ecoearth.info/shared/reader/welcome.aspx?linkid=108614
OT but Dr Roy Spencer has just published the UAH temperature anomoly for August – +0.23C
They are tough little cookies.
Every time the scientific facts cause their house of cards to crash, they immediately start rebuilding it.
Reports like this will be on the table of our Senate and the Copenhagen Summit in December.
We debunk them all over again but in th mean time, keep calling those Senators.
“I had to graphically fit 2008 and 2008”
That sounds easy.
REPLY: typo, 2009 fixed thanks – A
“Arctic temperatures have reached their highest level in the past decade, averaging 2.5 degrees Fahrenheit higher than would have been expected if the 2,000-year cooling trend had continued through the latter part of the 20th century and into the 21st century, said Kaufman.”
What 2000 year cooling trend? I also did a quick check using UAH “North Polar” data, and the curve looks nothing like their graph in Figure A1. UAH data shows roughly a 1 deg C temperature rise over the last three decades with essentially no increase in the past decade. I know the UAH satellite derived data only covers up to +85 latitude, but on the other hand, it’s not like there are a bunch of weather stations north of that point anyhow.
Mikkel (10:51:05) :
I went to the Danish version, clicked on one of their articles and used the Google Tranlator:
http://www.dmi.dk/dmi/se_antarktisk_is-bro_kollapse
But, the article does us a huge favor, it zooms in on a small area of the Wilkins Ice Sheet and even gives the dimensions via satellite. After all this catastrophic warming, they conclude with:
“Meanwhile, the total sea ice distribution around the continent has been relatively stable.”
“Ozone layer involved
Part of the reason for the central Antarctica has hitherto been almost untouched by global warming is another man-made phenomenon: the ozone hole over the South Pole.
Normally absorbed ultraviolet light by ozone in the stratosphere and this process releases heat. Since the 1980s, where the reduction of ozone over Antarctica took off because of human emissions of CFCs, have been absorbed less ultraviolet radiation and temperature in the stratosphere has decreased by up to 10 °.
This cooling of the stratosphere has increased circulation in the troposphere (the lower part of the atmosphere where we live) around Antarctica. It acts as an effective brake on the meteorological exchange of heat between the South Pole and surrounded air masses. While the central Antarctica is within the zone which has avoided heat so stick outside the Antarctic Peninsula.”
Now, I thought the big deal over the ozone was solved decades ago.
So, no mention of increased GCR’s eating up the ozone again. Just a big implied pat on the back over how they save Antarctica from Global Warming so far.
But back then, it wasn’t about Global Warming: It was about the Next Ice Age Threat.
I can hear the ice cracking in heads torn between two extremes. Can’t make up thier minds which way to go.
They need a new Mantra: Global Analysis Paralysis.
Dear Wondering,
Your concerns are so 20th Century.
Discover “Post Normal Science,” drink the Kool-aid, and feel the re-structuring of your mind-thoughts take place, pleasant as slipping into a Calgon bath. What “Post Normal Science” teaches us is that when something is really, really important and we don’t know all that much about it, we can start at the end, what we want the answer to be, and work back to the beginning where we choose appropriate data. This is a great way to nail a hypothesis and with proper coaching and encouragement you’ll find it easy to do and you will feel so much better too.
Just trying to help. If you think I’m kidding check out the work of Funtowicz and Ravetz. Well, work…..
Oh, oh, oh, we gotta demolish AGW on these little pesky temperature spiky things. More and more, it seems to me to come back to ultra-simple ultra-basics. Proper temperature records. Sea level records. Respect for the evidence of history and archaeology. Respect for the early Arctic records made by those whose lives may have depended on their accuracy.
Kaufman et al are nuts and dangerous IMHO. It’s time to get out the John Daly “Still Waiting for Greenhouse” pages What the Stations Say with his superb collection of good global records, many arctic records going back a long way. True, many now end at the millennium since Daly passed on; however, the evidence is already good enough by a good margin. I’m going to try and assemble his best records on a single page tonight; meanwhile however, look at Bodø Norway as a good example.
Ron de Haan (11:13:18) :
Global Whateverism.
Whatever can be fudge, faked or fiddled with to support Whenever faster than Previously on Lost is needed to find a problem by Whomever mounted the latest alarming Expedition to Wherever the weather isn’t being currently watched.
Got to keep one step ahead of the auditors or else the Promotional Production will plummet back to Terra Firma due to lack of proverbial hot air in the balloon.
Concerning the bell curve, let us not forget from WUWT post 8/24/09 :
“Arctic Temperature Headed Below Freezing”
“The buoy has drifted with the sea ice and is now near 84.1N, but started at 89.648N, so presumably, temperatures at the actual North Pole would be colder than what is being measured and seen now.”
You claim that the authors found that something changed in the mid-1990s. And yet you even print out their abstract, which states that the cooling trend reversed in the mid-20th century, not the mid-1990s.
Your animation does not permit a useful assessment of whether the Arctic has warmed or not; the scale is too small. You can find a comprehensive analysis [http://tamino.wordpress.com/2009/08/28/yes-virginia-the-arctic-is-warming-fast/]
REPLY: RW it would not matter what I presented, you would not like it, your worldview is fixed, much like Tamino, aka Mr. “Open Mind” himself. Peas in a pod you two. Both afraid to put their name on anything they say.
And…you are wrong. The phrase is from the press release:
http://www.eurekalert.org/pub_releases/2009-09/uoca-lct083109.php
Read the 2nd paragraph. It says:
“The research team assembled high-resolution records of climate for the past 2,000 years and found that the cooling trend reversed in the mid-1990s.”
So yes, my animation does permit it to look for a reversal in the mid 1990’s, since that is covered in the DMI dataset. – Anthony Watts
Tim (10:24:44)
There are hundreds of research papers on the Atctic over the centuries: Grumet, N.S., Wake, C.P., Mayewski et al and a heck of alot of papers to show that the MWP was global, and warmer than today. Loehle, C. 2007 etc. There is evidence of settlements way into greenland that are now under ice.
However, before 1979 it simply wasn’t known how much sea ice there was, so the present majority take the 1979-present as being the universal truth for all time. Not that earth could possibly be for all time of course. It is reputed that the 1930’s saw greater warming than the past 20 years, so its likely that Arctice ice extent could have been lesser than today. Certainly there were icebergs in the 20’s and 30’s in the Atlantic that traversed from the Arctic, and we have the Titanic as evidence that Arctic ice doesn’t stay in its place.
Indeed to say that the Arctic is warming/melting faster than it has in the last 2000 years is like saying that the Titanic didn’t sink because you dipped your feet into the sea on the West Coast of the USA and didn’t feel it underfoot.
It’s very interesting. Because “they” cannot control the present (non warming) they have taken to rewritting history, so that the MWP and Roman warm periods are erased with the shake of a tree ring. This is the mother of all hockey sticks. They have learnt from Mann’s mistakes – make sure you cover those pesky warm periods in your time scale.
And there is a wisdom among warmists, my brothers: NEVER, but NEVER give your raw data and algorithms to a skeptic.
I might also suggest that the BBC is a news and entertainment organisation, and not a scientific organisation
It looks like they are preparing to explain a long period of no warming by saying that the temp is higher than it would have been if the natural cooling hadn’t been been stopped by the infernal gas, CO2.
Their CO2 theory isn’t wrong, CO2 is just stopping cooling not causing warming. This means that no matter what the temp is anywhere, they can say that it would have been colder if man hadn’t interferred.
This then means that their theory can never be disproven as a colder temperature always exists.
Well what about the holocene optimum? It was longer in duration and warmer than any MWP. It also coindided with the growth of civilisations such as China and Mesopotamia amongst others..
According to present theories, it should have been catastrophe, but it was the converse
Problem is obvious. The Danish data hasnt been adjusted properly to conform to GISS procedures. Clearly it needs to be corrected for UAH effects. Once that is done it will be perfect and the hokey stick will be safe.
JaneHM (10:56:42) :
Plate tectonics my dear, Greenland was 1000 miles further South then 😉
DaveE.
I could be wrong but I find this shocking…
Since the Earth is still moving away from the sun — it’s about 0.6 million miles further during the Northern Hemisphere summer solstice than it was in 1 B.C. — it appears greenhouse gases began “overriding” the natural cooling of Earth in the middle of the last century, said Professor Gifford Miller of CU-Boulder’s Institute for Arctic and Alpine Research, a study co-author. “We expect the Arctic will continue to warm in the coming decades, increasing land-based ice loss and triggering global increases in sea-level rise,” he said.
I don’t think that an extra 600,000 miles from the Sun is going to make a big difference in total irradiance. Certainly one would have to consider other factors before pointing the finger at CO2 as the culprit.
Classic climate science.
Who needs thermometers when you’ve got treemometers, ice cores and lake sediments?
Chuckie lives!
We can go back 11,000 years and know that the Arctic was much colder. Anything close to land was still glaciated at this time and the sea ice was permanent, even in the summer.
By the Holocene Optimum, the majority of the glaciers had melted, other than Greenland and on a few select other islands. The axial tilt reached its maximum about 8,000 years ago and summers would have been warmer (and winters colder). The previous year’s snow definitely melted in the summer and there may have been periods when the sea ice melted completely by September.
Since then, the tilt has been decreasing again and I can buy that the Arctic is generally cooling off slowly.
But there has still been cycles of warmer and cooler. The Inuit would not have invented the kayak and whaling boats if the ice did not melt in a manner similar today. The Vikings were not farming in Greenland 700 years ago if it was that much colder.
The Greenland ice cores show lots of variation and periods in the last 2,000 years which were warmer than today (which contradicts this study).
http://mclean.ch/climate/figures_2/GISP_to_11Kybp.gif
Data at:
http://www1.ncdc.noaa.gov/pub/data/paleo/icecore/greenland/summit/gisp2/isotopes/gisp2_temp_accum_alley2000.txt
Anytime one sees the Team using their proxies, you can just skip reading it and move on to something else.
Wondering Aloud (10:39:43) :
True dat. Not much global warming ‘science’ is independently verifiable, except on the skeptic side, therefore it can not be trusted and must be discarded.
And all this talk about the Arctic is due to one fact: globally, sea ice is increasing.
So pay no attention to the man behind the curtain; look only at the Arctic, because alarmists don’t want to discuss the Antarctic. It’s too inconvenient.
“”” Note the trend from 1980 to present. Note also that there are few weather stations above 60N and even fewer on the Arctic Ice itself. The data is relatively sparse and interpolation/gridding/averaging is employed to come up with the coverage all the way to 90N. “””
Well averaging is a well exercised method of throwing away information; not adding information; and interpolation is a well known method of not adding anything.
There’s that pesky Nyquist Sampling theorem, that keeps on saying you can’t make silk out of a sow’s ear.
The sparcity of arctic measured data, is afundamentally incurable limitation to knowing what is really happening up there.
I believe that in historic times; (1850s) there were precisely 12 “weather” stations taking data north of +60 deg Latitude. That number slowly increased to up in the 80s, and then came down around the time of the collapse (implosion) of the Soviet Union. Compare that systemic fiddling with the carnage that resulted from that little orbital boost that Dr Spencer was telling us about the other day; that ruined his whole weekend.
When the Arctic (+60 > +90) has 80,000 sampling stations; I’ll start believing their data. Of course I don’t mind them reporting the average of the 72 or whatever stations they have now; so long as they don’t try to connect it to the whole arctic; most of which they know nothing about.
According to the most recent Arctic Report Card, the Arctic Ocean continues to warm”. OK fair enough, we’ll have a look.
I posted this in the previous thread but its on topic here,
——
NOAA in their Arctic Report Card Loudly proclaim Arctic atmospheric temperatures up 5C.
Then leads in with
Atmosphere
Summary
Autumn temperatures are at a record 5º C above normal, due to the major loss of sea ice in recent years which allows more solar heating of the ocean.
But then read the report itself and the text under the graph at the top of this page). NOAA doesn’t report any actual atmospheric temperature measurements from the Arctic Ocean The only data they include, because presumably it is the only data they have, is from land stations. The atmospheric temperatures for the entire Arctic Ocean is extrapolation. No data. None at all.
The 5C increase is just more the deceptive rubbish we are so used from the AGW believers.
——
Also note NOAA are saying loss of sea ice is causing the Arctic warming. Not the other way around.
NOAA are saying absolutely nothing about global warming causing loss of Arctic sea ice. In fact their statements imply global warming isn’t the cause of loss of Arctic sea ice, and strongly imply global warming isn’t the cause of Arctic warming.
But as usual, its all packaged and phrased in ways that can only be intended to mislead and deceive those who are not used to parsing scientific reports, and determining if the evidence supports the conclusions.
Thankyou for pointing to the information @ Bill Illis.
Presuming that Central Greenland is a proxy for the Arctic region generally, then the information dating back over the last 2000 years from those NOAHH links shows that it was indeed warmer and colder than the present. Its confusing that the same organisation would say that it is the warmest for 2000 years when their own data show that it wasn’t.
Amazing: the Kaufman et al. 2009 paper is published September 3, and already all newspapers in the world have a ready comment on it!
Here is copy of my post on Climateaudit:
here is the link from the Globe and Mail piece by Mr. Weber: http://www.theglobeandmail.com/news/technology/science/arctic-warmest-its-been-in-2000-years-study-finds/article1275018/
and here is my complaint to the Canadian Press:
“The Bob Weber
The Canadian Press
Last updated on Thursday, Sep. 03, 2009 05:11PM EDT
A groundbreaking study that traces Arctic temperatures further back than ever before has shown the region is now warmer than at any time in the past 2,000 years…
is truly an incomplete description of the state of scientific knowledge in this field. In particular it completely fails to check the co-authors past history of flawed studies, the validity of the proxies and take the PR from Science and the lead author at face value, despite the existence of a significant amount of peer reviewed literature demonstrating the flaws in the previous studies by IPCC co-authors, rehashed in the Kaufman et al. 2009 paper.
A scientific case is built at
http://www.climateaudit.org/?p=6932
where Mr. Weber could find all the information he needs to amend his article and transform a piece of propaganda into a piece of information.”
Of historical interest,
The two millenia of Arctic temperatures graph above shows shows an abrupt cooling trend around 450AD equivalent to the warming trend from 1900 to 1950.
I’ve speculated before that global cooling contributed to the decline of the Roman Empire and specifically caused their abrupt and unexplained departure from Britain.
That temperature decline exactly coincided with the 20 or 30 year period the Romans are known to have left Britain and the reason likely would have been a decline in British wheat production, which was Britain’s main export under Roman rule.
I noted in the previous thread that wheat is the major crop most at risk from even a short period of global cooling.
Curious how these things tie together.
Anthony, when you want to know what a paper says, do you a) read the paper, or b) read what someone else thinks the paper says, and believe that even when it’s not what the paper says? If the former, why haven’t you done that in this case? If the latter – why?
REPLY:When you are a scientific organization that makes a press release to EurekaAlert, do you a)check it for accuracy b) assume it matches your paper exactly and not worry about any such quality control?
As an American taxpayer, I resent publicly funded work being hidden behind a paywall, so no I don’t always read it right away but I do when it is made publicly available.
Is it wrong for a scientific organization to push press releases that end up in the public eye without providing the public open and unfettered access to the paper? When public funds are used to write the paper, absolutely.
Since you’ve apparently read it, send me your copy then. I’ll look forward to getting it. Provide a valid email address and I’ll contact you and you can send it along with a note showing exactly why the press release is wrong. – Anthony
“I don’t think that an extra 600,000 miles from the Sun is going to make a big difference in total irradiance”
Currently, in the northern hemisphere summer, we’re near aphelion – that’s 94,500,000 miles from the Sun. 600,000 miles less than that is 93,900,000. Solar irradiance is proportional to the inverse square of the distance from the Sun. So in this case, that’s a drop of 1.3%. 1.3% less solar radiation is a huge forcing. Why didn’t you do some simple sums like this before coming to a conclusion?
“With less sea ice in winter, the ocean returns the heat stored in summer to the atmosphere, resulting in warmer winters throughout the Arctic,” said Miller.
So if more heat is returned to the atmosphere, and therefore radiated back out into space, then having less ice in winter results in an overall greater loss of heat and a general cooling of the earth. Resulting in more ice in the future retaining heat causing less ice and loosing heat… Sounds like a good temperature stabilization device (thermostat) to me.
Is this something like the iris effect of clouds in the tropics?
Keith (11:21:58) : Not many thermometers in the arctic. But what there are pretty much conforms to the DMI data. Alert, Nunavut, Canada’s northernmost airport at about 82.5N, is well below freezing for the duration of the season. Forecasts to next Wednesday are for a -8C minimum (17.6F)
http://www.wunderground.com/cgi-bin/findweather/getForecast?query=Alert, Nunavut&wuSelect=WEATHER
And Resolute, Nunavut at 74 43’N is hovering around a freezing average with -6 for a low forecast for next Tuesday and 60% chance of snow on two of the days of the forecast:
http://www.wunderground.com/cgi-bin/findweather/getForecast?query=Resolute, Nunavut&wuSelect=WEATHER
With the Arctic Basin already freezing up, it looks like that part of the arctic alone is not only going to add on almost a half a million square kilometers (0.2million sq.m) of first year ice over last year (which itself had expanded 15% over the infamous 2007 year that was supposed to cause the ice to disappear because of the loss of albedo, dark earth, etc that was regurgitated in the above article) and add to the inventory of second and multiyear ice in the process:
http://arctic.atmos.uiuc.edu/cryosphere/IMAGES/recent365.anom.region.1.html
Lord one goes crazy hoping for a new ice age just for revenge on the destroyers of science.
More on the misleading rubbish in the NOAA Arctic Report Card referred to in the post above.
In the headline sentence they say,
In general, the Arctic Ocean continued to warm and freshen in 2007 under the influence of unusual atmospheric forcing.
Sounds pretty clear cut doesn’t it. Climate forcings are the cause of the Arctic Ocean warming?
But then immediately after in the detail they say,
The circulation of the sea ice cover and ocean surface layer are closely coupled and are primarily wind-driven
So in fact when they say ‘atmospheric forcing’ they mean by this term ‘weather’.
The NOAA are saying weather has caused the Arctic sea ice decline and not climate change.
The whole of the NOAA’s Arctic Report Card is full of this kind of this kind of misleading dishonesty.
I think the data would be more telling by graphing annual Tmax and annual Tmin, I suspect like most weather stations you would find the “warming” occurs on the coldest days of winter, and the hottest days remain unchanged or become slightly cooler. This does not imply melting for the arctic, but instead a more stable climate. Using annual average 2m temperature is also a poor indicator of temperature change.
Plus comparing current temps against some untested proxy is typically a waste of time, and splicing the data normally results in the “dramatic warming” which occurs as a sudden step….hold on, didnt I see one above?
RW (15:23:30) : So in this case, that’s a drop of 1.3%. 1.3% less solar radiation is a huge forcing. Why didn’t you do some simple sums like this before coming to a conclusion?
600,000 miles over 2,000 years. 1.3% over 2,000 years or .065% per century. Hence if you subscribe to the end of the LIA in 1850 or so then a change of .0975% between then and now. If you accept the end of the LIA at around the early 1900s then the change is only .065%. .1% change in solar radiation across the last century is about a cooling of .05 degrees C. Buried so deep inside natural variability that it is almost meaningless. Probably well inside the level of uncertainty in the study.
So then one has to question. 1850 years at .065% per century is 1.2 percent or about .6 to 1.2 degrees C. With that amount of cooling caused by decrease in solar radiation how it the world did the earth escape the LIA …. long before man started pumping massive amounts of CO2 into the atmosphere.
Philip_B (15:10:50) : said
“I’ve speculated before that global cooling contributed to the decline of the Roman Empire and specifically caused their abrupt and unexplained departure from Britain.
That temperature decline exactly coincided with the 20 or 30 year period the Romans are known to have left Britain and the reason likely would have been a decline in British wheat production, which was Britain’s main export under Roman rule.”
Your hypotheses about Roman Britain is well established and described in a number of books.
http://www.bates.edu/x164370.xml
Climate change in Europe also helped to cause the end of their civilisation there, although there were many other contributory factors as well.
tonyb
Lee Kington (13:19:06) : ..Since the Earth is still moving away from the sun — it’s about 0.6 million miles further during the Northern Hemisphere summer solstice than it was in 1 B.C. — it appears greenhouse gases began “overriding” the natural cooling of Earth in the middle of the last century, said Professor Gifford Miller of CU-Boulder’s Institute for Arctic and Alpine Research, a study co-author…
I don’t think that an extra 600,000 miles from the Sun is going to make a big difference in total irradiance…
That logic is fatally flawed. Its amazing how many of these top notch scientists regularly make such elementary errors of logic and hence come to the wrong conclusions.
1. Error of fact? – The Earth-Sun distance is increasing by 15 cms per year. http://www.newscientist.com/article/dn17228-why-is-the-earth-moving-away-from-the-sun.html
By my calculation in 2,000 years the distance would have increased by a mere 300 kms or 188 miles and not 600,000 miles, an error of 320,000 %.
Does he mean that the NH summer solstice is increasing in distance from the sun? He doesnt say so. What he says is “Since the Earth is still moving away from the sun..” and it is not, to any appreciable extent over 2,000 years.
In any case this also has to be checked as I very much doubt it. Perhaps an astronomer (who once replied to me, I forget his name) could do this for us.
2. Error of logic – Even assuming that to be true – how would it appear that greenhouse gases would begin to “override” the natural cooling of Earth in the middle of the last century? What huge difference took place in the last 50 years in the Earth-Sun distance? And the time span he has chosen includes the Roman warm period and the Medieval warm period. How could you explain CO2 overriding the “natural cooling” of the Earth in those periods?
Lee Kington: where are you getting your temperature numbers from? A 0.1% change in solar irradiance corresponds to a forcing of about 0.24W/m⊃2. Climate sensitivity is commonly reckoned to be about 0.75 K/W/m⊃2. So that would be a 0.18K change, not the 0.05K you claim. That is averaging things globally rather than considering them regionally; the effect of this change on northern hemisphere summers is much greater than the global average.
“With that amount of cooling caused by decrease in solar radiation how it the world did the earth escape the LIA …. long before man started pumping massive amounts of CO2 into the atmosphere.”
You don’t need massive amounts of CO2 to affect the radiative balance of the atmosphere. CO2 started rising in about 1750.
Anthony – feel free to use the valid e-mail address I’ve supplied with all my posts. I’ll be happy to send you the paper. Not that you even need it – the abstract directly contradicts what you’ve claimed about it. Why do you persist in misrepresenting it?
REPLY: tsk tsk there RW I caution you. DO NOT transpose what is clearly listed in the press release to be what I’ve written. That is the statement of the press release.
To say I’ve claimed that is wrong and you know it. Just because the abstract doesn’t say that statement means nothing. Retraction required on your part.
– Anthony
“A groundbreaking study that traces Arctic temperatures further back than ever before”
Ha ha, here is a Kaufman paper from 2004, where they go back a lot farther,
http://esp.cr.usgs.gov/research/alaska/PDF/KaufmanAger2004QSR.pdf
but I guess pointing that out would not make the front page.
This is a tremendous relief. After 2000 years of cooling, Earth must have been perilously close to a tipping point that would have led inexorably to the next Ice Age. We have avoided reaching that tipping point for now through serendipitous usage of coal, oil, and natural gas. What will mankind do when those run out?
Well I just sent an e-mail to Jerry Brown’s global warming site; what the hell does the attorney General of California have a department of global warming for. So I told him it wasn’t something his office should be involved in, and basically told him to stay within his own sphere of competence.
Well “moonbeam” Brown always has been a total ding-a-ling; a true product of the sixties crowd epitomized by Joan Baez; whose “folk singing” was predated by decades by the likes of Irish folksinger Mary Ohara; even to singing the very same somgs or close lookalikes.
We get the same tool of big oil tar brush; but nary a mention of the thousands of otherwise unemployed “scientists” swilling at the public trough to try and keep their grant money coming. I know personally, Meteorologists, who are paid good money by people or companies; who really want to know what the near and mid future weather really is going to be; they have financial decisions riding on the outcoem; and they aren’t paying for politically correct opinion; they expect thsoe meteorologists to have much better than even money batting average; and what is more; they can do it.
I know of a guy (in New Zealand of all places) who correctly predicted the development of local weather and wind patterns during the days when the most recent Americas Cup sailing races were held in Valencia Spain; and he did it with the standard information that is available to anyone; and his predictions were uncannily accurate. Now he wouldn’t predict the “weather” a decade from now; he’s not stupid enough to claim he can do that; but he understands what is driving such systems; and the funny thing is he doesn’t even get paid for it; he works for a bank.
In comparison, the hay that has already been once through the horse, that Attorney General Brown has shovel ready, on his website; is a total waste of my tax dollars.
George
stumpy is correct. If you want to look at the effect of air temperatures on ice melt, you clearly look at changes in the amount of time and the degree to which the temperature has been above 0C.
However, as I pointed out above, NOAA actually says,
Autumn temperatures are at a record 5º C above normal, due to the major loss of sea ice in recent years which allows more solar heating of the ocean
They are saying loss of sea ice is the cause of warmer ocean temperatures and consequently the cause of the warmer Arctic air temperatures. Which incidentally is correctly how cause and effect works in the Earth’s climate.
But hey. This is post-modern climate science. Its not about clearly stating the scientific truth. It’s about not saying anything scientifically untrue, while trying to influence public and political opinions.
Anthony, apologies for dominating this thread early on. But a late evening post is an early morning one for me Downunder.
Funny: Trouble is that the anomalies are BELOW zero °C, so…everything it´s OK, nothing to worry…go to sleep polar bears!
The actual problem for the world it is not a temperature change but a political change which can take us back to the middle ages.
Anthony,
While you may dismiss Tamino blithely in this case, he takes the data and demonstrates that it does, indeed, show considerable warming, especially in the latter part of the century, and particularly in the winter: http://tamino.files.wordpress.com/2009/08/tganom2.jpg
Do you suggest that, if you took the DMI data, removed the annual cycle, and did an OLS regression on it, you would not find significant > 3 degrees C warming over the last 40 years?
REPLY: “Tamino” can say anything he wants, that doesn’t make it relevant. The big hot button issue has been “the arctic is melting” I’m only pointing out that if there is no significant excursions beyond the top of the DMI/ERA40 average climate bell curve, then there is no extension of the period when temperatures are warm enough to melt sea ice in place.
A 30 year upwards trend of winter temperature that remains subzero does nothing to enhance ice melt. However wind pattern changes that force the icepack southward along the east coast of Greenland where the ice melts in warmer waters does seem have a big effect. NASA points out significant wind pattern changes, but that is ignored by Tamino and everyone else in his peer group. Why?
“The Arctic is warming” is the news catchphrase desired from the Kaufman paper here, just like it was in Antractica and the Steig et al trainwreck. But if the temperature during the summer Arctic melt season does not increase over summer climate normals, then that has no significant effect on enhancing ice melt. Neither does a warming trend that occurs in deep winter when the temperature averages -20C. If the trend in the last 40 years was to make that winter average go from -23C to -20C (just examples not from data/calcs) then the sea ice remains frozen. It still doesn’t affect the melt until the 2M air temperature trend or other Arctic environmental changes causes a change in the amount of time spent above the freezing point of seawater and that does not appear to be happening.
“Tamino” himself points out that “…most of the temperature change north of latitude 80 deg. has occurred, not in the summer, but in winter/spring/fall.” And during much of that time the air temperature remains below 273K.
But you’ve given me a great idea.
– Anthony
P.S. Caspar Amman is part of this Kaufman paper, and for a look at the sort of integrity in data analysis he has, one should read the excellent Caspar and the Jesus Paper here:
http://bishophill.squarespace.com/blog/2008/8/11/caspar-and-the-jesus-paper.html
It seems the main argument of the IPCC defenders lies on the HADCRUT temperature curve, shown so many times to justify “un-precedented warming”. YET, Phil Jones refuses to offer raw data so HADCRUT salad can be replicated.
I bet that the moment raw data will be available we’ll find that the HADCRUT chef was spicing the mix with hot peppers…
Supposition from my part? Of course. Want to stop them? PUBLISHE THE RAW DATA Dr. Jones!
Zeke Hausfather, I prefer this chart: click. [Note that it shows global temp anomalies.]
Global temperatures are essentially the same as they were thirty years ago. No need for regressions, or removing the annual cycle, or consulting tarot cards, or anything else.
There is no measurable AGW. Everything we see is well within the parameters of natural climate change. Falsify natural climate variability, and you’ve got something. As of now, you’ve got nothin’.
I dunno. Looking at the animation, recheck the downslope, below the blue line. Seems to me the last few years are a lot less cold. Is that what they are seeing in an annual or decadal average? Murray
Smokey,
I see a statistically significant trend of 0.14 degrees C per decade in that chart you posted. Though to be fair, I prefer this version: http://i81.photobucket.com/albums/j237/hausfath/Picture11.png
However, this discussion is about arctic temps, which have risen much faster than global temps no matter what data set you use.
If you want the data that phill jones has collected, here is how to get the data that Phil Jones has collected:
While the whole UK FOI action against CRU was an interesting experiment in how the UK treats FOI requests and embarrassed CRU for not having data traceability, it did really resolve getting the data. To get resolution to this, you have to follow the money. The amount of U.S. government funding to climate scientists is staggering.
Phil Jones (University of East Anglia or UEA) has been funded by the U.S. Department of Energy (DOE) Office of Biological & Environmental Research (BER) since 1993; often with Tom Wigley. [Note, that there is also another Phil Jones at Los Alamos National Laboratory (LANL) who receive funding for climate change research; this is not the same Phil Jones (UEA).] Partial details of the grants and funding are provided at the bottom of this post and greater details on the grants are on the webpages cited. This includes the DOE grant that Steve McIntyre kept asking about: DE-FG02-98ER62601.
As Phil Jones (UEA) has been funded by these grants he is subject to the data sharing policy of the DOE granting office and division. The DOE BER Climate Change Research Division Climate Change Prediction Program at http://www.sc.doe.gov/ober/CCRD/model.html only states: “Funding of projects by the program is contingent on adherence to the BER data sharing policy.”
A much more detailed description of Climate Change Research Division (note the CCRD in the weblink) data sharing policy can be found at http://www.science.doe.gov/ober/CCRD/per.html where among other things it states:
Program Data Policy
The program considers all data collected using program funds, all results of any analysis or synthesis of information using program funds, and all model algorithms and codes developed with program funding to be “program data”. Open sharing of all program data among researchers (and with the interested public) is critical to advancing the program’s mission.
Specific terms of the program’s data sharing policy are: (1) following publication of research results, a copy of underlying data and a clear description of the method(s) of data analysis must be provided to any requester in a timely way; (2) following publication of modeling methods or results, a copy of model code, parameter values, and/or any input dataset(s) must be provided to any requester in a timely way; and (3) recognition of program data sources, either through co-authorship or acknowledgments within publications and presentations, is required.
The program assumes that costs for sharing data are nominal and are built into each grant application or field work proposal. In cases where costs of sharing are not nominal, the burden of costs will be assumed by the requester. The Program Manager should be informed whenever a requester is expected to pay for the costs of obtaining program data, whenever a data request is thought to be unreasonable, and whenever requested program data is undelivered.
Funding of projects by the program is contingent on adherence to this data sharing policy.
Several things pop out in this policy:
“Open sharing of all program data among researchers (and with the interested public) is critical to advancing the program’s mission”
“a copy of underlying data and a clear description of the method(s) of data analysis must be provided to any requester in a timely way”
“following publication of modeling methods or results, a copy of model code, parameter values, and/or any input dataset(s) must be provided to any requester in a timely way;”
“The program assumes that costs for sharing data are nominal and are built into each grant application”
This says nothing about sharing with “academics only”. Sharing with the “interested public” is clearly specified. As Phil Jones (UEA) has published multiple research and modeling results, I’m sure a polite request to Dr. Jones (UEA) from a member of the “interested public” for a copy of underlying data and a clear description of the method(s) of data analysis and a copy of model code, parameter values, and/or any input dataset(s) that are the results of DOE funding would be provided to any requester in a timely way as is required by the DOE data sharing policy. After all, the US taxpayers paid for this work and the interested public should be able to get this info.
If the requested information is “undelivered” then a polite request to the head of Climate Change Prediction Program:
Dr. Anjuli Bamzai
Climate and Environmental Sciences Division, SC-23.1
Department of Energy, GTN Bldg.
1000 Independence Ave, SW
Washington, DC 20585-1290
Phone: (301) 903-0294
Fax: (301) 903-8519
Email: anjuli.bamzai@science.doe.gov
would probably be in order. Perhaps a query about the quality assurance standards for these grants, the traceability of data requirements for these grants, and whether continued funding would be provided to principal investigators who do not comply with data requests could also be made.
If that does work, then a FOIA request to DOE regarding data availability, quality assurance standards, and the traceability of the data might get results. The DOE takes FOIA requests seriously. FOIA worked when Steve McIntyre asked for info from B. Santer at the DOE lab, LLNL.
If there are problems with this, then DOE would be open to FOIA requests as to why their Principal Investigators are not living up to data sharing agreements; why the DOE is not enforcing data sharing agreements; why DOE is funding individuals who do not abide by the DOE data sharing agreements; why the data gathered under the DOE program are not traceable; and if the data are not traceable, then what good are the data.
GRANT INFORMATION (weblink followed by brief description of grant):
http://www.osti.gov/oberabstracts/detail.jsp?projectSerial=3784&query_id=0&searchpage=index.jsp
Register Number: ER94157
Project Term: 12/01/1993 – 11/30/1994
Funding not listed
http://www.osti.gov/oberabstracts/detail.jsp?projectSerial=4270&query_id=0&searchpage=index.jsp
Register Number: ER95144
Project Term: 03/01/1995 – 02/28/1996
Funding not listed
http://www.osti.gov/oberabstracts/detail.jsp?projectSerial=4747&query_id=0&searchpage=index.jsp
Register Number: ER96167
Project Term: 12/01/1994 – 11/30/1997
Funding not listed
http://www.osti.gov/oberabstracts/detail.jsp?projectSerial=2002&query_id=0&searchpage=index.jsp
Register Number: ER62601
BER Division: Climate Change Research Division
Awarded Amount to Date and B&R Code :
FY 2006 $178 k KP120101
FY 2005 $175 k KP120101
FY 2004 $173 k KP120101
FY 2003 $180 k KP120101
FY 2002 $180 k KP120101
FY 2001 $180 k KP120101
FY 2000 $180 k KP120101
FY 1999 $174 k KP120101
FY 1998 $170 k KP120101
NOTE: The grant listed above is DE-FG02-98ER62601
http://www.osti.gov/oberabstracts/detail.jsp?projectSerial=674&query_id=0&searchpage=index.jsp
Register Number: ER60397
BER Division: Climate Change Research Division
Awarded Amount to Date and B&R Code :
FY 2003 $0 k KP120101
FY 2002 $0 k KP120101
FY 2001 $0 k KP120101
FY 2000 $0 k KP120101
FY 1999 $-3 k KP120101
FY 1998 $0 k KP120101
FY 1997 $200 k KP120101
FY 1996 $198 k KP120101
FY 1995 $192 k KP120101
http://www.osti.gov/oberabstracts/detail.jsp?projectSerial=5516&query_id=0&searchpage=index.jsp
Register Number: ER62601
Awarded Amount to Date and B&R Code :
FY 2006 $177 k KP120101
FY 2005 $174 k KP120101
FY 2004 $172 k KP120101
FY 2003 $180 k KP120101
http://www.osti.gov/oberabstracts/detail.jsp?projectSerial=5859&query_id=0&searchpage=index.jsp
Register Number: ER62601
BER Division: Climate Change Research Division
Research Area: CCPP-CCRI
Awarded Amount to Date and B&R Code :
FY 2010 $0 k
FY 2009 $0 k
FY 2008 $199 k KP1206
FY 2007 $0 k
Project Term: 05/01/2007 – 04/30/2010
Juraj V. (11:07:19).. How on Earth they were able to produce such a hockey stick?
I wonder too looking at your graphs.
..The temperature history of the first millennium C.E. is sparsely documented, especially in the Arctic. We present a synthesis of decadally resolved proxy temperature records from poleward of 60°N covering the past 2000 years, which indicates that a pervasive cooling in progress 2000 years ago continued through the Middle Ages and into the Little Ice Age.
“pervasive cooling in progress 2000 years ago” I doubt it very much.
The GISP2 data is not sparse. It is pretty precise, measuring temperatures very precisely at about 10 year intervals. I go by that for the Arctic data, not anything else you may have fudged up.
Yes if you plot a trendline from 2006.87 BP (2000 AD), the trendline goes down, But that is because the temperatures then were 1.3 C higher then than at present. (1.83 C higher at 2068.24 BP)
But If you examine the graph of the anomalies, you can easily see that the cooling has been hardly “PERVASIVE”! (Is there a way for me to upload my graphs here? or maybe you could make some using GISP2 records)
Right from 4433.29 BP till 1375.5 BP, (for over 3,000 years!), the arctic temperatures, at least in Greenland were higher than at present!
There were some periods (3320.32 BP to 3237.71BP – 83 years) when it was over 2.25 C higher and others, for centuries, where it was 1 to 1.5 C higher.
I wonder what the state of the Arctic Ice, polar bears, etc were during that period?
Now the AGW crowd are jumping up and down because the temperatures have been high for 50 years.
From 1365 BP temperatures dropped and remained lower than present till 1121 BP.
From 1113 to 869 BP temperatures remained higher than present and from 1025 to 931 (94 years) more than 0.5 C higher. (The peak at 965 BP 0.94 C higher than present).
This “continued through the Middle Ages”??? This proves your study is rubbish. I would get snipped, but you know exactly what you can do with your “synthesis of decadally resolved proxy temperature records”.
A quick example of real science being used as opposed to the quasi science of the AGW Hypothesis.
…. and it hardly took a moment to do. If Kaufman had done what you had Anthony, they could have spent their grant money studing something more noteworthy and benificial.
Well, your post here opens by claiming a new investigation in Science claimed the trend halted in 1990. But it didn’t…that’s what the EurekaAlert claimed. The abstract you reprinted clearly says otherwise. You don’t need to read the paper, they say outright in the abstract that their investigation showed the trend reversed :
“The cooling trend was reversed during the 20th century, with four of the five warmest decades of our 2000-year-long reconstruction occurring between 1950 and 2000.”
I agree with you that it’s a good place to start, with what the study actually says. I immediately suspected a typo from the EurekaAlert. The 9 isn’t very far from the 0 on a lot of keyboards.
I think it’s obvious that someone made an error. It happens.
As to your gif image, it seems to confirm what Tamino has presented before at Open Minds. I know you and he don’t get along, but that is no reason to cast aside his results. Your .gif of DMI data seems to show this to be the case as well. It has no statistics to show that to be true, but that’s what you get with eyeballing.
Excellent info, Taphonomic (18:06:40). Thanx for posting.
And Zeke Hausfather (18:01:40), that chart is fine, too. There are lots more like it. It clearly shows that the climate is well within the parameters of normal variability. So there is zero need to add an extraneous entity like CO2 to the explanation.
As usual, the climate alarmists avoid talking about Antarctic temperature trends: click.
Since the entire debate is about global warming, then both the Arctic and Antarctic should have equal billing. If you look at GLOBAL ice cover, you will see that it is increasing.
Also, the CO2=AGW contingent loses credibility when charts use an honest y-axis with a zero base line: click.
Face it, there isn’t any proof that AGW exists. It is a failed conjecture that only keeps on its zombie-style living because $Billions are paid out to those perpetrating its Elmer Gantry-type snake oil sales pitch.
If Gore, Mann, Pachauri, Obama, Schmidt, or any other AGW proslytizer really believed in AGW, they would be happy to debate what they believe in. But they hide out from debate! Doesn’t that tell you all you need to know about what they really believe?
Clearing things up…the agreement that your .gif has with Tamino is on greater warming during the winter months as opposed to the summer months.
Anthony Watts says (in reply to RW):
Nobody’s perfect. In the context of their actual paper (and even just the abstract), I think it is almost certain that the “mid-1990s” statement in the press release is a typo and that they meant “mid-1900s”.
Smokey:
First of all, Gore and Obama are politicians, not scientists. Why should they debate the science? They know enough to respect the scientific organizations and the scientific process and leave that to the scientists.
As for Schmidt and Mann, they have been debating the science where it matters…in the peer-reviewed journals. What other controversies (such as that concerning the origins of living things) have shown is that it is the losers in the REAL scientific debate that occurs in the peer-reviewed literature who desperately want to take the debate into a popular forum where they can more easily bamboozle people. (See, for example, here: http://www.pebhmong.com/forum/index.php?action=printpage;topic=112018.0 ) [Schmidt, by the way, has participated in at least one debate, but it is quite debatable what such things accomplish.]
RW (15:23:30) : Currently, in the northern hemisphere summer, we’re near aphelion – that’s 94,500,000 miles from the Sun. 600,000 miles less than that is 93,900,000. Solar irradiance is proportional to the inverse square of the distance from the Sun. So in this case, that’s a drop of 1.3%. 1.3% less solar radiation is a huge forcing. Why didn’t you do some simple sums like this before coming to a conclusion?
RW please see my post Richard (16:42:31).
The question is NOT what difference 600,000 miles would make to the irradiance but whether the figure is correct. I get a figure of 188 miles, not 600,000 miles!
Also the 1.3% difference in irradiance you have mentioned is IRRELEVANT. You obviously dont understand the difference between insolation and irradiance. What really matters is insolation not irradiance.
In July the Earth is at aphelion and Jan perihelion. It is 3.2 million miles further in July than Jan from the Sun. This amounts to the Earth getting 7% less irradiance in July than Jan. Yet the Global temperature of the Earth is 2.9 C warmer in July than Jan!
Go figure that out and answer me if you can instead of fighting strawmen and feeling pretty chuffed about it.
I do like someone who understands the Byzantine corridors of government bureacrats. In this case the US ones.
It seems to me to be good advice. It has the authentic ring of someone who knows whereof they speak.
So you lot push from your end and I will pull from mine and we may yet get Dr. Jones [no relation] at UAE to reveal his secrets.
Kindest regards
Go figure that out and answer me if you can instead of fighting strawmen and feeling pretty chuffed about it.
Well, in scientific terms, it’s the angle of the dangle and the motion of the ocean.
evanmjones (19:43:27) : Well, in scientific terms, it’s the angle of the dangle and the motion of the ocean.
You dont have to use such technical language, cant you explain in simpler terms for us poor laymen? 🙂
Joel Shore said
“As for Schmidt and Mann, they have been debating the science where it matters…in the peer-reviewed journals.”
It’s more like pal-reviewed tabloids nowadays for the Team.
Neven (11:02:50) : “…I understood that when the sea is refreezing after summer melt (counterintuitively) a lot of warmth is released in the atmosphere. The big refreezes of the last few years could explain part of the temperature increase trend in the Arctic.”
Yes, good point. And it also accounts for much of the Steigian statistical kloodgomatic warming of the Antarctic. Record ice buildup requires more heat be removed and dumped into the atmosphere. And ice is a lot denser than air; ice trumps gas.
Bringing things back to Perspective: Having said all that – I do not dispute that the Arctic Ice has been getting thinner in recent years.
My contention is simply this – what has happened during the past 3 decades appears to be nothing unusual or alarming.
Surely one would expect the same and more to have happened when the Arctic was warmer for decades and hundreds and even thousands of years, in our recent past.
Tim (10:24:44) :
the BBC have been full swing on the arctic warming thing.
They say ice, sedemant and tree ring data was used to prove it!
Just a question: are there any trees old enough in the arctic circle to support this claim???
Sure I can imagine so in temperate climates, but I thought the rctic was only pines?
Am I wrong, or more BBC lies?
Plate IV in H.H. Lamb’s Book “Climatic History and the Future” shows a big tree stump dated to about 5000 ybp in the midst of northern Canada tundra. Obviously, the Arctic was a lot warmer at the time. I have suggested to my colleagues that the Arctic Ocean might have been ice-free during the summer at this time. So, here is nice tree ring data in the Arctic, but it exists from a truly warm epoch well before 2,000 years ago. Perhaps there are stumps dating from the MWP preserved in the Arctic somewhere, but, then, wouldn’t they show a warm period in the midst of the cooling trend?
1) “Well, in scientific terms, it’s the angle of the dangle and the motion of the ocean.”
To translate: Because the Northern Hemisphere has a lot of land, and only a little ocean, the surface temperature should warm up and cool down fast. The southern hemisphere has lots of ocean, so should have less temperature variation between summer and winter. (note, I say should, because I haven’t actually looked at the data)
So: in NH summer, eg July, the NH should be comparatively nice and toasty, while the SH should be only a little chilly: the net is therefore warmer than the annual mean. In January, the NH should be really chilly, and the SH should be only a little warm: the net is therefore cooler than the annual mean.
Personally, I would use a climate model to see how that effect compares in magnitude to the difference in distance from the sun effect, but it seems like a reasonable explanation.
2) I think that the press article, while it could have been phrased better, was making the point about insolation on the _Arctic_, in which case all one cares about is the distance from the sun in the summer.
3) I believe that -1.8 degrees C, not zero, is the critical point for freezing seawater (and presumably melting ice that is in contact with seawater, though that might not apply to surface meltpools)
4) Given the high heat capacity of water, the temperature during the winter months might matter even when it is below the -1.8 degree threshold: eg, melting will happen earlier if the winter averages -25 degrees, compared to a winter where it averages -35. Again, despite the dislike of this website for computer models, they would be the best way to determine how the magnitude of the seawater temperature effect compares to the magnitude of latent heat of fusion, especially given that the ice sheet insulates a decent portion of the Arctic Ocean.
Joel Shore (19:15:17) :
[Schmidt, by the way, has participated in at least one debate, but it is quite debatable what such things accomplish.]
You’ll be referring to the I-squared dabate with Michael Crichton and Professors Lindzen and Stott? Well – that debate did accomplish one thing for Gavin Schmidt: it showed that he couldn’t debate and quite frankly appeared to be well out of his depth.
A claim made in Kaufman’s 2004 effort, and I think made here as well, is that an ice-free arctic ocean contributes greatly to warming because it is “dark”. And this same fact seems to be the basis of the “arctic is just about at a tipping point” belief as well.
Well ocean actually is dark when one is looking straight down, but at low angles the ocean surface looks like the sky because it is reflecting the sky. Now in the arctic the sun is never very high anyway and so there is reduced irradiance from the low angle, and probably a reasonably high reflection coefficient. Moreover, the arctic has quite a lot of ice-free area in “normal” times.
Does anyone know of a study done to show how much more energy would be absorbed in an ice-free arctic ocean as opposed to a 1979-2000 average arctic ocean? I can imagine that the effect is actually quite small, but I may be wrong.
Right. In this case the NH-oriented land distribution at full face to the sun overcomes the greater solar distance at aphelion.
In order to determine what that 7% solar difference makes would be to compare NH summer when it occurs at perihelion to when it occurs at aphelion. But we can only do that by proxy, of course, as a full equinox cycle is ~23,000 years.
Marcus (21:56:52) : and evanmjones (22:18:58) : This is something that puzzled me and I have actually worked out here:
http://wattsupwiththat.com/2009/08/21/soho-back-up-and-running-didnt-miss-anything-sun-still-blank/ Richard (20:54:22)
evanmjones is spot on.
But this still leaves the question where he gets the 600,000 mile figure from, when it should be 188 miles. And it still leaves the logical fault I have pointed out above: Richard (16:42:31)
Looks like we’ve got another hockey stick here– with the raw data withheld.
I believe that -1.8 degrees C, not zero, is the critical point for freezing seawater (and presumably melting ice that is in contact with seawater
No (re melting), ice frozen from sea water leaves the salt behind and is salt free frozen water. It melts above zero degrees C.
Interestingly, the extensive sea ice in the Southern Oceans makes the water saltier than the rest of the world’s oceans. To a degree that is fatal to most fish. As a result there are few fish in the waters around Antarctica.
http://www.gma.org/surfing/antarctica/salt.html
This from David Scneider’s web page, pointing out his work on Steig et al 2009.
http://www.cgd.ucar.edu/~dschneid/David_P._Schneider/Research.html
There are always many interesting things to work on. Among them, I continue to collaborate with Dr. Eric Steig, my former Ph.D. advisor, at the University of Washington. Recent work includes the reconstruction of Antarctic temperatures (Steig et al., 2009; Schneider and Steig, 2008). This revealed a clear warming trend in West Antarctica during the past ~50 years.
This is some background from Bette L. Otto-Bliesner’s website:
http://www.cgd.ucar.edu/ccr/ottobli/
Arctic Warmth and the Greenland Ice Sheet
I am currently also working closely with the paleodata and ice sheet modeling communities to examine the warm Arctic summers during the Last Interglaciation and impact on the polar ice sheets of Greenland and Antarctica and global sea level. These calculations show summers 3 to 5½C warmer than today in the Arctic, especially over and near Greenland, in very good agreement with the IGBP CAPE (CircumArctic PaleoEnvironments) proxy data synthesis. Ice cores in Greenland indicate that the Greenland ice sheet was significantly smaller during this interglaciation. Calculations with the University of Calgary ice sheet model show that the substantial melting of the Greenland ice sheet and the complete melting of the nearby eastern Canadian icefields likely contributed 2 to 4 meters of sea level rise during this past time period.
The results are quite relevant to assessments of projections of future climate change. The Arctic summer warmth during the Last Interglaciation is comparable to what might be expected by year 2100 if greenhouse gases increase to an equivalent radiative forcing of a tripling of atmospheric carbon dioxide (although the impact on the Greenland ice sheet will likely take several centuries more). This is a collaborative project with Jonathan Overpeck at the University of Arizona, Shawn Marshall at the University of Calgary, Gifford Miller at the University of Colorado, and the IGBP CAPE project.
Typo – David Schneider
Note to those commenting about N-S asymmetry:
The NH is also warming for the reasons Yu.V. Barkin points out.
Academic arrogance drives a neverending barrage of untenable assumptions that blinds unquestioning followers, sometimes for centuries. Barkin peels wool off innocent eyes, exposing yet more of the “convenient math” that has deceived the masses.
Trust in consensus-makers is being ground to a pulp.
It seems to me that there is some important material emerging here that wants to be saved / made accessible somewhere
(1) Taphonomic (18:06:40 on 4 Sept) on “follow the money” to get Phil Jones’ data because his money sources stipulate that the source is conditional on data being open and available;
(2) Richard (18:38:32) “…The GISP2 data is not sparse. It is pretty precise, measuring temperatures very precisely at about 10 year intervals. I go by that for the Arctic data, not anything else… if you examine the graph of the anomalies, you can easily see that the cooling has been hardly “PERVASIVE”! (Is there a way for me to upload my graphs here? or maybe you could make some using GISP2 records)…”
Also, evanmjones, have a look at George White’s work “CO2 Forcing: Fact or Fiction”if you don’t know it already, it deserves a place in the real science for intelligent reading of the ice core records and good grasp of the complex effect of Milankovitch cycles on the development of ice ages.
To translate: Because the Northern Hemisphere has a lot of land, and only a little ocean, the surface temperature should warm up and cool down fast. The southern hemisphere has lots of ocean, so should have less temperature variation between summer and winter. (note, I say should, because I haven’t actually looked at the data)
So: in NH summer, eg July, the NH should be comparatively nice and toasty, while the SH should be only a little chilly: the net is therefore warmer than the annual mean. In January, the NH should be really chilly, and the SH should be only a little warm: the net is therefore cooler than the annual mean.
All this is true, and the effect is much larger than you would anticipate. In July the world’s average atmospheric temperature is more than 7C higher than in January.
According to the IPCC logic this means the NH is already having a climate catastrophy (compared to the SH). Which goes to show how ludicrous the climate alarmism is.
http://itg1.meteor.wisc.edu/wxwise/AckermanKnox/chap14/climate_spatial_scales.html
The post 1958 animation plot is most interesting:
1. It shows that throughout the period, brief spikes exist where an anomaly of up to 20 degrees exists compared to the long-term mean. This should be firmly pointed out next time some journo goes off on their hobby horse that Arctic temperatures are massively above average…..that was true in January 2009 and temperatures are entirely normal now……
2. A huge anomaly exists in late 2006/07 which presumably can be correlated in part to the massive ice loss that summer? What did this have to do with carbon dioxide? Given the consistent pumping of that gas into the atmosphere, sudden surges and returns to normal in arctic temperatures seem somewhat at odds with that as a causative agent, would you agree?
3. What would be most valuable would be a plot of the frequency of major anomaly events over this period (+5 to +10; +10 to +15; +15 to plus 20 and > plus 20 degrees from the mean; ditto negative ones) to see if there is a short- or medium term difference e.g. post 1975 when the PDO shifted or e.g. after when the AMO shifted or e.g. after any other known oscillatory patterns relevant to arctic last shifted phase…
“By my calculation in 2,000 years the distance would have increased by a mere 300 kms or 188 miles and not 600,000 miles, an error of 320,000 %.”
Calculating something entirely unrelated and then alleging a vast error is laughable. Ever heard of Milankovitch cycles? What is your understanding of them?
Hello Warmistas! For the 100st time: And what about medival climate optimum? The vikings settling in GREENland?
Apparently, Arctic is often definied as 60-90 N. But almost no region as far south as 60 N has an Arctic climate! If the definition is chosen as 65-90 N, 70-90 N, or only parts of the Northern Hemisphere with an Arctic climate, there is no measureble difference between the warm period in the 30’s and the present warm period.
Re: P Wilson (12:38:32) :
I might also suggest that the BBC is a news and entertainment organisation, and not a scientific organisation
—
I’d suggest it’s more an entertainment and infotainment organisation, and it’s admitted a bias towards promoting a warmist agenda. This goes against the principles laid out for it in it’s Charter, and for which it gets around $5.2bn a year from the government. Currently it’s illegal to be informed, educated or entertained via TV in the UK without subscribing to the BBC first.
A few years ago, the BBC asked for even more money, it was denied, so it promptly slashed the budgets for it’s news department, along with it’s natural history units and most of it’s factual and learning budgets. It didn’t stop it producing lavish warmist infotainment like ‘Climate Wars’ though.
Much of what passes for ‘news’ now from the BBC is simply churnalism provided by wire services. Nick Davies explains on this in ‘Flat Earth News’ & also explains the time pressure the BBC’s news dept is under to get copy to multiple BBC units, which means facts go unchecked.
For PR companies like Fenton and EMS, this is a godsend because it makes setting the agenda easy and cheap. For the public, it’s not such good news, but then we have the blogosphere to provide balance.
>>>I might also suggest that the BBC is a “news and
>>>entertainment” organisation, and not a scientific organisation
I think you mean “propaganda and entertainment”.
Besides, it used to carry good technical and scientific programs. Try this for a bit of nostalgia:
.
“DaveE (13:17:35) :
JaneHM (10:56:42) :
Kaufman et al appears to be in conflict with the historical records of Scandinavian exploration of the Arctic North Atlantic around 1000 – 1400 AD and earlier
Plate tectonics my dear, Greenland was 1000 miles further South then 😉
DaveE”
DaveE has made a signifcant discovery. Greenland has been travelling South at the rate of a mile a year and no one has noticed!
Richard (16:42:31): “The Earth-Sun distance is increasing by 15 cms per year. By my calculation in 2,000 years the distance would have increased by a mere 300 kms or 188 miles and not 600,000 miles, an error of 320,000 %”
Your calculation is wrong on two levels. Firstly, 15cm * 2000 years = 300 metres not 300 km.
Secondly, the article you cited is not referring perehelion/apehelion changes but to tiny tidal drag effects which are in addition to these.
Regarding the BBC I no longer watch their news programmes which are biased toward the loony left viewpoint on almost any topic under discussion.
I now watch Sky news for a more matter of fact appraisal and one evening this week was pleased to hear their major newsman Steve Dixon aver that he did not accept the Global Warming arguments.
He is still in his slot on Sky which proves that that programme provider at least allows independent thinking and possibly that Sky is rowing back from the unthinking acceptance of the AGW theory demonstrated by the rest of the MSM.
“Richard (22:43:00) :
But this still leaves the question where he gets the 600,000 mile figure from, when it should be 188 miles. And it still leaves the logical fault I have pointed out above: Richard (16:42:31)”
Since AGW-people hide their data and computer code, we have to recreate it. He must have had the distance in meters, and then changed those into °F.
“No (re melting), ice frozen from sea water leaves the salt behind and is salt free frozen water. It melts above zero degrees C.”
I know that sea ice is in fact pure ice. I still think that sea ice in contact with salt water melts at below 0 C. Experiment: make a bucket of water. Add lots of salt. Drop crushed ice in. Measure temperature with a thermometer. Eventually, the temperature of the bucket will drop below 0 degrees (with enough ice). This phenomenon is used by chemists all the time to cool reactions to a few degrees below zero, and I don’t think it would work if the ice doesn’t melt below zero. (I think this is used for making homemade ice cream the old fashioned way, too. Heck, this is why you throw salt on icy roads to melt it)
I did point out that surface meltpools probably don’t happen unless its warmer, because you are dealing with mostly pure ice, though there might be some salt from sea spray, trapped salt after the freezing process, etc.
Yeah… But just about all of that anomalous Arctic warming happened between 1920 and 1940.
From 1900 to 1950 CO2 levels climbed from around 280ppm to 310ppm… The Arctic warmed by about 0.7C during that period according to Kaufman.
From 1950 to the present CO2 levels climbed from around 310ppm to 385ppm… The Arctic warmed by 0.1C to 0.2C during that period according to Kaufman.
1900-1950 – CO2 + 30ppm –> + 0.7C
1950-2009 – CO2 +75ppm –> + 0.2C
Just like the Pleistocene ice cores… The CO2 is lagging behind the warming.
Moderator… Please close my blockquote after “However, this discussion is about arctic temps, which have risen much faster than global temps no matter what data set you use” in my (07:36:01) post.
For a good summary of average ground station temperatures in the arctic, goto
http://rimfrost.no/
Click on the country (upper left) Arctica. On the pull down below, select RIMFROST Ave.
This will give a chart of showing the general average since 1950. While there has been some warming in the lst 20 years, it does not appear that significant. A more interesting chart is to go to the Upernavik (NW Greenland) station, where they have temp data from the late 1800’s. This is under the same Arctica heading, as well as many other stations, from Norway, Sweden, Russia, etc..
RW – Tamino bungled already on his analysis in “Central England Temperature Analysis”. Seems he used the 1659-2008 data to project ever increasing temperatures into this decade. Seems nature has it’s own ideas.
Richard (16:42:31) :
Lee Kington (13:19:06) : ..Since the Earth is still moving away from the sun — it’s about 0.6 million miles further during the Northern Hemisphere summer solstice than it was in 1 B.C. — it appears greenhouse gases began “overriding” the natural cooling of Earth in the middle of the last century, said Professor Gifford Miller of CU-Boulder’s Institute for Arctic and Alpine Research, a study co-author…
By my calculation in 2,000 years the distance would have increased by a mere 300 kms or 188 miles and not 600,000 miles, an error of 320,000 %.
Does he mean that the NH summer solstice is increasing in distance from the sun? He doesnt say so. What he says is “Since the Earth is still moving away from the sun..” and it is not, to any appreciable extent over 2,000 years.
That appears to be exactly what Kingston (see above) is saying.
What the paper actually says is:
“The millennial-scale cooling trend in our temperature reconstruction correlates with the reduction in summer insolation, which was primarily driven by the precession of the solstices around Earth’s elliptical orbit. Over the past 2000 years, summer (JJA) insolation at the top of the atmosphere decreased by about 6 W m–2 at 65°N (Fig. 3F) (21)”
Ref 21 is A. Berger, M. F. Loutre, Quat. Sci. Rev. 10, 297 (1991).
Which can be found at:
http://www.sciencedirect.com/science?_ob=ArticleURL&_udi=B6VBC-4888CF7-4D&_user=1082852&_rdoc=1&_fmt=&_orig=search&_sort=d&_docanchor=&view=c&_acct=C000051401&_version=1&_urlVersion=0&_userid=1082852&md5=e51b417ac064d965c15b33e31be1c20b
Looks like a good correlation to me from 1960
http://www.zen141854.zen.co.uk/trend.jpg
Getting warmer in the Arctic, so less ice in the Arctic … not rocket science.
Regards
Andy
Anthony
You may wish to look at Dr. Jeff Masters’ “wunderblog” on Weatherunderground as he blogs at some length on this paper at http://www.wunderground.com/blog/JeffMasters/comment.html?entrynum=1310
How does UHI fit into this?
Barrow has to be one of the data points and Hinkel, et al, Int. J. Climatol 23:1889-1905 (2003) confirmed the existence of an UHI in Barrow to the tune of an average value of 3.2C.
If other data points are in populated areas, this could explain everything.
Has anyone extracted the perihelion/aphelion mean temperature variation from the historical data ?
it should be close to 1% .
Phil. (08:27:05) : “The millennial-scale cooling trend in our temperature reconstruction correlates with the reduction in summer insolation, which was primarily driven by the precession of the solstices around Earth’s elliptical orbit. Over the past 2000 years, summer (JJA) insolation at the top of the atmosphere decreased by about 6 W m–2 at 65°N (Fig. 3F) (21)”
Well that shows that Professor Gifford Miller, who I presume is not an astronomer, is a little careless with his language – “SINCE the Earth is still moving away from the sun…” (therefore)…
The Earth is only moving away imperceptibly from the Sun. Perhaps a reflection of his mind, he could be similarly careless with his reasoning.
I assume that Berger’s astronomical calculations are correct. Insolation has decreased at 65 N, at the top of the atmosphere, by about 6 W/m^2 from 01 BC. How then does Professor Gifford Miller conclude from this that “greenhouse gases began “overriding” the natural cooling of Earth in the middle of the last century”?
1. Insolation on the Earth’s surface, in addition to that received at the top of the atmosphere, depends on the cloud cover and can vary by as much as 70% from that figure.
2. If change in insolation received at the top of the atmosphere were the only consideration for the change in Global temperatures then the cooling should have been uniform. It is not. There have been warm periods within the last 2010 years, notably the Roman warm period and the Medieval warm Period.
The present warm period could also be just like the other two, specially as the Medieval warm period was upto 1 C warmer than present.
3. “Cooling” if you want to take a linear trend, has been taking place almost since the start of this interglacial, towards the beginning of the Holocene. What is so special about a trendline of 50 years when taken in context of a larger trendline of almost 10,000 years?
Specially when, even according to the IPCC, there was at least one period were the Earth warmed faster than the present with no appreciable change in GHG’s?
4. “The temperature history of the first millennium C.E. is sparsely documented, especially in the Arctic.” – It is not. It is very precisely documented in the GISP2 ice core records.
This seems to be another case of a “climate scientist” plugging in data from a field beyond his expertise (astronomy) with his own specious “proxy reconstructions”, then using flawed logic to reach a dubious conclusion.
The IJIS sea ice data has not been updated since Sept 3. Whats up?
RW (16:46:38) :
Lee Kington: where are you getting your temperature numbers from? A 0.1% change in solar irradiance corresponds to a forcing of about 0.24W/m⊃2. Climate sensitivity is commonly reckoned to be about 0.75 K/W/m⊃2. So that would be a 0.18K change, not the 0.05K you claim.
Even if one accepts your 0.18K …. an ‘expected’ cooling of 0.18 over a century is minimal and easily affected by natural variations. It is overly simplistic to say that due to solar irradiance a cooling of 0.18 should occur and if it does not then the cause must be CO2.
If one ignores the MWP, the level of warmth of the MWP, or subscribes to the ‘regional event’ claim for the MWP then another could equally cite any claimed or real warming in the Arctic within the area of study as a ‘regional event’ of natural origin.
I think the GISP data (from 65°N ) is enough evidence to raise question.
http://mclean.ch/climate/figures_2/GISP_to_11Kybp.gif
It seems to be little appreciated that mean temperature cannot be
explained by simple scalar one dimensional
calculation on insolation since that is equivalent
to being a
point surrounded by a sphere at a uniform temperature . By
the zeroth law of thermodynamics , it must come to that temperature .
absorptivity/emissivity is a parameter, which , not
knowing any better , I’d call its Kirchhoff
value , ranging between 0 and 1 ( in
K APL :
&/( 0 < ; 1 > ) @\:
) at each wavelength . The spectrum of an object is then , its
Kirchhoff value for each wavelength .
Only differences in the correlation of an object’s spectra
toward sources , eg , the millionth of the sky subtended by the sun ,
and sinks , eg , the rest at near zero , effect mean temperature . An
important example is that a uniform gray sphere , ie , flat spectrum
,
Kirchhoff : { 1 - albedo } / all wavelengths, will come to the same temperature as a black body
. Only differences in gray value on day versus night side ,
or with , eg , latitude make any difference .
Foo . Wish I could edit , but close enough .
Lee Kington (15:48:28) : Even if one accepts your 0.18K …. an ‘expected’ cooling of 0.18 over a century is minimal and easily affected by natural variations.
The expected cooling would not be 0.18 C per century it would be over 2,000 years (as per RW’s calculations).
I suggest you ignore RW. You flatter him by responding. He has demonstrated that he does not understand the difference between solar irradiation and insolation.
Richard , How do you define the difference between insolation and solar irradiation ?
Bob Armstrong (00:27:36) : Richard , How do you define the difference between insolation and solar irradiation ?
Insolation, as I understand it, is the solar radiation received at a given surface on the Earth, am I correct? This would vary greatly with the latitude because of the curvature of the earth and the time of the year and day.
A few days ago, I was puzzled as to why the absolute global temperatures were higher in July rather than in Jan, when we were actually further from the Sun in July than Jan. I was told because we had more land area in the NH and it heated up more during the northern summer.
I worked it out here: http://wattsupwiththat.com/2009/08/21/soho-back-up-and-running-didnt-miss-anything-sun-still-blank/ Richard (20:54:22) and got a pretty good agreement.
Well, in scientific terms, it’s the angle of the dangle and the motion of the ocean
Ah , so
tsi2insol : { y * _cos x }/ where x is the angle between the normals to the direction of the sun and the surface being irradiated and y is tsi .
Thanks for the definition .
Anthony’s reply to Zeke:
“Tamino” himself points out that “…most of the temperature change north of latitude 80 deg. has occurred, not in the summer, but in winter/spring/fall.”
It appears that Anthony has a valid point.
With Precession summer aphelion = tendency for a cooler summer but warmer winter. Distance at aphelion has been increasing but is just about at the midpoint. We should be experiencing the least amount of variation between winter and summer.
Obliquity (tilt) = less tilt creates a tendency for a cooler summer but a warmer winter. The tilt of the earth is currently decreasing.
What tamino is saying is that the temperatures are going up in the winter. Well DUH !!! Tamino just proved what Anthony demonstrated to be true, valid, and expected.
Anthony,
If you have still not obtained a copy of the SCIENCE paper, I should be happy to email you a copy. I agree with you that any paper given wide press attention should not be behind a paywall.
Says the article: “One of the most common claims of alarmists is that the Arctic is “melting” and that implies a temperature cause in their statements. But as we see, during the critical melt window, the DMI data seems to hold right along the climatic normal.”
—
The arctic sea-ice is melting.
It is not caused by a slight increase of the freezing point of water, and it is not very much caused by air temperature as the article shows. While the ice melts, air temperature in that great stretch of sea could not rise much above freezing until all the ice has gone – elementary physics, almost.
The melting happens primarily from the underside and is caused by increased SST’s. But they are a symptom of GW.
Bob Armstrong (14:53:16) :
Ah , so
tsi2insol : { y * _cos x }
where x is the angle between the normals to the direction of the sun and the surface being irradiated and y is tsi .
That is correct
x is rather complicated as it depends on the latitude, declination angle and time of day.
The fact that the vikings settled in Greenland tells by itself nothing about climate or climate changes. Then, as well as now, in some favourable regions, e. g. around Gardar/Igaliku, a certain agriculture, such as sheep-breeding, was possible. Then, like now, the inland ice was just some dozens of kilometres away; that is, “green” meant for the vikings just enough land to live and survive. Why they disappeared, for this we unhappily have no saga. One possible answer might be “filthy weather” over years with all the aftermath, but this is something different from “official” climate change.
:))