The Solar and Heliospheric Observatory (SOHO) satellite is back in operation after some required downtime to keep it operating.
Alas, it didn’t miss anything, the sun remains spotless.

From Spaceweather.com
According to NOAA sunspot counts, the longest stretch of spotless suns during the current solar minimum was 52 days in July, August and Sept. of 2008. The current spate of blank suns is putting that record in jeopardy. There have been no sunspots for almost 42 days and there are none in the offing. Deep solar minimum continues.
Spotless Days
Current Stretch: 42 days
2009 total: 184 days (79%)
Since 2004: 695 days
Typical Solar Min: 485 days
There’s some contention over that claim, as WUWT readers may recall that SIDC in Belgium last year retroactively counted a sunspeck from a drawing by Catainia observatory, nullifying the stretch of sunspotless days in August 2008. NOAA’s SWPC appears not to recognize that sunspeck and so their claim is for a 52 day stretch.
Will SIDC pull another sunspeck stunt this August? I’m sure they are “poreing” over the sketches now.
Joe D’Aleo puts this current stretch in perspective:
Today, Thursday, August 20th marked the 41st straight day without a sunspot, one of the longest stretches this solar minimum.

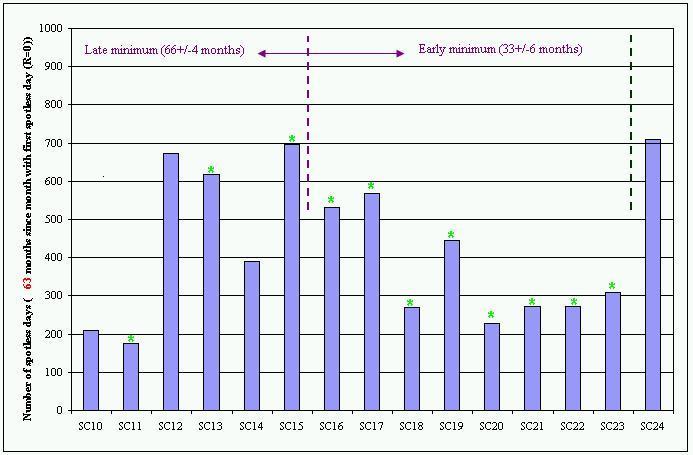
In fact it rises into 10th place among all spotless periods since 1849 (first table here). The total number of spotless days this transition from cycle 23 to 24 is now 694 rapidly approaching the approximate number leading into cycle 15 in the early 1900s (below, enlarged here).

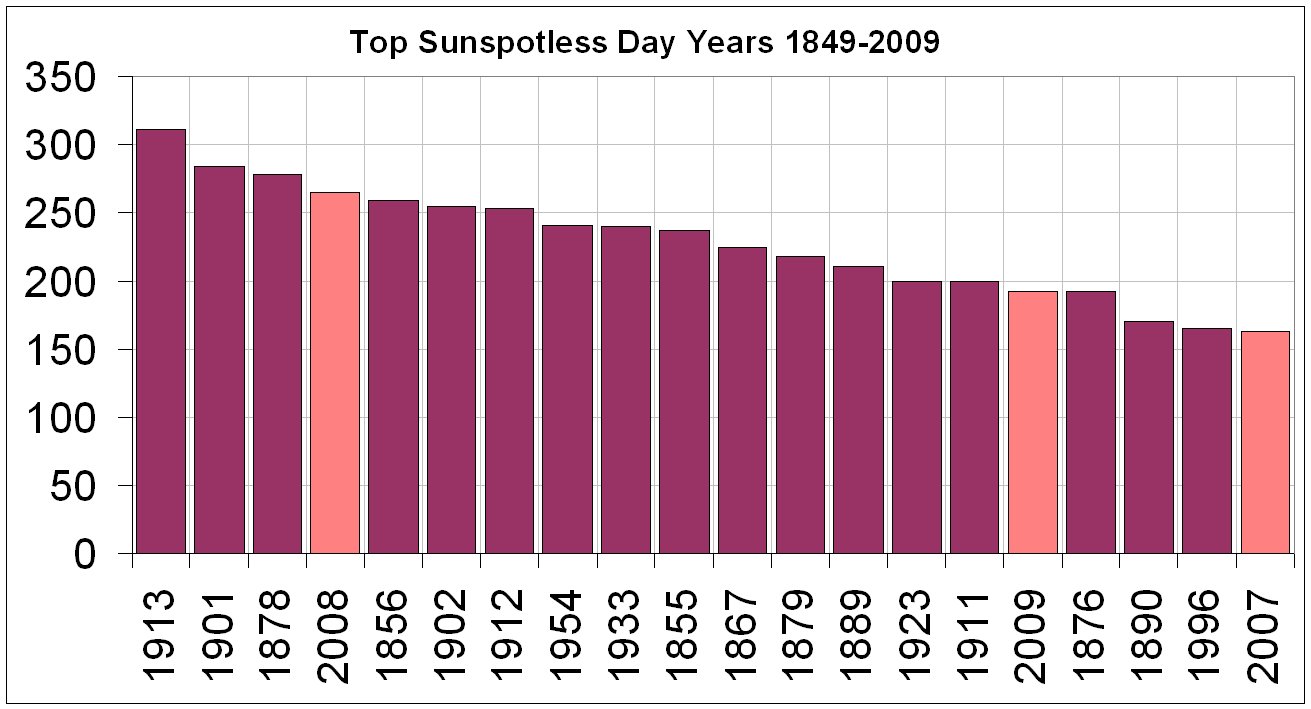
We have had 183 spotless days this year (79% of the days). We are in the top 20 years in 17th place. We will very likely rapidly rise up the list in upcoming weeks and rival 2008’s 265 days and likely end in the top 5 years. 2007, 2008, 2009 will only have 1911, 1912, 1913 in the top 20 as string of 3 per transition (below, enlarged here).

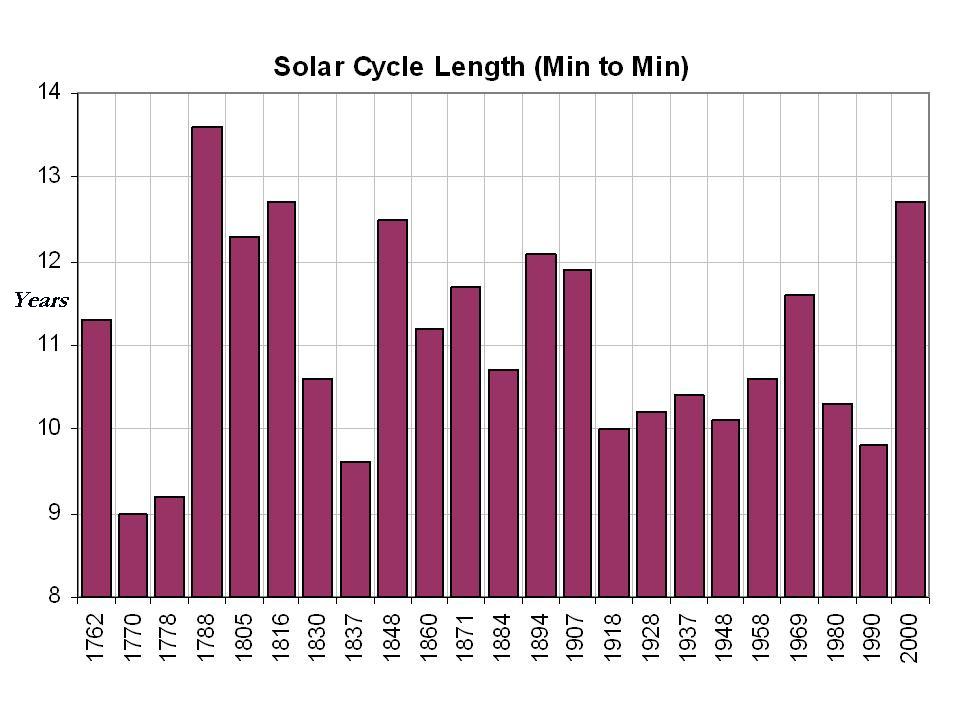
The cycle minimum probably was December, 2008. January 2009 13 month average came up a bit due to slight bump in activity in June and July but if August should end up sunspotless and September low, we could have a double bottom. The 12.7 years assuming December 2008 was longest in two centuries (below, enlarged here).

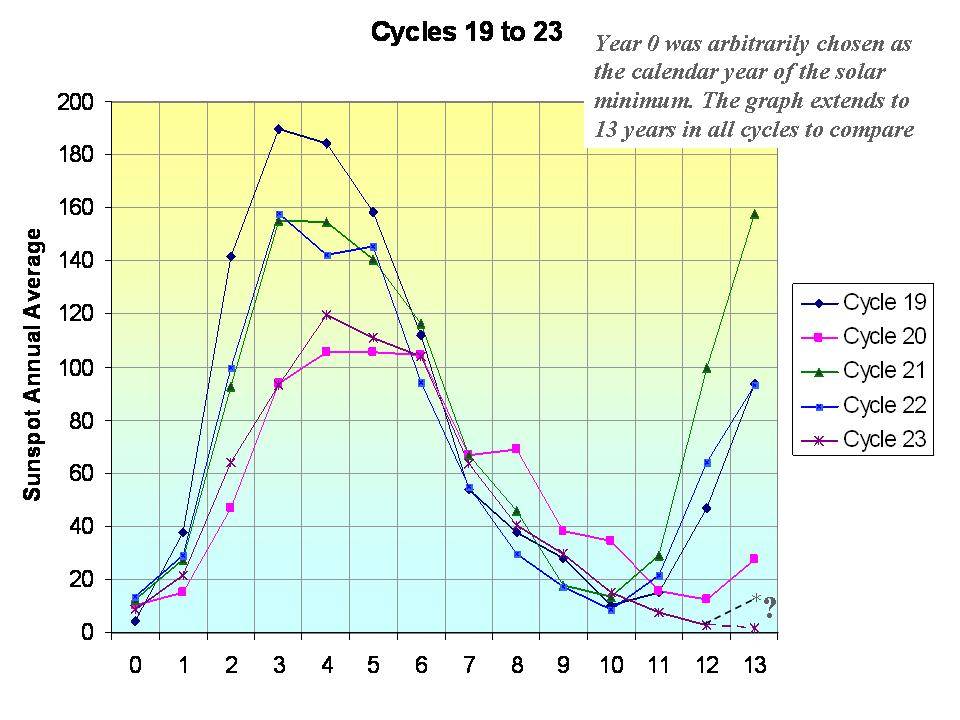
You can see on this chart, by 13 years after the solar minimum year, most of the last 5 cycles already had recovered, in one case already to the solar max (below, enlarged here).

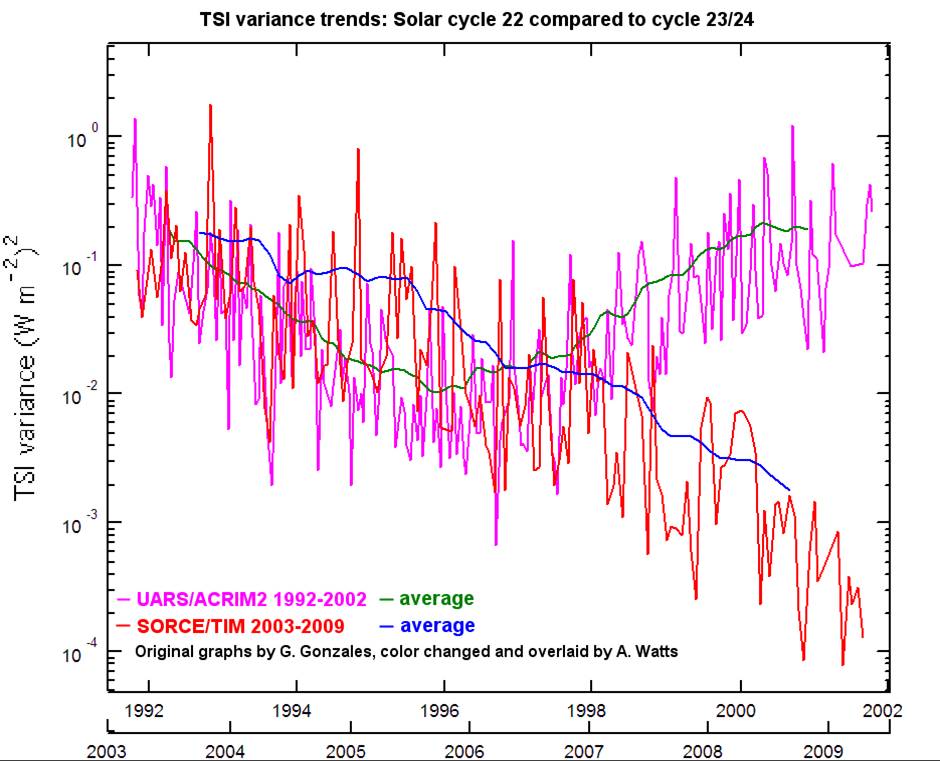
This cycle has continued to decline in the solar irradiance, solar flux, sunspot number and geomagnetic activity after 10 years. On the following chart produced by Anthony Watts, you can see the Total Solar Irradiance declining whereas the prior cycle was rebounding(below, enlarged here).

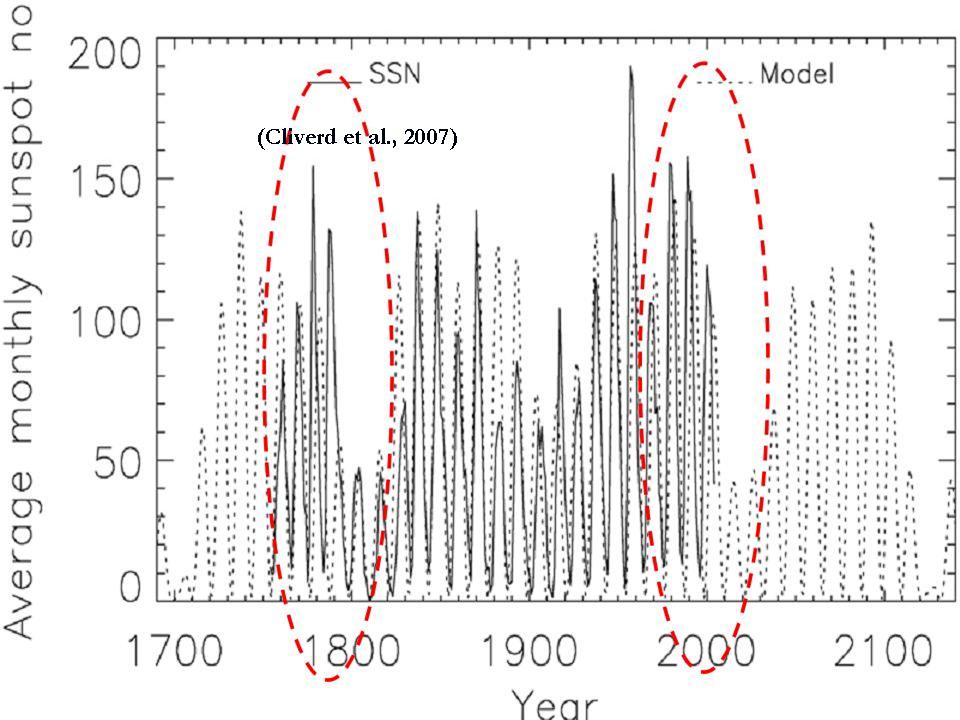
Clilverd et al 2006 suggests using a statistical analysis of the various cycles (11, 22, 53, 88, 105, 213, and 426 years) shows the next two cycles will likely be very quiet much like those of 200 years ago in the early 1800s, the so called Dalton Minimum, the time of Dickens (with snows and cold in London like last winter) (below, enlarged here).

See what David Archibald shows what the result might be if Clilverd is correct here. Some have not ruled out an even stronger Maunder like Minimum. See more complete PDF here.
So good o’l D Archibald was right. Where are those who said he was wrong? The silence is deafening….
But I am curious why Leif’s site shows are recent sunspot here while I don’t see any such spot listed at spaceweather.
“Will SIDC pull another sunspeck stunt this August? I’m sure they are “poreing” over the sketches now.”
Even the most desperate of searches among all the images produced in the last 21 days will yield nothing. Solar Minimum lives.
thanks goodd
I don’t know what the spotless sun means in the grand scheme of things but I bet that so many computer screens have never been so spotless before either. A new proxy for ‘The Mann’ perhaps?
What odds on neither the NE Passage NOR the NW passage being navigable this summer?
What odds the arctic ice minimum extent paralleling 2005 i.e. recoiling from 2007 local minimum?
What, if any, evidence exists concerning cumulative effect of an El Nino and a concomitant solar minimum?
What evidence, if any, exists concerning long-term oceanic cooling (15 – 20 years) and weak solar activity concomitantly?
What progress, if any, to report on the agreement of a global rural temperature measurement network to eliminate UHIs from the ‘global’ ‘temperature record’?
There is no end of predictions being made, most of which will be wrong in some respect or another. It will be interesting to see what a year from now looks like.
I am most troubled by the fact that this deep solar minimum is getting minimal coverage in the mainstream media. If it wasn’t for the global warming narrative, this would be front page news. The world may be entering a period of potentially significant and extended cooling and much of the mainstream media refuses to report on it. If cooling leads to crop failures and food shortages, mainstream media outlets and their editors will be culpable for misleading the public and delaying study and preparations for this eventuality. Several editors, especially at the BBC, might even get to see the inside of a prison cell…
Lets hope it keeps going as this Test series is a good’n & certainly seems to be helping us out at cricket!
Now what was it Prof Mike Lockwood was saying something about no evidence of cooling……….3 poor summers in a row completely against the flow of official information, the first October snow in 74 years, a bad winter that caught the state run Met Office completey off guard, all major long-range forecasts for winter 08/09 north & south were fooled, record cold temps all over the place, forecasts were complety wrong & it appears their computer models clearly have issues predicting long-range weather forecasts, (so what hope global climate) another milder than usual winter forecast/predicted again for 09/10, global cooling for 8 years, have they no shame or are they going for the law of averages again? Yep , I guess that’s no evidence then.
If Stacy Stephens spied a septuplet of semiquaver sunspots, how many serendipitous sunspots did Stacy Stephens sight?
Alan the Brit (09:48:23) :
“Lets hope it keeps going as this Test series is a good’n & certainly seems to be helping us out at cricket! ”
Hear hear! Broad played a blinder there for a Michelle – what a session! 4 wickets for Swann and one for Freddie. This is no flat Oval pitch! I think Broad will end up as one of the great all rounders.
CMJ has been talking about Wilfred Rhodes who used to ‘watch’ cricket long after he went blind. He knew what was happening just by the sound of the bat on the ball. Isn’t it a pity that ‘climate scientists’ and ‘climate modelers’ do not have the same perspicacity?
What is that old saying about a “watched pot?”
Seriously, this has to be taken more seriously than the historical record. Has anyone done a most recent minimum period survey using the detection thresholds available a century plus pervious?
VG (09:15:16) :
So good o’l D Archibald was right. Where are those who said he was wrong? The silence is deafening….
Right about what? I said he was wrong – not about the solar cycle length – but about the 2 deg decline in temperatures. Many, including Leif Svalgaard, were predicting that solar cycle 24 would be weaker than recent solar cycles.
Don’t worry you won’t get silence from me. I’d like to David to tell us how is predicions for Armagh are progressing. I’ve asked the question at least twice but perhaps he’s not seen it.
Could this be a rare double solar minimum minima?… or is it minima minimum?
Robert Coté said:
“What is that old saying about a “watched pot?”
Seriously, this has to be taken more seriously than the historical record. Has anyone done a most recent minimum period survey using the detection thresholds available a century plus pervious?”
I’ve been wondering that myself…
Alan the Brit
If our lot don’t do anything stupid the Ashes will be ours…all ours!
This extended solar minimum as well as the current financial crisis are both examples of how the expert consensus was off track in its predictions. It will take more time to see how expert predictions turn out in the case of AGW, but one thing is for sure, the world is going to do this experiment. We will all know the answer in a couple more decades. It is a bonus that our Sun is getting involved in the experiment too. If the solar cycle stays weak, we will see if there can be warming independent of what the Sun is doing.
I am currently a skeptic, but if the temperature goes up significantly in the next decade I will likely convert to the other side. On the other hand, if the temperature stays relatively flat or declines, it becomes harder with each passing year for the AGW experts to excuse the lack of temperature increase as natural variability while pointing to past warming as being unnatural.
The 42 day spotless daus stretch may be inaccurate. there have been a few very small less than 1 day spots that have got a count but there seems to be some disaggreement if they should count.
I think we should do the same with those sunspots that last for less than 1 day the same thing as we did with Pluto, demote them.
I suggest those short lived sunspots that where not observed 100+ years ago as “Dwarf spots”.
Then we will still count them, which we should, but they get their own classification and thus we can easier compare the sunspot data with the past.
Here comes the WATTS effect again to be tested!
Rewording the title:
The SUN…is back in operation after some required downtime to keep it operating….
However, as David Archibald said, this will take a bit longer. Interesting times indeed.
Or…Is it CO2 which shines every morning (…not down here-el Nino 1+2 zone-, of course, because of the curse made by Svensmark et al.) 🙂
So now that this article is out, do we have a metric for “average days post article for first return of a sunspot”? IIRC, it’s been between 1/2 day and 2 days… Maybe you need a daily sunspot article so we can warm up a bit! (I’m planting peas and potatoes a bit early, having given up on a significant bean yield and while I’m getting tomatoes at last, they are slow to ripen. Oh, and the “summer squash” has gone all “fall mouldy leaves” on me already; about a month early. Kale and collards doing great, though! They usually get burned in August…)
It will be great fun to see what a Major Minimum 😉 really does. The “warming” of our present thermometer record can not be caused by the sun (the thermometer records do not warm in summer, only in winter… not so the sun…) but I still hold out (slim?) hope that the solar cycle can be tied to minor cyclical changes on a longer time scale. And I certainly expect we will get lots of interesting answers to all sorts of questions from this quiet sun…
http://chiefio.wordpress.com/2009/08/09/co2-takes-summers-off/
http://chiefio.wordpress.com/2009/08/05/agw-is-a-thermometer-count-artifact/
Now that it is reported in Watts Up With That, we should have a new sunspot any day.
We live in interesting times. Is this a blessing or a curse?
This are my data of spotless days for Sidc and Noaa, and i have count them many times, so i’m very sure that the right count is this:
Updated today, 8/21/2009
For Sidc: total days spotless in 2009: 185
total days spotless since 2004: 694
For NOAA: total days spotless in 2009: 186
total days spotless since 2004: 699
This is my link that i update every day: http://daltonsminima.wordpress.com/dati-sole-in-diretta/
Simon from Italy
The current stretch is 42 for noaa and 22 for sidc (update 8/21/2009)
crosspatch (09:19:03) :
But I am curious why Leif’s site shows are recent sunspot here while I don’t see any such spot listed at spaceweather.
I was thinking the same thing. 2 small cycle 23 spikes since that big cycle 24 spot went across the Sun. I was thinking there hadn’t been any spots since the last big one. The 2 cycle 23 “sunspots” must have been pretty small and shortlived because the spikes are much smaller than any other on the graph, which I find interesting because I think back to some of the specks that have been counted (maybe not by Leif).
the two spots on 23 and 30 july were seen only by Catania…
but Sidc count them…
Then, it is very probable that ‘ll repeat the same situation of the last year, when only Catania saw the spot and agust didn’t finish at 0 because Sidc counts it…
Catania, Catania, Catania…I apologize on behalf of the alls Italians, because for those who do not know, Catania is an Italian observatory …
SIDC has provisional sunspot counts on July 23 and 30. IOW, they’ve already proactively counted the specks, no need to go back and recount.
http://www.sidc.be/products/ri/
Less than a week to the big 700. Little over a week to go till a full calendar month. When is the hathaway prediction v15.7.0 coming out?
Folks. I’m a layman and follow this site regularly. I am fascinated by the postings and learn a great deal, but still frequently get lost in the science. I am indebted to you nonetheless for the education. I have a question that is simplistic and will betray my ignorance, but if someone could help me I’d appreciate it. What is the statistical point at which the solar minimum can be said to have ended and the next cycle begun?
Sunners, on whose beach I surf, would like nothing better than a solid link between TSI (or even spots) and climate, but until someone comes up with a clever Mannomatic RegEM PCA teleconnection, it just ain’t there.
Warmer is better, but if warmer means cap’n tax, I’ll go with cooler. Against all Leif’s logic, that dull-as-a-piece-of-grey-linoleum magnetogram gives me hope. Welcome
baskback SOHO.“crosspatch (09:19:03) :
But I am curious why Leif’s site shows are recent sunspot here while I don’t see any such spot listed at spaceweather.”
I am not surprised. Leif needs to show that his predictions will be correct.
The reason that you don’t see this on spaceweather is because there was no spot.
It was a tiny SC 23 magnetic signature that would not have been counted in 2001 solar max or even in 2006 when solar min began; let alone 200 years ago.
Once again bias has infiltrated science.
None of these tiny tims would have been counted had this minimum been “normal”.
Fact is, that this minimum is unusual and regardless of whether the pseudo-spots of the last two years have been counted fairly or not; SC 23 is now nearly 12.7 years long and thus the longest in 200 years.
Grand minimum looks more likely to occur with each passing day.
Remember:
1.In 2005 they said “We expect SC 24 to pick up at the end of 2006 and be record setting.”
2.In 2006 they said “We expect SC 24 to pick up by 2007.”
3.In 2007 they said “This minimum is not unusual, activity will pick up by March 2008.”
4.In March 2008 they said : “SC 23 has returned but SC 24 will pick up by the end of 2008”.
5.In November 2008 (International sunspot number 4.1) they said: “SC 24 has finally begun. We were right.”
6.Then December 2008 had an international sunspot number of 0.8, they said: “December was quiet, but minimum is over and SC 24 will be up and running by mid 2009.”
7.On 6th July 2009 a huge fuss was made about “the biggest spot in 2 years”, which didn’t make sense because the SC 23 sunspots of late March 2008 were much bigger.
8. It is now August 21st. The sunspot number so far, is a grand total of… Zero (0), but apparently Solar Minimum is over.
There were 3 pores in Late July/Early August and although invisible to most (clean) telescopes, this ‘clearly indicates’ that SC 24 is now ramping up.
Referring to my favorite graph…
http://users.telenet.be/j.janssens/Spotless/Spotless.html#Evolution
…we’re now above the SC16-23 two sigma line, so we’re definitely not in Kansas, anymore. We are, however, still within the one sigma envelope for SC10-15, so we’re not in OZ, either. Yet.
Keep watching the skies.
ok, no sunspots. then the “climate” should put up or shut up and get cold. I know it might take a while for the sun to truly affect our temperature and climate. But for the past 6 weeks according to UAH Channel 5 we continue to be very much above the 20 year average. Most of last month we were above the 20 year highs.
http://discover.itsc.uah.edu/amsutemps/
channel 5, draw graph.
A stronger minimum. I know what you mean, but perhaps we need better phrasing.
* Deeper solar depression
* Weaker sun
* Reduced sunlight
* Overly calm sun
* Weaker solar warming
* Colder
* Indoor summer season
* Even further below normal
Tom Trezise (11:09:04) – We don’t know when the new cycle begins until after we see increased activity on the Sun. From the magnetic polarity on sunspots we know that some of the new cycle has begun, but overall activity is still too low to confirm that the next cycle has started.
After all, if the Sun remains as quiet as it is for several more years and then a new cycle begins with the same magnetic polarity as the present cycle — it would generally be agreed that the cycle which we’re waiting for effectively did not happen. We simply can’t know the new cycle has begun until the Sun already has increased its measurable activity.
Just The Facts (09:47:45) :
I am most troubled by the fact that this deep solar minimum is getting minimal coverage in the mainstream media. If it wasn’t for the global warming narrative, this would be front page news. The world may be entering a period of potentially significant and extended cooling and much of the mainstream media refuses to report on it. If cooling leads to crop failures and food shortages, mainstream media outlets and their editors will be culpable for misleading the public and delaying study and preparations for this eventuality.
~~~~
the MSM won’t be nearly as culpable (though perhaps their crediblity will finally be destroyed) as James Hansen and Al the Goracle, or the various governments that are *pushing* the AGW lie.
Damn SUV’s driving around on the sun, spitting out all that co2. It has stopped the sun from working. We better tax it….
On a serious note, many have stated that these are interesting times. They certainly are, and if that sun doesn’t wake up, we could start the slow decent in temps, and the news media will be scrambling over each other to state they were the first to bring this to our attention…..
According to NOAA sunspot counts, the longest stretch of spotless suns during the current solar minimum was 52 days in July, August and Sept. of 2008. The current spate of blank suns is putting that record in jeopardy.
He better come to the plate swinging. God will just throw spitters low and outside to bust up the record. Never fails.
@ Tom Trezise (11:09:04) :
“Folks. I’m a layman and follow this site regularly. I am fascinated by the postings and learn a great deal, but still frequently get lost in the science. I am indebted to you nonetheless for the education. I have a question that is simplistic and will betray my ignorance, but if someone could help me I’d appreciate it. What is the statistical point at which the solar minimum can be said to have ended and the next cycle begun? ”
That’s not a simple question. Depends a great deal on the “statistics” and data that went before, for the past 4.5 billion years, of which we have very fragmentary data. I would suggest that you conduct your own statistical analysis using your own data and assumptions, and/or trusted data from known sources. To help you in that, I’ll refer you to this book by Edwin Jaynes “PROBABILITY THEORY:
THE LOGIC OF SCIENCE” http://omega.albany.edu:8008/JaynesBook.html , and to this site for more of a primer in “Orthodox” methods of practical data collection and analysis. http://www.statsoft.com/textbook/stathome.html .
In addition to that, there are a number of physical laws that pertain that you’ll have to research and study, including nuclear physics. If anyone gives a point estimate of the probability of the “shift” I recommend that you ignore them.
Mr. Alex (11:22:03) : Your reasoning confirms that those scientists are in the pay of Big Al (not Big Oil), trying desesperately to demonstrate that 2+2 equals 1.5, or “it is not the sun stupid deniers; it’s CO2, our God, which shines above”
Hope Copenhaguen will frost…
John Finn. In the past you have indicated that you are an expert at predictions. The UAH lower troposphere anomaly peaked in April 1998 at .770. When exactly will that be exceeded? Thanks. fm
The current stretch is 42 for noaa and 22 for sidc (update 8/21/2009)
What, it was ruled an error?
With virtually no sunspots, it’s only a matter of time before the AGW’ers come up with a sunspot hockey stick graph. 🙂
SIDC= Solar Impaired Devotees Carbon
Michael (10:46:45) : “We live in interesting times. Is this a blessing or a curse?”
Yes. 🙂
There were 3 pores in Late July/Early August and although invisible to most (clean) telescopes, this ‘clearly indicates’ that SC 24 is now ramping up.
Has anyone here ever been on a snipe hunt?
crosspatch (09:19:03) :
But I am curious why Leif’s site shows are recent sunspot here while I don’t see any such spot listed at spaceweather.
~~~~~~~~~~~~~~~~~~~~~~~~~~~~~~~~~~~~~~~~~~~~
I can’t find the last two sunspots Leif shows. See
http://www2.nict.go.jp/y/y223/sept/swcenter/sunspot.html
Did these two cycle 23 spots each rapidly come and go on the backside, Leif?
crosspatch (09:19:03) :
But I am curious why Leif’s site shows are recent sunspot here while I don’t see any such spot listed at spaceweather.
I enquired of Leif about this and his reply was:
The official NOAA number will always be 11 or above. NOAA throws away spots that are too small or don’t last more than 12 hours, or are only seen by one observer. I at times keep those [but at half weight:
you’ll see that the points are at SSN=5 and not 11] if I judge that they were real, e.g. that F10.7 also went up or there was a small magnetic region. They show that there was SOME activity. In order not to confuse them with the official count, I make then only half [or less] the height.
Observatory: ALAMAGORDO
Obs. Time: 18.8 UT Seeing: Fair RSN: ///
No. Location Type Area Number of Spot
19 N16E22 Bxo(L) 10 2
So how exactly does the continuous rise in planetary CO2 rates cause the Sun to go dormant ? Thereis such obvious causality here . . .
What part of Al Gore’s film, book or training addresses this phenomenon ? When will the IPCC have a Conference to discuss this ?
Lance (11:49:59) :
the news media will be scrambling over each other to state they were the first to bring this to our attention
The best advice to the media:
Before it’s too late put someone, on a 24 hrs. shift , to read WUWT, so you’ll be informed in advance.
Michael (10:46:45) : “We live in interesting times. Is this a blessing or a curse?”
An old Spanish blessing/proverb goes: “Que no hayan novedades,” which translates as “May no new thing arise.”
New things, by their nature, being bad of course. I feel that “May you live in interesting times” is in a similar vein, and is more along the lines of a curse.
So, will our dear world leaders put up an action plan on the next G8 meeting so that by 2030 the global world temperature doesn’t drop by more then 2C?
I don’t think so!
Nogw (12:31:45) :
[i]Lance (11:49:59) :
the news media will be scrambling over each other to state they were the first to bring this to our attention
The best advice to the media:
Before it’s too late put someone, on a 24 hrs. shift , to read WUWT, so you’ll be informed in advance.[/i]
Probably wouldn’t do any good. Fox Business was hugely impressed yesterday about the discovery that the Earth was regularly bombarded by meteors (Killer Asteroid’s was the term used. Michio Kaku was being interviewed about it to pump his new book. Pretty amusing. http://glickreport.blogs.foxbusiness.com/2009/08/20/next-global-crisis-killer-asteroids/ .
No different really than CNN or any other news outlet. This sort of thing is “Sunday Supplement” stuff that just fills space between important things like who is screwing who, and was it any good.
The Oulu neutron count remains pegged at about 4.5% above the last solar minimum. (and is at a record high)
http://cosmicrays.oulu.fi/
A drop in either the Ap index or the radio flux back to their recent minimums would be significant.
http://www.swpc.noaa.gov/ftpdir/weekly/RecentIndices.txt
Ap Geomagnetic index
date Ap index
—— ——-
2003 05 26
…..
2008 08 5
2008 09 5
2008 10 6
2008 11 3
2008 12 2
2009 01 3
2009 02 4
2009 03 4
2009 04 4
2009 05 4
2009 06 5
2009 07 5
The 10.7 cm radio flux is up slightly similar to the Ap index
http://www.leif.org/research/TSI-SORCE-2008-now.png
James the Simple (12:39:37) : If you are a spaniard you are already living in the most interesting times, after Spain fell down in the hole of the “renewable energies” scam, so you electricity bill must reflect the consequences of such a leftist paradise. You’ll need the help of Don Quijote to tear down all those “windmills”, a product of a mad man imagination as any other “windmills of the mind”
On the El Nino scale, how does our current El Nino measure up?
Frank Mosher (12:02:07) :
John Finn. In the past you have indicated that you are an expert at predictions.
I don’t recall “indicating” any such thing.
ked5 (11:43:23) :
“the MSM won’t be nearly as culpable (though perhaps their crediblity will finally be destroyed) as James Hansen and Al the Goracle, or the various governments that are *pushing* the AGW lie.”
It is pretty difficult to delineate culpability between those who tell the lies and those who propagate them. Clearly people like Hansen, Mann, Gore and Pachauri are culpable and their comeuppance will be severe. However, if it wasn’t for the dearth of journalistic integrity within the MSM, these liars would have been exposed years ago. The BBC is a public entity and has a responsibility to accurately inform the public. If they’ve breached the public trust, then then those responsible should held to account in a court of law.
So, if this period causes cooling, is it delayed? I don’t see that much cooling.
Does anyone know for certian?
Or is this period of low activity keeping us from the hockey stick rise in temp?
I’ve been on a snipe hunt and the ones we got had no taste at all.
Just when we think we’ve got the universe figured out, it will spin a 180* on us.
Global warming is probably happening, regardless of those who are rooting for it to cool (therefor making the hypothesis false, etc. etc.).
We are best to let it go. Root for sensibility.
Your graph of solar irradiance is actually of solar irradiance variance, showing only that the sun’s radiance is very stable right now. Yes, irradiance is less, but that graph does not show it.
To E.M.Smith: The sun does indeed radiate about 6.6% stronger in Winter, every Winter — this is because Earth is closest to the Sun in January, when the total Solar disk area seen on the sky is about 6.6% larger than in July.
Michael (13:09:01)
The current El Nino is at the Cialis moment
Another view of the no-sunspot Sun http://photon-hunter.de/temp/astro/ISS-Transit-small-ann.jpg
Gary P (13:02:06) :
Old sun is in need of a cardiologist!
However, if we check Leifs graph we find that those pores were of SC23 magnetic signature. So I guess it means SC23 is ramping up again then 🙂
http://www.leif.org/research/TSI-SORCE-2008-now.png
KW (13:43:10) When cold pray to your Gaia Goddess [snip]
Anthony about time you came clean and admitted you have got climate change wrong.
The oceans are running warmest on record for summer, sea level is running at record highs for this time of year (not hiding behind a seasonal cycle), the satellite data would have been hottest were not for a large “correction” and this is all happening with a cold cold sun.
It’s got so warm out there even the “sceptics” are having trouble finding cold weather to talk about.
REPLY: Hah, doc, you make this too easy. Someday I’ll visit BoM and tell you all about it. I do find your demands amusing though, especially since it all turned on one month with the El Nino going from zero anomaly in UAH LT. Tell me, does climate happen in 1 month? 😉
Here’s a few to talk about at the water cooler at BoM.
http://latimesblogs.latimes.com/lanow/2009/08/las-cold-summer-continues-lancaster-posts-a-record-low-temperature.html
http://newsminer.com/news/2009/aug/21/fairbanks-flirts-frost-early-cold-weather-arrives/
http://www.nzherald.co.nz/business/news/article.cfm?c_id=3&objectid=10590529
I’m still pretty comfortable with my position. Time is on our side. Rant all you like. – Anthony
Historic records from the Little Ice Age show a regular appearance of hot summers followed by cold (very cold) winters.
You can find the historic records here:
http://www.booty.org.uk/booty.weather/climate/1800_1849.htm
Let’s see what the coming winter brings.
alan the brit, how much lower would those record cold temperatures have to go before they kill off those olive trees which people here in London have started to plant in their gardens in the last years? Would serve them right for counting on global warming wouldn’t it.
I would have to agree with (Clilverd et al 2006) projections for future solar activity since it is in a good agreement with my formula (Jan 2004)
http://xxx.lanl.gov/ftp/astro-ph/papers/0401/0401107.pdf
http://www.vukcevic.co.uk/combined.gif
but I am not certain that climatic downturn would be that severe.
I would suggest in addition to SSN and TSI numbers one might keep an eye on the Earth’s magnetic field as seen here:
http://www.vukcevic.talktalk.net/GeoMagField.gif
John Finn (10:11:10) :
VG (09:15:16) :
..I said he was wrong – not about the solar cycle length – but about the 2 deg decline in temperatures.
Yes 2 degrees cooling (over how much time?) seems as absurd a prediction as the warmers warming predictions. At the moment we are “pretty warm” “global averagely” speaking and the sea is warm.
No matter what about the solar cycle spotless days, the TSI is increasing from 5th July which was aphelion day, as we get closer to the sun. There doesnt seem to be much variation in TSI.
For example on the 14th of August the TSI was 1326.33 W/m^2 and last year (14th August 2008) TSI was 1326.51W/m^2. Just a wee bit less this year.
The solar wind is calm though and I wonder how that will pan out with relation to the temperature. Undoubtedly this should have an effect if the calm days last.
I keep an eye on the sea ice data. The Arctic melt seems to be slowing down, but I cant be sure. I wonder how accurate the IJIS data is? It seems to fluctuate wildly, couldnt possibly be fluctuating like that in reality. For example on the 1st and 2nd of June if it is to be believed Arctic ice grew by about 120,000 sq kms. This is obviously not true.
Also the ice-extent picture shows the approach to Gjoa Havn, for example, free of ice. As per the local charts/information it was supposed to have 20% coverage, but as per the people actually negotiating it ( Sprague Theobald’s blog), it had 90% coverage. The satellites are supposed to pick up upto 30% coverage and more, so one wonders.
Steven Hill (13:22:31) :
So, if this period causes cooling, is it delayed? I don’t see that much cooling.
Be patient, Steve, teh thermal time constant of the ocean is massive, and I reckon they cool more slowly than they warm.
Richard, Leif uses TSI measurements corrected for the elliptical orbit of the Earth, normalised to one astronomical unit.
What is more interesting is how the TSI differs across the spectrum.
Willy (13:53:26) :
To E.M.Smith: The sun does indeed appear to radiate about 6.6% stronger in Winter, every Winter — this is because Earth is closest to the Sun in January, when the Earth is at perihelion.
And be thankful that it is. Due to precession of the equinoxes, in a few thousand years time, the greater insolation will be in the Southern Oceans. The Northern landmasses will get VERY COLD – prepare for ice ages.
The distribution of the land masses have an incredible effect on the climate. I assume that, eventually, the landmasses will all end up around the equator. I’m puzzled by how Antartica appears stuck on the South Pole. I mean. even Australia is moving.
Carsten Arnholm, Norway (14:23:50) :
Mr. Alex (11:22:03)
See the SOHO thread for Leif’s explanation of his “semi-sun-speck”.
UK Sceptic (10:28:51) :
Alan the Brit
If our lot don’t do anything stupid the Ashes will be ours…all ours!
Here I was thinking a little good news on the fight for reason at this site would cheer me up, unlikely to be anything here about the terrible cricket news. Doh!
Come on. Cricket is teh ghey.
Steven Hill (13:22:31) :
“So, if this period causes cooling, is it delayed? I don’t see that much cooling.”
The oceans store an immense amount of heat, whereas the change in solar output appears to be relatively small. Given this scenario it could take many years for Earth to cool down, unless another factor, e.g. a major volcano, altered the balance.
“Does anyone know for certian?”
No. Nor will we for many years. This is what is so troubling about the supposed scientific consensus on anthropogenic global warming. We don’t understand how the sun works, we don’t understand how the clouds work, yet Warmists claim to understand Earth’s climate and its future trajectory with absolute certainty. At present we have a rudimentary understanding of Earth’s climate system.
“Or is this period of low activity keeping us from the hockey stick rise in temp?”
Possibly, but the evidence that CO2 is a major driver of Earth’s temperature is quite flimsy. The Hockey Stick graph has been thoroughly discredited and we don’t know what other evidence might have been falsified. I am an avid reader and very openminded and based on a preponderance of the evidence, I’m skeptical.
If the little pipsqueak peek-a-boo spots stand in official counts, then the 1911-13 and 1898-1901 records are also reduced. They had those type of spots, weak and fleeting, and they are recorded on photoeheliograms but not in the official counts.
How do the keepers of the count wish to slice this?
A.) Keep to the standards by which NOAA has 52 spots in 2008 or
B.) go back and insert the phantoms in the historic record and prune the spotless days counts?
Your wish is my command. Standing by and ready to take the machette to the confetti.
The kicker is, that no matter how you count or don’t count Casper the Friendly Sunspeck, Solar Activity for very long stretches was and is at very low levels.
Knock, knock, knockin’ on Daltons Door.
Richard (15:22:14) :
Strange things can happen to a slightly lowered TSI and raised UV as it strikes obliquely in the high latitudes. Blurring due to refraction is a problem in the UV, and it accelerates much faster than IR as the angle increases.
Also, those EIT 284’s are showing a healthy increase in GCR hits, much like the early HST WFPC1 images did on long exposure last solar minimum.
Somehow I don’t see lone Coronal Hole high-speed streams now & then as helping matters much.
10.7 is rising; Leif can’t be wrong about that. I think we are seeing the Livingston and Penn effect; but for the Chesiring of the Cat, we’d see a few small Cycle 24 spots. They’re comin’ round the mountain occultly spinnin’ yarns.
=====================================
rbateman (16:36:46) :
If the little pipsqueak peek-a-boo spots stand in official counts, then the 1911-13 and 1898-1901 records are also reduced. They had those type of spots, weak and fleeting, and they are recorded on photoeheliograms but not in the official counts.
How do the keepers of the count wish to slice this?
A.) Keep to the standards by which NOAA has 52 spots in 2008 or
B.) go back and insert the phantoms in the historic record and prune the spotless days counts?
Your wish is my command. Standing by and ready to take the machette to the confetti.
The kicker is, that no matter how you count or don’t count Casper the Friendly Sunspeck, Solar Activity for very long stretches was and is at very low levels.
Knock, knock, knockin’ on Daltons Door.
~~~~~~~~~~~~~~~~~~~~~~~~~~~~~~~~~
Or knock, knock, knockin’ on Maunder’s door…
kim (17:22:05) :
10.7 is rising; Leif can’t be wrong about that.
it was rising, but taken an odd little dip. And if the sun continues blank, it may stay low. We shall see how it goes.
Or sing along with Mitch Miller.
A funny thing happened on the way to the Dalton….the SSN bounced up & down 4 times.between Jan 1798 and May 1800. If someone wants to claim the ball bounced higher on the way to the Dalton, they would probably be right.
As for knockin’ on Maunder’s door, the Paris Observatory should have a nice collection of sunspot drawings from who’s who in Early Modern Astronomy. Picard is reported to be a perfectionist supreme and the one La Hire drawing I have seen is a masterpiece.
What I wouldn’t give to see that stuff !!!
Still waiting for the next Nasa Cycle 24 forecast.
Robert Wood (15:35:45) :
The distribution of the land masses have an incredible effect on the climate. I assume that, eventually, the landmasses will all end up around the equator. I’m puzzled by how Antartica appears stuck on the South Pole. I mean. even Australia is moving.”
Why do you assume that the landmasses will land up at the equator? And why are you “puzzled by how Antartica appears stuck on the South Pole”? Australia maybe “moving” but then so is New Zealand and Antarctica and every other tectonic plate in the world.
In 200 million years Europe and the America’s will be very far apart. The Atlantic larger than the Pacific, North America straddling the equator, Australia in the northern hemisphere, etc. But dont expect to see any changes tomorrow, or even in the next thousand years. The movement is very slow.
Do a google search for “Continental Drift” and you will get plenty of information on this.
Due to precession of the equinoxes, in a few thousand years time, the greater insolation will be in the Southern Oceans. The Northern landmasses will get VERY COLD – prepare for ice ages.
It is when summers get cooler that “ice ages” start by melting less of the previous winter’s ice and snow.
Precession is not the only way that the Earth’s climate is affected astronomically.
The axial tilt varies from 22.1 degrees to 24.5 degrees and back again on a 41,000-year cycle. Currently, this is at 23.44 degrees and decreasing. Minimum means more favourable conditions for an ice age, because the mean insolation reduces in high latitudes as well as reduction in summer insolation.
It will reach the minimum value around 10,000 AD.
Then there is the orbital inclination about the invariable plane. This has a 100,000 year cycle matching the 100,000 year cycle of the ice ages. It is hypothesised (and I favour that), that this passes through a disk of panetary dust which causes the ice ages.
The Earth presently moves through this plane around January 9 and July 9, very close to the perihelions and aphelions.
I think this combined with the half cycle of the precession, which is around 10,300 years is connected with the length of the interglacials, as the correspondence of the lenghts is very good.
If this be so then the next ice age is not too far away and if CO2 is indeed keeping us warmer then it may just be our best friend, as Svante Arrhenius, the adopted father of the warmers, thought it would be.
PS The half-cycle of the precession is about 10,800 years, which will hopefully give us a couple of centuries more of warm weather.
Here on, whether reference is to Sun or Snipe, there is more misinformation than otherwise. However, more certainty seems to involve the Snipe than the Sun. See:
http://images.google.com/images?hl=en&q=snipe+birds&revid=1457072127&resnum=0&um=1&ie=UTF-8&ei=yGKPSveqKY_KsQPXn40M&sa=X&oi=image_result_group&ct=title&resnum=4
or
http://www.mbr-pwrc.usgs.gov/Infocenter/i2300id.html
Robert Coté (10:11:02) asked:
“What is that old saying about a ‘watched pot?’ ”
Yes, the very act of all us skeptics watching the sun for its next spot will be blamed for changing the normal observation of many spots ala the quantum-level “Observer Effect!”
Sorta like Krakatoa’s recent rumblings and ramp up? The big anniversary is next week too.
Interesting times indeed.
http://www.dailymail.co.uk/news/worldnews/article-1203028/Will-Krakatoa-rock-world-Last-time-killed-thousands-changed-weather-years-deadlier.html
Rhys Jaggar (09:37:11) :
What odds on neither the NE Passage NOR the NW passage being navigable this summer?
9 hours ago: “Beluga ships travel northeast passage”:
http://www.google.com/url?sa=t&source=web&oi=news_result&ct=res&cd=1&url=http%3A%2F%2Fwww.joc.com%2Fnode%2F413026&ei=FnKPSoWSKo6wsgPy5rgO&usg=AFQjCNHCZRRwbCBvYtLqy5XHRc29WmuaVw&sig2=X_JEHNHxOt-VobkI180YlQ
Roger Knights (21:22:01) :
Rhys Jaggar (09:37:11) :
What odds on neither the NE Passage NOR the NW passage being navigable this summer?
9 hours ago: “Beluga ships travel northeast passage”:
I think the odds are that both will be (WILL BE) navigable this summer. Thats because we still have about 20-25 days of ice melt left.
However to claim that the Beluga ships have already traversed the northeast passage is a little premature. They are on their way. There still seems to be a bit of ice around the Russian Ostrov Oktyabrskiy Revolyutsii, that might give them a bit of trouble.
Michael (13:09:01) :
On the El Nino scale, how does our current El Nino measure up?
As one of the forecasters that actually got the ENSO forecast right the last two years, I’ll take this one.
It is mild, and at the moment, in decline. To get El Nino conditions, you need SST anomalies of +0.5ºC or better. Right now we are between 0.5 and 1.0 in all four regions, and like I said, in decline.
Contrast this to 82-83 and 97-98 with SST index anomalies roughly in the +2.8º range. Most since then have been between +1 & +2ºC on the SST index.
NASA and NCEP, being who they are, are looking for a strong El Nino in the +2.4 and +2ºC range respectively. I’d bet one of my snowmobiles that they aren’t even close. Again.
More on topic, it is good to have SOHO back, even if there isn’t much to look at. Yet. Enter the Watts Effect in 3…2…1….
While the MDI’s are relatively blank, the EIT’s of SOHO are still giving much information.
Primarily the 171, 195 and 284.
The 284 is a smorgasbord of GCR strikes.
There’s nothing wrong with the Sun. It looks like a healthy orange to me.
Aren’t you happy it got rid of the acne spots?
Robert Wood (15:23:29) :
Be patient, Steve, teh thermal time constant of the ocean is massive, and I reckon they cool more slowly than they warm.
That’s all well and good but does anyone have an estimate of the time constant. Although it can depend on which sun/climate “correlations” you look at, the temperature response seems pretty immediate. In some cases it’s responded before the change in solar activity.
I’m also a bit concerned that the solar activity peak, i.e. the “grand maximum” peak, was in the early 1990s which was nearly 20 years ago. SC23 was a fairly average cycle in terms of SSN. The temperature dip in 2008 was claimed by many to be solar-related when it was, in fact, simply due to a long-overdue La Nina.
So what is the official solar/climate theory position?
I have a question for anyone. It seems that every year the “Global temperatures” peak in July and they are the minimum in January. July max is about 2.9 C warmer than Jan min.
http://discover.itsc.uah.edu/amsutemps/execute.csh?amsutemps
Now why should this be so? When it is summer in the northern hemisphere its winter in the Southern and vice versa. Why should temperatures vary in this way? Specially since aphelion also falls in July, if anything July should be colder
That link doesnt work. Use this:
http://discover.itsc.uah.edu/amsutemps/amsutemps.html
At the bottom left hand choose Near Surface Layer (CH4) and Celsius. Tick a few years and draw graph
Methinks it’s a function of thermometers…there’s more in the Northern Hemisphere. Yet another reason to treat global averages with
contempt…I mean suspicion. 🙂vukcevic (14:50:06) :
I would have to agree with (Clilverd et al 2006) projections for future solar activity since it is in a good agreement with my formula (Jan 2004)
http://xxx.lanl.gov/ftp/astro-ph/papers/0401/0401107.pdf
http://www.vukcevic.co.uk/combined.gif
but I am not certain that climatic downturn would be that severe.
I would suggest in addition to SSN and TSI numbers one might keep an eye on the Earth’s magnetic field as seen here:
http://www.vukcevic.talktalk.net/GeoMagField.gif
——
Good co-relationship (of the earth’s magnetic field with short term global average temperatures).
We still need to keep asking “Why”? however, and develop a relationship between short term magnetic field changes and recorded temperatutes.
If short term temperatures cycle at a 60-80 period, we need to be able to determine why the magnetic field changes at that periodicity.
Can geomagnetism better explain the long-term rise in temperatures from the mid-1750’s? So far – that long term cycle is totally unexplained.
What are the “historical proxies” for the earth’s magnetic field over the past 2000 years?
How do those proxies – if available, if ever developed! – track with the well known Roman Warming Period, Dark Ages, MWP, and LIA?
“Carsten Arnholm, Norway (14:23:50) :
Mr. Alex (11:22:03) :
There were 3 pores in Late July/Early August and although invisible to most (clean) telescopes, this ‘clearly indicates’ that SC 24 is now ramping up.
However, if we check Leifs graph we find that those pores were of SC23 magnetic signature. So I guess it means SC23 is ramping up again then :-)”
So true, I can’t believe I missed that!
Leif explains the reason for adding these to his graph on the SC24.com thread, I must read it again.
Solar Flux is at 66 today… not looking too strong if you ask me.
Richard (01:52:25) :
“I’m also a bit concerned that the solar activity peak, i.e. the “grand maximum” peak, was in the early 1990s which was nearly 20 years ago. SC23 was a fairly average cycle in terms of SSN. The temperature dip in 2008 was claimed by many to be solar-related when it was, in fact, simply due to a long-overdue La Nina.”
Cycles 21, and 22 were both short, solar cycle 23 is currently the longest in 200 years, this deep minimum only began in 2006/2007 so if there is any effect on climate it will only be seen in +- 7 or 8 years time. Not a guaranteed mini ice age, but the theories will be put to the test soon.
Landscheidt predicted a weak SC 24 before his death in 2004 and so far it is weak, but things may change so we must wait.
Richard (01:48:07) :
I have a question for anyone. It seems that every year the “Global temperatures” peak in July and they are the minimum in January. July max is about 2.9 C warmer than Jan min.
http://discover.itsc.uah.edu/amsutemps/execute.csh?amsutemps
Now why should this be so? When it is summer in the northern hemisphere its winter in the Southern and vice versa. Why should temperatures vary in this way? Specially since aphelion also falls in July, if anything July should be colder
More land mass in the NH. Temperatures are more extreme over land than over sea. So you get warmer summers and colder winters in the NH, causing the oscillation you see in the global average over the course of the year.
Re: SOHO Up and Running…
The ESA show quite a bit of sunspot activity for the month of August.
http://www.cfbw.com/sunspotcount.htm
The chart’s originator credits both ESA and NOAA for the data.
Where did they find them?
Richard (01:48:07) :
I have a question for anyone. It seems that every year the “Global temperatures” peak in July and they are the minimum in January. July max is about 2.9 C warmer than Jan min.
I wonder what the difference is during an ice age.
It appears that yesterday the Adjusted Solar Flux dropped to and maintained an almost 6 month low.
ftp://lynx.drao.nrc.ca/pub/solar/FLUX_DATA/fluxtablerolling.text
Aside from the implication that we may have just experienced a reversal in the polarity of the Watts Effects, I also think we are due for a Svalgaard Solar Diagnostic/Flux Update.
Just had this reply from someone, hidden behind a tree, in another blog.
It’s a cut cut&paste from my original which I can’t get to but basically I say;
“Co2 and how it absorbs IR and re-radiates”
Treeman’s reply is;
“Is this serious? CO2 absorbing IR? A gas absorbing IR? IR goes through my body, trees, concrete and some heavy metals and you expect us to believe that CO2 a gas absorbs it? This is a joke right? What kind of science is this? And exactly what happens during that activity and “re-radiation”? How does a gas radiate IR? Interesting science there professor.”
No wonder many Aussies are up for an ETS when they have no clue.
George Kominiak (06:09:43) :
Better question is: How did that graph wind up at Central Florida Bird Watchers?
ESA and NOAA ??
Perhaps they meant Eastern Swan Appreciators and National Osprey and Albatross Admirers, and ended up with somebody’s pore count.
Just The Facts (07:06:34) :
Sure enough, a 5-6 month Solar Flux Roll burn has been completed.
That’s only part of the reason. It’s also an artifact of where the thermometers are that are used to calculate the anomaly. For most of the time that records have been kept, only land temperatures were included, so the “over sea/over land” argument doesn’t hold much water.
If you divide the earth into 20° latitude bands pole to pole and compare the numbers of thermometers used to calculate the GISSTemp anomaly in the southern 60° and northern 60° by decade starting in the decade ending in 1939, this is what you get:
Decade Ending Southern 60° Northern 60°
1939 233 2895
1949 281 3336
1959 399 4746
1969 566 5737
1979 699 5818
1989 588 5194
1999 253 2469
2009 129 1597
One would expect a strong northern hemisphere bias in any global anomaly calculation. Note that the northern hemisphere thermometers generally represent over 90% of the measurements in every decade.
So while it may be true that temperature swings are larger over land than ocean and 2/3 of the world’s landmass is in the northern hemisphere, it’s also where 90% of the thermometers have been for most of the measured record.
For a far more detailed discussion of how thermometer locations may affect the anomaly, see E.M. Smith’s analysis:
http://chiefio.wordpress.com/2009/08/17/thermometer-years-by-latitude-warm-globe/
rbateman (08:08:29) :
“a 5-6 month Solar Flux Roll burn has been completed.”
Can you elaborate on that, i.e. what’s a “Roll burn”?
Would this indicate that the downtrend in F10.7 that began in April is likely to reverse itself, continue or neither?
http://www.leif.org/research/TSI-SORCE-2008-now.png
I wonder what the odds are for the next sunspots to be cycle 25 rather than cycle 24?
Just The Facts (08:46:23) :
The Roll Burn is nothing more than some humor injected into a dry subject.
The Flux began a roll upwards in late March/early April with a step up of 2 Flux Units, since then it leveled off and began a roll back down.
What does it indicate? It indicates it wasn’t the ramp angle.
If this is the 1st of those 4 rolls on the Way to the Dalton’s House of SC5, it is one of many.
If it is the prelude to another step up, then do your comparisons and make your educated guess.
Watts Up with What the Sun does next: Ramp, roll or step?
One can only hope we don’t have to wait another 5 months to get the answer, but that’s how this thing strings us along.
Maddening, isn’t it?
JLKrueger (03:35:22) :
Richard (01:48:07) : .. It seems that every year the “Global temperatures” peak in July and they are the minimum in January. July max is about 2.9 C warmer than Jan min. .. why should this be so?
“Methinks it’s a function of thermometers…there’s more in the Northern Hemisphere.”
No this is real. It comes from the satellite temperatures that cover the world evenly.
Its for every year and it follows a roughly sinusoidal curve, exactly out of phase with the TSI graph. TSI (The suns radiance) peaks in Jan and is minimum in July and the temperatures peak in July and are minimum in Jan. I find that rather strange.
Basil (05:38:25) :
More land mass in the NH. Temperatures are more extreme over land than over sea. So you get warmer summers and colder winters in the NH, causing the oscillation you see in the global average over the course of the year.
This is plausible. But this would also mean that the TSI, which fluctuates out of phase with the Global temperatures, either has an almost negligible effect on the temperatures, or that its effect is delayed for some reason by 6 months.
Peak TSI is 91 W/m^2 more in Jan than the minimum in July or about 6.9 % more, whereas peak temperatures are about 3 C more (re averaged over 6 years) in July than the minimum in Jan or about 21.5 % more if you take the absolute temperatures.
Dave (06:51:12) :
I wonder what the difference is during an ice age.
Well the difference should be less. Cooler summers means less winter ice melts. And looking at the curves I can see that the difference is not even over the years.
Maybe that will give a clue whether we are heading for. If the difference is less during one year maybe the next year will be cooler. I will investigate.
TSI (The suns radiance) peaks in Jan and is minimum in July and the temperatures peak in July and are minimum in Jan. I find that rather strange.
Not really. As was said perviously, there’s much more land mass in the NH, and Surface temps are a lot more volatile over land and respond to the seasons more. This overcomes the TSI factor (which may or may not be negligible).
When the equinox is the other way, the seasons are reversed. That cycle completes c. every 23,000 years.
I wonder what the difference is during an ice age.
My understanding is that mild winters and mild summers can lead to an ice age because the ice gets less chance to melt, thus increasing albedo. In the more extreme summers/winters, the ice has much more opportunity to melt.
That’s where Obliquity comes into the equation. Less extreme axial angle leads to less extreme seasons.
PS I asked Dr Roy Spencer about this (after all they are his graphs, produced by him that is) and Basil you are right.
Hi Richard: It’s because most of the land is in the Northern Hemisphere, and land reaches a higher temperature than ocean under the same amount of sunlight. -Roy
Only thing is the sunlight is not the same, it is less in July, but only by 6.9%. The difference between the heating of the land and the oceans however would be so great as to completely nullify that.
While NOAA’s “daily solar data” still shows no spots over the past 30 days, their monthly data for July now shows sunspot numbers of 8 on 7/23 and 7/30.
ftp://ftp.ngdc.noaa.gov/STP/SOLAR_DATA/SUNSPOT_NUMBERS/
NOAA’s monthly sunspot numbers seem to come from the SIDC. You can see the same numbers here:
http://sidc.oma.be/products/ri_hemispheric/
Based on this, even the NOAA data says that we’ve only seen 22 spotless days. Have I missed something?
Steve (12:14:23) :
Have I missed something?
Apparently you are not the only one who missed spots so faint, small and brief that most of the world never caught glimse #1.
I believe one was so bad that the institution that drew the spot couldn’t capture it on it’s imaging train.
It’s like this: spots that insignificant have as much impact on and relevance to levels of solar activity as a drop of gas in your empty fuel tank.
Neither one is going to get things moving.
If tomorrow the level of C02 rose by 1 ppm or the Sea Level by 0.1 mm, would you be impressed?
Of course, Al Gore would be stoked , but then there is only 1 Al Gore.
Is anyone impressed by a sunspot of 2 x 10E-6 area, and the contrast of an erased pencil dot on a piece of off-white paper in a stack of 42 pages?
“Lookouts, is the enemy still closing on us?”
‘Captain, there’s an ice cube in the water dead ahead 1000 meters.’
“Sound collision, right full rudder, all ahead flank, brace for impact !!!
Prepare the life-boats, all hands, abandon ship.”
rbateman (09:29:41) :
“Maddening, isn’t it?”
I am ok with the solar uncertainty, what drives me crazy is that humans are aggressively and exclusively preparing for catastrophic CO2 driven global warming, when it is as reasonable a possibility that we will experience catastrophic Solar/Volcanic driven global cooling. Historians may look back at this as one of the dumbest periods in human history…
Mid-range and maybe faltering. Indicators are patchy, but a continued El Nino is projected.
http://www.bom.gov.au/climate/enso/
Richard (11:05:32) :
Hi Richard: It’s because most of the land is in the Northern Hemisphere, and land reaches a higher temperature than ocean under the same amount of sunlight. -Roy
I finally managed to crack it using insolation and the specific heat of water 1 and land 0.2
The July insolation at 60 N Lat x land area NH + The July insolation at 60 N Lat x water area NH/5 + The July insolation at 60 S Lat x land area SH + The July insolation at 60 S Lat x water area SH/5
and the same for Jan
Global July Insolation = 302.82
Global Jan Insolation = 248.45
% age difference Insolation = 21.88
% age difference in Global Temperatures = 21.55
Take home message insolation is pretty much all that matters.
Just The Facts (20:25:47) :
They aren’t even preparing for what they preach. Assured failure..
Adam Grey (20:44:49) :
A projected El Nino Minimum.
Monkey see, monkey do.
Richard (20:54:22) :
Global July Insolation = 302.82
Global Jan Insolation = 248.45
% age difference Insolation = 21.88
% age difference in Global Temperatures = 21.55
Those insolation figures look a bit high. Isn’t average insolation ~240 w/m2. Have you taken albedo into account. It probably doesn’t make much difference to the %age figures, though.
Steve M. 18:29:30 on 8/21
Thanks for the update. More popcorn. And more cowbell!
=====================================
Dr David Jones of Ferny Creek (14:33:38) :
“Anthony about time you came clean and admitted you have got climate change wrong.
The oceans are running warmest on record for summer, sea level is running at record highs for this time of year (not hiding behind a seasonal cycle), the satellite data would have been hottest were not for a large “correction” and this is all happening with a cold cold sun.
It’s got so warm out there even the “sceptics” are having trouble finding cold weather to talk about.
REPLY: Hah, doc, you make this too easy. Someday I’ll visit BoM and tell you all about it. I do find your demands amusing though, especially since it all turned on one month with the El Nino going from zero anomaly in UAH LT. Tell me, does climate happen in 1 month? 😉
Here’s a few to talk about at the water cooler at BoM.
http://latimesblogs.latimes.com/lanow/2009/08/las-cold-summer-continues-lancaster-posts-a-record-low-temperature.html
http://newsminer.com/news/2009/aug/21/fairbanks-flirts-frost-early-cold-weather-arrives/
http://www.nzherald.co.nz/business/news/article.cfm?c_id=3&objectid=10590529
I’m still pretty comfortable with my position. Time is on our side. Rant all you like. – Anthony”
Yes, Dr. Jones, you just confirmed the warmists attitude in regard to weather versus climate.
If the world is cooling for several years on a role, you call it “weather”.
If the world is warming for a single month, you call it “climate”.
Even stipulating that temperatures of all stripe warm slowly (at the 20th century rate), we would be continually setting new (instrumental) records, but there would be no emergency at all.
If, on the other hand, the short-term temperature trend suddenly reverses and increases at five times the rate of the past century, we would have the IPCC mainstream scenario of +3.5C, we would have cause for concern.
It’s all in the “degree”.
John Finn (03:32:23) :
Richard (20:54:22) :
Those insolation figures look a bit high. Isn’t average insolation ~240 w/m2. Have you taken albedo into account. It probably doesn’t make much difference to the %age figures, though.
Yes they probably are as that would reduce it. I took nothing into account except the TSI in Jan 3 and July 5 (roughly perihelion and aphelion), assumed other things equal and so would cancel out. I also calculated for just one latitude 60 N and S, again assuming that it would be matched for others (I did check with 50 and it matched). The agreement with the temperatures in Jan and July shows I probably was not very wrong.
Ron de Haan (06:16:39) :
Dr David Jones of Ferny Creek (14:33:38) :
“Anthony about time you came clean and admitted you have got climate change wrong.
The oceans are running warmest on record for summer, sea level is running at record highs for this time of year (not hiding behind a seasonal cycle), the satellite data would have been hottest were not for a large “correction” and this is all happening with a cold cold sun.
It’s got so warm out there even the “sceptics” are having trouble finding cold weather to talk about.”
Where the devil is Ferny Creek? And it aint a “cold cold sun”. The TSI which I am now tracking is about the same. What subjectively I know is that Solar wind is probably less (I dont know how to get the data or make sense of it), but effects of this are indirect and may not be immediate. We are still well within the range of natural variability, so relax.
Veggies have gone up in price. The NZ Herald business section article shows its better to be warm than cold.
I just looked up Ferny Creek, Victoria are you a b.. aussie mate? The temperature there today is 9 max and 3 min, colder than where I am in NZ, you shouldnt have any trouble finding cold weather to talk about.
Look at the BOM forecast for the next few days around Ferny Creek
Forecast for Tuesday
Cloudy. Scattered showers falling as snow above 900 m. The chance of thunderstorms with hail from the morning. Winds west to northwesterly averaging 45 to 55 km/h becoming northwesterly 45 to 60 km/h by early evening. Overnight temperatures falling to around 6 with daytime temperatures reaching between 8 and 13.
http://www.bom.gov.au/products/IDV17102.shtml
Guess that must be weather cause its COLD
The TSI is misleading.
Who needs a spectrum anyways?
Why bother imaging things with filters when we could just capture all the light in one short exposure without them?
So, if the NUV is up 20% but the FUV is down 20% it makes no difference, right?
So, if it’s 120 degrees all summer in the North and 0 degrees all winter in the South, we should consider that the same thing as 70 degrees all summer in the North and 50 degrees all winter in the South.
Right ?
It’s all about the average.
That’s why the TSI is misleading. It’s nothing more than a Solar Average.
It tells you nothing about the changes under the hood.
Besides, it’s been trashed so badly the remains are unidentifiable.
Bury it in the tomb of the Unknown Statistic.
Since insolation so accurately tracked the average satellite temperatures – made a little formula – playing around with insolation. Assuming clear skies (or the same skies) between years.
Comparing 2008 with 2009 – Insolation on June 19, 20, 21, 22 exactly the same for both years. 20 and 21 the same for both days, falls off on either side.
Insolation for June 2008 and 2009 practically the same.
On July 5th however, Aphelion, there is a discrepancy. Insolation more in 2009
Insolation for July more for 2009 than 2008, August more for 2009 and more of a difference than July, September more for 2009 marginally more than August, October more for 2009 same difference as Sept, (if this is true so far warmers should have a field day), Nov more for 09 but difference comes down to less than half of Sept, Dec a little less for 09, Jan 2010 more than Jan 2008 and biggest difference so far.
Here’s what I get for the coming years (assuming more insolation warmer less cooler)
2009 – warmer than 2008 a little less than 2007
2010 – warmer than 2009
2011 – a little warmer than 2010
2012 – much cooler than 2010 – the same or a little cooler than 2008
2013 – warmer than 2012, the same or a little less than 2009
2014 – warmer than 2013 a little less than 2010
2015 – as warm as 2011
2016 – cooler than 2012
2017 – a little warmer than 2008
Caveat – the difference in average insolations is not very large (euphemism for quite small) – could be swamped by other things – solar wind, el nino, nina, CO2, methane, Al Gore … I’m keeping an open mind. So dont hold your breath. Lets see how the coming months pan out.
I have put some figures on these predictions, (based on the insolation of previous years from 2002).
Global Anomalies (as per UAH) from 2002 to 2017 : 0.25, 0.21, 0.13, 0.27, 0.2, 0.22, -0.02, 0.2, 0.24, 0.27, -0.03, 0.2, 0.24, 0.27, -0.04, 0
If you plot the trendline for those figures its negative. If this prediction comes true what would be the significance?
NOAA has made the job of disproving the Anthropogenic Global Warming (AGW) hypothesis, through the temperature records, easier (maybe thats why they are being fiddled).
They ran 10 simulations spanning a period of 700 years and found 17 non-overlapping decades “with trends in ENSO-adjusted global mean temperature within the uncertainty range of the observed 1999–2008 trend (−0.05° to 0.05°C decade–1)”.
According to them “The simulations rule out (at the 95% level) zero trends for intervals of 15 yr or more, suggesting that an observed absence of warming of this duration is needed to create a discrepancy with the expected present-day warming rate.”
Their models never ever came up with 15 consecutive years where the trend was level or decreasing. If that happens, then AGW we have a problem.
http://www.ncdc.noaa.gov/oa/climate/research/2008/ann/bams/full-report.pdf
I’m curious about something. I consistently read about the current streak of spotless days being the latest since August last year. Yet, I never read about the 44 day streak starting 03/09/2009 – to – 04/20/08 (according to NOAA DSD).
http://www.swpc.noaa.gov/ftpdir/indices/old_indices/2009Q1_DSD.txt
http://www.swpc.noaa.gov/ftpdir/indices/old_indices/2009Q2_DSD.txt
Am I missing something?
HI-Z (10:42:39) :
I’m curious about something. I consistently read about the current streak of spotless days being the latest since August last year. Yet, I never read about the 44 day streak starting 03/09/2009 – to – 04/20/08 (according to NOAA DSD).
http://www.swpc.noaa.gov/ftpdir/indices/old_indices/2009Q1_DSD.txt
http://www.swpc.noaa.gov/ftpdir/indices/old_indices/2009Q2_DSD.txt
Am I missing something?
~~~~~~~~~~~~~~~~~~~~~~~~~~~~~~~~~~~~~~~~~
The one that always catches my eye though is that 52-day spotless stretch last year from 2008/07/21 through 2008/09/10. If this is exceeded in 2009, it will be a portentous event, IMHO.
http://www2.nict.go.jp/y/y223/sept/swcenter/sunspot.html
HI-Z (10:42:39) :
The early March – late April 2009 spotless streak is broken academically by, once again, very weak and/or fleeting and/or pores. Amounts that don’t amount to a pail of oil in a ship’s bunker.
Think about it.
You still had something like 43.97 spotless days.
rbateman (15:30:35) :
HI-Z (10:42:39) :
The early March – late April 2009 spotless streak is broken academically by, once again, very weak and/or fleeting and/or pores. Amounts that don’t amount to a pail of oil in a ship’s bunker.
Think about it.
You still had something like 43.97 spotless days.
—————————————–
I understand there was a speck but what is unclear is the NOA DSD for that period doesn’t show a spot count for that day.
Sorry, NOAA DSD (links to DSD in first post)
The DSD doesn’t show the speck because most of the world saw nada.
Imagine how upset you’d be if you bought a burger with a crumb of beef in it.
SWPC/NOAA is right not to Hans & Franz the DSD.
( I sure wish there were a preview . I’m assuming most HTML works .
Richard , I’m very impressed by your work .
What are the most
useful data sources ? Are the details of your computations available
somewhere ? It’s not clear to me what specific heat rather than
absorptivity/emissivity has to do with mean , as opposed to variance of
the sphere .
Ultimately our observed average temperature must be quantifiably
derivable from the sun’s . Certainly unraveling the confounding of the
peri/ap-helion difference in TSI with difference in color , or even
just averaged grayvalue ( I avoid the use of albedo
because it is (1 – ) the relevant term and all too
commonly dissociated from emissivity )
, between the hemispheres is one of the first
tasks .
Given what my small vocabulary of functions so far are oriented to do ,
to
get a feel for how much of a change in
grayValue I’ve calculated what the difference in
grayValue would have to be between the day and night sides
cancel the peri/ap-helion difference .
Here’s the baseline computation for average distance :
  SAd..h />/ "Solid angle of disk of radius ( RD 0 ) at

distance RD 1 "

 : SAsun : SAd Sun `r `Dist  / />/

6.8001334e-005

 : SfeerPart : ( ( ( :: ; pi2 - ) .\: SAsun ) , pi2 ) % pi4 /

/>/ 5.41137e-006 0.499994 0.5

/ Portions of the "celestial sphere" subtended by the sun , the rest of

the day side , and the night side .

/ AE is the grayValue and Tcs the temperatures for each of the

partitions .
Tdif..h : "Difference in power
between a scalar point temperature and a surrounding temperature
distribution"
 AE : 1 1

1

;  Tcs : 5778 3 3.0     ;

?[ Tdif ; 0.0 ; 300.

]

/ />/ 278.67912

/ Call it , 278.68 given the lack of precision in the temperatures

.
/ It is instructive to show that a uniform
change in grayValue makes no
difference :
 AE : 1 1 1 * .7 ;  Tcs : 5778 3

3.0     ; ?[ Tdif ; 0.0 ; 300.

]

/ />/ 278.67912
Here are the calcs for the orbital extremes :
 : SAsun : SAd' 2 2 # Sun `r `perihelion `r

`aphelion

/>/ 7.0332229e-005 6.578442e-005

 : SfeerPart : ( ( ( :: ; pi2 - ) .\: SAsun 0 ) , pi2 ) % pi4

/>/ 5.5968609e-006 0.4999944 0.5

 AE : 1 1 1

;  Tcs : 5778 3 3.0     ;

?[ Tdif ; 0.0 ; 300.

]

/ />/ 281.03711

 : SfeerPart : ( ( ( :: ; pi2 - ) .\: SAsun 1 ) , pi2 ) % pi4

/>/ 5.2349578e-006 0.49999477 0.5

 AE : 1 1 1

;  Tcs : 5778 3 3.0     ;

?[ Tdif ; 0.0 ; 300.

]

/ />/ 276.37951

 % %/ 276.37951 281.03711 />/ 1.0168522

 r ^ 4 />/ 1.069132
Now solve for a grayValue deviation between light and dark side :
 { AE :: .7 + x , x , - x  ;

Tcs :: 5778 3 3.0  ;  278.68 - ?[ Tdif ; 0.0

; 300. ] } ? 0 />/ 0.023598908

 { AE :: .7 + x , x , - x ; Tcs :: 5778 3

3.0     ; 278.68 - ?[ Tdif ; 0.0 ;

300. ] } ? 0 />/ -0.023190297
So a difference in AE
from day side to night side of somewhat less than 5% would balance the
current orbital eccentricity .
After I get full spectrum implemented , I’ll have to tackle the
spherical geometry more completely . But I really have other interests
, and hopefully this global government Lysenko scam will be
defeated before I get to it .