By Joseph D’Aleo ICECAP
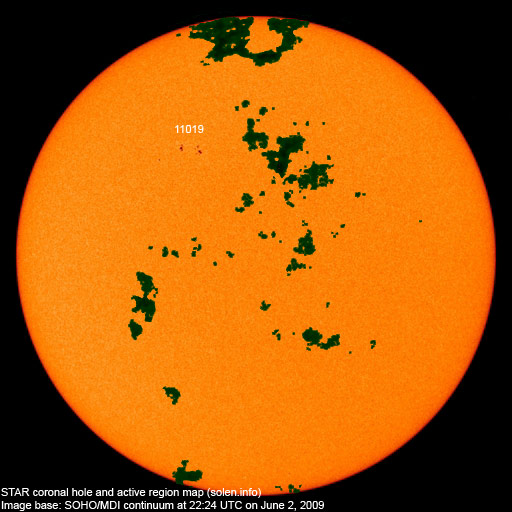
The sun has become more active in recent days with cycle 24 spots in middle latitudes. See sunspot group number 11019 for group of red spots. This is slightly diminished since yesterday. The dark green areas are coronal holes out of which the solar wind escapes at higher velocity.

See larger image here.
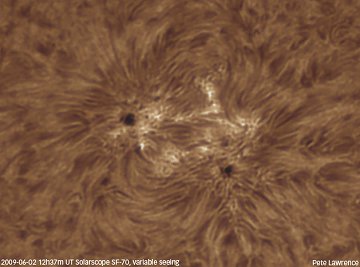
Peter Lawrence has a close up view of that sunspot posted on spaceweather.com.

See larger image here.
There is a loop of the sunspots develop and rotate around the solar disk the last few days here.
This activity came late enough in the month of May, to keep the monthly number for May below the value of 14 months ago of 3.2 which it is replacing in the 13 month running mean. That means the solar cycle minimum can’t be earlier than November 2008, making it at least a 12.5 year long cycle 23.
The value needs to fall below 3.4 in June to move the minimum to December. That is still possible if the sunspot group continues to decay as most have done as they crossed the disk in recent months. If it stays below that value, we will likely see the solar minimum in December, 2008 as 14 months before that the sun was very quiet with just a sunspot number of 0.5. If not, the minimum will be November. It is my guess that November will win the prize.
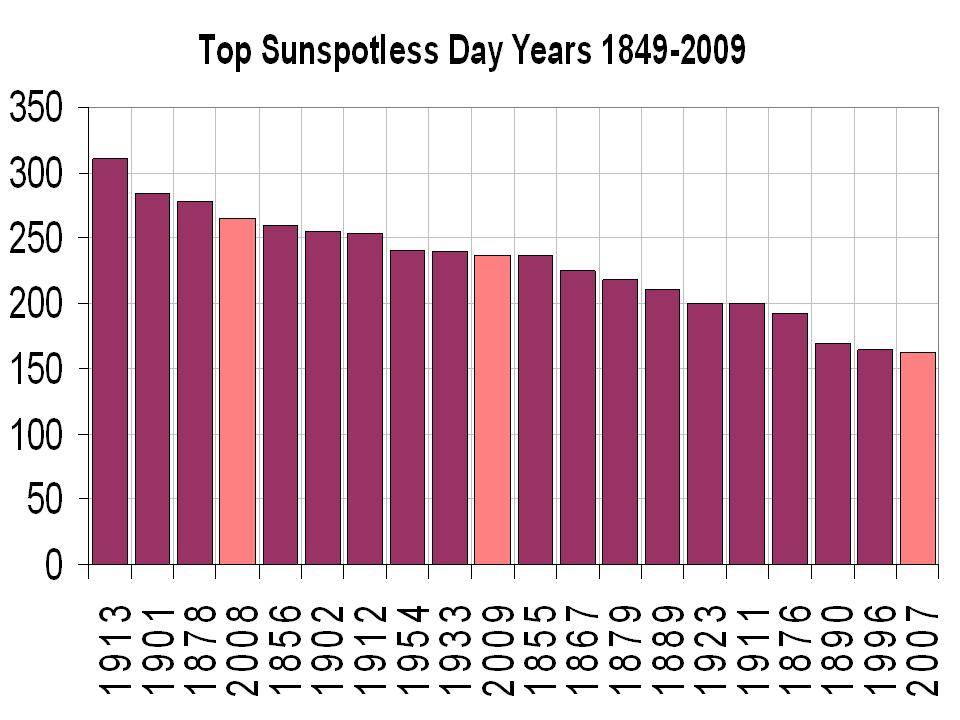
We added 22 more sunspotless days to the total for this cycle transition which as of June 1 had now reached an amazing 614 days. We are likely to add additional days and add 2009 to 2007 and 2008 as recent years in the top ten since 1900. Only the early 1900s had a similar 3 year stretch of high sunspot days (1911, 1912, and 1913).

See larger image here.
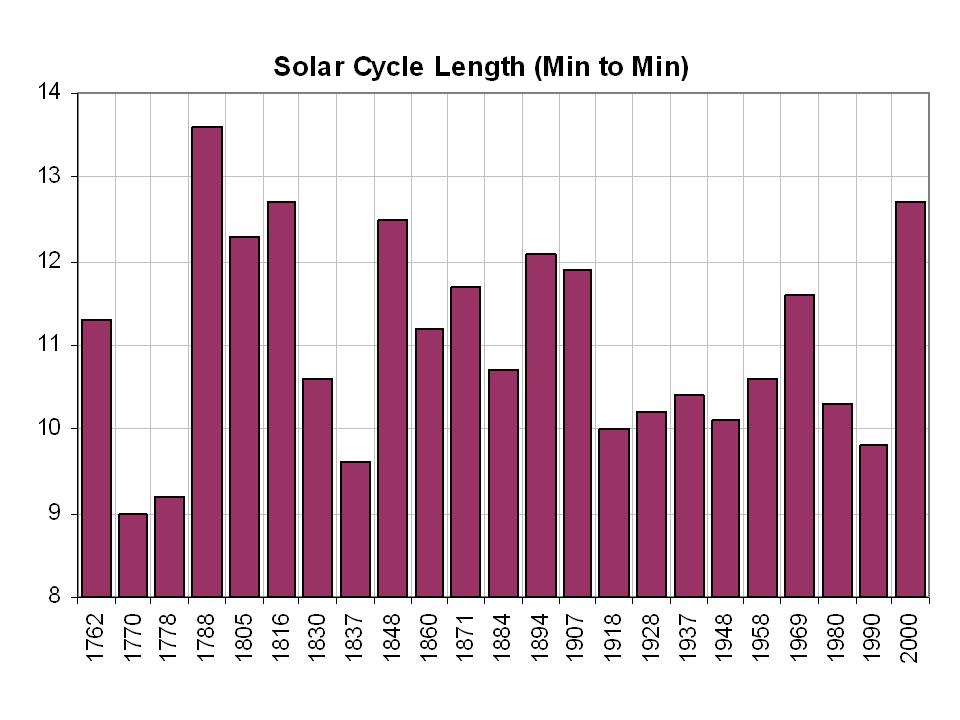
It also marks the longest cycle in 150 years, tying the one that peaked in 1848. You have to go back to the Dalton minimum in 1816 to find a longer cycle 12.7 years.

See larger image here.
You can see by the 12th year in 3 of the 5 most recent cycles, the sun had rebounded significantly by years 12 and 13.

See larger image here.NOTE: Updated per discussion in comments – Anthony
See what some scientists believe this means about the decades ahead here.
Apparently it helps to start cycle 23 a year earlier to make it look longer than it really is:
http://icecap.us/images/uploads/Cycles19-23.jpg
One would think it better to place the minimum value reached just before cycle 23 at zero as you did for the other cycles, rather than at one to artificially increase the length of SC23…
Hopefully this will mean that radio propagation will begin to improve. It has been a very long minimum.
So solar minimum isn’t even here yet!?
What implications may have on global temps.? wxmaps.org show some well below average spots in various locations around the world (balanced by above normal spots), old man Winter is roaring into New Zealand, temps. here are forecast to bounce from the 70’s to the 90’s to the 70’s to the 80’s in a near-rollercoaster fashion, the UAH daily temps. site is showing a rather sizable interruption in stratospheric cooling (at 118,000 ft.) which is ‘supposed’ to happen during CO2 driven warming ect…
Look’s like more confirmation of the “Watts Effect”. Things started to perk up right after your “Baby Grand” post.
There being many measures of what constitutes solar minimum, a lot is now riding on this month, and the way in which spots are counted.
Even if Nov 2008 is the minimum (or other dates) the time spent in the deep lull will also take it’s toll on the present cycle, if the history of Solar Cycles is a good guide.
Those predictors who are still standing (Lief being one of the few) have a low to very low maximum indicated. That should mean a much more gradual slope out of minimum (as in SC5 & 6).
But, caveat emptor, all of this can turn on a dime.
So far, I have only gotten one day in on 11019, but it was very distinct & pronounced in contrast to the meager spots of the last 1.25 years.
“Needless to say much will be learned the next 5 years. . .”
And I’m not so old that I don’t expect to be around to learn it. Cool stuff!
The last chart of the original could use labels for the colored lines. Maybe instead of black/bold at the top Hadley and UAH could match the colors of the lines. Then write out the meaning of these labels for those who might stumble on this and have no idea what is being presented. Easy for me to say, I know. Sorry to sound critical when the material is so interesting.
New Zealand has just gone through the coldest May on record (note: some records only start in the early 1930’s). 2.5 degrees C below average. We haven’t had snow here at my location (Palmerston North) since 1975 and 1977 during the 70’s cold period, but if this keeps up I can see it happening this coming southern winter.
In an average May the mountain ranges to our south and NE might expect one dumping of snow based on my records for the past 28 years. This year we have had 9 mountain snowfalls. The last really cold May was in 1992 and that was rightly blamed on Mt Pinatubo. Aparently the scientists are perplexed as to what could be causing this current cold situation. They wouldn’t be so perplexed if they pulled their heads out of the sand, or some other equally dark space.
Can’t slide anything past Leif.
John F. Hultquist (17:58:16) : “Needless to say much will be learned the next 5 years. . .”
Yes, but it won’t be reported in the MSM.
Adam from Kansas (17:47:15) :
What implications may have on global temps.? wxmaps.org show some well below average spots in various locations around the world (balanced by above normal spots), old man Winter is roaring into New Zealand, temps. here are forecast to bounce from the 70’s to the 90’s to the 70’s to the 80’s in a near-rollercoaster fashion, the UAH daily temps. site is showing a rather sizable interruption in stratospheric cooling (at 118,000 ft.) which is ’supposed’ to happen during CO2 driven warming ect…
Hi Adam… The problem is that the stratospheric cooling at 36 kilometer of height is wrongly attributed to increases of the concentration of CO2 at the lower troposphere (it’s a lie derived from models). There are many factors which contribute to the cooling of the stratosphere, but the CO2, a decrease of thermosphere temperature, for example, by a lesser energetic solar particles hitting on it which leads to a lower conductive heat transfer, by fluctuations of its content of oxygen, and by a decrease of chemical reactions which would drive the chemical heating due to changes in UV radiation incoming from the Sun, etc.
“” Ian Cooper (18:27:12) :
New Zealand has just gone through the coldest May on record (note: some records only start in the early 1930’s). 2.5 degrees C below average. We haven’t had snow here at my location (Palmerston North) since 1975 and 1977 during the 70’s cold period, “”
There hasn’t been snow on Thanksgiving in my home town in Michigan, a Northern USA State, since the 70’s. There was snow for Thanksgiving the last 2 years.
Just Want Results… (19:44:53) :
I should have said for the international readers, Thanksgiving is a holiday at the end of November, just before winter starts.
So does this mean temperatures will pick up just as global warming legislation hits the floor in Congress?
Leif Svalgaard (17:35:47) :
Apparently it helps to start cycle 23 a year earlier to make it look longer than it really is:
Good catch. I also want to know why the graph of cycle 23 in the last chart in D’Aleo’s article above is so much different than in his previous (2008) version of the same chart:
http://icecap.us/images/uploads/solarcyclestory.pdf
The older chart I’m talking about is on page 3 of that article.
anyone notice the new RSS data is out? with the exception of may of 2008, it was the coldest may anomaly since 1997, and (cherry picking here) slightly cooler tahn the temperature of May of 1980.
“So does this mean temperatures will pick up just as global warming legislation hits the floor in Congress?”
Of Course! It’s called the beginning of Summer!
MikeN (20:05:37) :
“So does this mean temperatures will pick up just as global warming legislation hits the floor in Congress?”
It has been determined (by whom I don’t know) that Summer solstice will occur on June 21, 2009 at 1:45 A.M. EDT. I’ll bet on hot and muggy in Foggy Bottom and the rest of the D.C. area.
And… Forecasters said that today and the remainder days of this week up to Thursday of the next week the weather would be hot, dry and cloudless days… Suddenly, appearing from the Mexican Gulf, a dense army of cumulonimbus covered the night sky of Monterrey and a thunderstorm whipped out my internet by cable… Now, I’m working through my ADSL connection. Coincidentally, the group of bipolar sunspots (beta) started disappearing from humans’ sight. Anyway, forcasters failed from morning to evening.
so leif, are you saying we are only at 11.5 years? i am confused…i thought otherwise. would you mind clarifying?
Never mind my previous posts; the old and new graphs of graphs of cycle 23 are not much different after all. The one above is simply shifted forward a year as Leif noted.
Solar Cycle 24 maybe upon us, but its latest entrant sunspot group is fading rapidly – will be gone within 24 hours.
yeah…we really won’t know until we get some consistency right?
ladise and gentlemen corrected Arctic sea ice is now 100% normal Mayday!
http://arctic-roos.org/observations/satellite-data/sea-ice/observation_images/ssmi1_ice_area.png
keep for posterity someone
Kabul, Afghanistan in the meantime had the coolest and wettest May in over 30 years. Huge roses in my yard.
Forecasts for the wheat crop are the highest in 32 years, very near to wheat self-sufficiency for Afghanistan.
We only hit 32°C one day so far with the forecast showing temps staying below 30°C for the next ten days. We still have snow at the 11,000 foot line. (It was all gone this time last year.) We thought last summer was cool when we only hit 37.8°C one day all summer on 31 July, but this one is shaping up to be even cooler. The locals, while enjoying the pleasant weather right now, are concerned about what the coming winter may portend.
It’s only weather, but…
markinaustin (21:32:47) :
so leif, are you saying we are only at 11.5 years? i am confused…i thought otherwise. would you mind clarifying?
It is not my graph. Ask Joe. He should correct the graph.
And another week of thunderstorms is in the forecast for No. California. Rained 2″ last night. Weather forecasters are scratching thier heads once again, as what was supposed to be 2 day of thunderstorms now runs into next week. Stuck weather patterns. At least it isn’t those darned winds.
Big thunder.
Cold in New Zealand, in Northern states, hot in Europe, California, most of the pacific ocean and the Antarctic. Check out this great site
http://www.climat-evolution.com/article-32112504.html
which, though in French, gives pretty good global temperature anomaly maps. Helps seeing the big picture.
John F. Hultquist (21:31:58) :
No problem, they’ll have Gore in there and the weather will go into an epileptic fit. It doesn’t like him or Hansen. It will be nature’s final warning to Congress.
Think they will get the hint?
multiple , heliocentric , planetary angular separation + ser-x cross positioning are the key elements to solar activity / atmospheric / seismic /Geo-phenomena,
angles are those equally dividable into the 360 deg circle , ser-x ( solar electromagnetic resonent cross ) positions are :-
( September 21 equinox ) = 75 – 165 – 255 – 345 degrees .
Flanagan (22:48:20) : “Cold in New Zealand, in Northern states, hot in Europe, California, the Antarctic…”
Flanalgan, hot in Antarctic? You are make joke. I laugh, ha-ha, at your funny joke. Here in south California, we have turned on furnace again all week. Thunderstorm, rain, cold, overcast, one of coldest Junes I remember. You think I follow your link? Think again.
Looking at the latest solar image, I don’t see a heck of a lot going on.
The first picture is icecap.us/images/uploads/SUN050603.jpg It shows a very active period of the sun, not the recent state of the sun. Why that?
So its official, SC23 minimum has gone way past Aug 2008?
Flanagan,
This French site claims that the temp anomaly for May is 0.52°C, making the annual 2009 anomaly thus far 0.42°C.
I don’t really know why the poles have been coloured such a deep red.
Leif Svalgaard (17:35:47) :
“Apparently it helps to start cycle 23 a year earlier to make it look longer than it really is:
http://icecap.us/images/uploads/Cycles19-23.jpg
One would think it better to place the minimum value reached just before cycle 23 at zero as you did for the other cycles, rather than at one to artificially increase the length of SC23…”
I don’t follow. SC 23 started in May 1996, and that is how it is graphed. Dropping to 0 sunspots after official start doesn’t change that.
The first sunspot of the cycle sometime back in a January somewhere in time was hailed as the start of what was to be one of the most active solar cycles. Since that time every tiny tiny dot has been hailed as the start of an upswing in said cycle. No offence folks but isnt active sunspot activity supposed to occur on both the northern and southern hemisphere of said sun?
It is a nice sunspot though.. one of the first ones i could see without having to clean my monitor but Im not holding my breath until I see more action then a small string of sunspots on one hemisphere of the sun:)
“We added 22 more sunspotless days to the total for this cycle transition which as of June 1 had now reached an amazing 614 days. We are likely to add additional days and add 2009 to 2007 and 2008 as recent years in the top ten since 1900. Only the early 1900s had a similar 3 year stretch of high sunspot days (1911, 1912, and 1913).”
Based on the published data of SIDC Belgium, I count as of Juni 1 a total of 630 spotless days (2004 3; 2005 13; 2006 65; 2007 163; 2008 265, 2009 121(May inclusive) for this cycle transition.
The provisional sunspot number for May was 2.9. The smoothed sunspot number for November was 1.8. We have to go back to September 1913 to find a lower one (1.6 according to the data of SIDC).
The year 1913 is well-known because of the long series of 311 spotless days. The cycle transition between SC14 and 15 counted 1019 spotless days! But Rmax (smoothed) of SC 15 was still 105.4 (SIDC).
vg (22:10:53) :
ladise and gentlemen corrected Arctic sea ice is now 100% normal Mayday!
http://arctic-roos.org/observations/satellite-data/sea-ice/observation_images/ssmi1_ice_area.png
keep for posterity someone
The recently renewed NSIDC graphs show a very rapid drop off in May down almost to 2007 figures.
Any explanation between the two data sources?
So SC24 has kicked off at last. I was half hoping for a record minimum just to naff off the warmists. Oh well…
😀
vg (22:10:53) :
ladise and gentlemen corrected Arctic sea ice is now 100% normal Mayday!
http://arctic-roos.org/observations/satellite-data/sea-ice/observation_images/ssmi1_ice_area.png
keep for posterity someone
Smallz79
Why are there red dots and what looks like red slashes or something in only the 2009 line?
Flanagan (22:48:20) :
Cold in New Zealand, in Northern states, hot in Europe, California, most of the pacific ocean and the Antarctic. Check out this great site
http://www.climat-evolution.com/article-32112504.html
which, though in French, gives pretty good global temperature anomaly maps. Helps seeing the big picture.
Shame that it is comparing the anomaly to much colder years of 1968 to 1996. Not really the big picture I was expecting Flanagan.
Here in christchurch new zealand NIWA are saying we had the 3rd coldest may on record at 6.9c . NIWA says on one of their pages that the 1971-2000 avg for may is 9.6c .But in their may summary they say its is 8.9c. i think they drop their 1971-2000 avg to make it look warmer than it real is .
Rhys, smallz79
Would not have a clue why. However notice how most of the second half of 2008 was normal as well! If I recall they had done a correction to the original trend at the time and a post was put up here WUWT. Maybe it was in fact correct. However, i would guess that it will be all changed in the coming days to fit in with the AGW so don’t get too excited
Flanagan is just a AGW hooligan (just joking)
Are the spots from May and June still following L&P’s trend?
Paul S (02:31:34) :
Shame that it is comparing the anomaly to much colder years of 1968 to 1996. Not really the big picture I was expecting Flanagan.
That’s the nature of global warming. You have to compare it to colder periods because there aren’t any warmer periods. What period do you suggest?
Hi all,
My spreadsheet indicates that cycle 23 was 147 months (12.25 years). This is calculated using the 13 month smoothed International Sunspot Number. Cycles 4, 6, 9 and 13 were longer. So, this is the longest cycle in over a century, but certainly not unprecendented. This assumes that Cycle 23 ends in October 2008 and cycle 24 begins in November 2008. I began Cycle 23 in August 96 as July 96 had a 13 month smoothed ISN of 8.4 and August 96 had a 13 month smoothed ISN of 8.1. This was the low, it recovered from there and did not look back.
I’d certainly appreciate any comments Leif might have, I believe my data is correct. Thanks to all for all of the thought provoking content.
Paul
the dashed red line in the Norsex charts was a failure of the sensors to read a vast area of ice for one day.
http://arctic-roos.org/observations/satellite-data/sea-ice/ice-area-and-extent-in-arctic
If the SC23-SC24 minimum falls in November 2008 and the NGDC places the SC22-SC23 minimum in May 1996…That makes it a 12.5 year-long cycle…The longest cycle since 1843…National Geophysical Data Center: MINIMA AND MAXIMA OF SUNSPOT NUMBER CYCLES
I realize that you are not a “consensus” person and you tend to look at things differently than many other solar physicists…A very good scientific trait in my opinion. You seem to think that the NGDC numbers are very wrong. Can you explain why you think “the consensus minimum determined by an international group of solar physicists” and Joe D’Aleo are wrong? (Hopefully in terms understandable to someone whose last physics and astronomy classes were in the Late Pleistocene.)
Btw…The NGDC cycle length numbers are the ones that I have been using for my Temp vs. Cycle Length comparisons.
Paul S:
“Shame that it is comparing the anomaly to much colder years of 1968 to 1996. Not really the big picture I was expecting Flanagan.”
Well, what were you expecting? This is Flanagan we are talking about! Not much to expect, just plenty of cherrypicking and ignoring of facts… just ask Denny et al at globalwarminghoax.com what they have to deal with!
Solar cycle 24 may well have started as some have said due to the arrival of this true sunspot but a while back I stubled upon this: http://www.solen.info/solar/cycl5.html
Notice that solar cycle 5, one of the Dalton Minimum cycles, began in May 1798 with a smoothed sunspot number of 3.2 and appeared to be rising nicely until May 1799 and then sunspot activity suddenly dropped and stayed quiet until after May 1800. Only when the smoothed sunspot number reached +-12 did the cycle creep up to solar max.
So we might, (big might), be having another scenario (such as in November 2008); a false alarm. The southern hemisphere has been dead compared to the northern hemisphere, so perhaps we should wait until BOTH hemispheres are cracking with more than one sunspot region each. Keep the shampagne in the fridge until the smoothed number is +- 10 and rising!
To those “confused” by Leif’s remark, he’s just pointing out that the graph doesn’t look right. The others, who have called attention to SC23 being 12+ years, based on a starting date sometime in 1996, are correct. If the last minimum was May 1996, and the current minimum is November 2008 as Joe has reasoned, then that is right at 12.5 years. But as some have said, there are questions about the “best” date of the last minimum.
We’re quibbling over details here. However you slice them, most recent cycles have been closer to 10 years in length, so SC23 was a break from the recent pattern.
It’s becoming ever more obvious that though the dynamo itself continues with regularity and with nearly even strength the phenomena of sunspots can vary dramatically and perhaps even unpredictably. I’m reminded of a Van de Graf generator where the manifestation of the spark can dance all over the surface even though the ‘dynamo’ of voltage difference remains about the same. Can the Iron Butterfly Wing of the half centimeter solar tidal movement be moving enough mass or somehow directing the manifestation of the sunspots on the surface of the sun? And then, even if it does, how does that change earthly climate. Well, if it’s not just TSI, but also UV, geomagnetism near the poles and ozone, too, besides the clouds then we may have enough mechanisms with natural feedbacks to the center to explain the absence of ‘tipping points’ or runaways to endless heat or cold.
===================================
With apologies to the shade of W.B. Yeats
The Second Coming (of the Dalton Minimum)
Straining and twisting on the solar disc
The sunspots do not heed the physicist;
Predictions fail, fond theories of the age
Fall by the wayside like some spotless plage
That rotates, impotent, out of our view
While Cycle 24 ‘s long overdue.
Surely some grand event is near at hand,
surely the solar minimum is at hand…
Cryosphere updated its Artic graph:
http://arctic.atmos.uiuc.edu/cryosphere/IMAGES/sea.ice.anomaly.timeseries.jpg
Also, RSS for May is out. 0.11 cooler than April at 0.09
Dave Middleton: If I understand what Leif’s saying, the problem with the presentation of SC23 on the graph is that its cycle does not start at 0 years like the other cycles. On the graph, SC23 starts in the last year of SC22. In other words, the graph shows a drop in Sunspot Number from year 0 to year 1. That drop was part of SC22, not SC23. The data for SC23 needs to be “slid left” one year.
OT:
May UAH temp anomaly is out: .04
http://www.drroyspencer.com/
John Finn,
There hasn’t been any warmer period? On what do you base that, the Mann-o-matic treemometers?
Good news from the Climate Conference held this week in Washington DC. Senator Inhofe says the Senate will reject the carbon cap and tax bill if it indeed gets to them. Says the supporters only have 36 votes. It was one year ago that the Senate rejected Warner-Liberman. They rejected Kyoto 93-1 I believe. He is entirely confident they will reject Markey-Waxman. He says if Obama uses the EPA endangerment finding they will tie this up in court for five years (just like the Democrats did to us). We have been saved! All this thrashing around is not going to go anywhere!
looks like the cooling persists…….
May 2009 Global Temperature Update +0.04 deg. C
http://www.drroyspencer.com/2009/06/may-2009-global-temperature-update-004-deg-c/
Interestingly, the NH and SH anomalies were the same value as the global anomaly, but the tropics have cooled quite a bit.
YR MON GLOBE NH SH TROPICS
2009 1 0.304 0.443 0.165 -0.036
2009 2 0.347 0.678 0.016 0.051
2009 3 0.206 0.310 0.103 -0.149
2009 4 0.090 0.124 0.056 -0.014
2009 5 0.043 0.043 0.043 -0.168
The sun is dying. That overlay image is going to make a great scare shot for someone, mark my words.
Glenn (01:10:08) :
I don’t follow. SC 23 started in May 1996, and that is how it is graphed. Dropping to 0 sunspots after official start doesn’t change that.
Minimum was in 1996 and should be plotted at year 0 as were all the other minima, not at year 1.
Dave Middleton (03:55:14) :
If the SC23-SC24 minimum falls in November 2008 and the NGDC places the SC22-SC23 minimum in May 1996…
Minimum fell in 1996 so 1996 should be plotted at year 0 [as all the other minima] and not at year 1.
Nothing wrong with NGDC numbers for cycle 23 or 24. Just Joe’s graph that is wrong, and disagreeing with another graph he has of the same.
Anybody can compute the length of the solar cycle using the smoothed sunspot number. One may have to exercise a bit of common sense. Here are the monthly numbers for the last minimum [the smoothed values are in the rightmost column]:
199511 1995.871 9.0 11.3
199512 1995.956 10.0 10.8
199601 1996.041 11.5 10.4
199602 1996.123 4.4 10.1
199603 1996.205 9.2 9.7
199604 1996.287 4.8 8.4
199605 1996.372 5.5 8.0 <=====
199606 1996.454 11.8 8.5
199607 1996.539 8.2 8.4 <——
199608 1996.624 14.4 8.3 <+++++
199609 1996.706 1.6 8.4
199610 1996.791 0.9 8.8
199611 1996.873 17.9 9.8
199612 1996.958 13.3 10.4
199701 1997.043 5.7 10.5
199702 1997.123 7.6 11.0
There are two local minima, marked by <===== and <+++++. From symmetry, I think the ‘best’ minimum is where the <—– arrow is, which is at year 1996.539. If the minimum this time around [as determined by an international group of experts – of which I happen to be a member] is at 2008.958, we get a length of 2008.958 – 1996.539 = 12.4. Similarly for cycle 20: 1976.372 – 1964.791 = 11.6. Calculating the length is not rocket science. My only problem with Joe’s figure was that the minimum year should be plotted at year 0 and not at year 1.
REPLY: I’ve sent Joe an email and asked for him to review your comments, thanks Leif.
Flanagan (22:48:20) : “Cold in New Zealand, in Northern states, hot in Europe, California, the Antarctic…”
Had three or so hot days in the UK reaching into the mid 20s C (current average would be about 18C) but now the temperatures have dropped by over 10C, same for most of north and central Europe. Forecasting night times of down to 3C if there are breaks in the cloud. Going to have to dig up my runner beans and bring them in at night. 🙂
This is a little off-topic, but Anthony no longer makes his email address publicly available, so I am posting this as a comment because I cannot ask him beforehand whether he thinks it might be suitable here.
Does anyone here know whether there has ever been an investigation of the possibility that cosmic ray-induced atmospheric ionization influences the prevalence of lightning? Everything that I have read about Svensmark’s work has focused on the influence of atmospheric ionization on cloud droplet formation, but after I was reading this blog a few days ago I realized that there should be atmospheric conditions under which lightning occurs when a higher cosmic ray flux produces higher ionization, but there is no lightning when the ionization level is less and all other conditions are the same.
The basic physical point here is that for an atmospheric voltage gradient of a given number of volts/meter, at a given pressure and humidity, there should be a critical concentration of ions/meter^3 such that an electrical breakdown of the atmosphere occurs only if the concentration of ions is greater than or equal to the critical value, because having more ions increases the probability that an ion or electron moving under the influence of the field will collide with a neutral molecule in a way that ionizes it, starting or continuing a cascade of ionizations that produces a plasma with sufficient conductivity to discharge the potential that started the process. This concept is of course the basic principle of the Geiger counter (and likewise related devices, such as the proportional counter, the spark chamber and the wire chamber), as Svensmark’s mechanism is the basic principle of the cloud chamber.
Thus, both date back most of a century as applications of physics knowledge to nuclear and particle physics instrumentation. I would not be surprised if, in journals like the Review of Scientific Instruments, there were decades-old papers in which the operation of these devices was analyzed in sufficient detail that if the papers were thoughtfully read the analyses could be extrapolated to atmospheric phenomena. This obviously could save some effort that might otherwise be spent in unknowingly repeating the earlier analyses in the course of quantitatively studying the effects of ionization on cloud formation and lightning occurrence.
It seems clear that in an area sufficiently close to the path of a lightning bolt, the ionization generated by the bolt hugely exceeds the ionization generated by cosmic rays. Thus, in a situation at a significant altitude above the local ground level, with sufficient potential energy in the form of a saturated or supersaturated atmosphere, so that the limiting factor for getting condensation is the availability of condensation nuclei, the occurrence of the first lightning bolt in an area could be expected to promote additional condensation, promoting upward convection and perhaps eventually additional lightning, continuing as long as there was sufficient humidity. In short, I am suggesting that a higher level of cosmic ray ionization in the atmosphere not only should promote cloud formation, as Svensmark has been saying, but also should make it easier for a cloud to become a thunderstorm, so that, in worldwide averages, they should be slightly more frequent or widespread during periods of low solar activity and consequent higher cosmic ray flux.
The whole process evidently promotes loss of heat from the atmosphere by transporting it higher, where there is lower infrared opacity (from carbon dioxide or any other greenhouse gas) for radiation traveling upward. This effect would be complementary to Svensmark’s concept that cloud formation enhances the albedo of the earth, thereby reducing the amount of sunlight that reaches the surface to be absorbed as heat for the terrestrial environment.
If I am correct that lightning promotion is probably an important consequence of cosmic ray ionization, then efforts to understand the influence of changing cosmic ray flux (and hence of solar activity) on climate will have to broaden their focus beyond current arguments over cloud formation, like the effort to discredit Svensmark reported on p. 576 of the May 1 issue of Science. Unfortunately, I am not in a position to do the quantitative work that would be needed to see if this speculation has any real value, so I hope that someone among the readers or contributors to this blog may have the time and other resources needed to pursue it further.
Basil (04:51:32) :
To those “confused” by Leif’s remark, he’s just pointing out that the graph doesn’t look right.
It beats me how anyone can be confused. It is not that graph doesn’t ‘look right’. It is that the graph is just wrong. You plot the minimum at year 0 whenever it was and the graph has it plotted at year 1. This is not a small quibble as you suggest. This is a HUGE thing as the visual impact is what lay persons take home. Why are we even discussing this? If I were Joe, I would just correct the graph and be done, unless there is a reason for knowingly pushing the wrong graph.
We have had a lot of days when a single weak spot has disrupted a spotless run for several days whilst it traverses the face of the sun.
It seems to me that the spotless day statistics are being unrealistically skewed by such events.
In theory two single weak spots, one on each face of the sun, if maintained indefinitely, would result in no spotless days at all and that would not accurately reflect the true level of solar activity.
The spotless day concept has it’s limitations.
According with J.Janssens “Based on raw data and smoothed evolution, solar cycle minimum seems to have occured in Dec 08 +/- 2 months”
My question had nothing to do with the arrival of summer, but rather what do these minimums mean. Can we expect the anomaly numbers to start increasing? Are we going to be seeing temperature increases again, so that Hansen’s prediction of 2009 being the warmest on record come true?
It looks to me like the cold sun is holding down global warming, and a warmer sun will reset the debate.
In line with Leif’s rational, each curve contains 13 bins, which is a bit misleading. Mr. D’Aleo has recycled values which gives the impression that all of the cycles are 13 years in length. For example, the last four values of Cycle 21 are identical to the first four values of Cycle 22. I guess we are all smart enough to figure it out, but Heaven help us if someone in the press starts to use the figure for some reason. I guess my point is that if Cycle 22 is ten years long, why extend the data to 13 years using data from the following cycle.
@Leif Svalgaard (07:23:41) :
Thank you for the explanation.
I’m not sure why he says “middle latitudes” as these are quite well above the equator, and thus C24 spots and not old C23 spots.
However, it is still a bit of a damp squib thus far, so let’s not count any chickens until the Sun lays few more spotty eggs.
http://sohowww.nascom.nasa.gov/data/realtime/mdi_igr/1024/latest.html
.
Anthony probably has not returned; Joseph D’Aleo might be gone as well; but can’t the current moderator get to them in some way? Along with Leif and others, I have serious concerns about an obviously (? – needs Joseph D’Aleo’s input) incorrect graph remaining as part of the current post on The Best Science Blog.
Also, CoonAZ (8:18) has a very important point about the ending of one cycle being continued on the graph past its minimum and turned into the start of the next cycle. “…The last four values of Cycle 21 are identical to the first four values of Cycle 22….Heaven help us if someone in the press starts to use the figure for some reason.”
REPLY: I’ve sent you an email. I always want to correct problems and oversights. I will most certainly correct it if it is in my purview, and I’ve asked Joe D’Aleo to review Leif’s comments. – Anthony
Dewpoints in the 50s in North Texas on June 4th. Temps in the 50s last night and not out of the 70s today even with the near-solstice level insolation.
Heavy rain and snow in the Sierras the last few days in California.
A strange spring to say the least.
David,
I think the heat loss from condensation and from freezing is at least as important as the albedo change.
Flanagan (22:48:20) : “Cold in New Zealand, in Northern states, hot in Europe, California, the Antarctic…”
Southern California has definitely NOT been hot the last week. In fact we had rain yesterday, something that rarely happens in June. Been colder than usual. Seems someone is tweaking the data again.
David Miller (07:33:35) :
If I am correct that lightning promotion is probably an important consequence of cosmic ray ionization,
There is an electric field between the ground and the ionosphere high above: “the fair-weather field”. This is maintained by thunderstorms so there is definitely a connection. The problem with the cosmic ray modulation and weather/climate is that the modulation is only a few percent [depending on energy – more energy, less modulation] so even if cosmic rays provide ionization the variation of that is but small.
Funny to be accused of cherry picking when presenting global temperature anomaly maps to people discussing local temperatures. True enough, I really wonder what period could serve as a basis that people here wouldn’t consider as cherry picking. The global anomaly for 2009 is way above the last 10 years average (as shown on the site), I really can’t see how one could take a warmer reference timeframe…
BTW, the RSS anomaly for May is out now. You should read about it quite soon, since it’s lower than last month! I’m still wondering why the HadCrut April value has not been mentioned here… Oh, yes, it was high. So you’ll never learn about it.
REPLY: You know “Flanagan” I grow weary of your cowardly comments and your baseless accusations.
HadCRUT didn’t come to my attention, simple as that. I missed it. In case you haven’t noticed, I run a business, several websites, a blog, handle hundreds of comments a day, radio forecasts several times a day, and have a family with two young children that need my attention.
Oh, and a trip to China that I had to prepare for last month. No small task, having never been there. Have you ever tried to get permission to photograph a government facility in China? It’s not automatic you know.
Yes I missed reporting on HadCRUT, I also missed many other things during the last half of May. I put WUWT on autopilot for several days using prearranged scheduled posts and volunteer moderators while I traveled.
So sure, make up a conspiracy theory for why HadCRUT wasn’t mentioned, it suits you.
You don’t even have the integrity to use your own name so please don’t question mine until you do. – Anthony Watts
OT:
UAH in at .043 for May 09.
So, when will the cold arrive and how much change will we have? Or has it arrived?, if so, it’s still above normal?
just courious as to what everyone thinks, how much lag?
OT. UAH for May is out, and continues to fall away. 0.04 c
David Miller (07:33:35) :
…
Does anyone here know whether there has ever been an investigation of the possibility that cosmic ray-induced atmospheric ionization influences the prevalence of lightning?
The theory is “runaway breakdown.”
Google scholar also has over 30,000 citations for “runaway breakdown.”
UAH May 2009 Global Temperature Update +0.04 deg. C
Could someone explain this to me? When I look at the AMSU-A temperatures at http://discover.itsc.uah.edu/amsutemps/execute.csh?amsutemps using channel 05 like Dr. Spencer advises I see that the 2009 temperatures are quite a bit (relatively speaking) above the 20-year average for most of May. So how can the global average temperature anomaly for May 09 be +0.04 degrees C?
O/T but felt I had to share this.
http://uk.news.yahoo.com/18/20090604/ten-calling-earth-from-the-air-world-rel-1dc2b55.html
It was the following that has me in stitches:
“Shot from the air in a chopper, the environmental documentary will be available across the globe…”
I wonder how much of that horrid carbon stuff they put into the atmosphere shooting 488 hours of film in 54 countries over 217 days? The irony that the green movie is telling us how we only have ten years to save the Earth isn’t lost on me.
You couldn’t make this stuff up, could you…
Lief is absolutely correct. Joe needs to correct his graph. It makes his work look sloppy.
REPLY: I’ve sent a letter to him. I’m sure he’ll do so. – Anthony
deadwood (10:19:39) :
Leif is absolutely correct. Joe needs to correct his graph. It makes his work look sloppy.
Unless there is a hidden agenda and the work is meant to mislead, in which case it is not sloppy at all 🙂
But, Joe, correct that graph! Now!
REPLY: I’ve sent him a letter/email. I’m sure he’ll do so, – Anthony
pyromancer76 (08:52:00) :
Anthony probably has not returned; Joseph D’Aleo might be gone as well; but can’t the current moderator get to them in some way? Along with Leif and others, I have serious concerns about an obviously (? – needs Joseph D’Aleo’s input) incorrect graph remaining as part of the current post on The Best Science Blog.
That graph is wrong indeed.
Flanagan (22:48:20) : “Cold in New Zealand, in Northern states, hot in Europe, California, the Antarctic…”
Europe (western part) only had a warm april. Mei was little to warm in Netheland. June is now starting cold. But there is always a cold period in june in west europe whit clodey weather. Farmers use it to shave there cheeps so that they don’t get sun burned. Normaly this happens mid june. Forecast are still putting there marks on a dryer and warmer summer but I am sure that dryer keeps on going in the winter but then with freezing cold added.
Mr Watts – please don’t take it personally. I’m just surprised by the bias of the reports, though you probably don’t do it on purpose.
It is just a way for me to counterbalance the never-ending attacks on the mainstream media where, as some people say, only warm records are reported – which is completely false of course.
Some things amaze me, like the arctic extent thing. M. Goddard got all excited because the extent almost went back to normal during one or two weeks. Since then, a very rapid decrease of the extent was observed, so that it is now even below 2008. It was pretty impressive and instructive altogether, with greenland sea ice clustering in an unusual way. I’m just a bit disappointed he did not react to this…
REPLY: “…though you probably don’t do it on purpose. ” Great, replace the conspiracy theory insult with a new one, “lack of cognizance”. Class act there buddy.
You talk of balance. One blog (mine) that misses a report against hundreds of TV stations, newspapers, wireservices, where by you own admission, “only warm records are reported”.
Get a big warm anomaly, boom they explode with stories. No mention of the plummeting temperatures is early 2008 though, little mention of the severe winter temperatures and the late spring this year.
But you may be right, my lack of reporting HadCRUT may have been the blunder that could have turned into a global news scoop, since there doesn’t appear to be much in the news on it:
http://news.google.com/news?pz=1&ned=us&hl=en&q=May+global+temperature+Hadley
Gosh, I didn’t know my blog was so influential. – Anthony
‘I really wonder what period could serve as a basis that people here wouldn’t consider as cherry picking.’
How about the past 10,000 years, i.e. the whole Holocene?
Or is that too short a period of time?
“Southern California has definitely NOT been hot the last week. In fact we had rain yesterday, something that rarely happens in June. ”
El Nino coming on?
Leif Svalgaard (07:37:46) :
Basil (04:51:32) :
To those “confused” by Leif’s remark, he’s just pointing out that the graph doesn’t look right.
It beats me how anyone can be confused. It is not that graph doesn’t ‘look right’. It is that the graph is just wrong
Funny how it is hard to convey things in the medium. I meant to signify agreement with you, though I guess my “doesn’t look right” didn’t do that very well. The “confusion” arose, as I recall the way the discussion has developed, between your opening post, and latter posts with people saying that the 12+ years, or whatever. I think some were taking your opening remark to question the latter.
As to “quibbling over details,” that remark went to whether the length of the cycle was 12.whatever, not to whether the graph was right or wrong. I am not quibbling over whether the graph is right or wrong. I agree it needs to be corrected.
Record hot day in Seattle yesterday. Though we’ll be cooling down again in the next few days, and will be in the mid 70s for the next week. Perfect weather.
Of course none of this has to do with sunspots (or lackthereof), but with ocean and wind currents moving stuff around. Sometimes that stuff ends up on land where it gets in the news, other times it stays out at sea where no one cares.
Nothing to see here, especially globally.
What is hot and what is not? A complicated question. Here is a snippet from the April summary of the Office of the New Jersey State Climatologist.
“The last week [of April] brought a four-day 90° heat wave to much of the state, one of the longer such April events on record.
Yet in spite of the wide swings in weather, the monthly statewide mean temperature of 51.9° was just 1.4° above average. Without the heat wave, the month would have been about a degree below average (assuming those days had been close to average). Of course those four days cannot be discounted, thus April 2009 checks in as the 28th warmest of the past 115 years.”
In other words, the weather pattern that prevailed for most of the month was one conducive to cooler than normal temps, but the four-day heat wave resulted in temps so far above normal that it more than canceled out the below normal of the 26 other days.
That four day heat wave, by the way, was not accompanied by the oppressive humidity characteristic of such periods at the height of summer. If most of the predictions for the summer come to pass, we may not see such a prolonged period of 90+ again, which would make this Jerseyite for one very happy.
One other point: heat waves in early spring can result in higher temps than the equivalent pattern might later on in the summer, due simply to the sparser leaf canopy. Of course, the higher humidity characteristic of such patterns in July and August can produce more oppressive conditions at temps considerably lower.
OT: Oceans are on fire!
http://www.osdpd.noaa.gov/PSB/EPS/SST/data/anomnight.6.4.2009.gif
I know in SoCal deserts, we were slightly above average for most of May, but the last week we’ve dropped way down. Average high in this area is around 90 for this time, and the past week we’ve been well below that.
Rain yesterday (first time I’ve seen a winter storm like that in June) and the temp dropped to 58 and held that most of the day. Rarely we might have thunderstorm, but I actually saw snow falling up on the back side of Mt Baldy. Yes, I know weather does not equal climate, but we should be in the 90s for highs, not 70s.
DR (06:30:17) :
John Finn,
There hasn’t been any warmer period? On what do you base that, the Mann-o-matic treemometers?
Let me rephrase my earlier statement. There hasn’t been a warmer period for which we have actual thermometer measurements.
Basil (11:08:10) :
I agree it needs to be corrected.
The amazing thing is that some people think it should not be corrected…
I live in Phoenix, Arizona and read the Arizona Republic newspaper every day. It is the most read newspaper in Arizona, although circulation is rapidly declining. Not once in the past 10 years have they printed an article that was critical of AGW. I have submitted 11 letters to the editor that were critical of AGW and only 1 was printed. At least once a week they print letters that support AGW. They also print every idiotic AGW report sent to them by the Associated Press and never publish the science that refutes them.
Mr Watts, by “don’t do it on purpose” I was meaning you don’t actually have any hidden agenda behind your reporting of news, nothing more. On the other hand, news of a quite cold winter have been reported everywhere, including mainstream media. The fact that Hadcrut results have not been reported widely is another proof that media do not “jump” on any occasion to show positive anomalies.
In the same way, there’s been almost no report on the early melting season in California (one month in advance) in the media, while it could have been a really great reason to (inappropriately) blame global warming. This dust-induced effect is however very interesting, did you hear about it?
Geoff Sharp (00:20:20) :
So its official, SC23 minimum has gone way past Aug 2008?
Of course. It happened months ago, it follows from the way the smoothing works.
Mick J (07:32:45) :
Had three or so hot days in the UK reaching into the mid 20s C (current average would be about 18C) but now the temperatures have dropped by over 10C, same for most of north and central Europe
Same here in southern Norway, we had ~25C max over the last weekend, but by Tuesday it had dropped 15 degrees overnight. Right now (22:40 local summertime) it it 6C outside.
ralph ellis (08:40:58) :
However, it is still a bit of a damp squib thus far, so let’s not count any chickens until the Sun lays few more spotty eggs.
http://sohowww.nascom.nasa.gov/data/realtime/mdi_igr/1024/latest.html
I agree with this, it is too early to conclude in my opinion. We have had this (in comparison to prior spots) somewhat respectable spot group, and it is now dying. The earlier specks this year have been almost jokes. There is not much telling us that the coming months will be very active, it could easily become like the last few months.
If we get more spots like the last one in the coming 2-3 months it seems more convincing to me that the activity is in fact increasing, but IMHO the latest spot is not significant alone to conclude now that the sunspot activity is going to “skyrocket” anytime soon, or that the minimum will be well defined in December 2008.
I just hope the next spot will show itself during the time when Livingston has “telescope time”, so we can get another assessment on the “Sunspots may vanish by 2015” issue.
I live in Ontario, 2 hours north of Toronto. Our temperatures have been below normal all year, we had 3 nice (26 C or so days in May, now back to 5 to 6 to 11 degrees C below normal. We had a frost warning the evening of May 31st as did NY state. How nuts is that? Normal planting time is May 24th. But our Liberal provincal governments continues in its attempt to bring in a cap and trade. So that the temperatures will decrease? So that we can pay more to heat our homes all year long, as I did last year.
Neven (09:58:33) :
UAH May 2009 Global Temperature Update +0.04 deg. C
Could someone explain this to me? When I look at the AMSU-A temperatures at http://discover.itsc.uah.edu/amsutemps/execute.csh?amsutemps using channel 05 like Dr. Spencer advises I see that the 2009 temperatures are quite a bit (relatively speaking) above the 20-year average for most of May. So how can the global average temperature anomaly for May 09 be +0.04 degrees C?
1. The Ch 5 readings come from NOAA-15 satellite which UAH no longer use. UAH readings are from AMSUs on NASA’s Aqua satellite.
2. NOAA-15 satellite experiences “diurnal drift” which means that over time measurements are taken at a warmer time of the day. Some adjustment to the raw data is, therefore, required.
See http://www.drroyspencer.com/ where there is a brief reference to this on the home page.
For a rough guide of the most recent month’s anomaly, it is probably best to compare with the corresponding month from the previous year rather than the 20 year average. For example, the NOAA-15 readings suggest May 2009 is ~0.2 deg C warmer than May 2008. UAH is ~0.22 warmer than May 2008 and RSS is ~0.17 deg warmer, so in this case, at least, using the monthly comparisons gives a decent approximation.
A Giurfa: I dont think so
UNISYS SST
http://weather.unisys.com/surface/sst_anom.html
I keep asking why is the NOAA SST graph so different to the Unisys one, No one seem to know. Any volunteers?
NOAA SST
http://www.osdpd.noaa.gov/PSB/EPS/SST/data/anomnight.6.4.2009.gif
In light of the differences in sea ice extent between sites one has to wonder….
There was no attempt to deceive, just a careless sliding of the years for cycle 23 in EXCEL.Probably happened when I updated file to include May values. I think I had correctly depicted it before and have use the right one in PPTs.
I did the story while riding Amtrak yesterday after a 5 am start after attending the ICCC with Anthony in DC.
I had arbitrarily chosen year 0 as solar minimum, meaning the first full calendar year of the new cycle gets a 1 and so forth. This is just like your birthday. You are not 1 at birth but 12 months after although you are in your first year.
I did not mean to imply the typical cycle lasts 13 years, only to show that in most recent cycles by this time (years 12 and 13) the activity had strongly rebounded. We are in the 13th year of the cycle, it will have a 13th birthday only if the minimum holds off to May 2009, increasingly unlikely. Monthly numbers in the last 7 months in 2009 will determine what the calendar year average will be.If it ends up high in 2009 than 2008, 2009 will become year 1 of cycle 24.
It would have been ideal to actually use 12 month intervals from minimum instead of calendar year, but the original purpose was to show that this cycle like cycle 20 was longer than most and calendar year averages were readily available in my excel files.
I have the highest regard for Leif Svalgaard and the work he does and his immense knowledge of the solar science. i enjoy his comments here on Climate Audit and Solar Cycle 24.
He was one of the first to call for a diminished cycle 24 and I respect his opinion that that fact doesn’t necessarily mean a cooling is coming. I do believe there is enough evidence in the historical record that it will cool if it peaks at 70 or especially if it tops at 40. See also http://www.dailytech.com/NASA+Study+Acknowledges+Solar+Cycle+Not+Man+Responsible+for+Past+Warming/article15310.htm
A historic question – may be for Leif Svalgaard.
Go back to the 1950’s or earlier; and would anyone have seen the current crop of cycle 24 sunspots ?
I believe they are very small; is their observation possible only because of better equipment ?
If so; if we used comparable technology – how many spotless days would we ‘really’ have had ?
And per my communication with Joe D’Aleo, his graph has been updated both on ICECAP and WUWT – Anthony
Carsten Arnholm, Norway (13:26:33) :
Geoff Sharp (00:20:20) :
So its official, SC23 minimum has gone way past Aug 2008?
Of course. It happened months ago, it follows from the way the smoothing works.
Thanks Carsten, the reason I mentioned it was I seem to recall Leif saying not so long ago that Aug 2008 was going to be the minimum…but my memory may not be correct?
peter_dtm (15:04:44) :
Go back to the 1950’s or earlier; and would anyone have seen the current crop of cycle 24 sunspots ?
Yes, and 100 years ago as well. E.g. ftp://howard.astro.ucla.edu/pub/obs/drawings/1923/dr231019.jpg
Geoff Sharp (00:20:20) :
I seem to recall Leif saying not so long ago that Aug 2008 was going to be the minimum
never miss a chance of a cheap shot…
Gosh, I didn’t know my blog was so influential. – Anthony
Geeze Anthony, doncha know that we live and breathe by your written word being the sheeple that we are:P Hehehe. (mumbles Anthony!, Anthony!)
Flanagan, when Australia had fires, it was global warming. When CA had a hot spell and or fires, it was touted as a sure sign of the global warming to come in both the local and national news. There was a recent report on all the MSM stations about refugees of sea rises on islands where the ocean hasn’t risen yet, and lets see what else have I heard about lately, certainly not the cold!. Oh yes, tornados were more intense because of global warming, and our first cyclone of the season was a day early and that was also touted as a symptom of global warming. Nancy P. went to china to talk about human rights of global warming. Our legislature is about to vote on a bill based on .. you guessed it, the theory of Co2 caused by humans warming the earth. While its ok for warmers to use ‘weather’ as sure signs of warming.. turn about is considered cherry picking. Maybe if more balance was restored in our media we wouldnt need to be so defensive, perhaps we could even have a rational discussion… but alas the non existant consensus makes that impossible but no one forces you to come here and read… that tells me you have doubts as well.
We keep hearing one month does not a trend make, but here you are screaming about a warm month. Well all these years later most of us are wondering, does the current trend have to go longer then the “warming” trend at max solar activity and El Nino for the models to be proven wrong? Or do you buy the momentary pause in warming theory caused by those pesky negative feedbacks which AGW absolutely denies exist. I do notice we haven’t managed to expand beyond the one degree on the anomaly chart. Where o where is that massive heating? HMMMMMM?
http://www.ncdc.noaa.gov/img/climate/research/global-jan-dec-error-bar-pg.gif
Then again, it may be yet another false alarm, the latest of several.
What Joe said … chilling (pun partially intended).
Thanks for explaining, John Finn!
Paul Stanko (03:25:43) :
“My spreadsheet indicates that cycle 23 was 147 months (12.25 years). This is calculated using the 13 month smoothed International Sunspot Number. Cycles 4, 6, 9 and 13 were longer.”
I made the same calculation on my spreadsheet. If we assume SC23 begins in May 1996 and ends in October 2008, the duration of the cycle was 150 months. (Of course, your calculation started with another month.)
Then, there are 2 cycles that are longer: cycle 4 (164 months) and cycle 6 (151 months: begin Oct 1810, end Apr 1823). Cycles 5 (begin May 1798, end Sep 1810) and 9 (begin Jul 1843, end Nov 1855) lasted 149 months.
I have a difference with your calculation for the solar cycle 13. I think you agree with the begining (Mar 1890) but for the end of the cycle, there are several months in the running. When I opt for Jan 1902, cycle 13 was 143 months long.
With these preconditions, SC 23 (if Oct 2008 would be the last month of the cycle) would be the third longest cycle since 1755.
Of course, as Leif says,
– solar cycles overlap by several years,
– “the [smoothed – itself a dubious thing] minimum around 1890 had multiple ‘minima’ ”
– “The next minimum did a similar thing (…) during 1901 May- Jun and 1901 Dec – 1902 Feb”
So, “the whole concept is too fuzzy and not very useful” (see post regarding Ken Tapping)
Nevertheless, it should be reassuring, if we should agree on some calculations.
Leif Svalgaard (17:46:01) :
Thank you !
I had come across accusations that reporting was ‘artificially’ high due to improved instrumentation.
Rik Gheysens (11:48:24) :
I have a difference with your calculation for the solar cycle 13. I think you agree with the begining (Mar 1890) but for the end of the cycle, there are several months in the running. When I opt for Jan 1902, cycle 13 was 143 months long.
With these preconditions, SC 23 (if Oct 2008 would be the last month of the cycle) would be the third longest cycle since 1755.
Quite interesting, we actually disagree on the beginning of cycle 13 and probably agree on the ending time. I have Jan 1902 as the first month of cycle 14, much as you suggest, but December 1888 as the first month of cycle 13. That’s because the smoothed 13 month sunspot # got down to 5.41538 in December 1888, then as you say, it started upward then dipped again. It reached 5.43077 in December 1889. It then rose a bit and dipped a bit again, then finally rose starting in March 1890, as you point out.
So, if you look at the cycle beginning when the clear uptrend becomes monotonic, I would agree with you and this would make cycle 13 at least a year shorter. My rule was to just look for the minimum though, seemed the simplest.
Thanks for the thought provoking analysis and discussion,
Paul
In Britain the Guardian MSM has reportedsnow in Cumbria . Apparently it is the first time it has snowed in Britain in June since 1975.
So, the NASA report posed on here recently, says that there is about a 0.1C effect on global surface temperatures, between the sunspot max and sunspot min. This has been an extended minimum – perhaps the effect is stronger than 0.1C – maybe 0.15C?
So, as sunspots get started again, and we start – however slowly or rapidly – moving back toward max, we’re going to recover that 0.1 – 0.15C. No? So, in 6-7 years, we’re going to see an increase in global surface temps of 0.1C – 0.15C, just as a result of sunspot activity?
No?
I don’t quite know where to put this, but I hope someone can explain it.
Spaceweather.com is showing a SSN of 12 for the 12th June.
They did the same 3 days ago.
Checking the SOHO MDI images,
you can get them here http://sohowww.nascom.nasa.gov/data/realtime/realtime-mdi_igr-1024-all.html
shows no sunspots since the 5th of June which means we have had 7 spotless days and 5 spot days this month. Their info doesn’t make sense (Spaceweather.com that is ).
So my question is, what are these people counting.
This comment is a bit late, but the guys over at solarcycle24.com have discussed the issue of modern observations vs historical observations.
http://solarcycle24com.proboards.com/index.cgi?board=general&action=display&thread=704&page=1 “Layman’s Sunspot Count” is one place. A search for “speck” will bring up others.
In addition to higher resolution observation picking up smaller spots, we are also artificially increasing the spot count through more thorough 24 hour per day observation.
In general though, the sunspot record is much longer and much cleaner than any temperature or precipitation records.
discussion on sunspots vs “specks” can be found over at solarcycle24.com.