That is a total of 365,000 high temperature records and 365,000 low temperature records. During the second year of operation, each day and each station has a 50/50 chance of breaking a high and/or low record on that date – so we would expect about 182,500 high temperature records and about 182,500 low temperature records during the year.
In the third year of the record, the odds drop to 1/3 and the number of expected records would be about 121,667 high and low temperature records.
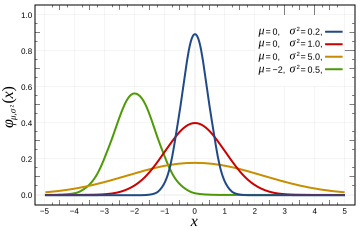
In a normal Gaussian distribution of 100 numbers (representing years in this case,) the odds of any given number being the highest are 1 out of 100, and the odds of that number being the lowest are also 1 out of 100. So by the 100th year of operation, the odds of breaking a record at any given station on any given day drop to 1/100. This mean we would expect approximately 1000 stations X 365 days / 100 years = 3,650 high and 3,650 low temperature records to be set during the year – or about ten record highs per day and ten record lows per day.
This provides the news media lots opportunity to get hysterical about global warming every single day – even in a completely stable temperature regime. The distribution of temperatures is Gaussian, so it won’t be exactly ten per day, but will average out to ten per day over the course of the year. In a warming climate, we would expect to see more than 10 record highs per day, and fewer than 10 record lows per day.
In a cooling climate, we would expect to see more than 10 record lows per day, and fewer than 10 record highs per day. The USHCN record consists of more than 1000 stations, so we should expect to see more than 10 record highs per day. Throw in the UHI effects that Anthony and team have documented, and we would expect to see many more than that. So no, record high temperatures are not unusual and should be expected to occur somewhere nearly every day of the year. They don’t prove global warming – rather they prove that the temperature record is inadequate.
No continents have set a record high temperature since 1974. This is not even remotely consistent with claims that current temperatures are unusually high. Quite the contrary.
| Continent | Temperature | Year |
| Africa | 136F | 1922 |
| North America | 134F | 1913 |
| Asia | 129F | 1942 |
| Australia | 128F | 1889 |
| Europe | 122F | 1881 |
| South America | 120F | 1905 |
| Antarctica | 59F | 1974 |
http://www.infoplease.com/ipa/A0001375.html
Here is the code discussed in comments:
// C++ Program for calculating high temperature record probabilities in a 100 year temperature record

// Compilation :  g++ -o gaussian gaussian.cc

// Usage : ./gaussian 100

#include <iostream>

main(int argc, char** argv)

{

int iterations = 10000;

int winners = 0;

int years = atoi(argv[1]);

for (int j = 0; j < iterations; j++)

{

int maximum = 0;

for (int i = 0; i < years; i++)

{

maximum = std::max( rand(), maximum );

}

int value = rand();

if (value > maximum)

{

winners++;

}

}

float probability = float(winners) / float(iterations);

std::cout << "Average probability = " << probability << std::endl;

}
It is the nature of records that they will always be broken.
Nor do these records show the supposed increase of “extreme events”. Thank you Steve, another snappy fact for our arsenal.
Global warming doesn’t act by increasing high temperatures. It works, as I understand it, by increasing LOW temperatures. What I would expect to see in a greenhouse warming climate would be a lot of record warm low temperatures.
Recently I read that Prague just broke the temperature record from 19th century in early April. Its cool that we have just surpassed Little Ice Age record today 😉
Yeah, more high lows and less low lows, but certainly more high highs and less low highs!!!
Nature is the norm. The abnormality is in the “surprise” at the “unexpected” during the observation of natural events, especially when those natural events do not correspond to the outputs of computer models.
Here is a completely subjectif observation based on perception…
Can you recall the intensity of the warmth of the sun on your face? I always enjoyed feeling the warmth of the sun on my face, more in the Spring when we get out of winter. However, I do remember a feeling of scorching on my face from about 2005 to 2007. I remember driving and trying to cover my face on my left side because it was not warmth but burning feeling. Last year I did not feel this. I wonder how the summer sun will feel this year, but I certainly don’t think that it will be scorching hot.
No, it would not cause higher high temps because CO2 would also block inbound IR from the Sun during daytime. It would act to moderate daytime high temps but it would act to prevent radiative cooling. As a result, the atmosphere should heat up in the mid troposphere. It would get heated from the sun in the daytime and from surface radiation at night … but that isn’t happening according to the observations so we can just can the whole silly notion.
Given UHI – we can expect more high records than low records. I was expecting to see what we actually did get these past few years at the end of the article – not a continent summary.
surfacestations.org shows that we’re not measuring just the air temp in some random location. We’re measuring some sort of human activity mixed in with the air temp. Human activity doesn’t strike me as random – so I wonder how that affects the Gaussian distribution.
“in a cooling climate” – not really – in a colder than average climate – you’d get more low records. You can be warming up, but colder than average, and still see more record lows. That’s always the big issue with the warmist since we’re currently coming down from a high point – we probably still set more high records than low records – which doesn’t show that we’re still warming.
Thank you, Ray, for clearing that up.
Steve,
Conversely you should have added that record low temperatures have been set after 1974
http://www.infoplease.com/ipa/A0001377.html
From the anti science department
http://voices.kansascity.com/node/4387
What is a Gaussian given Hansen at the controls.
Records are made to be broken.
“WE’RE ALL GONNA DIE IN A FIREBALL IN FIVE YEARS!!!!” sounds like a broken record to me.
Very helpfull description of probability for highs and lows, I like the list of continental highs, have you got one for lows with the years. ?
Imagine it’s April, in California. Why, within the same month, one may set two records:
1) Earliest grrrrrrrrrreat heat everrrrrrrrr!
2) *whispered (most heating degree days ever in the month of April)
RE: crosspatch (15:55:54)
Then your thoughts on the large number of record low numbers would be?
With all due respect to the poster, things are not as simple as presented. This sort of thing hurts my brain since my last foray into statistics was 1/4th of a mean life time ago! The problem gets compounded by the fact that we measure temperature in rounded off degrees, be they N.1 or N.001 degrees. That means that a new record temperature must not only be higher than the old record but must exceed it by some discrete amount, 0.1 or 0.001 degrees in my example above. That lowers the odds of any new record occurring. The odds go down fast the cruder the thermometer used. The poster’s point is still correct in that in a stable and unchanging climate there will still be new records over the time scale we have be taking measurements. It would be fun for some poor math major to plot us a series of probability curves for new records calculated parametrically with varying standard deviations, sample size and bin size. Nice post. SL
re: crosspatch (16:12:01) :
“No, it would not cause higher high temps because CO2 would also block inbound IR from the Sun during daytime.”
Not much inbound IR from the sun.
crosspatch,
Do you think warm low temperatures might have something to do with the proliferation of cities, asphalt, lawns, and irrigated fields? I keep a thermometer on my bicycle and sometimes see 3-5C difference between neighborhoods and adjacent open spaces on summer nights. Dew condensing on grass releases large amounts of heat.
Has anyone factored in all the badly sited weather stations and tried to make an adjustment for the UHI effect on those sites?
Such a map would probably be far different than those preferred by the warming alarmists.
Steven, you might have referred to this in preparing this post:
http://www.numberwatch.co.uk/record.htm
A couple years ago I looked at the distribution of high and low temperature records in the Kansas City area. It’s not a perfect weather station, having moved at least twice in the past 120 years, if not more. Fully one third of the high temperature records (year around) were set in the 1930s. Fully one third of the low temperature records have been set since 1980. The all time low temperature record in KC was set in 1989; it was -23 degrees on December 22 or 23 that year.
In a perfectly even climate, that is not the right distribution.
At least we know the high temperatures aren’t getting hotter.
Also it looks like we won’t die in a fireball here in the US yet according to the climate forecast system, looks like a slow cooling trend anomoly-wise for the rest of the year for the US and most of Canada.
http://www.capecodweather.net/cfs-archive/771-cfs-outlook-april-1st-2009
I noticed that despite all the warming going on in Antarctica, it’s last high-temp record was set in 1974. 1978 for the south pole itself.
However, the record low was set in Vostok in 1983.
I wonder if Steig would comment.
It kinda makes you wonder doesn’t it.
Steven Goddard…
Interesting and very useful article! From your article:
So no, record high temperatures are not unusual and should be expected to occur somewhere nearly every day of the year. They don’t prove global warming – rather they prove that the temperature record is inadequate.
I have insisted since 2005 that the very small fluctuation of temperature observed in the last decade fits within the normal fluctuations of temperature which can occur during the Holocene. The bounds for the oscillation, incorrectly called “anomaly”, are from -3 °C to 3 °C, which give a total fluctuation of 6 °C.
I think these guys (AGWers) are skilled businessmen who are taking advantage of this cyclical momentum to catch money. (Sorry, Anthony… I cannot resist saying it)
“From error to error one discovers the entire truth.” – Sigmund Freud.
This concept does not apply to Algore and his greedy band of liars.
“It is not a pollutant and not causing global warming or climate change.”
The SSOTUS (Supreme Scientists Of The United States) have designated CO2 to be a pollutant, Nature be d……
“A major tenet of the environmental paradigm is that almost all change is due to human activity. Once a change is determined it triggers a search for the human cause without consideration of natural change.”
Humans have the deep pockets. Polar Bears and Penguins do not pay taxes or fees.
Given our current events, I amend Michael Crichton’s “State of Fear” to read states of fear. The latest fear is engendered by the swine flu. My first thought that this was a viral attack on the economy and financial community resulting from contaminated pork in recent Congressional legislation.
————————————————————-
Human CO2 Hysteria:
Spending billions on a non-existent problem
By Dr. Tim Ball
http://canadafreepress.com/index.php/article/10605
The term “greenhouse gas emissions” is either deliberately misleading or indicates complete ignorance of the science, or both. What they really mean is CO2, yet it is less than 4% of greenhouse gases and the human portion a fraction of that. Why do they want it reduced? It is not a pollutant and not causing global warming or climate change. Reducing it is completely unnecessary and harmful for the plants and will cost trillions. They propose energy alternatives that are potentially more dangerous because they don’t work and can replace only a fraction of existing energy sources. This pattern of identifying the wrong agent of change, blaming humans, and proposing inadequate replacements at great cost is not new. We saw very similar events and sequences with claims that Chlorofluorocarbon (CFC) was destroying the ozone layer.
This seems like something Matt Briggs should have posted (or at least commented about)
My father was in the gold mining business. In more than any other type of mining successfully mining gold depends on accurate sampling to define as best as possible the ore grade AND minerology so there will not be any unpleasant surprises after the mine is put into production. This is because in mining all of the money is spent up front (developing the mine, putting in the mill and transportation infrastructure) before production. Frequently it takes several years of operation before one knows just how well (or poorly) one will do with a given gold property
Son Thomas went into the oil biz as a geopysicist. During my career three dimensional seismic data cubes were invented and perfected so there was a very rich and fairly accurate data cube to use for predicting drilling results. Data collection could be be expensive, but after spending a few million $ on the 3D survey and drilling a few expendable wildcats one knew if this prospect would be a good investment or not. It is just the opposite of mining, when one considers the cost of a large deep water production facility and pipeline needed to connect to the economic world could get into the hundreds of millions of dollars pretty quickly.
Dad and I would savor a beer or two after dinner and have great and very antimated discussions about practical sampling and sampling theory because that is what it is all about. If you can successfully predict what will be found in between two boreholes, you have sampled enough. if you are badly surprised, not so.
I look at the sorts of ‘information’ being offered to support the AGW thesis, and I sure find it lacking. Specifically I find it lacking in methodology, in repeatability, in documentation and in density of data volumes. Oh, and I forgot to mention the lack of predictability that the GCM models offer.
Whatever it is, it is not the successful application of technology for economic means, unless one considers ones continued employment as the only economic success necessary.
“Robert (16:30:16) :
re: crosspatch (16:12:01) :
“No, it would not cause higher high temps because CO2 would also block inbound IR from the Sun during daytime.”
Not much inbound IR from the sun.”
But the extra CO2 would block the extra IR trapped/coming downward from other extra CO2 molecules from above.
Something the AGW community never talks about. How does the extra IR trapped by CO2 make it back to the surface with all those IR intercepting CO2 molecules in the way.
Basically it is just a random walk around the atmosphere with only a few IR photons making it back down. They still make it out into space within a few minutes of what they would have before the extra CO2 was there.
OT, but I’ve been thinking about this for awhile.
————————
3 record low temperatures set in my area over the past year and no record highs.
Anthony; If you want to drill down a little further there is potential for new record highs and lows for both maximum and minimum temperatures. A total of 4 ways to create a new record each day.
At my nearest major city – Melbourne – they’ve been keeping records since 1st May 1855. Each day there are 4 possible records to break; multiplied by 365 = 1460 records. Divide that by 104 years means we should set 14 new records every year!
Unfortunately for Melbourne, the UHI effect is meaning we’re creating a lot of high minimum records and no low minimum records since 1978.
A few years ago, Phil Jones of the CRU was speaking on Robyn Williams’ Science Show (ABC Radio National). He stated (this is from memory) the record number of record high temperatures was entirely due to global warming. When I analysed Australian data most of the records dated back to the 1920s and 30s. Very few were recent.
The excellent site that jeez linked to is as good in its own way as the late John Daly’s site:
http://www.numberwatch.co.uk/record.htm
Here’s the home page for anyone who can’t figure out how to contact WordPress:
http://www.numberwatch.co.uk/number%20watch.htm
Worth bookmarking, IMHO.
A related question: What type of distribution do, for example, monthly temperatures follow. Surely not Gaussian. Is there skewness and kurtosis?
I am sure this question has been tackled but I have not found references. Maybe no parametric distribution fits.
Article is a nice way of presenting the issue. Should be clear to anyone — even me.
These kind of records are also a good way of assessing whether the “adjustments” made to the historic temperatures levels are accurate.
Very few of these records would be from the adjusted datasets but would just be from local record-keeping.
Reported record temperatures are abnormal if they aren’t real. Whenever there are record temperatures reported, I take it with a grain of salt.
Heat Waves in Southern California.
Are They Becoming More Frequent and Longer Lasting?
http://climate.jpl.nasa.gov/files/LAHeatWaves-JournalArticle.pdf
Almost every day I observe a politician, journalist or practicing “scientist” exhibit either ignorance of the difference between climate and weather (a distinction I learned in the 4th grade), or a deliberate disregard for the the difference.
Shameful, at best, and possibly despicable.
The record low temp in Australia (-23C ) was set in June 1994 at Charlotte Pass (1800m asl) but only after the weather station was relocated to a new position at the bottom of the valley. It stands to reason that the night time temperatures will be colder in this location. To my knowledge the station has been moved again – higher up the slope due to problems with excessive drifting snow so it is unlikely that a record low will be set any time soon. FTR there are only 3 weather stations in Australia that have ever recorded temperatures of -20 or less and all of these are within the Alpine area of NSW above 1400m.
I did a simple minded test of your observation by taking the record high and low temperatures in the US by date and state from Wikipedia, putting the events in Excel and plotting the cumulative highs minus cumulative lows. The lows lead the highs until the 1930s, when the highs gained until the 1960s, after which the lows exceeded highs bringing 2008 back to even. A polynomial best fit, assuming each state is a weather station, says we are in a cooling trend now in the USA.
Hopeless blend of hot air and hubris
Greg Melleuish | April 28, 2009
http://www.theaustralian.news.com.au/story/0,25197,25395364-7583,00.html
There is a very important law in politics and economics known as the law of unintended consequences. When governments intervene in matters about which they have limited knowledge, and this is basically everything, they can take steps that make things worse rather than better.
The same law applies to the natural world. Plimer describes a universe so complex that it is simply not feasible that any computer model devised by a human being could capture its complexity.
State action based on such limited knowledge invariably will have unforeseen consequences that may well prove quite harmful.
Humility can be seen as the antidote to hubris. Human beings should be humble in the face of the immense forces of nature and recognise that their power to manipulate and change the world is very limited. They can do this only if they recognise that adherence to climate change is the ultimate expression of hubris. There are times when the best thing for the state to do is nothing.
The analysis assumes that the temperature measurements are spatially and temporally independent which they are not. Increase the number of stations to 1000,000 to see the error in the reasoning, or/and have them measure every five minutes to boot.
While I don’t think that 1917 was a record, Northern hemisphere temperature data indicate the following (from CO2 Science data sheets GHCN).
Temperature anomaly
1916 -0.282542
1917 -0.643615
1918 -0.299733
1919 -0.271429
I’m not one to make correlations but wasnt the last flu outbreak about then? Hmm?
A slight correction. One expects more high and low temperature to be recorded as the reliability of thermometer improves. If you 1930’s thermometer was rated +/-0.1 degrees, then the actual maximum temperature was recorded as 91.6 degrees. in 2009 the thermometer is rated +/- 0.005 and the recording is 91.64 degrees. the record WILL always be broken.
Steve,
Looking at NOAA’s anomaly map for the month of April, I noticed something odd. The map says it represents anomaly for a period of 25 days.
http://www.hprcc.unl.edu/products/maps/acis/MonthTDeptUS.png
I’m just south of the Seattle area, and the map shows my area about 2 degrees below to 2 degrees above normal for this period. Or to sum that up, normal. We’re about 2 degrees below normal today, but thru this month, we’ve run 5 to even 10 degrees below normal on most days. We’ve only had reasonable weather in the last week or so.
This suggests the anomaly doesn’t really cover the period noted, but perhaps is a snapshot.
I’ll see if I can get some more information. But I’ve checked the almanac at our local weather station, and on those days I’ve checked, we’ve been significantly under normal. (5-10 degrees) I don’t suppose someone’s got their finger on the scale here…?
http://www.king5.com/weather/
So bets are HE will be right !!!!
Next possible statistical analysis :Hysterical mass/political movements vs. Temperatures.
I bet we´ll find a time lag:
1) Maximum Temperatures PRECEDING Hysterical mass/political movements
2) Hysterical mass/political movements PRECEDING Minimum Temperatures
3) Dictatorships following 02
4) Wars following 03
Jeff of Gembrook (AU) (17:17:27) :
Have you seen this study?
http://mclean.ch/climate/Melbourne_UHI.htm
Leif, you beat me to it!
This post’s analysis is based upon independent random events, which earth atmospheric temperature certainly is not. To say that the odds of a record temperature is 1 out of 100 requires a randomness that does not exist.
Solar output (here we go again!) is anything but random, instead, it is quite constant within a narrow range. Earth’s orbital distance varies a bit, but on any given day of the year, it is approximately the same. So much for randomness.
Interesting post, but it does not fly for me.
If anyone is ever in Los Angeles with an afternoon to spare, one could go to the Museum of Science and Industry to watch the bell curve machine in operation. Hundreds of black balls are introduced, one at a time, at the top center, then the balls bounce off of small pegs as they fall into one of about a dozen adjacent slots. The slots in the center fill up the most, and the slots on the far ends receive only a few balls. That is randomness in action.
Not read all of the posts here….maybe said already…
The whole “record high” thing is exacerbated because it is easier to get a false record high than a false record low. A wx stn can be made hotter than the “true” temp, but it is all but impossible to make it colder. Yes?
It is easier to measure a record high and a record high-low than to measure a record low or a record low-high. Got that?
Clive
Southern Alberta … where is is snowing again .. this is getting real old…a winter from hell !
“and the perfect unchanging climate (which our AGW friends imagine used to exist before they were born.)”
..and immediately, you’ve lost me already. ~snip~ Name one climatologist who (even in the last century) EVER thought that there was some kind of “perfect temperature” for earth (geared to which species??) and that the climate hadn’t been changing in perpetuity. Name one.
You are erecting on knocking down views that have never existed. How intelligent.
I’ve often wondered about the math and probability for these situations, thanks for the post.
Leif, how does that affect the analysis? Would one then expect to find records in spatial and temporal clusters? Extended periods in given locations with few or no records at all? A “lumpier” distribution of records?
Ed says: “Nature is the norm…”
Now I don’t think anyone doubts that at all. The point is whether precautionary action should be taken to avoid terrible effects. Picture this: a 10km wide asteroid headed straight for Ed’s house (be that where it may). Though on geological times scales, this is absolutely normal, would Ed be standing in his garden beneath the growing shadow, uttering “Nature is the norm…” I think not. At the first hint of a possible collision, hopefully months to years prior, earth’s residents will be working on a solution to prevent the impact. This ain’t the Cretaceous any more and, maybe, we finally have a choice of whether or not to enter forseeable extinction events.
[snip]
Reply: Seriously, thou shalt not insult other posters or our host, (although clever and extremely subtle innuendo may be acceptable) or entire posts will be deleted from now on.
I have spoken. ~ charles the moderator.
Robert (16:30:16) : Not much inbound IR from the sun.
“Everyone is entitled to his own opinion, but not to his own fact”—
Daniel Patrick “Pat” Moynihan
DR (17:49:55) :
Q: Heat Waves in Southern California.
Are They Becoming More Frequent and Longer Lasting?
A: Sure. And we know why.
http://wattsupwiththat.com/2008/08/23/how-not-to-measure-temperature-part-69/
[Let us know when you have something you would like to contribute or we’ll just delete, your choice and ours ~ charles the moderator]
[sorry db, I’m being more agressive than you ~ ctm]
The number of record highs is not really changing the average temperature but the changes in the number of record lows and as been said above the number of record high lows. I plotted out the 10 and 30 year monthly highs and lows for the central england temperature (CET) record. See link below. The level of the monthly lows really raised in recent years but the highs were pretty typical of the whole record. The plot shows the highest or lowest monthly anomaly for a running 10 or 30 year span. Note this has also been adjusted to remove the long term temperature rise of 0.26°C per century.
http://gallery.me.com/wally#100002/CET%20max%20min%20residuals&bgcolor=black
Gary Hladik (18:45:11) :
Leif, how does that affect the analysis? Would one then expect to find records in spatial and temporal clusters? Extended periods in given locations with few or no records at all? A “lumpier” distribution of records?
To find out, one should find [by cross correlation] at what distance between them stations are ‘independent’ in space and similar in time. Then base the analysis on those numbers. I don’t know precisely what they are except that [certainly for time] they are such as to invalidate the analysis. People in the business of analyzing weather station [Anthony?] siting know what those numbers are. A similar analysis was done a long, long time ago for sunspot numbers taken every day. Over a cycle there are ~4000 such numbers, but the number of independent values is only ~20. So to base the ‘error bar’ or occurrence probability on 4000 values rather than 20 leads to very wrong conclusions.
In dealing with records (snowfalls at a particular location, floods on a given river, etc) under the assumption that they are randomly distributed, you can take, say 200 years of data and labelling the first as a record, there should be Ln200 records broken during the 200 year period – about 5. I explained this calculation on another post (concerning flooding on the Red River of the North) and did a calculation on the data over 150 years or and came out with 5 which was the actual answer and demonstated the probability of the number of records for the period to be statistically normal. One reader criticized my calculation saying that …sure 5 may be what you would expect but you wouldn’t expect 2 records to fall within 10 years of each other… naturally the nature of randomness doesn’t bar two records being close together. Now I know there are factors out there that one can point to to show that such data won’t be random ( various cyclic oscillations etc.) but on the right scale, these are muted. In any case, if there is a looming inexorable change occurring, then the records should greatly exceed Ln N, if not, maybe we don’t have that much to worry about.
The discussion of record highs got me wondering if more GHGs lead to lower high temperature records.
Near sea level in my zip code in perpetually-humid Fort Lauderdale, the record high temps for July and August only have 1 day over 100 degrees. Most record high temps are in the 97-98 area. This from Weather Underground calendar view for July and August.
A few hundred miles north (and much farther west) where I grew up in much drier Dallas Texas, July and August have record highs above 100 for almost every single day.
So, do greenhouse gasses prevent warming? Places with less water vapor in the air (Dallas) get much hotter in summer time.
Its telling to look at the temperature ranges. Calendar view shows similar average low temperatures in both places, but lower average highs in Fort Lauderdale than in Dallas.
Wasn’t C02 supposed to have a positive feedback relationship with water vapor? Isn’t that the single most important mechanism in the AGW hypothesis? More C02 means more water vapor means more heat?
And yet, it looks to me like more water vapor, the most important GHG, leads to lower high temperatures. What gives?
Matt Bennett (18:31:03) :
“and the perfect unchanging climate (which our AGW friends imagine used to exist before they were born.)”
..and immediately, you’ve lost me already. Erecting utterly disingenuous and ridiculous strawmen like that is par for the course here. Name one climatologist who (even in the last century) EVER thought that there was some kind of “perfect temperature” for earth (geared to which species??) and that the climate hadn’t been changing in perpetuity. Name one.
———————————
Matt,
On the assumption that you would like to take CO2 out of the atmosphere, I would further assume that the perfect climate for the AGWers is that which occurs at 285 ppm CO2 or thereabouts.
Maybe that sets the perfect temperature range. Why don’t you you tell us what we’re trying to achieve ?? I really wouldn’t mind knowing from someone who clearly has an opinion on this.
Serious question, by the way.
The high temperature at whatever time it was taken is not the high temperature for that day. Temperature records made and broken are an artifact of the study design (said with a large grain of salt). I wouldn’t be able to get through the door with a dissertation study design similar to what is currently in place to report record temps.
Leif, Roger,
Temperatures at a location are typically thought of being represented as a Gaussian distribution. Here is an empirical example:
http://folk.uib.no/ngbnk/kurs/notes/node28.html
The odds of a record high at any given station on any given day in a hundred year record are 100/1. It doesn’t make any difference how many stations you have. Does the total number of craps tables in Vegas affect your odds at any particular one of them? Of course not.
Matt,
Mann’s hockey stick is based on a 1,000 year stable climate – until you purchased an SUV.
Matt Bennett (18:31:03) : “Name one climatologist who (even in the last century) EVER thought that there was some kind of “perfect temperature” for earth (geared to which species??) and that the climate hadn’t been changing in perpetuity. Name one.”
Oh, I dunno – Mann, maybe? He still insists that Earth’s climate was near as dead flat as any experimentally measured process can possibly be – flat through the historically confirmed worldwide Roman and medieval warm periods, flat through the dark age that killed a sizable proportion of humanity through cold and crop failures and flat through the little ice age when they held winter events on the frozen Thames, until it suddenly started increasing recently. And taken in conjunction with the hysterical pronouncements from his camp about tree deaths and so on due to factions of a degree temperature change, I’ll agree the point was put snidely, but basically fair I think. To be a straw man, the argument of one’s opponent has to be put in a deliberately weak manner. The characterisation given in the article was derisory, but given that it is only the tenth part of the hysterics from the AGW crowd, it certainly is not deliberately weak. Furthermore, the argument that followed did not hinge upon any feature of the alleged straw man. The argument works perfectly well even if the climate does vary, and by quite a lot. So the straw man allegation fails.
A more serious problem seems to be the working out of probabilities. After two random measurements, is it indeed p=1/3 that a record high will next be recorded? I’d want a statistician to comment on that. Statistical distributions are funny things and a lot of ‘obvious’ properties aren’t properties at all.
Matt Bennett (18:31:03) : “Erecting utterly disingenuous and ridiculous strawmen like that is par for the course here. Name one climatologist who (even in the last century) EVER thought that there was some kind of “perfect temperature.”
Matt, therein lies part of the issue — they won’t tell us what the goal is. There is no target or even a desired stasis. We are, right now, in roughly similar condition as existed in the early 1980s as measured by global average temps, ice extents, cyclonic energy, and all the other metrics.
One thing is for sure, they keep telling us that it is warmer now than ever in history or that the Arctic ice cap is melting faster than ever in history. The presumption is, therefore, the perfect temperature is something cooler than now, yet here we are cooler than more than a decade ago.
In January of 2000, the US Weather Service released a report that said 1999 was the warmest year since the organization had been keeping data. The media picked up the story and announced that 1999 was the warmest on record. Then candidate, Al Gore took it a bit further by saying 1999 was the warmest year in HISTORY! Mr. Gore’s statement is true only if his notion of history goes back only to the beginning of the data set he accepts — ironically one that began roughly 33 years after the establishment of the office he sought. As one who uses historical climate in my academic work, I know for an empirical fact that it was distinctly warmer than now during at least four extended periods since the development of an agrarian culture six thousand years ago (a better notion of history than Mr. Gore’s 1817 beginning of history).
The AGWers are not happy with the present condition or the cooling trend nor do they identify what their goal is. Why? Because it has NOTHING to do with the climate. The goal is, and always has been, the carbon tax. President Obama has $800 billion of carbon tax as a key element in his budgets going forward. Without that source of revenue, his most expensive agenda items would not have a chance.
Matt Bennett (18:31:03) :
“and the perfect unchanging climate (which our AGW friends imagine used to exist before they were born.)”
..and immediately, you’ve lost me already. Erecting utterly disingenuous and ridiculous strawmen like that is par for the course here.
Well, the implicit assumption behind a complaint that we have an anomaly in our present temperature is that there is a non-anomalous benchmark (often held out as some global average of a prior period of time). That sure sounds to me like an expectation of a perfected standard of climate that does not change …
If there is no benchmark standard, then there can be no anomaly, and we can all go home since there is no anomalously high temperature and no climate change…
Name one climatologist who (even in the last century) EVER thought that there was some kind of “perfect temperature” for earth
Hansen. He makes the anomaly maps, which by definition mean he has some non-anomaly state in mind as his benchmark. He regularly rants that we are too anomalous to the high side, which means he thinks we have a perfected temperature at zero anomaly. QED.
The IPPC. They state that we need to do lots of things to get the anomaly back down to zero; ergo they think it is the perfected temperature.
Repeat for any / all AGW advocates who think that the anomaly measurement in appropriate and that we need to do something to reduce it toward zero.
You are erecting on knocking down views that have never existed.
Nope. Presenting them with a bit of emotion and maybe a smidgeon of hyperbole, but relatively accurately presenting the notion behind the AGW anomaly rants. (That the anomaly means something relative to some non anomalous ideal). If the non anomalous ideal is variable, then please inform us what the formula / function looks like so we can incorporate this rubber ruler into our expectations…
How intelligent.
I thought so too.
“A wx stn can be made hotter than the “true” temp, but it is all but impossible to make it colder. Yes? ”
I don’t know, Clive. Plant a shade tree behind it and see what happens….
Steven Goddard (19:17:02) :
Temperatures at a location are typically thought of being represented as a Gaussian distribution.
Here is an empirical example:
http://folk.uib.no/ngbnk/kurs/notes/node28.html
If you divide the data into two half [1st and 2nd] they do not have the same mean [some refer to that as Global Warming] so are not drawn from the same distribution
The odds of a record high at any given station on any given day in a hundred year record are 100/1.
Not at all. The odds are not constant with time. If there is a general trend up [or down], then the odds for a record high at a later time is higher than at an earlier time.
It doesn’t make any difference how many stations you have.
But this statement of yours does:
“This mean we would expect approximately 1000 stations X 365 days / 100 years = 3,650 high and 3,650 low temperature records to be set during the year – or about ten record highs per day and ten record lows per day.”
Steve,
I did the same thing several months ago with US temperatures only. What I found was that 2/3rds of record high temperatures were recorded before 1950. If I remember correctly, record lows were about 50/50 distributed over the 1st and second half of the 20th century. I used 1950 as a good round number as it (roughly) divided the temperature record equally and, I figured, CO2 levels would be higher in the latter half of the century. All things being equal, I’m certain that there were fewer recording stations in the first half of the century, (especially in western states).
My thought was that “global warming” would create higher highs and that a greater number of high temperature records would be broken post 1950 than before……that isn’t the case.
Many variables/factors left out, but still a neat exercise.
“And yet, it looks to me like more water vapor, the most important GHG, leads to lower high temperatures. What gives?”
I have often wondered myself if water vapor reflects energy from the sun even when clouds aren’t formed. I would love to have the time to find out, but that is just not possible for me right now. Anyone else know?
Bill Illis (17:17:20) :
“Robert (16:30:16) :re: crosspatch (16:12:01) :“No, it would not cause higher high temps because CO2 would also block inbound IR from the Sun during daytime.”
Not much inbound IR from the sun.”
But the extra CO2 would block the extra IR trapped/coming downward from other extra CO2 molecules from above.
Something the AGW community never talks about. How does the extra IR trapped by CO2 make it back to the surface with all those IR intercepting CO2 molecules in the way.
Most of the IR is coming upward from the earth, not downward from the sun, and it’s radiating day and night. As I understand it from other threads, most of the CO2 trapping occurs very near the surface, holding the heat down where the thermometers are.
Anthony,
Speaking of record temps :
Is there an update on the record cold in Edmonton, Canada from some weeks ago that you were going to get confirmation on? Was the record cold temperature really broken by -12 C degrees? I had read it was broken by -14 C degrees.
The story about Edmonton from here at WUWT :
http://wattsupwiththat.com/?s=edmonton
Ohioholic (19:49:07) :
“And yet, it looks to me like more water vapor, the most important GHG, leads to lower high temperatures. What gives?”
I have often wondered myself if water vapor reflects energy from the sun even when clouds aren’t formed. I would love to have the time to find out, but that is just not possible for me right now. Anyone else know?
Water vapor, before acquiring enough density as to form visible clouds, absorbs and scatters photons from any photon stream which is hitting on it. Mie’s theory permits the estimation of photon dispersion by almost all kinds and sizes of particles.
Ohioholic (19:49:07):
To say the truth, scattering and reflectivity of photons by clouds are not well understood processes.
Comparing infoplease’s highest and lowest record tables, we have:
Continent Warmest Record Coldest Record
Africa 1922 1935
N America 1913 1945
Asia 1942 1933
Australia 1881 1994
Europe 1881 unknown
S America 1905 1907
Antartica 1974 1983
Asia seems to be the only continent known to have a coldest record earlier than a warmest record, but realize that the coldest Asian record was in Oimekon, Russia, whereas the warmest Asian record was in Israel!
Okay, I’m game. Let’s put this thing though the ringer.
I have records for my rural area back to 1894 (skipping 1895-1912)
That make 94 years of record.
Going back 1/3 from 2006 to 1975 (31 yrs) I have 102 Maximum Lows.
That’s 102/365 = .279, far short of an AGW trend.
Same year stretch I have 123 Maximum Highs.
That’s 123/365 = .336, just right for Gaussian but no AGW Cigar.
Hey, this is fun.
Working the other way, from 1894 to 1943
I have 200 Maxium Highs.
That’s 200/365 = .548 . Whew, was it hot back then or is it just me?
I have 183 Maximum Lows.
That’s .501 . Oh man, the nights for 1912 to 1943 were balmy, blimey.
Sorry folks, no AGW here.
Sorry, Gore, that’s the way the CO2 bubbles.
Hansens is a soda, did you know that?
Oh, before I forget, 1895 to 1912 is missing from our records. Seems thieves hit main st. and stole all the thermometers in 1895.
I really do have 94 years of record.
Thanks for that post, Steve! You are rapidly becoming my second favorite climate guide (after Anthony, of course). Sorry about that, Al and Hansen.
The North American record high temperature record will eventually be broken….
….just as soon as another rusty trash-burning barrel or BBQ is placed close enough to a Stevenson screen.
Leif,
Please read the article more carefully before commenting. The article says:
The total number of craps tables affects the total number of winners, but it does not change the odds at any particular craps table. Likewise, the more stations you have, the more records will be set.
Work through this simple exercise.
The first year of the record, there is of course a 100% probability of setting the record high. The second year, there is a 50/50 probability. the third year, there is one chance out of three. etc. This is a defining characteristic of a Gaussian, as in the temperature distribution in Bergen.
http://folk.uib.no/ngbnk/kurs/notes/node28.html
Steven Goddard wrote: ” No continents have set a record high temperature since 1974. This is not even remotely consistent with claims that current temperatures are unusually high. Quite the contrary.”
And almost all of these all-time continental temperature maxima occurred WELL before urban heat islands could be blamed. In fact, these observations were taken way back in a time when observations had a great degree of sanity and were not located next to airport runways [as Anthony argues many times on here].
Great work, Steven.
Chris
Norfolk, VA, USA
Speaking about temperatures:
US aplogizes for Global Warming!
http://www.climatedepot.com/a/486/US-apologizes-for-global-warming-Obama-administration-issues-mea-culpa-on-Americas-role-in-causing-climate-change
Idiots.
Pieter F (19:26:21) : “President Obama has $800 billion of carbon tax as a key element in his budgets going forward. “
A tax pure and simple, the budget tables list the anticipated “climate revenues” at $646 billion. Senior White House staff later revised that estimate upward, to a range of $1.3 trillion to $1.7 trillion in the first eight years.
Has anyone factored in all the badly sited weather stations and tried to make an adjustment for the UHI effect on those sites?
Such a map would probably be far different than those preferred by the warming alarmists.
In all fairness, I have to (very reluctantly, kicking and screaming) concede that if my statistics are right, UHI is accounted for reasonably in USHCN1.
Perhaps not in USHCN2, which method is shrouded in mystery and doubletalk.
I have the USHCN raw trend data for USHCN. I averaged all the sites they rate as “urban”. The 100-year trend for those sites averages around 0.5C higher than non-urban. 9% of total sites are urban. They apply an adjustment of around -0.05C/century. This seems about correct.
I grant NOAA the assumption that their adjustment applies to the final total of all stations and not merely urban stations. Granting this, I must concede USHCN1 is probably more-or-less correct.
Now, there may be a problem concerning what they consider to be urban. And there is the “exurbanization” factor to contend with. That maight throw a wrench in. But presuming that their parameters are sound (and they may be), their adjustment is about right.
HOWEVER, as for “badly sited” stations . . . bad in a microsite sense, that is . . . well, that is a story for another day!
(He said with an air of great mystery and portent.)
My rural site is one of the better one’s on Anthony’s scale, and the first 31 yrs of my 94 of record beat the crud out of the last 31 yrs.
Totally wipes the floor.
The only thing abnormal I see is the decision to close down most of the rural stations in favor of heat island ovens.
it ain’t C02, baby, it’s your concrete & asphalt jungle fever.
Developer diptheria.
David LM (17:53:50) David, here in western Colorado, the higher the elevation, the colder it gets. The valley floors are always the warmest temps around. I assume this is due to the thinner atmosphere allowing more heat to escape. More IR in and more IR out on a daily basis, the thinner the air is.
Dan Lee (19:10:46) A similar effect to altitude, ie. the mass of the air. Less H2O, less mass and greater range of temperature day to night. One could also argue the proximity of a large body of water stabilizes temperature. An examination of the desert temperatures surrounding Lake Powell may be able to seperate the two. Lake Powell has about the same amount of coastline as California.
Steven Goddard Interesting perspective, thank you.
Steven Goddard (20:22:24) :
Work through this simple exercise.
The first year of the record, there is of course a 100% probability of setting the record high. The second year, there is a 50/50 probability. the third year, there is one chance out of three. etc. This is a defining characteristic of a Gaussian
Work through this simple exercise:
Assume that halfway through the 100 years there is a dramatic climate change [e.g. like the Younger Dryas] where the temperature jumps 15 degrees, then that year has almost a 100% chance of setting a record high, the second year after that has a 50/50 chance, etc. Now, if there were jumps halfway to the 50 years and to the 75 years, the same will be true for them, so the odds of records depends very much on the trend. So, at the end, we are not down to 1/100 chance.
Rubbing the point in as hard as I possibly can:
Double-digit record setting high years: Sleepy No. CA town pop 3000
1918 – 10
1919 – 17
1920 – 12
1926 – 10
1929 – 23
1932 – 19
1936 – 16
1939 – 11
1986 – 10
1987 – 12
1988 – 14
1991 – 15
Score is Wildcats – 8, Gores – 4
EvanmJones,
sorry, their non-urban sites include quite a few that should be rated urban. Kinda screws up exercises like yours!!
Robert and Mike McMillan,
“Not much inbound IR from the sun.”
Absolutely incorrect. Please do a simple Google search and educate yourself.
Direct sunlight has a luminous efficacy of about 93 lumens per watt of radiant flux, which includes infrared (47% share of the spectrum), visible (46%), and ultra-violet (only 6%) light.
From: http://en.wikipedia.org/wiki/Infrared
The earth radiates as a blackbody at about 280 K. The sun at about 5800 K. The power in the Earths spectrum is shifted into the infrared due to its low output. The Suns into the visible due to its much higher output. Now look at the bottom chart on this page:
http://marine.rutgers.edu/mrs/education/class/josh/black_body.html
Notice the NOTE below it. Yes, you read it right. The earths spectrum, to be seen on the chart in comparison to the sun, is magnified 500,000 times!!!!! You may have seen similar comparison charts with the earth spectrum as high as the suns and a passing mention that it has been adjusted for comparison. Did you wonder by HOW MUCH??? Now you know!!
I am not sure where this myth came from, BUT, the sun outputs PLENTY of IR!!!! The fact that most of it is absorbed in the upper atmosphere probably helps continue the myth.
This site has an interesting graphic showing what wavelengths of the sun reaches the ground. Ever see this represented in the Energy Budget Cartoons?
http://www.windows.ucar.edu/tour/link=/earth/Atmosphere/earth_atmosph_radiation_budget.html
Didn’t think so. They are all WRONG!!!!!! Maybe not by a large amount, but, enough. Note: you’ll be doing yourself a favor if you ignore the Greenhouse propaganda printed on this page. They still believed a real Greenhouse works because it “traps” IR!!!!
The real question I have, that hasn’t been answered, is how is this downwelling IR handled by the so-called reradiation physics of so-called GreenHouse gasses. Accepting that little IR from the sun directly reaches the surface, it would STILL get down by re-radiation just like the AGW crowd claims the Upwelling IR eventually makes it out to space after a delay in re-radiation!!!!! So, exactly how accurate are those cartoons that don’t even mention Sun downwelling IR and makes a big deal about all the Upwelling Earth IR that takes a LOOOOOONG time to get out????
As I said, they are CARTOONS!!!! I wonder if the Models have it???
Hey, any of you smart guys have a REAL answer??
Wow. This trivial math isn’t in the sourcebook already for local meteorologists?
Mike McMillan and Bill Illis
See my comment at 19:01:39
The solar radiation spectrum is shown here: http://physweb.bgu.ac.il/COURSES/Astronomy1/Graphics/solar_spectrum.png
Not everyone sees the same way so there might be a slight variation on the divisions, but about 45 -51% of the area under the curve is to the right of the visible bound, that is, in the IR range. The following site claims 51%.
http://home.wanadoo.nl/paulschils/03.04.html
WIKIPEDIA has a page – scroll to Composition
http://en.wikipedia.org/wiki/Sunlight
Steve,
I must be missing something – are you implying a connection between the all-time continent highs and the chances of a record at an individual station? Or were the continental records intended as an interesting coda?
Ron de Haan (20:30:44) :
Speaking about temperatures:
US aplogizes for Global Warming!
http://www.climatedepot.com/a/486/US-apologizes-for-global-warming-Obama-administration-issues-mea-culpa-on-Americas-role-in-causing-climate-change
Idiots.
If you take responsibility for causing a non-problem, then do you get to pay non-penalties?
Who is Obama’s audience for this? Who is he trying to impress or win over? or is this just a general view he has that the US is a source of bad things in the world. He just doesn’t seem to be very proud of his nation.
Leif,
I made it quite clear in the article how a trend affects the probability. You aren’t saying anything which contradicts that.
I wrote a simple C++ program for calculating Gaussian probabilities.
———————-
#include
main(int argc, char** argv)
{
int iterations = 10000;
int winners = 0;
for (int j = 0; j < iterations; j++)
{
int maximum = 0;
int years = atoi(argv[1]);
for (int i = 0; i maximum)
{
winners++;
}
}
float probability = float(winners) / float(iterations);
std::cout << “Average probability = ” << probability << std::endl;
}
—————————
After 100 years, the probability is 0.01
./gaussian.exe 100
Average probability = 0.0106
“In a cooling climate, we would expect to see more than 10 record lows per day, and fewer than 10 record highs per day.”
Steve, I am afraid this is quite oversimplifying: we could be in a cooling situation and yet, because of strong high pressure centers reach very high temperatures in summer (think Australia’s latest summer…) or very cold lows in winter, absence of clouds…
Sorry, the WordPress html processor mangled the C++ program. It won’t take greater than or less than symbols.
One more try-
#include
main(int argc, char** argv)
{
int iterations = 10000;
int winners = 0;
for (int j = 0; j < iterations; j++)
{
int maximum = 0;
int years = atoi(argv[1]);
for (int i = 0; i maximum)
{
winners++;
}
}
float probability = float(winners) / float(iterations);
std::cout << “Average probability = ” << probability << std::endl;
}
kuhnkat (21:09:10) “The fact that most of it is absorbed in the upper atmosphere probably helps continue the myth.”
I don’t think that is true either! The main thing seems to be that Earth’s IR peak is beyond the bound that most folks use to cut off their solar spectrum diagrams. So, out of sight, out of mind.
This one shows more information, especially the notion that Earth’s IR peaks between 8 – 10 µm while the Solar IR is at a peak near the Visible, say 0.7 and diminishes much by 2.5 to 3.0 µm.
This one has “top of Atmosphere” and “radiation at sea level” so shows at what wavelengths solar IR is taken out and where it reaches to sea level.
http://physweb.bgu.ac.il/COURSES/Astronomy1/Graphics/solar_spectrum.png
Phil,
You state: ” I would further assume that the perfect climate for the AGWers is that which occurs at 285 ppm CO2 or thereabouts.”
Since you’ve asked honestly, I’ll answer in good faith as best I can. At the same time I will attempt to address the misunderstanding that others below your post seem to have reached (Ron, Pieter, E M Smith et al)
Your statement is not true at all. There is no such thing as ‘perfect climate’ – just think how absurd it would be to assume anyone thinks there is such a thing. Besides the fact that you have hugely varying climates existing simultaneously on the planet at any one time (at various latitudes, altitudes, depths and even those between day and night), which species are we defining it be the “perfect climate” for?? That’s why people who THINK that that is what climatologists think find it so easy to “knock down” the argument – the truth is, it’s never existed in the first place. Do you see the stupidity of it? The climate changes, is changing and always has changed.
HOWEVER, the climate’s various changes happen at different times, on different scales and in response to different (sometimes multiple) forcings. Climatologists have long known this. The ‘anomaly’ your friends here are so intent on homing in on (whether it’s Mann’s graph or any other expression of change in a variable) is simply the difference between the ‘now’ and a chosen baseline or average over a given time (generally represented by where/when we have sufficient data to know that our trendline amounts to more than random noise in the system) It is utter rubbish to assert that Mann maintains there has never been change above or below averge, or that the MWP didn’t exist in Europe, or that the LIA is false. He has never asserted that the climate was utterly stable, unchanging or ideal. What IS apparent after a careful look at his excellent and exhaustive reconstruction, using the best proxies available, is that right now we are way above the range within which these perturbations have been fluctuating, at least over the period he’s reconstructed. This is simply fact. It is accepted by all thinking climate researchers. Despite what you might have heard or read, the Mann graph stands firmly accepted as one of the most carefully compiled and studied products of science to date.
It does not mean that the climate has not changed much more dramatically in the past, however, and all climatologists accept this without question. Research the Vostock Ice Core data and look at the pattern driven largely by our orbital cycles with a CO2 feedback and you’ll see what I mean. It’s a case of which particular forcing(s) is dominating at any given time. The 285ppm figure that you cite is simply a rough guide to where we are ‘supposed to be’ at about now in the cycle of ice ages/interglacials. That’s all. If you look carefully at the Vostock graphs, CO2 varies cyclically between about 180ppm during the depths of an ice age up to 290ppm during the height of an interglacial. We are clearly way out of ‘normal territory’ at 390ppm today (this has not been seen for millions of years) and we have gotten to this point over decades, rather than the normal ‘thousands of years’ it would take – which is still considered rapid, geologically, by the way.
So there’s no perfect temperature, scientists are just comparing incoming data to the average of the various data sets we have and expressing how much change (pos or neg) has occurred – NOT stating that any given temp is ‘ideal’. Do you see what I mean?
Cheers,
Matt
Ohioholic (19:49:07) : “I have often wondered myself if water vapor reflects energy from the sun even when clouds aren’t formed. I would love to have the time to find out, but that is just not possible for me right now. Anyone else know?”
Between 0.75 and 3.5 microns, there are 6 absorption lines in the water vapor spectrum. They are fairly thin, but perhaps through the magic of “broadening” as happens with CO² (according to some), they will become almost contiguous, thus blocking a significant amount of the incoming energy, maybe 30%. There’s still a lot left between 0.14 and 0.8 microns.
Steven Goddard (21:53:38) :
I made it quite clear in the article how a trend affects the probability. You aren’t saying anything which contradicts that.
I’m saying that with a trend the chance is not 1/100 after the 100th year. Did you do work through the simple exercise?
And what about the cold ones?
When were they set??
Actually, what is observed is that the all distribution up there is shifted to higher temperatures, i.e. the maximum of the probability density function corresponds to higher and higher temperatures but fluctuations around it still exist
http://www.cdc.noaa.gov/csi/images/GRL2009_ClimateWarming.pdf
.
evanmjones (20:31:31) :
Mr. evanmjones,
I’m still anxious to see that co2 1940’s thread you talked about making a couple weeks ago.
[REPLY- Haven’t forgotten. Looking for data. The graph I found shows fossil fuel consumption up c. 50% from 1940 – 1944 in spite of all the war damage. But I need solid numbers. (I also need to find out how much CO2 incinerating a city releases.) ~ Evan]
Ron House: “To be a straw man, the argument of one’s opponent has to be put in a deliberately weak manner.”
Well, the imputed argument was: “…the perfect unchanging climate (which our AGW friends imagine used to exist before they were born.)”
I don’t know of any climate scientist who claims a “perfect unchanging climate”. Some climate scientists may claim that climate has been relatively stable in the recent past, but that’s not the same as a “perfect unchanging climate”. So, yes, a straw man is being beaten around.
There is no such thing as a “perfect” or “ideal” climate. The earth’s climate may be more or less hostile to human survival and comfort, but that has little to do with perfection. We may also prefer some climates over others, but preference doesn’t imply perfection.
What does matter for humans is that the climate remains not too far from the range of the past 10,000 years, the period during which human civilisation developed, since our way of life is dependent on that range.
sorry, their non-urban sites include quite a few that should be rated urban. Kinda screws up exercises like yours!!
In case you didn’t notice, I pointed out that possibility. Besides, if that were true, the trend increase would average lower and UHI would be that much lower as well. In fact, as the urban % increased and the trend dropped, the adjustment would remain correct (stipulating that it is correct in the first place, which it may be).
The fact is that sites rated as urban warmed 0.5C/century faster than those rated non-urban. 9% of sites are rated as urban. The Adjustment is 0.05C. If this is wrong someone has to tell me why. I know the difference in offset is outrageous. But we are not talking offset, we are talking trend.
Besides, raw data from suburban sites shows even less warming than rural sites. Strange but true. Sites rated as urban show a lot more warming.
FYI, the overall raw trend for the US, weighting all stations equally, is +0.14C per century.
I will discuss microsite issues at a later time, but for now I must defer.
The Australian record of 128 F (53.1 C) at Cloncurry, Queensland in 1889 is not officially recognised anymore. I believe that it was found to be inconsistent with other temperatures recorded in the region on that day, and the quality of recording equipment was dubious (improvised screen made from a beer crate; Anthony would not be impressed). The official record is now 123 F (50.7 C) at Oodnadatta in South Australia in 1960.
It’s worth noting that, over many stations over many years, the chances of an all-time record being due to faulty equipment or a misread are pretty high.
SL,
Yes, but no. If the temperature is reprted to 0.1C, then 22.44C is reported as 22.4C and 22.45C is reperted as 22.5C. So a new high temperature of at 0.1C higher than the previous record high is not required to get a new instrument high (replace argument with one using 5 significant figure and you can show the same with ever increasingly small differentials, no matter what the actual ability of a measurement to be made is – the digital discretization of the data is pretty much irrelevant to this argument). And since instruments drift randomly and instruments are replaced somewhat randomly with arbitraily small offsets (assuming they are calibrated correctly) in random direction from the calibration from the instrument they are replacing, new record highs or lows should still be occurring statistically as frequently as modelled by the article (but we’d have to take account of the UHI, actual number of stations, reading frequencies, etc.).
David LM (17:53:50) David, here in western Colorado, the higher the elevation, the colder it gets. The valley floors are always the warmest temps around. I assume this is due to the thinner atmosphere allowing more heat to escape. More IR in and more IR out on a daily basis, the thinner the air is.
Now, would that same formula work for an outer atmosphere found by probes to have shrunken 30% ?? i.e. – is the heat escaping?
[REPLY- Haven’t forgotten. Looking for data. The graph I found shows fossil fuel consumption up c. 50% from 1940 – 1944 in spite of all the war damage. But I need solid numbers. (I also need to find out how much CO2 incinerating a city releases.)
Scorched Earth, burned war materials, exploded ordinance in addition to the consumed contruction materials of which much of it accumulated over centuries. Wow, that is a tough assignment.
Matt Bennett (18:52:20) :
Ed says: “Nature is the norm…”
Now I don’t think anyone doubts that at all. The point is whether precautionary action should be taken to avoid terrible effects.
OK, if you’re so in favour of precautionary action how about this. I think most scientists would agree that there is a high probability that we are not the only intelligent civilisation in the universe, in fact there are probably many. Dr Drake of the Drake equation estimates about 10,000 for example. Assuming there are 10,000 then there is a good chance that some of these are hostile, more advanced, and could at this very moment be monitoring our radio transmissions!
Obviously the consequences of a more advanced hostile alien race attacking the earth would be far more serious than even AGW, and so I’m sure you’ll agree that we should:
a) Stop all radio transmissions immediately
b) Massively increase millitary spending in order to prepare ourselves for the attack (just in case).
sorry, but this math is complete bogus. the idea that 10 stations would report a maximum on a day, and 10 stations report a minimum in one country is absurd. this would actually be a sign of a massive problem with the surface station network.
beyond that, the science isn t really based on those daily records at any station.
instead we average stations and days over a year and find a remarkable result:
http://www.metoffice.gov.uk/corporate/pressoffice/2008/images/g_r_ranked_hadCRUT3_lg.gif
the science is sound.
This may have been mentioned before (penalty for coming late to a active discussion), but:
The debate is all about antropomorphic global warming – that is, man-made global warming – due to mankinds output of green-house gases.
Well if such a thing is true, then the total amount of additional green-house gases must be produced by the total world population. This implies that we each have an average green-house gas footprint.
Given that the world population doubles roughly every 60 years, we would need to halve the average green-house gas footprint every 60 years just to maintain the status quo. That looks like a no-win game to me.
Why is everybody focussed on trying to change the climate side of the equation?
Surely decreasing the size of the global population over the same time period (3 generations) would be easier, and have a more lasting effect. Or is that a taboo that we are not ready to face quite yet?
A nice picture of the station where the North American 1913 record was taken. Too bad they all can’t be of this quality.
http://docs.lib.noaa.gov/rescue/mwr/050/mwr-050-01-0010.pdf (Figure 1)
No climatologists believed that the climate was stable before the invention of the automobile – other than the IPCC.
http://en.wikipedia.org/wiki/File:Hockey_stick_chart_ipcc_large.jpg
Interesting how the AGW crew wants to have it both ways. Stable when convenient, and then deny it when convenient.
If one only looks at the warming trend of one short period and ignores the fact that this is only part of ongoing and alteranating long term cool/warm cycle , then the so called record global warming can be made to look abnormal or alarming. Taken in the context of a longer period , the warming is just another warming cycle of many such events.
LEAST SQUARE TREND LINES PER DECADE FOR VARIOUS PAST WARM AND COOL PERIODS
[Per HADCRUT3vgl]
1900-1926 0.048 C COOL [AMO –VE, PDO –VE &+VE]
1926-1944 0.187 C WARM [AMO & PDO POSITIVE]
1964-1976 0.108 C COOL [AMO& PDO NEGATIVE]
1994 -2008 0.187 C WARM [AMO & PDO POSITIVE]
Notice that the period 1926-1944 had the same rate of warming as 1994-2008. Periods of global warming existed well before 1976-2008.
1900 -2009 0.073 C PAST CENTURY [equivalent of 0.73 C/century]
2002 -2009 -0.195 C LATEST COOL [PDO –VE SEPT/07, AMO –VE JAN/09]
What made the most recent warming[1994-2007] more significant was that some of the AMO and PDO levels were higher than usual [third highest after 1878]
Another observation is that most of the recent warming period was really in the period 1994- 2007 and not 1976-2008. So the real warming was a decade and some three years , a very short period indeed and not a climate trend or long term trend at all. It is amazing how 13 years got blown out of all proportions by the AGW science and misrepresented as an alarming and an un precedented trend when it was really another warm hicup of this planet where regular alteranating cool and warm hicups are par for the planet.
Matt Bennett (22:30:03) :
“What IS apparent after a careful look at his excellent and exhaustive reconstruction, using the best proxies available, is that right now we are way above the range within which these perturbations have been fluctuating, at least over the period he’s reconstructed. This is simply fact. ”
This “fact” depends on the choice of “the period he’s reconstructed”. But does this “fact” hold up everywhere else? I also notice the disclaimer “using the best proxies available”. A lot depends on that.
Brendan H,
Your point is correct, but I think you’re also interpreting an ambiguous word usage by Anthony in a way it need not be.
First of all, Anthony was obviously making a hyperbolic argument to enforce his point. He doesn’t believe anyone believes that, only that the way the data is presented to the general public it would be virtually impossible for the public to not draw that conclusion. Much like the “North Pole will be ice-free this year (gasp!)” statements. It doesn’t matter whether the North Pole has or hasn’t been so in the past, one virtually forces a general audience to draw the conclusion desired even though the data doesn’t support it.
Second – within the recognized flexibility of the Engligh language Anthony could just as easily have meant, “perfect[ly] unchanging climate.” Again, nobody actually believes that, but it would be EXTREMELY difficult for people, for instance, watching Al Gore’s movie and looking at his presentation of the Mann Hockey Stick to not draw that conclusion.
THAT is the point that Anthony, I think, was trying to make.
I neglected to add that 10 of the highest global temperature anomalies also took place in the period 1994-2008 when AMO and PDO were both warm or positive and at higher than normal levels during some years. As both are now negative and anticipated to be so for some time , it is not surprising that we are having more cooler weather like we had in the 1970’s. CO2 is tracking completely opposite of this cooling.
“What does matter for humans is that the climate remains not too far from the range of the past 10,000 years, the period during which human civilisation developed, since our way of life is dependent on that range.”
Our way of life would be shattered by a two degree departure from the mean???
Of course, I’ll have to agree that we certainly benefited from the 8 degree rise in temperature from 20,000 years ago. http://www.geocraft.com/WVFossils/last_50k_yrs.html
Steve Keohane (20:49:16) :
Are the valleys warmer at night?
In general higher elevations are cooler during the day, thanks to convection and the adiabatic lapse rate (about 1°F per 200 feet). At night radiational cooling cools air near the surface which flows down hill and chills the valley. The temperature inversion thus formed can be quite thin (less than 100 feet) and scours away quickly in the morning with the first breeze.
OTOH, on a bicycle tour through the searing (2003) eastern Oregon & Idaho summer there were a couple canyons where the valley suffered radiant heat stored in the basalt canyon walls during the day – we baked all night long.
Brendan H (00:32:52) :
“Ron House: “To be a straw man, the argument of one’s opponent has to be put in a deliberately weak manner.” Well, the imputed argument was: “…the perfect unchanging climate (which our AGW friends imagine used to exist before they were born.)” I don’t know of any climate scientist who claims a “perfect unchanging climate”. Some climate scientists may claim that climate has been relatively stable in the recent past, but that’s not the same as a “perfect unchanging climate”. So, yes, a straw man is being beaten around.”
You carefully didn’t quote the part of my reply where I pointed out that the argument made did not rely on any part of this “perfect unchanging climate” snipe. Yes, that remark by the OP was snide, but no, the argument made did NOT rely on the “perfect unchanging” part of it. Indeed, even with a heck of a lot of variation in the past, as long as the current variation is out of the previous range, statistically more record maxima should be getting set, and they are not. So there is NO straw man argument here, just AGW alarmists pouncing on an irrelevancy (which was obviously intended to be nothing but a facetious wisecrack, as you surely well know) and trying to misdirect people’s attention with it whilst ignoring the actual logical content of the OP’s argument. Deal with the actual argument, please – if you can.
Leif Svalgaard (20:54:24) :
Steven Goddard (20:22:24) :
Work through this simple exercise.
The first year of the record, there is of course a 100% probability of setting the record high. The second year, there is a 50/50 probability. the third year, there is one chance out of three. etc. This is a defining characteristic of a Gaussian
Work through this simple exercise:
Assume that halfway through the 100 years there is a dramatic climate change [e.g. like the Younger Dryas] where the temperature jumps 15 degrees, then that year has almost a 100% chance of setting a record high, the second year after that has a 50/50 chance, etc. Now, if there were jumps halfway to the 50 years and to the 75 years, the same will be true for them, so the odds of records depends very much on the trend. So, at the end, we are not down to 1/100 chance.
Therefore, your point is an underlying increasing trend will raise the probability of record highs in later years, which we don’t see, yes? Seems to me this adds credibility to SG’s thesis.
Matt Bennett (22:30:03):
Mann’s reconstruction is far from “excellent and exhaustive” from what I’ve seen. A simple search of Climate Audit for Mann will show more than enough examples of questionable practices to cast his entire body of work into doubt.
no sod,
The math is both correct and is basic statistics. This is exactly how the temperature distribution would behave in a stable climate. If you have a disagreement about the math – cite something specific. The world “bogus” is not a mathematical proof.
Those here who believe that pedantic arguments about semantics strengthen the case for AGW, are deluding themselves. All it indicates is their complete lack of skill at interpreting rhetorical techniques – like sarcasm.
crosspatch (16:12:01) :
No, it would not cause higher high temps because CO2 would also block inbound IR from the Sun during daytime. It would act to moderate daytime high temps but it would act to prevent radiative cooling. As a result, the atmosphere should heat up in the mid troposphere. It would get heated from the sun in the daytime and from surface radiation at night … but that isn’t happening according to the observations so we can just can the whole silly notion.
You are correct, sir — that’s what is supposed to be happening if AGW from greenhouse gas emissions is occurring. The highs don’t get higher, the lows get warmer.
Yet another inconvenient fact.
I agree with Leif. The variables used are not independent, so the author’s entire argument fails. Also, why does the article have pictures of Gaussian distribution when the type of distribution makes no difference to the author’s argument?
Scott B (06:46:43) :
Matt Bennett (22:30:03):
Mann’s reconstruction is far from “excellent and exhaustive” from what I’ve seen. A simple search of Climate Audit for Mann will show more than enough examples of questionable practices to cast his entire body of work into doubt.
Amen to that. Matt, if you have always accepted Mann’s work at face value, try starting here http://www.climateaudit.org/?p=2322 where McIntyre talks about the official reports on the subject.
Steve,
As Leif Svalgaard and one or two others have pointed out, your method is seriously overstating the likelihood of record events in a day. As Leif pointed out upthread, daily temp readings are not independent events, but your analysis assumes that they are. Temp readings on successive days aren’t properly Gaussian.
To take the simplest case, suppose that on a given day, a given station logs a moderate daily temp, near the long-term average for that day at that station. The next day is also likely to be close to average, and is much more likely to be close to average than close to an extreme for that day. Weather patterns don’t “reset” for the next day – the two days’ temps are not independent. This is where your analogy to a craps table doesn’t work – in that case, the outcome of each new throw of the dice IS independent of the prior game’s outcome – but this is not true for successive days’ temp readings.
(It’s interesting that you’ve shown the opposite of the “Gambler’s Fallacy,” where people mistakenly think of independent events as contingent. Hence the gambling mistake of thinking that black is “due” to come up at a roulette table after a few consecutive reds. With your analysis above, it’s reversed: treating contingent events as completely random.)
If your point is that there are lots of new temp records all the time, and therefore lots of potential fodder for selective reporting, then all you have to point out is, say, one record per week, or just a record high somewhere near the beginning of each season. But you’re weakening that point with your analysis. I would suggest correcting your analysis above, or finding some data about the actual incidence of records at existing stations over time.
Re Scott B (06:46:43) :
And remember McIntyre doesn’t profess to know whether there was a MWP or not. He is sceptical of the actual science.
“In a normal Gaussian distribution of 100 numbers (representing years in this case,) the odds of any given number being the highest are 1 out of 100,”—actually all we need is exchangeable random variables (in particular, this holds if they are independent and have the same distribution), the Gaussian assumption is not at all necessary
Top 11 Warmest Years On Record Have All Been In Last 13 Years
ScienceDaily (Dec. 13, 2007) — The decade of 1998-2007 is the warmest on record, according to data sources obtained by the World Meteorological Organization (WMO). The global mean surface temperature for 2007 is currently estimated at 0.41°C/0.74°F above the 1961-1990 annual average of 14.00°C/57.20°F.
The media will run with this headline, Big Al will quote it, and a gullible public will repeat it! Can you find the problem with it?
John Galt: the lows get warmer
I beg your pardon Sir, where do you live?, just in case, you know,..in Venus perhaps?
Lowest Recorded Temperatures *(From the same source)
Place Degrees Fahrenheit
World (Antarctica) Vostok –129
Asia Oimekon, Russia –90
Verkhoyansk, Russia –90
Greenland North ice –87
NA(excl. GL)Snag, Yukon, Canada –81
United States Prospect Creek, Alaska –80
U.S. (excl. Alaska) Rogers Pass, Mont. –70
Europe Ust ‘Shchugor, Russia –67
South America Sarmiento, Argentina –27
Africa Ifrane, Morocco –11
Australia Charlotte Pass, N.S.W. –9
Oceania Mauna Kea, Hawaii 12
Temperatures in a stable climate are a classic Monte Carlo problem. If you take a large set of daily readings from a large number of locations, they absolutely will behave as a random Gaussian distribution.
Any Monte Carlo problem has localized dependent effects, but they average out over the group and over time. The arguments people are making here indicate a lack of experience with normal distributions and randomness in large systems.
This is why I get twisted when I hear headlines like “The 27th warmest October on record”. When you consider that the record referred to starts in 1895, then that’s around the 76th percentile, or not really that unusual.
Steven Goddard (09:14:36) :
Temperatures in a stable climate are a classic Monte Carlo problem.
Except that the whole debate [‘climate change’] is because the climate is not stable. Never was, never will be.
jorgekafkazar (22:33:50) :
Ohioholic (19:49:07) : “I have often wondered myself if water vapor reflects energy from the sun even when clouds aren’t formed. I would love to have the time to find out, but that is just not possible for me right now. Anyone else know?”
Between 0.75 and 3.5 microns, there are 6 absorption lines in the water vapor spectrum. They are fairly thin, but perhaps through the magic of “broadening” as happens with CO² (according to some), they will become almost contiguous, thus blocking a significant amount of the incoming energy, maybe 30%. There’s still a lot left between 0.14 and 0.8 microns.
jorge, H2O has a great many more than just 6 absorption lines between .75 and 3.5 microns. There are more than I would care to try and count.
Check it out here: http://www.spectralcalc.com/spectral_browser/db_intensity.php
Leif,
Yes, but the primary point of this article is to demonstrate that even if the climate were stable, we would still have some record high temperatures being set nearly every day.
Global warming, is an average global raise in temperature by 1 degree, this however flucuates within diffeent regions of the blobe. But as we all know polar caps are melting, elevation in sea and ocean levels are rising at quite an astonishing rate, and wildlife are being reverted to either relocate to warmer, colder(if any) climates to adapt with this. The idea of record temperature have been set all during our lifehood as people. Records have been recorded since the time of Gallellao and continue to flucuate. Its earths own way of sustaining its homeostasis, but within these currents times, mankinds activities have exponentially given way to making it more impactful that we are now experiencing in climate change and change in earth temperatures.
Steve,
It’s not the distribution of temperatures across sites that’s the issue, it’s the dependence of two consecutive temp readings at one site. This dependency does not “cancel out” unless something unphysical is going on such as an inverse dependency in a later time period.
The idea of calculating the likelihood of record events is fine in principle, but your method is overstating the likelihoods (aside from other concerns such as stability across time).
I’ve been looking at the Central England Temperature data (as it’s where I live) that goes back to 1659. Specifically, the monthly average mean temperature. The early records are given as integer celsius degrees, so in order to set a record, a month needs to average around 1C higher or lower than the previous high/low. The month of September recorded 13C for each of the first 7 years, and didn’t set a record until the 8th year when it blipped up to 14C. The precision of the data is clearly a parameter that needs to be figured into any analysis of how likely a new record is. The monthly CET data shows a cluster of new record highs and lows in the early 1700s when the precision improves to 0.1C and the barrier to make a new record reduces significantly.
Anyhow, here’s some analysis, showing the total number of new record highs and lows (since 1659) set by monthly average mean CET data in each century (excluding the first bit, where new records were set all the time, of course). Also shown are the total expected number of records (both highs and lows) based on the simple Gaussian model described in this article.
In the C18th, 3 record lows and 25 record highs (expected 29)
In the C19th, 3 record lows and 6 record highs (expected 13)
In the C20th, 1 record low and 8 record highs (expected 8)
Since 2000, 0 record lows and 4 record highs (expected 0.5)
Of the record highs set in the C20th, three were set in the 1990s.
Ian,
What physical connection do you imagine there being between the temperature on April 28, 1910 and that on April 28, 1911?
It may or may not be true that there is a relationship between the weather on consecutive days in the same year, but that has no bearing on the April 28 record – where each element being compared is separated by at least one year from any others.
Matt Bennett: “What IS apparent after a careful look at his excellent and exhaustive reconstruction, using the best proxies available, is that right now we are way above the range within which these perturbations have been fluctuating, at least over the period he’s reconstructed. This is simply fact. It is accepted by all thinking climate researchers. Despite what you might have heard or read, the Mann graph stands firmly accepted as one of the most carefully compiled and studied products of science to date.”
Whenever I think that I might be able to have a conversation with an someone possessing an opposing AGW, I see statements like this and realize that the discussion will probably be more like religion rather than climate analysis. In no way would I describe Mann’s work as excellent or exhaustive. His selection of proxies appear to be arbitrary and convenient for him. His results depend upon selection of a couple of controversial proxies even though less controversial proxies exist. And his controversial proxies contradict available physical evidence. I consider myself to be a “thinking climate researcher,” so I have a very hard time with your declaration of universal acceptance. Our science would indeed be in a very sorry state if “Mann graph stands firmly accepted as one of the most carefully compiled and studied products of science to date.”
Adolfo Giurfa (08:46:10) :
John Galt: the lows get warmer
I beg your pardon Sir, where do you live?, just in case, you know,..in Venus perhaps?
Please re-read. I said the theory says the lows are supposed to get warmer. Is that not what the theory says?
Steven Goddard (09:48:13) :
Yes, but the primary point of this article is to demonstrate that even if the climate were stable, we would still have some record high temperatures being set nearly every day.
That goes without saying as it is blindingly obvious. Using dubious assumptions and incorrect statistics just weakens your case. And would be attacked by the AGW crowd should they care.
Matt Bennett (18:52:20) :
Ed says: “Nature is the norm…”
Now I don’t think anyone doubts that at all. The point is whether precautionary action should be taken to avoid terrible effects. Picture this: a 10km wide asteroid headed straight for Ed’s house (be that where it may). Though on geological times scales, this is absolutely normal, would Ed be standing in his garden beneath the growing shadow, uttering “Nature is the norm…” I think not. At the first hint of a possible collision, hopefully months to years prior, earth’s residents will be working on a solution to prevent the impact. This ain’t the Cretaceous any more and, maybe, we finally have a choice of whether or not to enter forseeable extinction events.
————————————————————-
Thanks, Matt, for not placing me at the epi-center of a 9.0 earthquake, which would be a much more likely scenario. On the other hand, in using a straw man argument, you do not change the fact that Nature is the norm. So, as creatures of Nature, we adapt to Nature or perish.
For your reading pleasure visit FAQs About NEO Impacts: http://impact.arc.nasa.gov/intro_faq.cfm.
“”” crosspatch (16:12:01) :
No, it would not cause higher high temps because CO2 would also block inbound IR from the Sun during daytime. It would act to moderate daytime high temps but it would act to prevent radiative cooling. As a result, the atmosphere should heat up in the mid troposphere. It would get heated from the sun in the daytime and from surface radiation at night … but that isn’t happening according to the observations so we can just can the whole silly notion. “””
Well there might be a good reason why; as you say, that isn’t happening.
First off, there is The simple fact that the first CO2 absorption band of any consequence is at about 2.75 microns. 97% of the solar radiation occurs below 2.75 microns; so that leaves only 3% that could be absorbed by CO2.
Oops there’s a complication; turns out that water vapor has an absorption band that goes from around 2.25 microns to about 3.25 microns; totally enclosing that 2.75 micron CO2 band. Given all the water vapor in the atmosphere, that doesn’t leave much of that 3% available for CO2.
The first CO2 band that actually occurs in a hole in the water absorptions spectrum is the 4 micron band. 99% of the solar spectrum is below 4 microns, so that means that there is only 1% of the soar spectrum which CO2 could absorb.
So your first postulate is false; CO2 does not block any significant amount of inbound solar radiation.
As to your second postulate that CO2 would act to prevent radiative cooling; there’s also some problems with that. Once again water vapor absorption again partially overlaps the CO2 15 micron band, and completely wipes out the long wavelength edge of the CO2 band. Admittedly the short wavelength edge of the CO2 band occurs where water vapor absorption is lower (but still around 30% or more. The other complication is that at the global mean temperature of about +15C, the peak of the surface emitted thermal radiation is at 10.1 microns; but at the higher daytime full sun surface temperaturews; which is when the principal radiative cooling of the earth occurs; that spectral peak has moved down to less than 9 microns, so CO2 now has no effect at the peak, and it is further down the long wave tail of the spectrum by the time you get to 15 microns; so the daytime effect of CO2 is considerably reduced.
The upper atmosphere may heat up; but more likely to be due to the ozone absorption at 9-10 microns; plus the water vapor absorption of incoming solar radiation. Approximately one half of the total spectral range from about 0.7 microns to 10 microns, is covered by about seven broad water absorption bands, that capture a significant percentage of the solar spectrum. About 40% of the total solar spectrum energy is included in this region covered by water absorption, so something in the 20% range of solar spectrum energy can be absorbed by water vapor versus about 1% for CO2 (max). An accurate accounting of the water absorption would have to treat each band separately since the solar spectrum tail spectral irradiance drops from about 0.7 of the peak at 0.75 microns, to about 0.0001 of the peak at 10 microns.
So yes crosspatch there’s a reason your scenario doesn’t happen; none of the effects you claim will cause it; are real.
George
Absorption spectra for water vapor, CO2, O2+O3 and any other GHGs are widely available on the web, so anybody can check my figures for themsleves. In addition you need a good black body radiation calculator or chart. The influence of water vapor on both solar absorption and surface thermal radiation are such that there is not much room for interlopers like CO2 to do anything significant; then there’s that cloud thing that trumps any effect CO2 could have.
Leif,
Incorrect statistics? You are starting to make me laugh now.
“”” delecologist28 (09:54:57) :
Global warming, is an average global raise in temperature by 1 degree, this however flucuates within diffeent regions of the blobe. But as we all know polar caps are melting, elevation in sea and ocean levels are rising at quite an astonishing rate, and wildlife are being reverted to either relocate to warmer, colder(if any) climates to adapt with this. The idea of record temperature have been set all during our lifehood as people. Records have been recorded since the time of Gallellao and continue to flucuate. Its earths own way of sustaining its homeostasis, but within these currents times, mankinds activities have exponentially given way to making it more impactful that we are now experiencing in climate change and change in earth temperatures. “””
Let me guess; this is your first visit to planet earth-am I correct ?
We have on this planet, an extreme surface temperature range of approximately 150 deg C from a low of -90 to a high of +60. A smaller temperature range from -70 to +50, or 120 deg C occurs on earth every year , and that whole range can be found somewhere on earth during northern summers (all at the same time).
So just what significance would one deg rise possibly have in such a broad range. In any case; the global surface average temperature is of no scienticfic consequence whatsoever; it has no effect on anything; which is good, because we have no possible way of even measuring such an average.
Physical processes on this planet you are visiting, respond to actual real time values of physical variables. We don’t have any processes on earth that respond to the average of any physical variable over time and space; only the current local value affects the current local processes.
That’s why the polar caps aren’t melting; except when they are supposed to in summer, and the sea level is not rising at any rate that a rational person would call astonishing. We are killng off all the wildlife to make room for us, so no need to worry about relocating them.
And in our language fluctuate; which is similar to your word flucuate, tends to connote variation in both directions; up and down if you will.
It is nonsensical to talk of a record high temperature as “fluctuating” or flucuating either. Record high temperatures can only move in one direction; and that is up; they do not fluctuate.
Enjoy your visit; but do read some of our books so you can correct your incorrect assumptions about our planet and its idiosyncracies.
George
Steven Goddard (10:51:20) :
Incorrect statistics? You are starting to make me laugh now.
Statistics is two things. The actual calculation and the assumptions behind it. It is the latter that are incorrect. Laughing will not correct that.
Dear Steven, you might like to read Motl commenting on record breaking years in autocorrelated series, see
http://motls.blogspot.com/2009/01/record-breaking-years-in-autocorrelated.html
best
“”” D. King (08:42:31) :
Top 11 Warmest Years On Record Have All Been In Last 13 Years
ScienceDaily (Dec. 13, 2007) — The decade of 1998-2007 is the warmest on record, according to data sources obtained by the World Meteorological Organization (WMO). The global mean surface temperature for 2007 is currently estimated at 0.41°C/0.74°F above the 1961-1990 annual average of 14.00°C/57.20°F.
The media will run with this headline, Big Al will quote it, and a gullible public will repeat it! Can you find the problem with it? “””
Well noticet he date dec 2007; so please correct that to 11 out of the last 14 plus years. We should then notice that for some reason all of the 11 highest altitudes on earth occur up in the mountains. There must be some fundamental law about higher values occurring clustered around a maximum; and it is widely known from actual data that we just passed through a local maximum somewhere in the 1995 to 2000 time range.
But those reported high values are in fact not values of global temperature
but of “temperature anomalies”, such as reported by GISStemp; which has nothing to do with global temperatures; given that 73% of the earth’s surface is ocean water, and there aren’t a whole lot of weather stations strewn all over the ocean; like Hansen has distributed across the United States. To put it bluntly, there is no measurment network that has been in place for any significant period of recorded history, which is capable of determining the average temperature of the earth; not even of the average surface temperature oif the earth.
There are rules about sampling multivariable continuous functions so as to be able to reconstruct that continuous function from the recorded data samples. Failure to abide by those rules leads to corruption of the reconstructed continuous function; called aliassing noise; which IRRETRIEVABLY alters the function. The nature of this corruption is such that rather small transgressions can corrupt even the average value of that continuous function; making it indeterminate.
The nature of global temperature sampling regimens; is such that these rules are violated by orders of magnitude; so it is ludicrous to imply that gISStemp in any way represents the average global temperature of the earth; it is at most the average temperature of the specific set of locations which are measured by the GISStemp network, and even that is not assured because of errors in temporal sampling.
So maybe 11 of the last 14 years of GISStemp records are the highest on record; but please don’t refer to those records as “global” . They are at best local anomalies not global temperatures.
kuhnkat
You asking the good questions. There are a few more topics to consider about Heat & Thermodynamics at http://www.huris.com/web/cog/sci/phs/phy/c3409.htm.
It would be beneficial to the science of climatology to eliminate “green house” and “green house gases” from the scientific dictionary and replace them with atmosphere and atmospheric gases (atmospheric trace gases, ATG), respectively. As suggested before, the gases in the atmosphere and the gases in a legitimate green house are no different in makeup other than a possible depletion of CO2, due to growing green plants, inside the green house.
It is noted that NASA has removed the back-radiation from its “cartoon” of the Earth’s Energy Budget.
Leif,
You are going to have to better than that. What specifically do you believe is incorrect?
rafa,
I am not trying to do any analysis of trends in this article. The purpose is to demonstrate that even in a stable climate, we would still see lots of temperature records. Note that Leif agrees with this, saying it is “blindingly obvious.”
It may be “blindingly obvious” to Leif, but based on the comments from other readers, many appreciate a simple statistical explanation of why this occurs. One of the most prevalent flaws in science literature is that people tend to jump directly into detailed analysis without examining the validity of their core assumptions.
Ric Werme (05:48:33) Are the valleys warmer at night? Yes, in fact they are, every day. Watch the forecast for Aspen, Colorado at 7800 ft, compared to Glenwood Springs, CO at 5400 ft. The latter (GWS) is at the low end of a 35 mile long valley of which Aspen resides at the top, and is always 10-20F warmer, day and night. This is typical of anywhere I have seen in Colorado having lived here for 38 years. I’m at 6600 ft, but only 8 miles from Glenwood Springs. I use Aspen’s forecast for weather as it is closer to the actual temperature and weather events where I live although it is 25 miles away. If I drive the 4.5 miles down to the valley floor, it is 5-10 degrees warmer there than at my house.
Steve Goddard (12:08:28) :
You are going to have to better than that. What specifically do you believe is incorrect?
The assumption that climate is stable and that all data is drawn from the same distribution and that the data is random [e.g. without autocorrelation]. rafa’s link nicely describes the problem.
Steve,
Perhaps I carried on the day-to-day example too long? Consider that in your original set-up spacial correlations will exist among stations as well, and we’re back to the same problem…
no sod,
The math is both correct and is basic statistics. This is exactly how the temperature distribution would behave in a stable climate. If you have a disagreement about the math – cite something specific. The world “bogus” is not a mathematical proof.
the error i named above is a simple one: temperature in a country is highly correlated. the probability that 10 stations are giving a new maximum, while 10 are giving a new minimum ON THE SAME DAY is close to NIL. it simply wont happen, but feel free to prove me wrong by providing some actual weather data.
the bigger problem in your paper is the talk about “gausian distribution” which i think you did not fully understand.
my C++ skills are a bit rusty, but are you using just a random number between 0 and 1 for your calculation? because the daily temperature measured on a given day at a certain station isn t such a random number.
instead when looking at the timeline of temperature data of a certain date over 100 years (like the 28th of april) you will notice a “gausian distribution” of the temperature values. much more numbers will be close to the “average” 28th april temperature than far apart from it.
when i model this in a calc sheet (i use three times a random number between 1 and 6 and add them together, as one could do we dice as well), the numbers of new maximums start to get pretty small soon.
on 100 stations, over 100 years, the average over the last 35 years is just 0.37 new maximums PER YEAR. (your calculation would assume above 1, even for the last year..)
Some clarifications are needed in this disussion.
If extreme values of a gaussian variable are of interest, then the Weibull distribution applies. But the daily high temperature is not necessarily gaussian, and the distribution of its extremes is generally unknown. Nevertheless, because cyclical components in natural time-series introduce serial correlation, the extremes tend to cluster.
As for extreme yearly “global” temperatures, we need unbiased, globally uniformly sampled estimates to begin with, which neither GISS nor Hadley supply. The fact that the numbers they produce have clustered the yearly extremes in recent decades is of no great signifcance. That seems to be the product of their method of construction as much as the natural tendency toward clustering.
I would like some clarification on autocorrelation.
Leif, do you think the high temperature (or low) for your location today is autocorrelated with the high temperature for your location on this same calendar day last year, or any prior years?
hm, the function i used to get random numbers in a range produced integers. if i use longer random numbers, i don t get any difference between a gaussian and a flat distribution of temperature data, at least with 500 stations and a handful of runs.
you are using the gausssian distribution just as a description of the distribution of results (being number of new max/min results in a given year)?
Joseph (13:35:16) :
Leif, do you think the high temperature (or low) for your location today is autocorrelated with the high temperature for your location on this same calendar day last year, or any prior years?
Yes, take the extreme example that we are entering a new ice age, then for many thousands of year on every April 28th, the temperature will be consistently lower than right now, today.
You can be right in your blindingly obvious statement (even in a stable climate individual temperature records will be frequently broken) and still be wrong in your attempt to show this is true using statistics.
That’s Leif’s point.
Leif, et. al,
Read the first sentence of the article:
I am obviously not talking about extreme events, ice ages, Dryas events, etc. Next, read this sentence.
There are people here arguing about everything except what this article is about. This article is about a best case scenario, which despite being best case, sees lots of high temperature records.
Why wouldn’t you see high and low temperature records on the same day in the same country? It happens in the US all the time.
Try compiling and running the C++ code in the article. You will see that the math is exactly correct.
sky,
I’ll post this for the third time – a nearly perfect Gaussian temperature distribution as measured in Bergen, Norway.
http://folk.uib.no/ngbnk/kurs/notes/node28.html
Anyone who is familiar with Monte Carlo methods knows that a Monte Carlo simulation contains large numbers of non-average events which magically average out to an extremely predictable result. That is why Monte Carlo methods are widely used in many fields, including climate modeling.
Leif,
If the premise of the article is “blindingly obvious” why is it that nearly every journalist in the country doesn’t understand it?
Also, if it is “blindingly obvious” why are you arguing that it is incorrect?
Steve Goddard (15:06:03) :
Consider a hypothetical country with 1,000 top notch weather stations and the perfect unchanging climate
What is lacking is a statement [in bold] that says that because of autocorrelation the real climate does not behave as assumed. The casual reader will miss that point. And
http://motls.blogspot.com/2009/01/record-breaking-years-in-autocorrelated.html
Steve Goddard (15:19:15) :
If the premise of the article is “blindingly obvious” why is it that nearly every journalist in the country doesn’t understand it?
Also, if it is “blindingly obvious” why are you arguing that it is incorrect?
Because journalists [or rather their editor/owners] are not interested in the truth, but in what sells new papers and produces TV ratings.
I’m not arguing that it is incorrect, only that you are overstating your case by incorrect assumptions, and that doing so opens you [and all of us] to unneeded criticism. It ‘can’ be stated correctly, as motls did.
Leif,
This analysis is not intended to be exactly correct (as if that were even possible) and that is clearly explained in the first sentence. The point of the article is (again) to show why frequent high temperature records do not necessarily correlate with a warming climate.
Do you dispute that “blindingly obvious” fact?
Steve Goddard (15:19:15) :
If the premise of the article is “blindingly obvious” why is it that nearly every journalist in the country doesn’t understand it?
You article will be important to the people that wouldn’t have known this before, and all the comments here will alert those readers to the fact that the analysis is oversimplified and overstated, but nevertheless they will grasp the basics that new records are normal, so your goal will be achieved, and that is the important part. What will also be clear [hopefully] is that simplified models may capture the essence, but should not be taken too seriously when it comes to details.
Steve Goddard (15:33:49) :
The point of the article is (again) to show why frequent high temperature records do not necessarily correlate with a warming climate.
Hey, I thought it was that frequent low records [as have been reported a lot lately] do not necessarily correlate with a cooling climate… 🙂
Where I live there is a manual weather station surrounded by buildings and near a tarred road, and an automatic weather station situated on a grassed oval with no buildings/roads within 80 metres. They are only 300 metres apart. The MWS always measures on average 0.5C warmer (both max and min temps) than the AWS. This is a fine example of UHI in operation.
However if it’s on average 0.5C warmer then over time it will show exactly the same trend as the other station.
Leif,
You are correct – a few record highs or lows is meaningless.
FYI – Alaska just had their second coldest year since 1975, and is on a seven year cooling trend.
http://climate.gi.alaska.edu/ClimTrends/Change/graphics/temp_dep_49-08_F_sm.jpg
I’m sure that has nothing to do with solar activity though. Right?
Steven Goddard (17:24:51) :
FYI – Alaska just had their second coldest year since 1975, and is on a seven year cooling trend.
[…]
I’m sure that has nothing to do with solar activity though. Right?
As per your article, this is not unexpected with random data thus does not need a hypothetical cause 🙂
Steve Keohane (12:31:22) :
The town of Aspen is in a valley. A high valley should be cooler than a low one though the generally elevated terrain likely makes things a bit more complicated than adiabatic effects alone. The elevation difference between Aspen and Glenwood Springs is 2400 ft, which is a 12°F adiabatic difference. From your home to Glenwood Springs is an elevation difference of 1200 feet, so when the air is well mixed, I’d expect a 6°F difference.
What I was was trying to describe is an occasional phenomemon where the morning temperature in a valley is colder than a nearby mountain top. It requires still air at night, long nights, and clear skies. Snow to keep ground heat trapped helps too. You might be be able to see it by comparing Aspen valley temperatures with ski area summit temps in the morning.
Another thing you might be able to see is to take the summit temperature at Aspen in the morning, add the 1°/200 ft lapse rate for where you are and when your temperature reaches that see if the wind picks up or becomes gusty. The temperature climb may level off too.
Oh – here’s a decent example. In Glenwood Springs at 5900 ft is http://www.wunderground.com/weatherstation/WXDailyHistory.asp?ID=MAS062 . Except for a little wind from 1100-1200, things picked up at 1230. That was around the high for the day at about 73F.
Meanwhile at Storm King Mtn at 8800 ft, at 1230 the temperature was 56. About 3000 ft difference, or 15° adiabatic difference, which would suggest Glenwood Springs would be around 71F to allow mixing to occur, and that’s about what happened.
So any ground heating would heat the air and that convects upward, which means the winds aloft can come down to the ground.
Uh, what was the point of all this? Oh – thinner air at higher elevations and Australia air temps at Charlotte Pass and a nearby valley. If the pass isn’t too much higher than the valley, the valley will frequently have radiational cooling and a lower temperature than the pass.
A place in Maine set an all-time low of -50F on Jan 16. The low at Mount Washington (6288′) that day was only -25F. That’s one of the more impressive inversions I’ve seen!
Oops – I forgot the URL for Storm King Mtn, see http://www.wunderground.com/weatherstation/WXDailyHistory.asp?ID=MSTOC2
From Australia:
Figures just in from the BOM indicate that Charlotte Pass in NSW
has just recorded the lowest temperature anywhere in Australia
for the month of April. (-13 degrees)
I notice that 6 other stations in the surrounding area also recorded their lowest April temps.
This does not support or conflict with AGW and it should be noted that record low temps in April are statistically more possible (given the time period from the start of recording) in a warming world due to the large shift in average temperatures between the beginning and the end of the month.
And yes Charlotte Pass weather station is in a valley and about 50m below the Pass (1840m).
The station was moved by about 100m in 1992 to a new level 20m lower at the valley floor. The idea was to move it away from the alpine ski lodges which are obvious sources of IR radiation but the new position was more subject to temperature inversion extremes. The weather station was moved again (a few years ago) to a new position that’s about half way back to the original location.
Australia is a very warm continent and it should be noted that outside of the Snowy Mts of NSW the lowest recorded temperature for any month is minus 13C.
Ric Werme (18:08:38) :
What I was was trying to describe is an occasional phenomemon where the morning temperature in a valley is colder than a nearby mountain top. It requires still air at night, long nights, and clear skies. Snow to keep ground heat trapped helps too. You might be be able to see it by comparing Aspen valley temperatures with ski area summit temps in the morning.
Thanks Ric for the explanation. Last night was very clear and with almost no wind and Charlotte Pass has a few inches of snow cover at the moment so the ingredients for a temperature inversion are all there.
The valley below Charlotte Pass is also the base of a large glacial valley which starts 250m above the weather station.
Davd
dhogaza
Yes, of course that’s true. But the part that would be interesting to check is if there has been any more increase over time with the MWS readings (as a building has been built close by recently) compared to the AWS. If I had the time and data …………..
Ongoing exchange between Leif and Steven – very entertaining. Please don’t close for comments. I think it could possibly go on forever…
Ric Werme (18:08:38) I don’t disagree with you, but temperature inversions are pretty rare in this area, much more common on the front range (eastern plains) of the Rockies. From the WU reports you linked to the Glenwood Springs temperature reading is correct, the wind velocity is misleading, perhaps in some peculiarly isolated spot. Storm King Mtn. is about 2 miles west of Glenwood Springs. At my place from 10am on we had wind gusts in the 30-40 mph range. I went into Glenwood at 3:30pm and saw 3′ X 5′ flags standing straight out, which is approx. 35 mph. Aspen, my place and Glenwood are all in valleys. I’m in the Cattle Creek drainage, perpendicular to the Roaring Fork drainage which is bounded by Aspen and Glenwood. They both have a lot of exposed red sandstone, I am on a basalt flow, but my canyon is roughly east-west where the Roaring Fork is more NW-SE. In the mornings the airflow is up Cattle Creek, to the east, until about noon, then it switches to west or downhill, baring some major circulation effect as was the case today, 4/28, with wind out of the SW from a low in the NW US. It was very dry here today, ~15% RH as is the case after the snow leaves. One needs to be at 8000 ft to find any snow now and only on north facing slopes at that elevation. I would suspect that the consistant slope to the Roaring Fork drainage intersected by a few perpendicular drainages keeps the air in motion. I’ll have to pay more attention to the ski Mtn. reports in season, they mention the temperature at the mountain tops every morning. It’s a pleasure discussing weather with you.
Steve Goddard (12:26:45) :
rafa,
I am not trying to do any analysis of trends in this article. The purpose is to demonstrate that even in a stable climate, we would still see lots of temperature records. Note that Leif agrees with this, saying it is “blindingly obvious.”
It may be “blindingly obvious” to Leif, but based on the comments from other readers, many appreciate a simple statistical explanation of why this occurs.
Unfortunately you failed to give one, your attempt is wrong almost from the get-go! I assume that that both a maximum and minimum temperature is measured for each day (not explicitly stated).
During the second year of operation, each day and each station has a 50/50 chance of breaking a high and/or low record on that date
No it doesn’t! To have a 50/50 chance of breaking the previous record the previous year’s reading must have been exactly at the mean of the population you’re selecting from. Suppose by chance that it was exactly at the (mean + 1sd) instead then it would have a 15.8/84.2 chance of breaking the record. This problem is not dependent of the form of the distribution although the exact numbers will vary.
In the third year of the record, the odds drop to 1/3
Also wrong for the same reason.
In a normal Gaussian distribution of 100 numbers (representing years in this case,) the odds of any given number being the highest are 1 out of 100, and the odds of that number being the lowest are also 1 out of 100.
This is correct, congratulations!
Unfortunately it was immediately followed by an elementary logical error:
So by the 100th year of operation, the odds of breaking a record at any given station on any given day drop to 1/100.
The probability of exceeding the record will depend on the distribution and the highest previous value, taking your example of a Gaussian distribution and a previous record at the (mean + 3sd) value the chance of breaking the record is ~0.1%. If the previous record was at the (mean + 2sd) value then the chance of breaking the record would be 2.2%.
I suggest to get someone who understands statistics to write the article, and also read the rest of the Wikipedia article you got the graphs from.
AKD (21:10:24) :
Ongoing exchange between Leif and Steven – very entertaining. Please don’t close for comments. I think it could possibly go on forever…
Like the barycenter thread? 🙂
Unfortunately for the fun, I think we are done by now.
Merrick: “First of all, Anthony was obviously making a hyperbolic argument to enforce his point.”
So? The best straw men are hyperbolic. (By the way, I’m referring to the article that heads this thread, by Steven Goddard.)
“…that the way the data is presented to the general public it would be virtually impossible for the public to not draw that conclusion.”
As far as I can see, nothing in the data or the way it is presented implies a past “perfect unchanging climate”. And as for the public drawing conclusions, ice ages are common knowledge so I doubt anyone infers a past static climate from AGW.
Tamara: “Our way of life would be shattered by a two degree departure from the mean???”
I didn’t say our way of life would be “shattered”. That aside, a 2 deg C rise is at the lower end of IPCC projections, with a high of around 6 deg C. The higher levels would definitely cause a disruption to our way of life (ie to a society with a complex economy based on a high degree of interdependence).
Ron House: “You carefully didn’t quote the part of my reply where I pointed out that the argument made did not rely on any part of this “perfect unchanging climate” snipe.”
The intro to the article reads: “Consider a hypothetical country with 1,000 top notch weather stations and the perfect unchanging climate…”
From this description, the argument certainly appears to involve an unchanging climate, and at (07:05:00) Steve Goddard says: “This is exactly how the temperature distribution would behave in a stable climate”.
However, I take your point that the substantive argument does not require an unchanging climate. But that still leaves the section in parantheses: “…(which our AGW friends imagine used to exist before they were born.)”. The “which” in this case refers to “perfect unchanging climate”.
And that is a straw man, since AGW makes no such claim. The argument is implied by the use of a snide term such as “imagine”. In other words: ‘AGWers think that past climate was perfectly unchanging, but of course they’re dreaming, no such climate has existed.’
Just to prove the point of this thread …
Charlotte Pass, NSW, Australia today broke the all time low record in Australia for the month of April with a chilly start of -13 degrees C.
Given the number of April’s since measurements began there was ~ 0.5% chance of this happening this year.
Brendan H,
In fact your argument works against you. When ice ages are brought up they are used for the “climate change is bad” argument, NOT that climate change is normal, which again is the opposite of what your argument relies upon.
“They” say:
“Just a few degrees below “normal” and we have an ice age. Now look at the Mann Hockey Stick. See! Climate’s been so “perfectly unchanging” over the last couple thousand years [after completely jury rigging the data to make the MWP, LIA, etc. disappear – as clearly detailed again and again in ever increasing detail here and over at Climate Audit]. Now the Mann figure shows us we’re heading for a few degrees above “normal” [if I just draw a connect-the-dots line between the last two data points and extend it into the future in a highly scientific way] so the sky is falling again!”
You’re saying that “everyone knows” that climate change is normal or at least happens normally, but that is NOT what is being presented by either the anthropogenic warming proponents or the media in general. And as more and more data shows that the northern sea ice continues to both expand in area and thickness when compared year to year (see yesterday’s posting of German measurements of polar sea ice thickness) and at BOTH poles you are continuing to defend the irresponsibly stated “PANIC! The North Pole may be ice free this year!” article at the beginning of this post. (BTW, that’s hyperbole to make a point.)
And, again, while all this is happening the exceptionally UNSCIENTIFIC Catlin party is sending out, “gee, the ice is really THIN here!” releases and the NSIDC (who’s that incoming Director?) is supporting their work. So where are the straw men, really?
“the perfect unchanging climate (which our AGW friends imagine used to exist before they were born.) ”
No-one imagines such a thing.
Ozzie John (03:30:04) :
Just to prove the point of this thread …
Charlotte Pass, NSW, Australia today broke the all time low record in Australia for the month of April with a chilly start of -13 degrees C.
Given the number of April’s since measurements began there was ~ 0.5% chance of this happening this year.
I couldn’t find the daily data for that site but based on the April monthly data and assuming a Gaussian distribution there would be a 0.3% chance of the previous record being broken (-10ºC) and ~0.02% chance that it would be below -13ºC. Goddard’s method would say that there was a 1/79 (1.3%) chance of being a record.
When someone says, “The number of record high temperatures is very large,” one should reply, “Compared to what?” I.e., what is the null hypothesis?
Steve Goddard has presented a plausible first pass at a null hypothesis for testing the claim that the number of observed record temperatures is unexpectedly large due to a systematic drift in climate. Perhaps the model could be refined to add year-to-year autocorrelation such that the April 28 high temperature at a given location is not merely a Gaussian random variable but the result of a Brownian walk.
But in any case, statistically testing assertions against a null hypothesis such as the one Steve presented is essential to validating any GW or AGW claims. If the AGW camp cannot show at, say, the 95% confidence level that the number of observed new highs is inconsistent with a stationary (or randomly drifting) climate hypothesis, then we can rightly dismiss their claims out of hand.
Personally, I think the evidence indicates that there indeed has been a systematic upward temperature trend over the past 100 years (even after accounting for likely bad data from many surface stations). But I would like to see the p-value for a test of this claim. And even if there is GW, that does not mean it’s AGW.
(BTW, the posted C++ code appears to use uniformly distributed random variables rather than Gaussian ones.)
Dana H. (13:22:20) :
When someone says, “The number of record high temperatures is very large,” one should reply, “Compared to what?” I.e., what is the null hypothesis?
Also, the argument applies equally well to record low temperatures, so all the record lows we see are just what would be expected from random data [as per the argument].
“Also, the argument applies equally well to record low temperatures, so all the record lows we see are just what would be expected from random data [as per the argument].”
Yes, absolutely. Any claim that there is a systematic cooling trend should be met with the same degree of rational skepticism as a claim of systematic warming.
Merrick: “When ice ages are brought up they are used for the “climate change is bad” argument, NOT that climate change is normal, which again is the opposite of what your argument relies upon.”
I’m not arguing that climate change is normal. I’m arguing that climate change occurs.
“You’re saying that “everyone knows” that climate change is normal or at least happens normally…”
I’m not saying that. Here’s what I said: “…nothing in the data or the way it is presented implies a past “perfect unchanging climate”.
I’m arguing that people, including AGW supporters, know that climate change occurs. That’s not the same as “normal”. My argument was in response to the claim that AGW people “imagine” that in the past there was a “perfect unchanging climate”. The relevant issue here is “change”, not “normal”.
“They” say…Climate’s been so “perfectly unchanging” over the last couple thousand years…”
Who are “they”? I have heard the climate of the past two thousand years described as stable, but that’s not the same as “perfectly unchanging”.
“…you are continuing to defend the irresponsibly stated “PANIC!”
I don’t defend irresponsible panic-mongering. People have differing views on the likely outcomes of AGW, so there will be a range of opinions. And of course AGW sceptics often appeal to lurid scenarios of mass death and misery from measures to mitigate AGW. So the panic swings both ways.
Steven Goddard
The mechanism by which you infer the odds year-on-year of a temperature being a record high or low is fundamentally flawed.
The post by “Phil.” at 21:42:12 on 28 Apr 09 explains the reasons why.
You need to re-calculate the expected number of broken records taking Phil’s comments into account.
This number will be lower than your initial calculations, which suggests to me that record highs and lows have more significance as climate “events”.
I still think the hypothesis that more high records should be broken than low records in a warming climate is valid. The question is, what is the likelihood of such an occurrence in your scenario’s stable climate? Only than can we assess the significance of actual measurements.
I feel you do good work, Steven, but I think this article was insufficiently rigorous.
Steven Goddard:
Your 15:10 post on the 28th shows quasi-gaussian temperature readings at Bergen for a month. My earlier comment about likely non-normality, however, concerned the daily MAXIMA, whose EXTREME values result in RECORDS. Not the same thing at all.
I became aware of this fallacy when I started attending high school. The papers were full of stories about athletes frequently setting new school records. The school was only 5 years old when I was a freshman, so it was relatively easy to set new records- roughly 1 in 5 records could be expected to be broken at that time, 1 in 6 my sophomore year, etc.
hey anthony! thread idea.
wondering if this is sign of bias toward warming reporting in the media … bear with me.
google trends reports US news mentions (second graph) for “record high temperature” stomp over news mentions of “record low temperatures” over the last few years.
http://trends.google.com/trends?q=record+low+temperature%2C+record+high+temperature&ctab=0&geo=us&geor=all&date=all&sort=1
this despite the fact that no state has reported a record high temperature since 1995, according to infoplease/NCDC/StormFax:
http://www.infoplease.com/ipa/A0001416.html
not really statistically savvy enough to know if a 14-year gap (1995-2009) is a long time to go without a record high in at least one state out of 50 … the previous gaps were 11 years (’83-’94), 8 years (’75-’83) and 14 years (’61-’75). but that’s beside the point.
why would the media report more about record highs than record lows during a period when there were apparently few record highs set?
presumably the record high reporting was not about US states, but rather about other countries or perhaps individual towns within the US, which could obviously have their own record highs without affecting the respective state’s record high. so a little more research is in order here. would be interesting to see whether there were more record highs than record lows in US towns and cities over the last few years (the period google trends tracks).