In comments on WUWT, people often think freely and throw out all sorts of ideas. Like in any collection of people, some are bad, some are average, a few are good, and even fewer are noteworthy. However, one that was noteworthy recently was from a WUWT regular known as “hotrod” in the “NASA Deep Solar Minimum” thread.
The thing that has been nagging at me is, that the trace of a rogue wave in this link, looks a lot like the 1998 temperature spike. On thinking about it, if a [rogue] wave is possible in the ocean, is it not conceivable that the same sort of behavior could exist in an average temperature plot for a body like the earth, as it oscillates around an average temperature? This like the PDO and AMO are just different types of periodic motion.
He was referring to what has now become known as the Draupner Wave, named for the oil platform that recorded it on January 1st, 1995.
In the case of the Draupner Wave, it has an amplitude about 3x that of the average background wave amplitude. It was created when the amplitudes of some waves of dissimilar amplitude and period combined in sync to form a new wave peak for an instant. That instant passed and the sea went back to normal background amplitude.
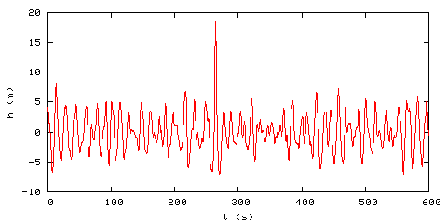
In the case of the 1998 Super El Niño, there is a similar sort of event where the temperature peak is about 3x that of the background peaks. This plot of the RSS Global Temperature Anomaly below (done by Barry Wise) shows the 1998 super event in red:

Barry writes:
The 1997/98 El Niño temperature spike seems to have had a long lasting effect that is dissipating. This graph shows what the trend was before the event and how the trend was affected by it. The dashed red line is the trend with all of the data and the purple is the trend based on the data before the area highlighted in red. Notice that there appears to be a decaying oscillation. If correct we’re in the third peak which is less than the previous two, and is much closer to the purple trend line.
[Note: I should point out that Barry’s method creates a different result than if the 97/98 El Nino data is removed, and before and after trend lines are plotted (h/t to Tom P) the resultant effect of the 1998 Super El Niño is less apparent. See comments for more discussion.]
Certainly there appears some similarity between the Draupner Wave and the 1998 Super El Niño worldwide temperature spike. And certainly we have a number of periodic systems and forcings going on here on Earth that are sinusoidal by their nature. They span short (high frequency) and long (low frequency) periods. Here are a few that I’ve thought of, short and long, but by no means is it a complete list.
Diurnal solar insolation and temperature variation, daily and monthly lunar tide cycles, seasonal variation of solar insolation by hemisphere, seasonal variation of temperatures by hemisphere, seasonal biomass variations, seasonal sea ice variations, seasonal albedo variations, 11 and 22 year solar cycles, Earth’s length of day variations, El Nino Southern Oscillation, North Atlantic Oscillation, Pacific Decadal Oscillation, Atlantic Multidecadal Oscillation, and at very long periods, Milankovitch cycles.
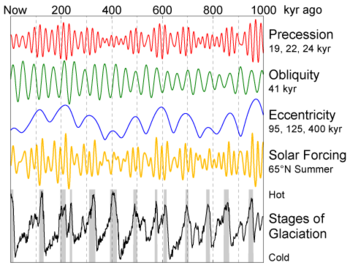
There are many many cycles on earth that are known, some yet to be discovered. Almost all of them have a root cause in periodic circular motions such as planetary rotation and orbital motion in our solar system and the variances of orbital eccentricity, obliquity, and precession. For example, the graph below shows how these different waves eventually synchronize to cause cycles of ice ages on earth.
To illustrate how sinusoidal cycles can conspire to produce peaks and valleys in amplitude, this interactive Java sinusoidal generator allows you to combine three different waves of varying phase, amplitude, and wavelength and see the resultant wave that forms from them:

During my limited experimentation above I couldn’t get the generator to produce a Draupner type wave, but as you can see in the screencap above, I was able to illustrate how a new peak can be generated (in blue) that is larger than any of the source wave peaks.
Here is an example of how “wave focusing” can occur to produce a Draupner type peak:

Lest you think this essay is about childs play with sinusoids, I’ll point out that there have been some serious works done on the mathematics behind the creation of “rogue waves”. For example there’s this brief discussion from the link commenter “hotrod” originally provided:
BBC Two, on November 14, 2002, aired a program on this phenomenon and its recent mathematical analysis. Freak waves, also “rogue waves,” “monster waves,” are extraordinarily tall and steep waves that appear sporadically and wreck havoc with shipping. One is suspected to have washed away the German cargo München which went down with all hands in the midst of a routine voyage in 1978. More recently, the cruise ship Caledonian Star was struck by a 30m wave on March 2, 2001. The standard analysis of ocean waves predicts a Gaussian-like distribution of heights; extreme heights, although possible, should be very rare – a 30m wave is expected once in ten thousand years, according to the BBC. But these waves occur much more frequently than predicted. The program focused on new methods of analysis, and on the work of the mathematician A. R. Osborne (Fisica Generale, Torino). Osborne has applied the inverse scattering transform, which he describes as “nonlinear Fourier analysis,” to the time series analysis of wave data. He conducted simulations using the nonlinear Schrödinger equation and found near agreement with the standard analysis, except that “every once in a while a large rogue wave rises up out of the random background noise.” His paper, available online, gives an example of such a simulation:

From CIM Bulletin #14 at http://at.yorku.ca/i/a/a/h/51.htm
Here’s a paper (PDF) on the Draupner wave titled: THE SHAPE OF THE DRAUPNER WAVE OF 1STJANUARY 1995 from Paul Taylor, Department of Engineering Science, University of Oxford. Taylor did a mathematiucal analysis of the Draupner wave, created a model to approximate the formation of it, and concluded that: “The New Year wave is ~ 1 in 2×10^5 waves” which when you think about it, makes it fairly common especially when you view it in context to images like the one below:

So it seems that such amplified rogue waves are fairly common in the nature of our oceans. That’s quite a journey from them one time being considered “mystical” by science.
Another scientific paper (PDF) of interest is: Physical Mechanisms of the Rogue Wave Phenomenon by Christian Kharif and Efim Pelinovsky of IRPHE in France and the Institute of Applied Physics in Russia, respectively. They conclude (emphasis mine):
All the physical scenarios of possible extreme wave generation (focusing, wave-current interaction, modulational instability), in fact, were known but only now (during the last 5 years) they are “dressed” by mathematical models of various levels (linear, weakly nonlinear, fully nonlinear models). Results of numerical simulations show the behaviour of each mechanism taking into account the random character of the wind waves in the ocean. Computations provide also the probability of rogue wave occurrence for simplified conditions. The many results are very sensitive to the model parameters (shape of wave spectrum, various corrections of the weakly nonlinear evolution models, accuracy of numerical schemes for long49 time computations).
Given that rogue waves were once thought to be the fantasy of imaginative sailors and fishermen, and given that science has now only addressed the problem once one was measured in 1995, it illustrates how something once thought to be impossible is now possible once it is measured, better understood, and studies published about it.
By the same logic, things like the Pacific Decadal Oscillation weren’t discovered until fairly recently. The PDO was named by Steven R. Hare, of the University of Washington, who noticed it while studying salmon production patterns (See BAMS article, PDF). Almost simultaneously the PDO climate pattern was also found by Yuan Zhang. This happened in 1997. It is one more natural cycle added to the many that were already known such as the El Niño-Southern Oscillation (ENSO) and the North Atlantic Oscillation (NAO)
Perhaps it is not an unreasonable to consider that on occasion, some of these cycles conspire to produce extreme ocean events like the 1998 Super El Niño.

And, given the difficulty in predicting exactly when natural cycles might coincide to produce such an event, perhaps this is why they are so hard to predict. For example, there was Dr. James Hansen’s 2006 prediction about a “super El Niño” that would rival the 1983 and 1997-1998 El Niño events.
In March 2006, Hansen wrote a paper claiming the following:
We suggest that an El Niño is likely to originate in 2006 and that there is a good chance it will be a “super El Niño”, rivaling the 1983 and 1997-1998 El Niños, which were successively labeled the “El Niño of the century” as they were of unprecedented strength in the previous 100 years.
We all know now that prediction was a bust. While there was in fact a 2006-2007 El Niño event. In the words of climatologist Mike McPhadden the event:
“started late, ended early and was below average strength”
Hansen’s prediction of a “super” event “rivaling the 1983 and 1997-1998 El Niños” never came true. Undeterred, Hansen is still predicting the onset of an El Niño event that will drive global temperatures to a new record high in 2009 or 2010. (h/t to Roger Pielke Jr on Prometheus)
Perhaps the applications of the studies of rogue ocean waves might be useful in figuring out if the 1998 event was in fact a synchronicity of natural cycles, linear, non-linear, and chaotic for a brief time, and if so, applied towards forecasting future super El Niño and La Niña events. I think it is worth considering. – Anthony
In all things there is a law of cycles.– Publius Cornelius Tacitus (55-117) Roman historian.
and the same could be said for rogue waves, except the color would be different.
Isn’t that what synchronized chaos was all about?
http://wattsupwiththat.com/?s=synchronized+chaos
Climate has a lot more differential equations driving it than waves in the sea.
Look at the figures in:
http://www.uwm.edu/~kravtsov/downloads/GRL-Tsonis.pdf
to see how el Ninos can arise.
Watch out for oceans bearing cosmetic powders!
Rouge . . . rogue . . . whatever . . . blasted spellcheck! 😉
REPLY: Thanks, I fixed that. Funny how technology can aid us in getting things wrong. – Anthony
The Schrodinger wave equation predicts the existence of these occasional very strong waves, and describes them well. – M of B
REPLY: Yes it does, and it is referenced in the peer review paper as well as the Wiki article I cited – Anthony
Wow I am humbled that you thought my random observation was worthy of a full article!
As you commented, sometimes you just trip over something that seems remarkably similar to something else locked away in the memory closet. As Sir Winston Churchill commented:
Thank you for providing a forum where like minded, highly curious people can share their thoughts with others who have the means and skills to investigate them properly. Many times these random thoughts are dead ends in and of themselves, but even when you are wrong, you learn something interesting when you discover why.
The breadth of knowledge, skills and experience, found on this forum never cease to amaze me. One of the strengths of the internet is it allows people to step out of their stove pipe specialties and allows folks to talk to and listen to people they would never ever meet in real life.
Larry
REPLY: I often think that the ratio of good ideas to bad ones is usually about 1 to 100. Even the best scientists make mistakes. All ideas are simply educated guesses until proven otherwise. Unfortunately, for adversarial positions and common trolls, citing the bad ones is often the tool of choice. Let’s hope this one turns out well. We could both be wrong, all I ask is further investigation to find out. – Anthony
Lighthouse keeper O’Driscoll reported a wave splashing into the 177 ft (54 metres) high light at the top of the lighthouse.
The Fastnet Lighthouse, Light on a lonely rock The Economist, Dec 18th, 2008
And in fact what is to prevent it from being “rogue data”, thrown in to confuse things. I would be more believing it were real if it weren’t for the danged truth that most fudge seems to be one sided. This one spike biases the entire thinking ‘hot’.
As an engineer, when data like this shows up, the first response is to ignore. It would take another similar occurrence to get attention. Something to keep in mind: Measuring is a not an exact science.
Didn’t we just recently learn the ice extent sensors went bad and no one noticed for months?
To explain the 1998 temperature spike, you need more than the 1997-98 El Nino.
Although it was big one, it wasn’t especially out of the ordinary as there was other big El Ninos such as in 1982-83 and other years which didn’t produce nearly the impact.
http://img258.imageshack.us/img258/2453/nino1974.png
If you add in the super spike that the AMO had as well in 1998, you can get closer to the impact.
http://img258.imageshack.us/img258/2434/amo1974.png
There are other super temperature spikes in the record – 1878, 1915, 1941, 1973 among others. These seem to occur (more often anyway) when both the ENSO and the AMO spike at the same time.
In terms of the rogue wave idea, there is something called atmospheric angular momentum which could be the driver. During El Ninos, the earth’s rotation literally speeds up (a few tenths of a millisecond) which happens when the winds slow down and potentially causes warmer Pacific ocean waters to backup into the El Nino region. There is a strong correlation actually but there are times when it seems to be off quite a bit.
http://img15.imageshack.us/img15/8463/aamnino34.png
OT and I’m sure one of the bad ideas mentioned above – but since I was a teenage I’ve been heavily into Archeology. Yesterday while day dreaming I suddenly wondered if the Aztecs idea that the world had a 52 year cycle at which time the world may end had anything to do with planetary cycles they had witnessed over the centuries:
http://en.wikipedia.org/wiki/New_Fire_ceremony
Your timing is uncanny. I had a friend who was skim boarding in Baja 5 years ago and was hit by a rogue wave that fractured his arm and 3 vertebrae. And just yesterday I used that example to explain not just the 1998 spike but the 80’s and 90’s un-coupling of temperatures with solar output. NOAA’s Rodney Viereck in 2001 wrote about the solar connection to ocean heat content http://www.oar.noaa.gov/spotlite/archive/images/sunclimate_3b.gif
but it has been argued that the temperatures have since decoupled from the solar trend and that is the proof for AGW.
Wunsch has stated that there is no way to predict when heat will be released from the oceans. I see the release of ocean heat as a wild card that confounds most linear correlations and simplistic attributions. I think the AGW team has simply confused “ocean weather”caused by rogue waves, etc. missing the bigger picture of variable “ocean climate”.
For that matter I think they confused “solar weather” with “solar climate”. The AGW folks like to say the past 25 years of satellite solar data eliminates any climate correlation with the sun. As susnspot activity continues to be depressed they may see the past 25 years was just a brief glimpse of “solar weather”, there is a bigger picture they have ignored.
In his book “The Selfish Gene” Richard Dawkins mentions the idea of a “meme”. A meme is a piece of information that is passed from one person to another. So conversation, however it takes place, online, in the pub, in business meetings is mixing memes similar to the way that genes are mixed in mating.
Most meme mixes end up as of average interest, some are stupid and some are brilliant. Well done Hotrod for putting 2 & 2 together so well and to Anthony for acting on it. I, like every other contributor, hope one day to add two thoughts (memes) together that will make a difference to the way that we perceive the world.
Bill Illis: A clarification, please. Atmospheric angular momentum lags ENSO by a month or two, doesn’t it?
I would *completely* buy the notion that there are several different cycles of things going on at more or less their own pace (though they can influence each other somewhat) and at times they all add up or can cancel each other.
It is also somewhat silly for people such as the IPCC to take a decadal trend and project it a century into the future but that is what happens when you get railroad engineers managing a climate policy.
Those waveforms remind me very much of the Decca Navigator System. “Standing waves” would be generated by distant phase locked transmitters operating in the very low frequency band of around 14.2kilohertz. The system fell out of use with the arrival of GPS.
“[…] random character of the wind waves in the ocean.”
There’s another assumption to challenge.
“Computations provide also the probability of rogue wave occurrence for simplified conditions.”
Emphasis on “simplified”. Look at the current financial crisis for evidence of bad distribution-tail assumptions.
The many results are very sensitive […]”
With websites like ‘Watts Up?’, could we be approaching an era when children grow up fully aware of Lorenz’s contribution?
– – – – – – –
Re: anna v (10:06:46)
It is research funding, computers, & a collection of human minds, among other things, that are being driven by the abstractions known as differential equations. The danger I see, after 12 years of formal study in 5 disciplines, is in overlooking the limitations of abstract constructs (or worse: denying that such limitations exist despite lucid awareness).
– – – – – – – – – – –
This “rogue wave” article was a brilliant idea. The concept is tangible – widely accessible.
Now the truth is exposed for all to understand:
a) Spatiotemporal heterogeneity exists.
b) Earth is a multi-scale integrator.
c) Radical reorganization occurs without radically-altered inputs.
The simplicity only gets lost in translation (to the mathematical language).
Modelers have my best wishes – and sympathy.
– – – – – – – –
http://ivs.nict.go.jp/mirror/publications/ar2003/acoso/img1.gif
From: http://www.uah.edu/News/sciencenow/
Most powerful cosmic explosion brightens student’s 1st day on job
Adam Goldstein’s first day on the job tending the Gamma-ray Burst Monitor (GBM) instrument on NASA’s Fermi Gamma-ray Space Telescope was a doozy.
A graduate physics student at The University of Alabama in Huntsville, Goldstein was still learning the ropes the evening of Sept. 16, 2008, nearing the end of his 12-hour on-call shift when the GBM called his cell phone to signal that a burst had been detected.
That in itself wasn’t remarkable: GBM detects about one burst a day and it keeps Goldstein’s cell phone number handy, along with those of the other GBM team members.
This burst, however, lasted 23 minutes � almost 700 times as long as the two-second average for high-energy gamma-ray bursts. And that was just for starters.
“I was in class the next morning when Alexander (van der Horst, a NASA post-doctoral fellow) called me up and told me the LAT (Fermi’s Large Area Telescope) had found photons from that same burst,” Goldstein recalls. “At the time, when you get a burst you oooh and aaah but it’s not until you can sit down and do the spectral analysis that you know what you’ve found. And if another instrument looked at it, then you’ve got the chance to do some real science.”
The first significant gamma-ray burst detected by the LAT (Fermi was lifted into orbit in June), this burst bursts with superlatives. When the analysis of spectral data collected by a telescope on the ground was finished in November, the burst’s “red shift” put its point of origin about 12 billion light years from Earth. (Seen from Earth it came from just below the star Chi Carina in the southern sky.)
When that distance is factored with the burst’s brightness at the Fermi sensors, it becomes the most powerful gamma-ray event ever detected � four times as powerful at the source as the second strongest burst ever detected, said Dr. Valerie Connaughton, a scientist in UAHuntsville’s Center for Space Plasma and Aeronomic Research (CSPAR) and a member of the GBM team.
“This is the most spectacular burst ever seen at high energy,” she said. “If the event that caused this blew out in every direction instead of being a focused beam, it would be equivalent to 4.9 times the mass of the sun being converted to gamma rays in a matter of minutes.”
This theory-bruising burst is the subject of research published today in “Science Express,” the on-line scientific journal of the American Association for the Advancement of Science. A collaborative effort by more than 250 scientists around the world, it is the first gamma-ray burst findings to be reported from the Fermi telescope.
The day after the burst, when Goldstein learned that his first burst was noteworthy, he called his parents in Pineville, Missouri, to share the news that his dreams were coming to fruition.
“The next day I talked to them when I found out what a big deal it was,” said Goldstein, who is completing a catalogue of gamma-ray burst data from an earlier orbiting detector as part of his thesis research. “I have always wanted to work with NASA, so for me this is an ideal place to be.”
Goldstein’s enthusiasm has spread to his family. One of the “honors” accorded a scientist when a burst is seen on his or her shift is the responsibility of writing a circular describing the burst’s coordinates and characteristics for the Gamma-ray burst Coordinates Network (GCN). Since posting his description of the Sept. 16 burst, Goldstein said, his father Scott has taken to routinely checking the GCN to see if his son has posted anything new.
The Sept. 16 burst is a theory bender because theories developed to explain gamma-ray bursts � believed to be the most powerful explosions since the Big Bang � don’t “allow” some of the behaviors seen by the Fermi instruments.
This includes the 23-minute duration. Roaring through space for 12 billion years tends to s-t-r-e-t-c-h waves of electromagnetic energy. Accounting for that stretching means the burst was a solid four minutes in duration when it was created.
“It is difficult to imagine keeping a central gamma-ray �engine’ active for that period of time,” said Dr. Michael Briggs, a CSPAR scientist and GBM team member.
Another problem is in the energy itself. Most gamma-ray bursts start hot with high-energy gamma rays, then fade to progressively weaker rays. The Sept. 16 burst started “cool,” with the high-energy gamma rays showing up almost five seconds later. That wasn’t expected.
And the burst had both high and low energy photons at the same time for about 200 seconds (also not expected), said Briggs. “It means everything that created both sets of rays happened in the same space at the same time, which is very difficult to explain.”
After not quite three and a half minutes the cooler gamma rays became too weak to detect, but the high-energy rays continued for at least 20 more minutes. (It was still going when the burst moved out of the LAT’s field of view.) If the cataclysmic cosmic event that caused the burst was fading away, why would the weaker gamma rays disappear while the strong ones stick around?
Gamma rays are at the highest end of the energy spectrum, with as much as one million times as much energy per photon as X-rays. Gamma-ray bursts are believed to come from dying stars that explode or collapse, potentially releasing as much energy in a few seconds (or minutes) as our sun will generate in billions of years.
Goldstein was the first (and is still the only) UAHuntsville graduate student to join the GBM team but several post-doctoral students have joined since the success of his first night, swelling the team to about ten. While the GBM instrument notifies team members and other scientists around the world when it detects a burst, someone has to be on-duty tending the instrument at all times. This responsibility is rotated in 12-hour shifts between the team in UAHuntsville’s Cramer Hall and scientists at the Max Planck Institute in Germany.
And: http://www.princeton.edu/pr/news/98/c/1019-clips.htm
Astronomy
Copyright 1998 Kalmbach Publishing Company
November, 1998
HEADLINE: Souped-up supernova: hypernovae may spark gamma-ray bursts.
Gamma-ray bursts have left astronomers scratching their heads ever since they were discovered by U.S. military satellites in the late 1960s. Part of the mystery was solved last year when astronomers found that these bursts emanate from galaxies billions of light-years away. But what exactly triggers these explosions, which can release 1,000 times more radiation than supernovae? A gamma-ray burst and a supernova recently flared from the same patch of sky, strongly suggesting that at least some gamma-ray bursts are triggered by stellar explosions. “This could be the missing link between supernovae and gamma-ray bursts” says astrophysicist Stan Woosley of the University of California, Santa Cruz.
On April 25, two satellites, BeppoSAX and the Compton Gamma Ray Observatory, detected the gamma-ray burst in the southern constellation Telescopium. On May 2, Dutch astronomers spotted Supernova 1998bw flaring in a spiral arm of a galaxy 120 million light-years away, in the same area as the April 25 burst. “The probability of a chance coincidence between the gamma-ray burst and Supernova 1998bw is well below one in ten thousand,” says Princeton University astronomer Bohdan Paczynski.
Supernova 1998bw is perhaps the most peculiar supernova ever seen. Astronomers were startled by radio observations showing material racing outward at nearly the speed of light, suggesting an explosion much more powerful than most supernovae.
Perhaps this event was a “hypernova”– a term Paczynski coined in 1997 to describe stellar explosions 100 times more powerful than supernovae. While nobody knows exactly how a hypernova would work, Woosley has published a theoretical model in which a massive, rapidly rotating star collapses at the end of its life to form a black hole. The black hole voraciously accretes matter from a surrounding disk, powering twin, high-speed jets that slam into surrounding interstellar gas and generate a gamma-ray burst. …
We’ve all scratched our heads at those stick and seashell “maps” the Polynesians used to navigate between islands, wondering at how the experienced navigators could locate themselves using just the patterns of the waves seen from a canoe. The Kiberg aerial photo above puts some context around those maps. I’ve seen the same patterns from the air around some coasts, and you could tell there was an island or several just from patterns even when visibility was haze limited.
OT some curious hedging in the latest Catlin update, with ‘bad weather’ on the horizon.
http://www.catlinarcticsurvey.com/live_from_the_ice.aspx
“Today the team continued to navigate towards the runway identified on satellite imagery by the Operations team. Having covered 7.75km, they anticipate reaching their destination and beginning a thorough detailed search of the area at around midday.
All team members are in very high spirits and are looking forward to the excitement of the forthcoming resupply. However, a front of strong winds and bad weather on the horizon, heading their direction and may yet interfere with the resupply schedules. Due to the nature of the terrain, the environment and the logistical elements of the operation, contingency planning is essential in the Polar regions, so all team members are on standby for last minute changes as plans D, E, F and G may be implemented. “
Dan S (10:51:12)
“[…] 52 year cycle […]”
Dan, you may be interested to know that I find a 52 year signature, along with its harmonics, in geophysical time series. The features are noticeable even during precursory exploration – and they are easily related (no causation being advocated here) to what some may consider “provocative” theories.
To be clear: I am not making claims about causation – only reporting observation (like the so-called ‘mythical’ rogue waves).
OT
Scientific American. Ice bridge in Antarctica collapses. Yep. Global Warming.
http://www.sciam.com/article.cfm?id=ice-bridge-holding-antarc
Bill Illis (10:50:37) :
“In terms of the rogue wave idea, there is something called atmospheric angular momentum which could be the driver. During El Ninos, the earth’s rotation literally speeds up (a few tenths of a millisecond) which happens when the winds slow down and potentially causes warmer Pacific ocean waters to backup into the El Nino region. There is a strong correlation actually but there are times when it seems to be off quite a bit.
This seems very logical to me and up to now the only explanation.
LOD changes could provoke this too.
The 1983 El Nino was masked by the El Chichon eruption. Looking at the NINO34 index it was on par with the 1997 El Nino.
http://home.casema.nl/errenwijlens/co2/ninoforecast.gif
The similarity of 1972-1983 with 1997-2008 is striking, only that the 2008 El Nino did not aterialize, in fact it was a big negative spike. I don’t see this super el nino developing soon. The final verdict however can only be made after 2023.
Hansen needs his super el nino to occur very soon now…
While I haven’t researched it a thought about cycles occurred to me last night. In a follow on post to the one you referenced, I linked to a plot a made of trends for Hadley of various lengths. The point of which is that there is a distinct sinusoidal pattern with a 60 year wave length of trends that becomes very evident when you get around lengths of 20 -30 years. I started to wonder about longer length patterns, but there isn’t any global temperature data going back that far. But roughly, if the MWP was 1000 AD and LIA 1500 and assuming we’re in the MWP2 (another 500 years) there should be a similar peak and trough at 0 AD and 500 AD respectively. That would mean we’re at the peak of at least a 1000 year wave and a 60 year wave. What other patterns might have synced to produce the warming since 1900?
From my oceanography courses, wave oscillations that are convergent would create larger ones. I don’t see why something similar wouldn’t be applicable when talking about all the systems at play that affect our climate.
I had one of those “V8” moments when I read that comment as it struck as one of those “truisms”.
I don’t suppose the initiating event for this has anything to do with high Antarctic ice levels…nah, it has to be AGW (according to unScientific American)…
Ice bridge holding Antarctic ice shelf cracks up
http://www.sciam.com/article.cfm?id=ice-bridge-holding-antarc
http://news.stanford.edu/news/2006/march1/ainansr-030106.html
“Flares hit Earth in 1998 and 2004”
In a 1999 issue of the journal Geophysical Review Letters, Inan and his STAR Lab colleagues reported the ionospheric effects of a giant gamma-ray flare from another star. It occurred on Aug. 27, 1998, in the middle of the night (as recorded at Stanford in the Pacific Daylight Time zone), but it ionized the atmosphere to levels usually found only during daytime.
Like a lighthouse whose spinning beam hits a specific point on shore at regular intervals, this neutron star had a periodicity. It spewed gamma rays every 5.16 seconds. “We observed the ionosphere respond to that,” Inan said. “The ionosphere was in fact pulsating at night.”
This is science at its best – seemingly unrelated observations leading to a(n) hypothesis requiring further observations, thinking, and refinement.
Who knows the outcome? But then the discovery of the “truth”, whatever it might be, is the primary goal, nothing more or less.
http://www.highbeam.com/doc/1P2-6654279.html
Newspaper article from our research archive:
See more articles from The+Milwaukee+Journal+Sentinel
Star surge: Massive blast from space hit Earth Gamma ray burst deflected by atmosphere is largest recorded beyond the sun
Article from:
The Milwaukee Journal Sentinel (Milwaukee, WI)
Article date:
September 30, 1998
Author:
| Copyright informationCopyright 1998 The Milwaukee Journal Sentinel. Provided by ProQuest LLC. (Hide copyright information)
A burst of radiation from a distant star smashed into the Earth’s upper atmosphere last month with enough energy to power civilization for a billion billion years, astronomers say.
The immense wave of energy, the most powerful ever recorded from beyond the sun, caused at least two satellites to shut down briefly, but it reached the Earth’s surface at a strength equal only to a typical single dental X-ray.
“We’ve been monitoring things like this for 30 years and we’ve never seen anything like this before,” Kevin Hurley, a research physicist at the University of California, Berkeley, said Tuesday. The burst of gamma and X-ray radiation struck the Earth over the Pacific Ocean at night on … “
Looking at the 1979-2008 UAH chart, if there were no Chichon and Pinatubo eruptions (decreasing the early average) and no 1998 super Nino (increasing the late period), there would be barely 0.2 °C temperature change during the 1978-2003. Quite consistent with high but stalling Sun activity after the 1910-1960 spike up.
So finally we realise that the spike in temperatures was due to an extreme El Nino. Of course this extreme also then cools the subsequent years (so you have to take out the peak and the tough). Guess that means global warming peaked very recently.
BTW there is something wrong with your trendline as almost all recent values sit well above the line. It looks like an extrapolation to me???
“Hansen is still predicting the onset of an El Niño event that will drive global temperatures to a new record high in 2009 or 2010”
And when this again does not eventuate the predictions will surely continue unabated with no apologies for the mistakes left behind. BBC and other media never seem to point out his errors.
Hmm the rogue wave event of Jan 1, 2005 seems conspicuously close to to earthquake / Tsunami event of Dec 26, 2004 to me. (I have seen speculation that that earthquake might have been triggered by a gravity wave from another major gamma ray burst which came through a day later, although going by the Oulu data the next major burst was a few weeks later on Jan 20,2005 (Ironically also had that drop spike drop pattern))
Speaking of the Oulu data, any thoughts on possible intractions leading to 1998 by the severe dropoff from mid-1991. Obviously if this has any relation it would need to be a very long lived one since the driver and driven response would be seperated by 6 to 7 years.
WUWT is risking to be prosecuted by the Inquisitionby insinuating again that barycentric nonsense hidden behind these wavy issue.
But, we´ll keep on saying: “E pur si muove”
What we need is all things in place, like Carsten A. Arnholm in their wonderful Solar Motion and Solar Simulator2 programs:
http://arnholm.org/software/index.htm
MarcH: “Hansen is still predicting the onset of an El Niño event that will drive global temperatures to a new record high in 2009 or 2010″….+-10 years
“…so all team members are on standby for last minute changes as plans D, E, F and G may be implemented. “
Plan D: Break out the freeze-dried hot-toddy mix that been lugged since the beginning, set fire to the radar machine and warm up three mugs full,
Plan E: shake hands and a round of hugs and warm, earnest goodbyes,
Plan F: break out the flares, shed a couple of layers so one can bend over and kiss their… goodbye…
Plan G: send the pre-constructed dataset that confirms the ice will be gone by the solstice and then bite down on the little pill packed for just this occasion….
for the record here is a site describing the graity wave theory
http://www.etheric.com/GalacticCenter/GRB.html
Ron de Haan (12:46:55) :
Like a lighthouse whose spinning beam hits a specific point on shore at regular intervals, this neutron star had a periodicity. It spewed gamma rays every 5.16 seconds. “We observed the ionosphere respond to that,” Inan said. “The ionosphere was in fact pulsating at night.”
All that talk about giant gamma-ray bursts is very interesting from the view point of gamma-ray astronomy, but it is most unlikely that the bursts have any weather or climate effects. The extra ionizations disappears on a time scale of seconds [otherwise one could not observe pulsations with a period of 5.16 seconds …], and the total energy was very low compared with what we get from the Sun. The various cosmic ray spikes [e.g. in 1991 and 2005] were due to flares on the Sun, not gamma-ray bursts from outer space.
Well I would be cautious about assigning the 1998 El Nino to a Draupner wave type of function.
The Draupner wave is essentially a standing wave pattern, which is the resultant of multiple travelling waves.
A Draupner wave phenomenon is well known to San Francisco Bay area boaters.
Just outside the Golden Gate Bridge there is a larger bay area bounded on the North by the Marin coastline. This area is commonly referred to as “The Potato Patch”. Wne you get ocean rollers and wind waves along with the GG currents, all of those travelling waves are going in several directions, and the Marin coastline drops relatively quickly into the water forming a reflective barrier, so there are waves all travelling in a lot of directions at once.
And when you try running a small boat (20 ft) through that area; what you find is that you cannot determine the dominent wave direction except for perhaps the long ocean rollers. Other than that you find that the water is “dancing”, and it simply pops up and down without moving in any direction; so ther id no boat speed or direction that is comfortable to run at. And that is the characteristic of standing waves. The waves in an organ pipe or on a violin string are standing waves formed by the interferrence (summation) of travelling waves going in opposite directions. The pipe or string is a transmission medium that propagates a certain wave velocity along it, and it also has a certain characteristic impedance.
On an electric transmission line such as a coax or parallel wirte line; the propagation velocity = 1/sqrt (LC) where L and C are the inductance and capacitance per unit length, and the characteristic impedance is sqrt(L/C) which works out to be Ohms if Henry’s and Farads are used for L and C (per unit length.
If the transmission line is terminated with an impedance equal to the characteristic impedance, the energy is absorbed in the termination, but if the lines is left open circuited, or short circuited, then a reflection occurs.
In the case where the line is open circuited, the reflected wave starts in phase with the incident wave so the amplitude steps up at the open end. In the short circuited case, the reflected wave is out of phase with the incident wave and the amplitude drops to dero at the termination. In either case a stadnign wave is formed between the incident and reflected waves.
So I don’t think there are any travelling waves in the climate sytem depicted by the temperature anomaly plots; so the 1998 El Nino is not likely to be a result of travelling wave superposition; but I do agree that it is likely to be a superposition of multiple climate effects that all hit it off together.
I must confess to having no understanding of just what physical phenomena result in either an El Nino, or a La Nina; but if I’m not mistaken, they typically manifest themselves in a localised climate pattern over a somewhat limited area of the Pacific to the West and south of Hawaii. So I am sure that the geographical structure of the pacific Basin is a primary factor in the phenomenon. The PDO on the other hand seems to be driven by somewhat more extended regional parameters. I don’t know beans about any of that, which is why I am not a climatologist.
George
DJ, a rogue wave has harmonics. Based on your logic, you would need to take those out too. Guess there hasn’t been any warming at all.
MattB (13:08:29) :“any thoughts on possible intractions leading to 1998 by the severe dropoff from mid-1991. Obviously if this has any relation it would need to be a very long lived one since the driver and driven response would be seperated by 6 to 7 years”
Henrik Svensmark & Nigel Calder, “The Chilling Stars”, p.77 graphs.
Driver and driven response: Sea water´s lag, after two drops in GCR, one in 1982 and the other in 1991.5
“Large patches of the Pacific and Indian oceans, and a region of the North Atlantic between Greenland and Scandinavia, show the strongest links between low cloud cover and cosmic rays”(Op.Cit.)
“”” DJ (13:06:22) :
So finally we realise that the spike in temperatures was due to an extreme El Nino. Of course this extreme also then cools the subsequent years (so you have to take out the peak and the tough). Guess that means global warming peaked very recently.
BTW there is something wrong with your trendline as almost all recent values sit well above the line. It looks like an extrapolation to me??? “””
What would be the physical phenomenon that causes an anomalous cooling following an anomalous warming.
Transient events that occur against a more or less steady background do not have to a zero net area. Presumably some transient energy increase caused the 1998 el nino; and whatever summation of sources created that anomaly; there is no requirement that they be a zero sum siuation.
So i think your assumption that 1998 el nino had to be followed by abnormal cooling has no physical basis.
George
BarryW (12:33:21) :
That would mean we’re at the peak of at least a 1000 year wave and a 60 year wave. What other patterns might have synced to produce the warming since 1900?
My favourite thinker of the month RayTomes produced this graph last year.
http://ray.tomes.biz/global-temp-cycles-human.png
It shows an impressively good hindcast fitting the temperature series, and a prediction for the next 30 years.
Although the cycles he used wouldn’t produce an el nino spike like 1998, you can see how a mixture of cycles can produce the ‘random looking’ variations in global temperature, taken on a running averae of 12 months or so.
Further on the subject of standing waves, the duration of a standing wave pattern is of the same order as the period of the travelling waves which caused it; and the 1998 el nino event contains a complete cycle in about 2 years maximum going by the graph above; so it would require travelling waves with a similar two year period to create a transient that also lasted two years total; and I don’t know what cyclic climate phenomena one sould propose that create multiple travelling wave phenomena at theat two year cyclic period.
So i think it was a chaotic event, that neverthe lesss resulted from multiple transient factors all summing in a favorable way.
George
Funny thing is that I saw a show on rogue waves a year or so ago. They have models for waves. Simple working linear models for simple phenomena.
There are examples of numerous large ships that have been crushed by huge rogue waves. The captains reported these events and weren’t believed. Well it turns out even these computer models were wrong. By handling the waves non-linearly they were able to predict the existence of rogue waves of a size reported by the captains of the numerous destroyed ships.
I don’t have any links unfortunately but its a case where computer models which were well known were unable to predict real natural phenomena.
—–
I was able to reconstruct the steig sat recon. It’s a lot of math but I got similar results.
http://noconsensus.wordpress.com/2009/04/05/steig-avhrr-reconstruction-from-satellite-data/
Adolfo Giurfa (13:41:32) :
Henrik Svensmark & Nigel Calder, “The Chilling Stars”, p.77 graphs.
Driver and driven response: Sea water´s lag, after two drops in GCR, one in 1982 and the other in 1991.5
Ironically next up on my list of books to get now that My Archibald Solar Cycle 24 has arrived
The way to look for the frequency components of a signal is to use a FFT. It seem odd to me that people just eyeball signals in the analog domain when the FFT is available. It is in excel.
Oldies around here will remember: It seems that such a rogue wave happened when putting off a radio receiver; just for an instant sound volume made a high peak…Hope nobody is doing the same with the Sun 🙂
DJ (13:06:22) :
If you’re referring to the purple trend line the trend is an OLS based on only the data prior to the 97/98 El Niño. The red is using all of the data. The dashed purple portion is an extrapolation of what the temps would look like without the super El Niño effects, and that part of the data is well above the purple trend line, but seems to be decaying back to that line.
In case someone is curious, I picked the start and stop points for the El Niño as close to the zero anomaly line as I could so they had some rationale since I didn’t have the data at that time. The official points probably differ.
The plot of the RSS trends with and without the data later than the 1998 El Nino is rather misleading – as DJ suggested the second line is an extrapolation from the data up to El Nino. There is certainly an argument to be made that a major event in a relatively short time series can skew the data, but it shouldn’t depend on ignoring the last eleven years of data! A simple way of determining how robust the value of the linear temperature trend is to the 1998 El Nino is to determine a new slope taking out just the points above the long term initial line.
As I have the UAH data to hand, I just removed all the data from October 1997 to February 1999. The result is a reduction of the linear trend from 0.0106 to 0.0100 degC/year. The reduction would be even less if the subsequent La Nina data were also removed.
Whatever the causes of the 1998 El Nino, it is doing very little to either enhance or mask any underlying long-term temperature trends.
REPLY: See Barry Wise’ response in this thread. Perhaps that will clarify it for you. – Anthony
Adolfo Giurfa (13:08:31) :
WUWT is risking to be prosecuted by the Inquisitionby insinuating again that barycentric nonsense hidden behind these wavy issue.
But, we´ll keep on saying: “E pur si muove”
What we need is all things in place, like Carsten A. Arnholm in their wonderful Solar Motion and Solar Simulator2 programs:
http://arnholm.org/software/index.htm
Many thanks for the compliments, but I can’t see any relation to barycenters in this story. And as has recently been shown in another thread here, the barycenter theory does not stand after close scrutiny. I thought it would, but it didn’t. Science is sufficiently fascinating, and the current thread is a good example of other lines of investigation we should be following. The talk about gamma ray bursts is very interesting for example.
REPLY: I am sufficiently sick enough of hearing about barycentric theory that anyone who posts anything else about it on this thread will have the post run through the byte grinder and reposted a collection of gobbledygook. Don’t make me go there. – Anthony
Anyone trying to make sense of the relationships between length of day (LOD), atmospheric angular momentum (AAM), & El Nino/La Nina/Southern Oscillation (ENSO) might want to take a look at the insightful wavelet plots in the following article:
http://www.uni-stuttgart.de/gi/research/schriftenreihe/quo_vadis/pdf/schmitzhuebsch.pdf
The plots appear under the references. Figure 1 (a,b,&c) shines some light on LOD/AAM/ENSO.
[Note: This is the stuff Sidorenkov & Sonechkin are writing about. Remember, Sidorenkov has a patent on a weather-forecasting method based on this stuff.]
Anthony,
Rather than clarification, if Barry Wise’ comment “(t)he dashed purple portion is an extrapolation of what the temps would look like without the super El Niño effects” is a justification for excluding all the temperature data since 1997, I’m afraid it raises far more questions than it answers.
REPLY: I understand where you are coming from, but the idea is to illustrate what the trend “might” have looked like without the 97/98 event. In this case Barry used a simple persistence forecasted trend line. As I’ve learned many times on WUWT, no trend line fitted to any type of data presented here would ever be satisfactory to 100% of the readers, someone will always find fault with some aspect of it. So, I’m not too worried that you have issues, it is expected. The point to take away is simply this: had the 97/98 El Nino not occurred, the slope for this dataset would be lower. A variety of different data selection and curve fitting techniques could be applied, each yielding different results. It can be argued ad inifinitum which method and result is best. – Anthony
“DJ (13:06:22)
“BTW there is something wrong with your trendline as almost all recent values sit well above the line. It looks like an extrapolation to me???”
See the caption under the graph, which includes:
“[…] This graph shows what the trend was before the event and how the trend was affected by it.”
It goes on to elaborate:
“The dashed red line is the trend with all of the data and the purple is the trend based on the data before the area highlighted in red.”
…So you are right – it is an extrapolation — and a good example of how extrapolation can fail (as Anthony has astutely observed).
btw: thanks for the great wave link Anthony:
http://www.eserc.stonybrook.edu/ProjectJava/WaveInteractionApplet/
I saw hotrod’s post about the rogue wave idea and was immediately dismissive, but then I recalled those annoying La Ninas just before and after it. That’s a characteristic of things like tsunamis, pulses run through low-pass fitlers, etc. So I elevated it to “interesting thought”.
The same thing shows up on both the Draupner Wave plot at the top of the post and in the simulated rogue wave later on.
I might try my hand with that sinusoidal testbed. A Fourier transform of an isolated impulse is all frequencies at equal amplitude and in phase. More approachable is the Fourier transform of a pulse train, which is all harmonics at equal amplitude and in phase. If anyone beats me to it, all I could say is thank you!
Time to make dinner….
I don’t know what happened, It’s like I missed half the post the first time I read it.
Blame the computer.
Fun post that makes a lot of sense.
Tom P (14:14:39) :
Tom, if you reread my original comment the point I was trying to make was that the data after the El Niño is related to it and is a continuation of that spike. With a temperature spike that large that’s a lot of heat that has to go somewhere. Some gets radiated into space but some returns to the system. My conjecture is that the system is acting as a decaying oscillator with the hump above the purple line the second peak after the 97/98 peak. Where the data crosses the purple dashed line (about 2008) I believe is the start of the next positive part of the cycle. As I said, this is conjecture, but if the data continues at about this level for a period of time (which could be a couple of years) and then recrosses the purple trend line I think that supports my belief.
Anthony,
You wrote:
“The point to take away is simply this: had the 97/98 El Nino not occurred, the slope for this dataset would be lower.”
I’m afraid you can’t claim that, unless you really want to insist that all the data from 1997 is so dominated by the 1997/8 El Niño event as to be discarded from any long term trend analysis. If you want to do that, you also remove any basis for claiming a more recent cooling trend as well.
Indeed, the whole point of the thread is consider that this El Niño was a rogue event, with a relatively short duration easily discernible above the background, just as the Draupner wave in the first plot you show. The effect of a rogue wave therefore has a defined end point, not a long-term persistence – the sea returns to an eery calm.
If the 1997/8 El Niño can be modelled as a rogue wave, its overall effects on the long-term temperature trend should be very slight, which is consistent with the satellite data.
REPLY: Well then, may I suggest that you make your own graph. Remove/replace/ignore/smooth/flatten the 97/98 event using any method of your choice, plot the trend, enjoy. Personally I think you are reading way too much into the graph,…but as I pointed out, it is what people tend to do with trendlines here followed by: Yes it is! No it isn’t! ad infinitum. You are welcome to plot your own interpretation, and post a link to it in some hosting service like imageshack. – Anthony
OT and rhetorical but I’ll chance it- Is it just me or are we beginning to experience overtures of hatchet-burying between once-implacable opponents!
Recently, I’ve visited realclimate.com as a sceptic and come away an optimist!
Change is afoot, I think, and we all must weigh up where we go from here!
The last few years of climate-discussion have, sadly, been witness to claim and counter-claim, attack-parry and riposte between, for the most part, highly intelligent individuals whom, while sharing the same level of passion, differ in conclusions!
Time for a truce, I think. Time to consider that our similarities are far more in synch than our differences of opinion superficially may suggest.
Excepting the extremist outliers, our shared belief is identical – we care for this planet. Yes, we differ in the detail-the symptons and the diagnosis – but we do agree!
IMHO- Chris at RealClimate is holding out an olive-branch that signals a simple message- Forget the past- let’s sort out the future!
Thank’s Chris
“use a FFT (14:07:11)”
…and then study half-planes for all possible window-widths to avoid being fooled by scale-dependent measures?
There is a reason why wavelet methods are shaking old habits – and of course they have their own suite of limitations.
It is easy to find examples where base-periods don’t even show up in spectra – & these are not just clever “trickster” examples.
Perhaps a carpenter needs a variety of tools….
I think what is being discussed here is a soliton – a constant speed wave or wave packet that remains highly non-dispersive in its energy content for varying intervals in the real world. In various forms (solutions to several types of differential equations some of which describe real phenomena) these have been known and mathematically described for almost two hundred years but received their name only recently. On the world’s oceans there are at any time of the order of ten active solitons that may endure from twenty to two hundred miles before they finally disperse. They are also used as pulse shapes in modern minimally dispersive fibre optic cables. The toroidal vortex of a common smoke ring is a kind of soliton. Lots of information is available on them by just googling soliton. Here’s a good starting point http://kasmana.people.cofc.edu/SOLITONPICS/
Rogue waves or holes in the sea …
did expirience one, 1979, between Spitzbergen and East-Greenland. Was not that
extreme as they could become. But nevertheless, about 18 to 19 meters (59 to 62 ft).
We lost the port crane and had an about 80 sqarefeet hole in the boats deck, about 17 meters above sea level. Wasn’t that fun. And it was so much cold there. Air temp about – 27°C, with the storm – measured peak was 132 knots, then the anemometer was cut off and vanished in night and sea. The felt temperature was about -55°C
To the Catlins: You felt nothing really, yet, when we’re talking about real cold temperatures. Better get out your ass and everything else bevore it’s getting really
cold over there…
Even in the rather flat part of the North Sea (German Bight), rogue waves are not uncommon. The sea rescue vessel “Adolph Bermpohl” lost Feb. 1967 the whole crew and the four dutch fishermen – saved some hours ago – due to a freak wave.
(Due to the echolot printing -saved, when the vessel was found a few days later- , they expirienced a sudden hole in the sea where the depth did go from 19 meters to nil.)
1995 another freak wave did kill two of the crew of the “Alfried Krupp”, when they were on the way back home, and the vessel did turn upside down.
Personally, I’ve seen when a ship fell sidewards into a hole in the sea, it was not the smallest one, length 144 meters, 6900 tons deadweight, nevertheless it did look
like somebody does fell sidewards from it’s stool.
Klausb
Barry,
Firstly, if you wish to model the El Niño event as a decaying oscillator, this is not consistent with what would be expected from a rogue wave.
Secondly, a decaying oscillator has an associated fixed period – the zero crossings of your purple line are far from evenly spaced indicating at the very least the behaviour is much more complicated than a simple damped oscillator response.
Anthony,
“Personally I think you are reading waaaaaayy to much into the graph…”
Really? All I did was look at the data precisely in terms of the El Niño being a rogue event, remove the associated data and see the trend for the UAH data reduce from 0.0106 to 0.0100 degC/year. I think this is the simplest possible analysis, unless you can suggest an alternative.
What you and Barry have presented relies on a much more complicated analysis based on the persistency of the response of a damped oscillator, an analysis which is neither consistent with the rogue wave model or indeed the data itself.
REPLY: Like I said, you are welcome to plot it and post it. BTW this is RSS data presented in the graph, not UAH. – Anthony
To clear up this matter about the red & purple lines:
[Re: Tom P (15:44:17)]
The key word in the caption under the graph is “before”. (Note that Barry used it twice.)
The purple line does not just chop off the El Nino event – it also chops off everything after it – (note where it switches from solid to dashed).
So: The dashed segment of the purple line can be considered an extrapolation into the future (based on the past – i.e. on the solid purple segment) that was made just-before the El Nino event (…so this really was a worthwhile example to consider).
I was interested in the post about angular momentum. It may be completely inconsequential, but aren’t all the windfarms being built/postulated a source of resistance? My electonics is long ago for me, but isn’t this implied when dropping power across soemthing like this? Maybe not so minimal on a local basis?
chip (16:51:55)
“[…] angular momentum […] aren’t all the windfarms being built/postulated a source of resistance? […]”
Why stop at windfarms? …dams, wells, tall buildings, tidal power, gulf-stream-turbines, airplanes, shipping of materials, etc. – all a ‘huge drag’ on Earth? ….and so the list of perceived “anthropogenic climate change” factors grows …& grows – despite back-of-the-envelope calculations meant to quell imagined amplitudes with reason.
There seems to be a bit of synchronocity here as others have also picked up hotrod’s vibes. See: http://www.twincities.com/opinion/ci_12057815
===================
Patrick McIlheran: Climate science, unsettled
By Patrick McIlheran
Posted: 04/03/2009
Anastasios Tsonis is not a lunatic, and no serious person says he is.
He is a scientist, a mathematician at the University of Wisconsin-Milwaukee whose specialty is climate. He and a colleague say they’ve figured out why the Earth is cooling.
It has been cooling, since about 2001, and Tsonis and a colleague say temperatures may go on cooling for 10 or 20 more years. Climate, Tsonis said, is heavily affected by a few well-known oscillating systems — El Nino, in the Pacific, is one — and from time to time, four big oscillations synchronize.
When they do, he says, they become coupled, as if synchronized swimmers tried holding hands, and this messes up the dance. There is, then, a sudden shift in trends. If it had been getting hotter, it gets cooler, and vice versa. This happened in 1943, in the 1970s, in 2001, and it will happen again, he says…
============
But the 1997-98 El Nino and the temperatures which resulted ARE an outlier.
It has certainly affected the trendline (any simple linear regression trendline is going to respond to a huge outlier spike which is towards the end of the timeline – it is just math).
The only time period in the record which comes close is the 1877-78 El Nino where temps spiked a little higher even.
In fact, it is very interesting (actually more than a little interesting) how similar these two time periods are: being exactly 120 years apart. If it wasn’t for Krakatoa getting in the way, they would probably have exactly the same slope as well.
Here are the same 30 year time periods for the 4 biggest Super El Ninos in the record.
http://img12.imageshack.us/img12/9844/superelninos.png
The 1982/3 el nino does show very clearly in lod but 1998 does not.
Processed for time localisation, not amplitude
http://www.gpsl.net/climate/data/earth-lod-el-nino.png
The 1998 event seems very strange. Something I have not followed up was noticing it appears in the topex/jason sea level data _before_ the amsu data. I don’t understand that, sea level before temperature? (or I am wrong, quite possible finger trouble)
http://www.gpsl.net/climate/data/jason-2009-04-06a.png
Some have mentioned a decaying oscillation from the 1998 event, I disagree.
The heat pulse seems to arrive in the tropics and travel toward the poles over time. This is the tropics ocean amsu data where both 1983 and 1998 can be seen
http://www.gpsl.net/climate/data/MCU_tls_tropics_ocean_2009-02-15a.png
Data is also given for a vertical slice from tropics to north, the USA48 data. This suggests the 1998 event can be seen time spreading as it travels north.
http://www.gpsl.net/climate/data/MCU_tls_usa48_2009-02-15a.png
Later here too, north pole ocean but that is the end of it
http://www.gpsl.net/climate/data/MCU_tls_north_pole_ocean_2009-02-15a.png
Anthony,
The RSS data, complete and without the El Niño event is here:
http://img9.imageshack.us/img9/32/rssdata.png
The RSS trend shows a similar small reduction as the UAH data, from 0.0155 to 0.0146 degC/year by excluding the event from the time series.
Unless you can both reject the rogue wave hypothesis for the cause of the 97/8 El Niño and explain why its effect should be the dominant driver for global temperatures more than a decade later, it’s not possible to say we see much of an influence from this event on the long-term temperature trends.
REPLY: Thanks for putting that up, I appreciate it. I should point that you mentioned this earlier:
I wrote: “The point to take away is simply this: had the 97/98 El Nino not occurred, the slope for this dataset would be lower.”
You wrote: “I’m afraid you can’t claim that…”
As I said, it would be lower, and your graph trend lines show exactly that. Lower, not as much as in Barry’s example, but lower nonetheless than if 97/98 data had remained.
Yes we can see from your method the trend would be different than what Barry plotted, no surprises there, but we can still speculate and investigate all we wish on the “rogue wave” theory, it is not negated by your graph. Just out of curiosity, how did you deal with the 97/98 data? Flatten, deleted, spliced? And what trend method did you use? It looks like a polynomial curve fit? This is where the ad infinitum part starts. 😉 – Anthony
Tim Channon (17:50:51)
“The 1982/3 el nino does show very clearly in lod but 1998 does not.”
You are wrong here Tim (your latter point) – see the rate of change:
http://ivs.nict.go.jp/mirror/publications/ar2003/acoso/img1.gif
It is also evident in the multi-decadal plots that include seasonal detail, but you really do have to look a lot more carefully (zoomed in) to see it.
Anthony,
There’s nothing in the data or my simple analysis that negates the rogue wave theory per se. It’s Barry’s analysis and derived trend that is inconsistent with it.
I just excluded the data during the event from the time series. It makes no discernible difference to the results if you replace it with a linear or any other reasonable interpolation so I really don’t think there is much room for dispute here.
There is of course a good mathematical reason why this event has a minimal effect on the long-term trends – it is in the middle third of the time series and so has little “leverage” on the slope. When the 97/8 El Niño first appeared in the time series, its initial effect was to greatly exaggerate the warming trend. In six years’ time its effect will be neutral, and beyond that it will contribute negatively, but with decreasing weighting, to the trend.
REPLY: Yes, I agree, start and end points have greater weighting, which is why in Barry’s method, his trend up to 97/98 is lower. – Anthony
Regarding Tom P (17:50:58)
http://img9.imageshack.us/img9/32/rssdata.png
Note for the non-statistically-oriented in the audience:
Tom P’s Example:
Cut out the El Nino event.
Barry’s Example:
Cut out the El Nino event and everything after.
The Upshot:
Considering different examples yields different insights.
The power of the rogue wave analogy is that it is accessible to a wide audience.
As economist Edward R. Dewey (1970) suggested:
“The study of cycles reveals to us our ignorance, and is therefore very disturbing to people whose ideas are crystallized.”
About Dewey and Economic Crashes:
“Dewey first became interested in cycles while Chief Economic Analyst of the Department of Commerce in 1930 or 1931 because President Hoover wanted to know the cause of the Great Depression. […] Dewey reports that economists gave him no consistent answers on the cause of the depression and he lost faith in economic methods. He received and took advice to study how business behaviour occurred rather than why.”
Source:
http://en.wikipedia.org/wiki/Edward_R._Dewey
It didn’t show when I processed the daily data, guessing because 1998 has a different kind of signature. I don’t want to mislead anyone so I can only apologise.
And now for an entirely different interpretation:
Solar warming – Solar cooling
How the change in ultraviolet radiation and the solar wind changes the parameters of the climate system and the character of the Southern Oscillation. Covers the reasons for the current cooling pattern. Suggests that there is more cooling to come.
Find it at http://climatechange1.wordpress.com/2009/04/05/solar-warming-solar-cooling/
Then shouldn’t we be seeing something like this on the negative end as well?
Tim Channon (17:50:51) :
It’s hard for me to tell whether the rise in the polar data is leading or lagging the tropic graph. It’d be nice to see an overlay.
If the heat pulse is moving poleward I would assume the effect on the global temperature would be less just because the temperature of the water moving north would be colder requiring more heat to achieve the same temperature effect when averaged into the global value, (or am I way off because it’s too late at night to be thinking about this).
Whether it’s a damped oscillator or other effect (and there are a number of other overlayed patterns in the data so I wouldn’t expect it to look like a classic oscillator that was just my first guess looking at the graph), the question is whether the system was driven out of the normal state and is now returning to it’s previous state or if it has been driven to a new state.
Now I’m wondering if the polar melting over the last decade is related to this pulse.
Anthony,
Your two approaches to the 97/8 El Niño event contradict each other. Either it can be analysed as
1. a “rogue wave” one of whose defining properties is its transience.
2. a persistent phenomenon which has dominated temperatures up to the present.
You currently appear to advocate the effects of both models operating at the same time.
REPLY: I don’t agree with your line of thinking that they are contradictory, because your thinking assumes the 97/98 event to be essentially a singularity, without any harmonics or return of energy back into the system. As Barry points out in comments, not all of the heat from the El Nino is radiated into space, some goes back into the system via weather, cell transport, oceanic transport, and other mechanisms. By simply removing or flattening the 97/98 data, you don’t remove the effects of that recycled heat in the system, nor can you predict how much of the real data after 97/98 is reflecting the return to equilibrium in the system from that heat event. If the 97/98 El Niño had not occurred, what would be the trend? We don’t know exactly, just as we don’t know how much of the signal after 97/98 is a portion of that heat returned to the system.
In Barry’s case, he extrapolates a trend line as if the event doesn’t happen at all, and the trend continues as it was, basically a persistence forecast for the temperature trend, not unlike some temperature trend forecasts we’ve seen issued by others.
In your case, you remove the 97/98 data, but do not make any adjustment for the effect of the 97/98 event recycling heat back into the system, nor can you, because you don’t know the magnitude.
Each method has its flaws. The ground truth trend (if a 97/98 El Niño did not occur) likely lies somewhere between the red an purple lines Barry plotted, or perhaps between your trend line minus El Niño and the purple line, but we will never know exactly where the trend would have been since we can’t remove the total effect of the El Niño, post event. – Anthony
Wow many thanks Anthony for the continued free-speech approach to scientific inquiry. The freak wave idea is a good one.
And thanks Hotrod for creating this little bit of reality….
The problem is that, as Tallbloke mentions in another thread, one wave suddenly robbing the energy from waves on either sides to become a steep-walled, super-high, nearly vertical, mega-troughed (the “hole”) wave…all of this happens “at once.”
Perhaps our impression of of what is “at once” needs to change.
There is a remarkable similarity between waves…if their periods are a few seconds or a few thousand years.
A wave is a wave….a transfer of energy.
So how to explain these big monsters?
Gotta delve in a little quantum.
Check out Anna V’s posts on rogue waves….
As others have alluded to here, if you can get a ‘rogue wave’ in the climate then you should be able to get a ‘rogue trough’. I’d like to know if there are any candidates for this in the past.
Anthony wrote: Perhaps the applications of the studies of rogue ocean waves might be useful in figuring out if the 1998 event was in fact a synchronicity of natural cycles, linear, non-linear, and chaotic for a brief time, and if so, applied towards forecasting future super El Niño and La Niña events. I think it is worth considering. – Anthony
Well said….
I realize the heatburn my chopping of the end data is giving to some people but you’re missing my point. IMO there is either a step change after the El Niño or the system is slowly returning to a previous state prior to the event. Just look at the peak values prior to it (in the neighborhood of .03) and after (over .4) with the last peak back to about .3.
Tom P (18:45:29) :
I disagree with your statement that what I’m proposing is at odds with the rogue wave. The temperature change in the atmosphere is related to a change in the forcing, either more energy coming in or being released by a sink. The rogue wave would be cycles of forcings that cause the spike. In this case, the ocean cycles (and maybe some other forcing) released enough heat to spike the global temperature. Once it’s in the atmosphere it’s got to go somewhere. Where did it go? Some was radiated away but some has to stick around because of good ole ghg’s. Why would the temperature spike and then return to previous values if there is residual heat in the system? Why is the slope prior and after the event so different? If not related where did the step after 2001 come from? Probably many answers based on data I’m ignorant of, but the heat has to come from and go to somewhere.
If you read the comments to the Scientific Socialism (formerly Scientific American) article about the ice bridge, you will see what is getting common with these types of articles. Almost all comments are skeptics heckling the scare-mongering. Science News website draws the same fire from skeptics.
Right after the 1998 event, there was a massive spike in snow accumulation on mountains in the Pacific Northwest region — for example ~9.5 metres, at ~900 metres elevation, at ~49 degees (latitude) north. [FYI: 1m ~= 3.3 feet]
For some refreshing ideas on ENSO, see p.5-6 in:
http://eprints.soton.ac.uk/19292/01/ex19.pdf
And if you are up for something a little more complicated – but along the same refreshing line of thinking:
http://forum.decvar.org/presentations/ENSO_WORKSHOP/documents/presentations/posters/Sonechkin-poster.pdf
BarryW (20:21:23) :
I realize the heatburn my chopping of the end data is giving to some people but you’re missing my point. IMO there is either a step change after the El Niño or the system is slowly returning to a previous state prior to the event.
Chen et al part2 2008
Another dramatic phase change occurred from the mid- to late 1990s. Though the PC time series begins to decline after 2000 and the GISTEMP time series (Fig. 1, top, black) even drops below zero in 2003, the 1990s event may turn out to have been a regime shift because, unlike the change that occurred in 1989, the peak in late 1999 reaches an amplitude comparable to those peaks between 1945 and 1975, suggesting a possible phase change on the interdecadal time scale. At the same time, the 1990s event coincides with dramatic interdecadal changes in the Pacific biosystem (Chavez et al.
2003) and ocean circulation (McPhaden and Zhang 2004). According to an analysis based on the Zebiak–Cane model, the interdecadal warm phase of the tropical Pacific since 1976 ends after the 1998 El Niño (Seager et al. 2004).
Take a look at the S&P stock price index 1871-2009
http://en.wikipedia.org/wiki/File:IE_Real_SandP_Prices,_Earnings,_and_Dividends_1871-2006.png
Looks to me like the rogue bankers created a rogue wave.
savethesharks (19:40:40) :
The problem is that, as Tallbloke mentions in another thread, one wave suddenly robbing the energy from waves on either sides to become a steep-walled, super-high, nearly vertical, mega-troughed (the “hole”) wave…all of this happens “at once.”
I had a bit more of a think about this. From the point of view of someone on a coast measuring the incoming waves in a mist, they would only see the amplitude of each wave as it was arriving. If they knew about rogue wave theory, they might measure several consecutive deeper then usual troughs and decide it was time to retreat further up the hill.
Perhaps Hansen, believing temperature on the longer term is increasing still, sees the several consecutive deeper dips in sea surface temperature since 2003 and concludes that ‘the big one’ is on it’s way.
If we could see more of climate ‘all at once’ like we are able to get in a spotter plane and see a rogue wave with the deeper troughs both in font of, and following it, we’d be able to predict short term climate anomalies like el nino’s produce.
I think it was Anthony that commented some time ago that the aa index seems to predict temperature several years ahead. It was mentioned upthread that someone has patented a weather prediction method based partly on the aa index. I produced my own prediction graph some time ago based on this idea (prior art!) and although it’s a bit early to tell how good it is, it seems to be working so far, though I got the recent temperature drops in the UAH and RSS a bit early. Matches SST’s quite well though.
http://1.2.3.10/bmi/cache.backpackinglight.com/backpackinglight/user_uploads/1231245089_09231.gif
“…During my limited experimentation above I couldn’t get the generator to produce a Draupner type wave…”
If I remember correctly, the idea about the appearance of Draupner waves was that there was a non-linear interaction between several consecutive waves in which one of them “stole” energy from the others nearby to rise to a greater height that was supposedly possible (or with a greater probability that was supposedly possible). In that case, linear addition of waves in a generator is not going to produce a monster wave.
Thinking about it, to “prove” the 1998 Super El Niño was caused by a Draupner wave effect we would need to find a mechanism by which the energy of previous and subsequent El Niños would be “concentrated” into one of the oscilations. If the energy for any of the oscilations is accumulated over several years, we just have to find a physical effect that would allow for the energy to be accumulated in a non-linear way. Maybe here is a PhD thesis for some student in non-linear physics?
tallbloke (22:58:25)
“[…] It was mentioned upthread that someone has patented a weather prediction method based partly on the aa index.”
That was LOD.
See the following for a good overview of the physics:
http://images.astronet.ru/pubd/2008/09/28/0001230882/425-439.pdf
The story is pitched at an accessible level.
Tip: Study your aa index correlations more carefully before you put money on your forecasts.
Thanks Paul, reading too many things at once here.
By the way, Geoff Sharp has offered to host the data you requested, link to follow.
Paul, here it is.
http://users.beagle.com.au/geoffsharp/ephemeris-z_axis1874.csv
Another very interesting thread, thanks everyone. Sometimes it’s difficult to handle too much “fringe” or otherwise unfamiliar stuff all at once, it can easily press our “can’t cope! must explain away or silence!” buttons.
We know that amplification can work, small amplifiers causing big results, which is why soldiers crossing a bridge have to fall out of step. Then there’s the “rogue wave”, well-attested now, perhaps given its own inner strength to continue as per the “soliton” (think of smoke rings). Then there’s the possibility of rare extraterrestrial influences (the January 21st Sudden Stratospheric Warming seems related to an “anomalous x-ray pulsar”; there’s also the evidence, mentioned in this thread, of a super-luminal velocity gravity wave setting off the 2004 tsunami).
I found this paper by Arno Arrak via ICECAP and it’s another fresh “fringe” approach that IMHO is worth looking at even if not perfect. It suggests a correlation between the El Nino Major and gamma ray burst GRB 971214. The time frame is right: December 1997, the time from which the El Nino spike starts. Also the observations on longer-term effects are interesting.
“evidence, mentioned in this thread, of a super-luminal velocity gravity wave”
I should have said “possibility” rather than “evidence”, to be more scientifically correct…
Tom P (17:50:58) :
The RSS data, complete and without the El Niño event is here:
http://img9.imageshack.us/img9/32/rssdata.png
Another way to consider the data is to look at the trends up to and after the 1998 spike.
http://www.woodfortrees.org/plot/uah/plot/uah/to:1998/trend/plot/uah/from:1999/trend
Bob Tisdale has done some great work on the step changes induced by el nino’s.
Anthony, Barry,
Your statements
“…you don’t remove the effects of that recycled heat in the system, nor can you predict how much of the real data after 97/98 is reflecting the return to equilibrium in the system from that heat event.”
and
“…the heat has to come from and go to somewhere.”
are not consistent with the modelling the 97/8 El Niño event as a rogue wave.
A rogue wave does not cause a permanent, or even a short-lived change in sea level beyond the duration of the event. Where does the mass of the rogue wave go? Well, it wasn’t there in the first place – there are corresponding troughs on each side as can be seen in the in the University of Bergen animation and as was mentioned a couple of times earlier in the thread. For instance the Draupner wave time series, your first image, shows two substantial minima either side of the maximum which bring the overall mass in the wave very close to zero judging by a quick calculation of the areas.
Similarly if the the 97/8 El Niño can indeed be modelled as a rogue wave it would necessarily be associated with adjacent cooling episodes, and there is evidence for these troughs. It is not possible, though, to model this event as a rogue wave AND insist that there is residual heat in the system that then takes over a decade to dissipate. A rogue wave just doesn’t behave like that – you’re muddling the maths from two distinct and contradictory physical phenomena.
As for Barry’s point as to why the slope is different before and after that El Niño, that’s just reflecting the increased noise as you chop up a time series into smaller parts. There are plenty of rapid changes in the data apart from 2001, for instance 1983, 1987, 1990, 1993, 2004, and 2008. Unless you have have some unbiased statistical (and I hope scientific) basis for making the change in 2001 a special case, there is no justification for splitting the RSS data into two at that point.
I can see why it might be tempting to ascribe the 2001 step as a delayed response to a super El Niño, but it has no physical or statistical foundation, and such a delayed step change in temperature is just not seen in the historical data, see e.g.:
http://img12.imageshack.us/img12/9844/superelninos.png
The most prominent signal apparent in the RSS data series, with or without the 97/8 El Niño event, is a simple linear trend of about 0.015 degC/year:
http://img9.imageshack.us/img9/32/rssdata.png
REPLY: I don’t agree with anything you’ve said or the bounds that you are placing. Your assumptions that the atmospheric system behave exactly like the oceans in response to a wave is not convincing. While they are both fluids, they do in fact behave differently to stimulus, and the stimulii are different. I think you are taking the wave comparison too literally, and attaching expectations and bounds that aren’t relevant because the systems behave differently. The idea of this essay is raise the idea that many cyclic events in earth’s systems came together to produce a large peak in the heat system, much like waves of dissimilar period and amplitude come together to produce a rogue wave in the ocean. To say that the total earth systems response (with its wide mixture of processes) must behave exactly like the ocean wave is not reasonable, IMHO.
You write: “are not consistent with the modelling the 97/8 El Niño event as a rogue wave.” Nobody is making a model here (except maybe you, which is why I think you are overreaching), all that is being said is that the way the peaks are formed in both cases, a brief synchonization of cycles, appear similar. Your statement of “Where does the mass of the rogue wave go? Well, it wasn’t there in the first place ” I agree with that, but you are making an extension of that idea to heat, and I can assure you that the heat was in fact there, and it was released into space, and also diffused into earths systems. The comparison you suggest of mass (in a rogue wave) to heat (in earth’s systems) and as “never having been there in the first place” is invalid. It was there, and measured.- Anthony
What a cool article. I’m no scientist, and just the other day I was looking at the 98 peak wondering what on earth could cause that. Then I remembered seeing that Freak Wave documentary, and wondered if this was anything similar 🙂
When Shell oil designed the platforms for the Brent oil field in the North Sea they had tons of research on the area, it is one of the worst weather locations to establish a platform that you could imagine. The Brent Delta Platform was designed with a air gap in anticipation of the Hundred year wave, the first winter on location the hundred year wave arrived 30 plus times scarring the c**p out of all as the platform felt like it was disintegrating.
Tallbloke,
“Bob Tisdale has done some great work on the step changes induced by el nino’s.”
http://www.woodfortrees.org/plot/uah/plot/uah/to:1998/trend/plot/uah/from:1999/trend
What is the physical basis for an El Niño event producing a step change in temperature? This can only happen if there is a one-off permanent injection of energy from the event.
You also have to explain why such a step change is only seen with the 97/8 event, and not previously. It is indeed fortunate for our survival that such an El Niño is rare: if we see an uptick of at least 0.1degC every time we experience a Super El Niño, even if it’s no more than once a century after ten thousand years we’d be toast!
Unless Mr Tisdale has some startling new physics underpinning his analysis, presenting such discontinuous temperature trends is scientifically and historically meaningless. On the other hand, I can think of one possible explanation as to why only more recently might an El Niño give the impression of bumping up the temperature: spikes on a noisy upward-trending data series will often appear as steps.
REPLY: ‘You also have to explain why such a step change is only seen with the 97/8 event, and not previously.” Tom, this demonstrates exactly why you are overreaching with your analysis. We have good global temperature data for about 100 years, global SST for about 30. To imply that just because it hasn’t been seen a second time in that 30 years worth of data is to ignore the fact that nature seldom reacts conveniently to our expectations. The 1983 event was masked by El Chicon, prior to that, we have no other examples that have been globally measured. Your logic then of only seeing such a step once would be to deny the existence of rogue waves because it was only measured once at the Draupen oil platform? – Anthony
Just more kudos. The rogue wave concept is interesting and maybe has some validity. At the least to this non-expert, it does not seem to be something to dismiss lightly.
Lucy Skywalker (00:36:55) :
Then there’s the possibility of rare extraterrestrial influences (the January 21st Sudden Stratospheric Warming seems related to an “anomalous x-ray pulsar”
I asked Leif about this at the time, but he thought it was probably just data error…
Massive bow shock to magnetosphere: 2009 21st Jan 11.40pm
I wonder if it was somehow linked to the x ray pulsar. Perhaps just sending the satellite sensor haywire?
O.T. (Sorry Anthony, but hopefully it’ll keep the topic which will not be named out of your way)
Paul, a place for our ongoing discussion:
http://solarcycle24com.proboards.com/index.cgi?action=display&board=general&thread=568&page=1
“Wow many thanks Anthony for the continued free-speech approach to scientific inquiry. The freak wave idea is a good one.
And thanks Hotrod”
Second!
You can use a similar argument to yours, claiming the step is just noise. I can claim the lack of obvious effect previously is just noise. No proof either way.
You arguments are based on the accepted theory that the increase in linear with noise. Fine. I pointed out something and gave a conjecture which I will freely admit is of low probability. Look at the Hadley data and you’ll see a downturn 60 and 120 years ago. I expect the same now.
BarryW,
(following day now, overly late 😉
This is an attempt at an overlay. It needs someone to do a lot of detail work on fine grain data to better extract how things move.
http://www.gpsl.net/climate/data/1998-nino-timerelation-2009-04-06a.png
Does it mean anything? The call is with the viewer and the data looks different dependent on how it is low pass filtered. The window I’ve used is I hope most suitable for bringing out what I am trying to show, not that it has a huge effect over other windows.
If the opinion is there is no relationship that is fine, I’m just pondering.
Jason data is different y axis
usual data sources, month for msu, jason on the strange 30-ish per year
Barry,
“You can use a similar argument to yours, claiming the step is just noise. I can claim the lack of obvious effect previously is just noise. No proof either way.”
I can’t even see candidate step changes from historical El Niños buried in the noise. Most importantly, there is no known physical basis for such a step change in temperature.
“I pointed out something and gave a conjecture which I will freely admit is of low probability.”
Both low probability, self contradictory and inconsistent with the data, I’m afraid. If you compare the RSS data against the linear trend the most divergent episodes, outside of that El Niño, are repeated cooling excursions including the latest one from which we may possibly just be emerging. Any step change in 2001 is a much smaller divergence from the trend:
http://img9.imageshack.us/img9/32/rssdata.png
“You arguments are based on the accepted theory that the increase i[s] linear with noise. Fine.”
Indeed. And nothing in this thread represents a scientifically or statistically based challenge to such an analysis.
Anthony,
“To imply that just because [a step change] hasn’t been seen a second time in that 30 years worth of data is to ignore the fact that nature seldom reacts conveniently to our expectations.”
I went back to 150 years of HadCRUT data to look for El-Niño-induced steps, not just the 40 years of satellite data- there’s just no clear sign of them in the time series. There’s also no sound physical explantation for such a one-off step change and our very existence indicates such undissipated injections of energy cannot have regularly occurred. Such a step hasn’t been seen a second time – in fact there hasn’t been a single clear signature!
“Your logic then of only seeing such a step once would be to deny the existence of rogue waves because it was only measured once at the Draupen oil platform?”
In comparison the Draupen rogue wave has an exceptionally clear signal, with the distinctive characteristics of a high amplitude, short duration and zero integrated amplitude. It also has a number of possible explanations which have a sound physical basis.
The Draupen rogue wave has clear observational and scientific foundations. Supposed El-Niño-induced step changes in temperature have neither.
Great article and comments.
For the financial geeks (but perhaps with relevance here): Every few years a “once in a thousand year” event occurs in the financial markets. The problem is trying to force distribution of events under a Gaussian distribution, the bell shaped curve, as if extreme events were outliers rather than all too frequent happenings. Part of the reason for the current financial havoc is because risk analysis was done by people who could do complicated mathematics, but couldn’t think. Mandelbrot and Taleb wrote this 2006 piece for the Financial Times, apparently trying to warn of the current mess, but few took heed.
http://www.ft.com/cms/s/2/5372968a-ba82-11da-980d-0000779e2340,dwp_uuid=77a9a0e8-b442-11da-bd61-0000779e2340.html
Thanks for taking us outside the box, or outside the bell curve.
In response to Don B (10:52:45)
You point out what some regard as a threat to civilization. I do not dismiss claims that it could lead to the loss of enlightenment.
– – – – –
Tom P,
Since you are looking at this technically, I can understand why you might feel the masses are being misled, but how does an expert communicate succinctly to a largely lay-audience?
The power is in the metaphor.
It produces a starting point for discussion – you are contributing by aggressively fine-tuning.
One thing I think you may have overlooked is that the musings about a ‘step’ are inspired by some degree of knowledge of state-changes in systems theory.
For those following along, this is sort of like how ‘normal’ bumps to a bowl containing a ball don’t cause the ball to fly out of the bowl, but a big bump can — and there may be other bowls (i.e. other states) in which the ‘system’ can ‘land’.
Population geneticists speak of ‘genetic landscapes’, for example. Equilibrium dynamics can shift to a new order when the ‘ball’ gets flung over a hill into another valley (since the disturbance is so big the ball can’t just roll back down into its ‘usual’ valley).
Due to their nonlinear nature, state changes aren’t necessarily easy to predict if a system is not known inside-out — and as anna v has wisely pointed out in a recent ‘Watts Up?’ thread, we’re a little short on replication.
I’m not saying ‘who’s right’ & ‘who’s wrong’ on this theme, but the exchange did cause me to review Anthony’s first sentence in the article, which includes, “[…] on WUWT, people often think freely and throw out all sorts of ideas”.
Lucy was right:
New ideas at a pace people can handle?
(with a little restraint)
Thanks hotrod.
tallbloke (03:52:04)
http://solarcycle24com.proboards.com/index.cgi?action=display&board=general&thread=568&page=1
I won’t be joining that discussion.
tallbloke (00:36:38)
http://users.beagle.com.au/geoffsharp/ephemeris-z_axis1874.csv
The gun is firing blanks and the room is full of smoke.
Have wave heights been trending lower since January 1st, 1995 at Draupner?
REPLY to Tom P
While I agree that there’s no other event like 97/98, the fact that you can’t find a similar event in the tiny speck of time that is 150 years in relation to the earths long term processes proves absolutely nothing. The Draupen wave was said to be ~ 1 in 2×10^5 waves or 1 in 200,000. Given the long periods associated with many earthly cycles, an expectation of finding another El Nino of similar amplitude in 150 years is quite a stretch. We don’t know how common they are, but to say because you haven’t seen one in 150 years that the current observed one in 97/98 has no physical basis is pure folly.
I’ll say it again: Nature seldom reacts conveniently to our expectations.
You wrote: “Supposed El-Niño-induced step changes in temperature have neither.”
“Supposed”? OK, now we are at an impasse. I can’t continue since you refuse to believe the 97/98 El Nino and that step in global temperature are related. I may as well argue with my cat.
Since we are at an impasse, I’m done. – Anthony
It take dogged determination to argue with cats and put up with the inevitable hair balls. What fur you do that? 😉
Anthony,
“We don’t know how common they are, but to say because you haven’t seen one in 150 years that the current observed one in 97/98 has no physical basis is pure folly.”
I’ve never said the 97/8 El Niño event had no physical basis – you are misrepresenting me here. Indeed there was an El Niño with an even larger temperature excursion in 1876/8 indicating that such events are rather more common than you suggest.
What I have said is that there is neither statistical evidence (in 2001 or in the last 150 years) nor physical basis for a subsequent El-Niño-induced step change in the temperature. And such a step change cannot be modelled on the same basis as a rogue wave – a step change has neither the transitory nor the zero-mean-amplitude characteristics of the Draupner or any other rogue wave.
If you would like me to believe (I’m a sceptic at heart!) that there is some connection between the 1997/8 thermal spike and a suggested step change in temperature in 2001, perhaps you could offer a mechanism. Otherwise looking at the RSS temperature series against the linear trend shows there were larger temperature swings prior to the 97/8 El Niño than associated with any subsequent step:
http://img9.imageshack.us/img9/32/rssdata.png
REPLY to Ton P: Reading your post now, “…you are misrepresenting me here”, no, its not that. I think what we have here is “failure to communicate”. I’m talking about 97/98 and you are talking about 2001. I’m not claiming any step change in 2001, and “step change” isn’t even in the original article! Now you are talking about how you can’t model rogue waves on step change? Where the hell did I ever suggest that? I never even mentioned modeling on step changes at all! I spend a lot of time trying to figure out why you are inject these things the way you do, and it is tiring to try to get my points across, since you accept none, then claim I’m misrepresenting you, and then add points I’ve never suggested. This is why I’m done. We just don’t have a common basis in functional written communications. You wore out Barry also, he just gave up rather than continue. That’s where I’m at, so, no more on this issue. We disagree, we don’t communicate well, and I suggest just leaving it at that, unless you are one of those that relish an “xkcd” moment. Even if you are, I’m not going to waste any more time or posts on it. Sorry, I’m just worn out. – Anthony
Ric Werme (15:07:04) :
Well, I tried my suggestion and got nice spikes after remembering that I needed to get the tops of all the sinusoids to add up, and that’s nicely down with a 270 degree phase angle. (The 0 degree phase angle gives a saw tooth pattern.)
Then I noticed there was too much of the high frequency, and I found that reducing the amplitude of the harmonics let me create just the spikes. Either my memory is fuzzy or three curves aren’t enough, or I’m really modeling a pulse with amplitude 1 and a finite width,
Try http://www.eserc.stonybrook.edu/ProjectJava/WaveInteractionApplet/ with:
Wave 1: 144/40/270 (Wavelength, Amplitude, Phase)
Wave 2: 72/18/270
Wave 3: 48/4/270
The first mention of step change in this thread that I can find is this observation which is just an observation of possibilities with no suggestion of a cause.
My original comment about a “rogue wave” and the origin of this thread had nothing to do with suggesting a step change only the observation that the shape and characteristics of the 1998 temp spike looked remarkably like the non-linear wave seen on the Draupner oil platform which was explainable using the Schrödinger equation.
It has the sharp peak which is significantly higher than would be expected from normal wave models and is also flanked by dips just like the Draupner wave.
I think the question is if the super El-Nino of 1997/98 was generated in the manner implied by the Schrödinger calculations what would be plausible testable mechanisms for it to “steal energy” from the system before and after it.
For that to work there must be some sort of periodic motion buried in the system that it could gather energy from adjacent oscillations. Is there a single oscillation or wave train that is primarily responsible for the strength of the El-Niño cycle or did it need to “steal energy” from 2 or more oscillations.
Since I am not a Phd level Math whiz, can the Schrödinger calculations be “reverse engineered” to give a hint on how this might work or where to look?
If nothing else the mere existence of the Draupner wave points out that there are complex and not intuitively obvious mechanisms out there that we do not understand and like the simple Newtonian models the Maritime engineers used which they “thought” described a well understood process there are surprises out there if we open our eyes to other possibilities.
One of the biggest limitations in engineering and science is simply the belief that a process is possible. I can remember in the 1950’s and 1960’s when engineers and physicists were declaring with authority that a dragster could never exceed 1 G of acceleration because it would require a coefficient of friction greater than 1. They forgot that not all tire friction to asphalt is due to simple sliding friction but some is due to momentary adhesive action between the hot rubber and the pavement and simple mechanical gearing as the rubber physically engaged small imperfections in the surface. Dragsters now pull over 4 G’s of acceleration on launch off the starting line.
Science and engineering is littered with such cases where the simple assumption of impossibility blocked progress and research because clues to other possibilities were over looked or simply tossed out as outliers that could not be real.
We don’t have to “explain everything” in the beginning, but it is useful to at least recognize that there is more than one possible explanation for complex processes and like wave action we may not know as much as we think we do.
As Anthony mentioned in the beginning, many times discoveries start out as educated guesses, what if questions, or even attempts to disprove something. Then like Sherlock Homes when you get done trying to falsify a theory, you end up with some improbable explanation as the only thing left that still fits the actual data.
Then it is time for another round of “what if” to look for other possible ways to explain what current “science” says is impossible but the data says must be possible.
When I lose my car keys, I look in all the obvious places they are supposed to be.
If I still don’t find them, then I need to change my mind set and shift to looking for them in places I have not already looked for them before.
If I still can’t find them, I drop back 20 and punt by changing my mind set again and start looking for them in all the places I “know” they cannot possibly be —- That is usually where I find them!
Larry
The dragster example was great Larry.
Don B wrote: “The problem is trying to force distribution of events under a Gaussian distribution, the bell shaped curve, as if extreme events were outliers rather than all too frequent happenings. Part of the reason for the current financial havoc is because risk analysis was done by people who could do complicated mathematics, but couldn’t think.”
Well put, Don. Thanks.
Chris
Norfolk, VA
hotrod (18:48:27) :
When I lose my car keys, I look in all the obvious places they are supposed to be.
Indeed in the absence of any evidence of an external forcing and its addition function,it is easier to realte to the otherside of the equation its dissipation relationship(subtraction) and the mechanical attributes of the fluctuation dissipation theorem
eg David Ruelle
General linear response formula in statistical mechanics, and the fluctuation-dissipation theorem far from equilibrium
http://dx.doi.org/10.1016/S0375-9601(98)00419-8
Abstract
Given a nonequilibrium steady state varrho we derive formally the linear response formula for the variation of an expectation value at time t under a time-dependent infinitesimal perturbation δτF of the acting forces. This leads to a form of the fluctuation-dissipation theorem valid far from equilibrium: the complex singularities of the susceptibility are in part those of the spectral density, and in part of a different nature to be discussed.
Giovanni Gallavotti
Breakdown and regeneration of time reversal symmetry in nonequilibrium statistical mechanics
http://dx.doi.org/10.1016/S0167-2789(97)00214-5
Abstract
A review and nontechnical exposition of recent studies on the relevance of time reversal, on its spontaneous breakdowns, and on its possible resurgence as a weaker symmetry that still anticommutes with time evolution are given.
Chen et al 2008 part 2 has in the conclusion the following inverse arguments
Hansen et al. (2005) compare observed ocean heat content variations from 1993 to 2003 to the planetary radiative energy imbalance simulated by a global climate model driven by all known external climate forcings and conclude that the upward trend in global ocean heat content is a signature of anthropogenic influences….
Chen et al. (2002) explain observed changes in the planetary radiation balance over 1985–2000 as the result of possible recent strengthening of the Hadley and Walker circulations, which causes subtropical and eastern equatorial Pacific drying and cloud clearing.
Our results therefore appear to be consistent with the conclusion of Chen et al.
(2002) that the observed top-of-atmosphere tropical radiative flux trend over this time is probably due to natural variability rather than external forcing.”
Back to the theory.
NONEQUILIBRIUM STATISTICAL MECHANICS AND ENTROPY PRODUCTION
IN A CLASSICAL INFINITE SYSTEM OF ROTATORS.
by David Ruelle 2006
.
Abstract. We analyze the dynamics of a simple but nontrivial classical Hamiltonian system of infinitely many coupled rotators. We assume that this infinite system is driven out of thermal equilibrium either because energy is injected by an external
force (Case I) , or because heat flows between two thermostats at different temperatures (Case II). We discuss several possible definitions of the entropy production associated with a finite or infinite region, or with a partition of the system into a finite number of pieces. We show that these definitions satisfy the expected
bounds in terms of thermostat temperatures and energy flow.
Returning to the argument
“Perhaps the applications of the studies of rogue ocean waves might be useful in figuring out if the 1998 event was in fact a synchronicity of natural cycles, linear, non-linear, and chaotic for a brief time, and if so, applied towards forecasting future super El Niño and La Niña events. I think it is worth considering.”
First we remove the obvious
Some theory first
A REVIEW OF LINEAR RESPONSE THEORY
FOR GENERAL DIFFERENTIABLE DYNAMICAL SYSTEMS.
by David Ruelle*.2009
Abstract. The classical theory of linear response applies to statistical mechanics close to equilibrium. Away from equilibrium, one may describe the microscopic time evolution by a general differentiable dynamical system, identify nonequilibrium steady states (NESS), and study how these vary under perturbations of the dynamics. Remarkably, it turns out that for uniformly hyperbolic dynamical systems (those satisfying the ”chaotic hypothesis”), the linear response away from equilibrium is very similar to the linear response close to equilibrium: the Kramers-Kronig dispersion relations hold, and the fluctuation dispersion theorem survives in a modified form (which takes into account the oscillations around the ”attractor” corresponding to the NESS). If the chaotic hypothesis does not hold, two new phenomena may arise. The first is a violation of linear response in the sense that the NESS does not depend differentiably on parameters (but this nondifferentiability may be hard to see experimentally).
The second phenomenon is a violation of the dispersion relations: the susceptibility has singularities in the upper half complex plane. These ”acausal” singularities are actually due to ”energy nonconservation”: for a small periodic perturbation of the system, the amplitude of the linear response is arbitrarily large. This means that the NESS of the dynamical system under study is not ”inert” but can give energy to the outside world. An ”active” NESS of this sort is very different from an equilibrium state, and it would be interesting to see what happens for active states to the Gallavotti-Cohen fluctuation theorem.
Now the conjecture,
In the period 95-98 both polar atmospheres were perturbed ie very cold.This led to A)Enhanced ozone loss,and B) Amplified polar vortex.
eg “Air parcels move on isentropic surfaces (surfaces of equal potential temperature) rather than pressure surfaces. The 450 K surface in the south polar area lies between the 70 mb and 50 mb pressure surfaces. This is near the altitude where ozone is in greatest abundance in the vertical profile. This figure shows the size of the polar vortex with respect to previous years. The polar vortex defines the area in which cold polar air is trapped by the very strong winds of the Polar Night Jet. During the winter/spring period, when the polar vortex is strongest, air outside of the vortex can not enter. So, because the warm air from the mid latitudes can not mix with the cold polar air, the polar air continues to get colder due to radiative loss of heat. Also, when ozone in the vortex is depleted, it is not replenished with ozone rich air from outside the vortex. Not until mid to late Spring does the polar vortex weaken and eventually break down. After this, thorough mixing occurs and ozone amounts are replenished. ‘
http://www.cpc.noaa.gov/products/stratosphere/polar/gif_files/vtx_sh_1998.png
So we see retained energy(heat ) due to decreased polar dissipation
Hotrod wrote: “We don’t have to “explain everything” in the beginning, but it is useful to at least recognize that there is more than one possible explanation for complex processes and like wave action we may not know as much as we think we do. As Anthony mentioned in the beginning, many times discoveries start out as educated guesses, what if questions, or even attempts to disprove something. Then like Sherlock Homes when you get done trying to falsify a theory, you end up with some improbable explanation as the only thing left that still fits the actual data.”
Bravo again Hotrod.
Chris
Norfolk, VA
OT
hotrod (18:48:27) :
When I lose my car keys, I look in all the obvious places they are supposed to be.
If I still don’t find them, then I need to change my mind set and shift to looking for them in places I have not already looked for them before.
If I still can’t find them, I drop back 20 and punt by changing my mind set again and start looking for them in all the places I “know” they cannot possibly be —- That is usually where I find them!
Larry
This is out of topic but very very useful: There exists a book on methods of problem solving. The book was written in greek by a 40 year veteran mathematician who tutored for university entrance exams. It has been translated and published in english . The reason I mention it is because it also has a process algorithm for finding missing things, based on its problem solving philosophy.
The algorithm is as follows.
Make a list of what you are looking/scanning for. In the car keys example above the list could be:
metal
shiny
black
round
next to it, negate it.
not metal
not shiny
not black
not round
and start scanning with the negations in mind
It works. It assumes and it seems to be true that the reason we do not find things is a mental loop, we do not see them, as with the solutions of problems.
I will give you an example where it worked for me. I was looking for a felt covered beige phone address book in my office and could not find it anywhere.
so my negated list had
not felt
not beige
not book shape
I found it immediately. It was lying open (white, not felt) face up under some folders, (not book shape,) under my nose.
Here is some info http://www.encyclopedia.com/doc/1G1-195024897.html
The author is Spyros Kalomitsines.
Hey Tom P….stop wearing out the host!
There is a reason why this website [even in spite of the AGW orthodoxy of today] got the best science blog award.
Because…unlike some other similar blogs [not to mention any names realclimate.org], they welcome FREE INQUIRY here.
However…..
Free inquiry and the sacred INDUCTIVE scientific method is not at all the same…as reading into and manipulating people’s statements, shifting arguments, and trying to impose a legalistic or forced explanation on things that are just not able to be proven (or disproven) without a shadow of a doubt at this time.
No one said that the two peaks of the Draupner and the 1998 are the same. Not at all. Rather…similar [but remarkably similar].
Rogue waves in the sea, in and of themselves, are scary, fascinating, and unpredictable beasts.
But….all waves have some common characteristics to some degree…..be them gamma frequencies…. or sound waves…or ocean waves….or gravity waves….or multidecadal oscillations…or even Milankovitch slow-pokes.
This is a fun thread….and you are taking all of the fun out of it. No need to do that. Lighten up, please.
Carry on everyone. Thank you for your posts.
Chris
Norfolk, VA
Tom P (02:19:25) :
Tallbloke,
“Bob Tisdale has done some great work on the step changes induced by el nino’s.”
http://www.woodfortrees.org/plot/uah/plot/uah/to:1998/trend/plot/uah/from:1999/trend
What is the physical basis for an El Niño event producing a step change in temperature? This can only happen if there is a one-off permanent injection of energy from the event.
As Bob Tisdale explains, the energy came from a sub-surface region called the Pacific Warm Pool and was disipated across the oceans by el nino. The amount of energy in it is not picked up by sea surface readings. Have a read of his site before dismissing things a priori.
http://bobtisdale.blogspot.com
Paul Vaughan (12:26:58) :
tallbloke (00:36:38)
http://users.beagle.com.au/geoffsharp/ephemeris-z_axis1874.csv
The gun is firing blanks and the room is full of smoke.
So I put Geoff of going to the trouble of getting my data hosted at your request and without giving any expanation or reasoning you dismiss it?
http://solarcycle24com.proboards.com/index.cgi?action=display&board=general&thread=568&page=1
I won’t be joining that discussion.
Good, that’a a level of arrogance I can live without.
Angry enough to make typos and formatting errors.
Gah!
Save the Sharks,
I’d appreciate seeing some examples of where I’m the one “reading into and manipulating people’s statements, shifting arguments, and trying to impose a legalistic or forced explanation on things that are just not able to be proven (or disproven) without a shadow of a doubt at this time.”
It’s certainly less than fun to have my last submitted comment disappear without a trace of explanation. Of course it’s Anthony’s blog to do with as he pleases, but I don’t see quite why such heavy weather is being made over what is a simple point about background trend fitting and the persistence of a signal.
Tallbloke,
Thanks for the lead – I can assure you that I won’t reject any offered explanation out of hand. I had taken a quick look at Bob Tisdale’s site, but only came across analysis rather than explanations. The Pacific Warm Pool would certainly spread out the effect of an El-Niño event. I still don’t see how it can produce a permanent step change in temperature, though. He appears to put that down to an imbalance of El Niños to La Niñas, not to any one warming event. He gives no underlying reason as to what might cause such an imbalance, though, so his analysis is more descriptive (more warming events mean higher temperatures) than explanative (why are there more warming events).
REPLY: Tom. I’m unaware of any other comments you’ve made, or the one you refer to that disappeared. If you submitted one and it disappeared, it perhaps made it into the spam filter and went unnoticed and was deleted. This occasionally happens depending on combinations of words and/or phrases. Even posters who have been on WUWT for months sometimes end up there. I and the other moderators try to recover all legitimate comments, but sometimes we’ll miss one or two, especially if we also get a spam blast that fills up the holding bin quickly.
Feel free to resubmit. If it disappears again, please send me a note. – Anthony
“This is why I’m done. We just don’t have a common basis in functional written communications. You wore out Barry also, he just gave up rather than continue. That’s where I’m at, so, no more on this issue. We disagree, we don’t communicate well, and I suggest just leaving it at that, unless you are one of those that relish an “xkcd” moment. Even if you are, I’m not going to waste any more time or posts on it. Sorry, I’m just worn out.”
Methinks you should have dropped it much sooner: people with long enough experience in Blogs (like you) should be able to recognize a troll when you see it.
hotrod (18:48:27) :
> When I lose my car keys, I look in all the obvious places they are supposed to be.
I’ve observed that I almost always find my keys in the last place I look for them. So far, I haven’t been able to create a useful search algorithm from that observation.
N.B. “Almost always?” I’m a software engineer – we hardly ever speak in absolutes, having seen far too many impossible things happen. We suspect the computers are laughing at us when we aren’t paying attention.
I have also noticed that I rarely keep looking for something after I find it — although there are some exceptions (depending on your definition of “found” ) Like when I am looking for my glasses while I have them in my hand.
But those seem to be transient events that do not repeat often.
; )
Larry
Frederick,
I believe this is supposed to be a science blog, and one that would like to cultivate a sceptical outlook. It seems somewhat ironic that my challenge on a point of science, namely the physical basis for an El-Niño-induced temperature shift, makes me a troll in your eyes.
I’d much rather have come away with a response on the science, but that doesn’t seem to be what you’re offering.
I where browsing data of global cloud cover when I found this site:
http://www.bbso.njit.edu/science_may28.html
There seems to have been a very rapid decrease in cloud cover ending in 1997, the year when the super El Nino started. Could this dramatic change in forcing 3 years before have played a major role in causing the 97/98 El Nino event?
I also notice the low albedo 1997-2002 is follwed by a step raise in global temperatures during this period.
The diagram ends in 2004 with fast raising albedo and we are now seeing dropping temperatures.
So how much could this change in albedo have affected global temperatures?
If Svensmark is correct we will see a fast increasing Albedo that will set an all time high in the comming years since the cosmic radiation allready is setting new records several times per year since a few years.
Jerker Andersson (10:00:28) :
So how much could this change in albedo have affected global temperatures?
A lot.
Play with the toy model at http://junkscience.com/Greenhouse/Earth_temp.html.
A change in albedo from .3 to .31 changes global temperature by 1C.
I used it to translate the albedo curve you linked to , into a temperature curve, and it fits the trend of the temperature, but not very well the magnitudes, as one would expect from a toy model with so few parameters to fiddle.
Regarding Tom P (09:23:44)
Tom has scored a point here: “I’d much rather have come away with a response on the science, but that doesn’t seem to be what you’re offering.”
That doesn’t mean I found Tom’s earlier arguments convincing.
Dissonant bait & consuming tangents – just a matter of sensible strategy to ignore.
– – – –
Re: tallbloke (21:50:19)
The reason I am not elaborating can found by any reader of this thread in Anthony’s reply to Carsten Arnholm, Norway (14:32:35).
I should have thanked you for your invitation to join the other forum (which Leif Svalgaard describes as a “pen”, “sandbox”, &/or “litter box”), but I must decline.
I am reminded of a supervisor’s wise words, from back when I was guiding in the mountains: “Pace, pace, pace.”
I am also reminded of the wise words of an immediate superior I had while running online courses: “Just introduce a little new each time.” …And she was talking about the politics of influencing the system, not the teaching.
As I suggested above: Lucy was right.
Peace – & patience.
– – – – – – – – – – – – –
Rogue Finance / Climate Parallels
I noticed Chris’s comment on Don B’s post. I read the article too. Here is what I picked out of it:
=
“Such measures of future uncertainty satisfy our ingrained desire to “simplify” by squeezing into one single number matters that are too rich to be described by it. In addition, they cater to psychological biases and our tendency to understate uncertainty in order to provide an illusion of understanding the world.”
“The traditional Gaussian way of looking at the world begins by focusing on the ordinary, and then deals with exceptions or so-called outliers as ancillaries. But there is also a second way, which takes the exceptional as a starting point and deals with the ordinary in a subordinate manner – simply because that “ordinary” is less consequential.”
“Despite the shortcomings of the bell curve, reliance on it is accelerating, and widening the gap between reality and standard tools of measurement. The consensus seems to be that any number is better than no number – even if it is wrong.”
“[…] a methodology where large deviation and stressful events dominate the analysis instead of the other way around.”
=
Engineers are concerned with extreme events, for obvious reasons. Economists now appear to (possibly) be learning a lesson about structural failure.
All camps should be listening to what the ecologists & physical geographers have been saying about emergent & scale-dependent properties. (For whatever reason, the statisticians do not seem concerned about assessing the variation of parameter estimates as a function of measurement scale. Why ignore that rich information?…)
I am becoming increasingly curious to know exactly what assumptions go into climate models. I am particularly curious to know which assumptions are introduced simply for mathematical convenience, as I see unquestioned acceptance of such assumptions as a potentially very dangerous development in our cultural evolution that could have (arguably is having) significant ramifications (particularly when assumptions are considered collectively in an integrated sense) for the nature of our society & civilization.
If we are entering the era of cold calculation, where calculations govern all decisions, we might be wise to base our assumptions on something other than ‘mathematical convenience’. (This might even have the practical effect of reducing our reliance on untenable assumptions.)
Once again: Thanks Don B.:
http://www.ft.com/cms/s/2/5372968a-ba82-11da-980d-0000779e2340,dwp_uuid=77a9a0e8-b442-11da-bd61-0000779e2340.html
…& Richard Heg:
http://en.wikipedia.org/wiki/File:IE_Real_SandP_Prices,_Earnings,_and_Dividends_1871-2006.png
– – – – – – – –
Jerker Andersson (10:00:28) – “If Svensmark is correct […]”
Even if Svensmark isn’t correct, this is very important (& a lot Svensmark-haters seem to overlook this in their seemingly-contented belief that Svensmark has been “debunked”.)
Assumptions of uniformity should (generally) rouse suspicions since spatiotemporal heterogeneity exists and cannot always be tenably dismissed as “irrelevant”.
It is assumptions, rather than conclusions, that draw the strategic fire.
[Think of the conclusions as a decoy.]
– – – –
This discussion is starting to recover nicely from the tangents that briefly threatened to derail it – thanks to all.
Y.H. Zhou, D.W. Zheng, & X.H. Liao (2001). Wavelet analysis of interannual LOD, AAM, and ENSO: 1997-98 El Nino and 1998-99 La Nina signals. Journal of Geodesy 75, 164-168.
Highlights from this paper:
Figure 1 makes it dead-simple to understand how dLOD is isolated from LOD.
Figure 2 shows dLOD, AAM, & MSOI roughly covarying.
Figure 3 (which looks sort-of like a rogue wave) gives a visual of the following:
Near-zero-lag cross-correlations – significant at 99% level:
dLOD with AAM: 0.81
dLOD with MSOI: 0.71
AAM with MSOI: 0.61
Zhou, Zheng, & Liao were writing this paper before the 1998-99 La Nina even concluded.
They used wavelet plots (figure 4) to highlight the bimodal timescale-spectra of the 3 time series, commenting as follows:
“It is worth pointing out that a strong El Nino event (e.g. that of 1982-83 or 1997-98) occurs when the high-frequency component and low-frequency component are in phase with positive polarity.”
Some of the best journal articles reduce the complexity to a few simple pictures.
Zhou, Zheng, & Liao sure make it look simple.
Tallbloke wrote “I had a bit more of a think about this. From the point of view of someone on a coast measuring the incoming waves in a mist, they would only see the amplitude of each wave as it was arriving. If they knew about rogue wave theory, they might measure several consecutive deeper then usual troughs and decide it was time to retreat further up the hill.”
Well put, Tallbloke.
Certainly in the case of a tsunami this might even be more apparent.
Regarding the great Dec 26, 2004 disaster, it is well documented that had people been educated simply how to recognize a huge trough that precedes an even bigger wave, perhaps scores of thousands of lives would have been saved.
Understood that tsunamis and rogues are different animals….but still.
We as humans perceive the waves that speed across the dimension of time as ones that occur “all at once” based upon our perspective [such as any average wave on the sea or oven the ephemeral rogues that become monsters that swallow ships whole].
But if we could slow down time [ugh….I just almost quoted Cher] to something on a scale and tempo much more grandiose and largo [to borrow a music term] than our own perspective allows [and even if we are figuring it out by hindcasting], then, in that case, the 1998 spike occurred, effectively, all at once.
Chris
Norfolk, VA
Paul Vaughan wrote: “I am becoming increasingly curious to know exactly what assumptions go into climate models. I am particularly curious to know which assumptions are introduced simply for mathematical convenience, as I see unquestioned acceptance of such assumptions as a potentially very dangerous development in our cultural evolution that could have (arguably is having) significant ramifications (particularly when assumptions are considered collectively in an integrated sense) for the nature of our society & civilization.”
and
“If we are entering the era of cold calculation, where calculations govern all decisions, we might be wise to base our assumptions on something other than ‘mathematical convenience’. (This might even have the practical effect of reducing our reliance on untenable assumptions.)”
Bravo. Money.
In my opinion, mathematics is a chest of tools.
The person who uses the tools is responsible for choosing the correct tools for the job. Confusion in scientific matters, as for example the climate models, arises when wrong mathematical tools are used on a mix of physics systems with confused assumptions. By physics systems I mean, classical thermodynamics, classical statistical physics , quantum statistical physics and quantum physics.
To blame bad results on reliance on mathematics is obscuring the issue, not particularly helpfully. To doubt the use of mathematics for human endeavors is doubting the use of tools.
Anna v wrote “To blame bad results on reliance on mathematics is obscuring the issue, not particularly helpfully. To doubt the use of mathematics for human endeavors is doubting the use of tools.”
I don’t think that is what he was saying at all Anna.
Point well taken though on the invaluable resource of mathematics. Everything is math. Understood.
I will let him interpret his own but the reason I bravoed it was that he was saying that [from a layman’s perspective] scientists need to get out from behind their calculations ocasionally and experience the real world.
On that aspect he is very correct. it is not just “cold calculations”. It is both…observation (okay three), experience, and calculations (okay four) and common sense and (okay five) quantum physics.
I always look for what you have to say and respect the great intellect behind it.
Chris
Norfolk, VA
anna v (20:55:09)
“To blame bad results on reliance on mathematics is obscuring the issue, not particularly helpfully. To doubt the use of mathematics for human endeavors is doubting the use of tools.”
The issue isn’t whether we should be using tools; it’s whether we should be using hammers to sink screws.
anna v (20:55:09)
“The person who uses the tools is responsible for choosing the correct tools for the job.
Perhaps you have identified the problem.
savethesharks (19:46:39) :
But if we could slow down time [ugh….I just almost quoted Cher] to something on a scale and tempo much more grandiose and largo [to borrow a music term] than our own perspective allows [and even if we are figuring it out by hindcasting], then, in that case, the 1998 spike occurred, effectively, all at once.
Hi Chris, we are unable to predict even short term climate because there are so many variables we don’t understand, and we struggle to generate the computing power to work with the ones we do understand. They combine to produce sudden surges like the ’98 peak, but also to create the negative feedbacks which keep the overall system stable.
I agree with your analysis, it’s all happening, the past helps predict the future, though the unexpected can always pop up to disrupt the destined course, e.g. a big volcano or a huge solar storm. In a system as complex as climate, we can’t determine the future at a level which matters to us as humans trying to grow crops, stay warm in winter etc. However we can get some clues about longer term climate by studying the patterns of the past, and this thread has been valuable in pushing us to grapple with our understanding and limited viewpoints.
Cheers
Anthony,
Thanks for the email – here goes a second time:
The issue I’m bringing up goes right back to the original article where after it is first proposed that the the 8/89 Super El Niño event might be a likened to a rogue wave, which by definition is a transient, isolated phenomenon, Barry White contradicts this by fitting a trend which implies the effects of that El Niño are still being felt. It is Barry also who first postulated in a later comment that part of that long-term effect was a step change in temperature in 2001.
The crux of the matter comes down as to how to view the RSS data: if a simple linear trend is fitted to the data:
http://img9.imageshack.us/img9/32/rssdata.png
the El Niño does indeed stick out like a sore thumb, similar to the 1876-8 Super El Niño. Interestingly, the temperature excursion does suggest troughs below trend on either side which are rather reminiscent of a Draupner-like wave. There are other excursions, both before and after the event, of which the rise in temperature in 2001 is most certainly not the most notable. Of course the there needs to be an explanation as to why there is a steady increase in the energy of the system, as implied by the trend 0.15degC/year, but explanations grounded in physics have been offered here.
The alternative view that Barry proposed is that the El Niño has so disturbed the subsequent behaviour that the trend should be fitted just to the prior data (see the plot in the article itself). This is not consistent with likening the event to a rogue wave – it is no longer transient or isolated. The background trend is of course much lower while the El Niño is then seen to inject a good deal of energy into the system after 2001. Such a step change is not seen after previous 1876-8 Super El Niño or after other later El Niños. The burden of an explanation shifts from the cause of what is now a much lower background slope, to how an energy considerably greater that the original El Niño thermal spike has been retained and re-expressed in the temperature record. Any explanation of the underlying physics also has to embrace why such a thermal response has not been seen before.
In the absence of such an explanation, analysing the RSS time series as steadily increasing noisy background signal with an isolated very large event in 1997/8 appears to be the more scientifically and historically justified viewpoint. It is also not inconsistent with the intriguing possibility that the 1997/8 Super El Niño could be likened to a rogue wave.
Apologies – that should be Barry Wise, not White!
Tom P wrote “Apologies – that should be Barry Wise, not White!”
Ha! I am almost quoting Cher [Ugh]. You are almost quoting Barry White.
Now Cher or Barry White I am not gonna listen to, but Barry Wise on the other hand….
Thanks for parsing out the info above. Good post.
Chris
Norfolk, VA
Wow! Briefly OT….I am typing this looking at the Atlantic in the AM and I about blinded myself because the sun reflecting on the water was so intense.
Reminds me of multiple things: energy reflection, refraction, and absorption, the ocean and the SUN…..
Could not help thinking about the big spike in the solar cycle around almost 50 years ago in Archibald’s recent thread….and I wondered if that anomaly [while not as impressive or even a “rogue wave” for lack of a better term], I wondered if some of the “energy” in that big wave, borrowed energy from either wave on either side.
And, given the lag times of up to a century for solar forcing to affect earth’s weather…[forgive me here if I am way off]…is there any connection between the solar spike mentioned and the 1998 earth temp spike?
Regardless if that is hard to prove it goes to show that, most likely, the two biggest competing big-boy drivers of earth’s climate seem to be the ocean, and the sun, in that order (with Svensmark theories coming in third….and this one related directly to solar forcing).
Am I on the right track??
Chris
Norfolk, VA
savethesharks,
“Thanks for parsing out the info above. Good post.”
I appreciate the comment. It is rather amusing that my very same analysis met with a completely different response from you a couple of days ago… I think this shows how easy it is to lose focus on an argument distributed through a thread.
The implications of what I’m saying are still clear, I hope, and can certainly be regarded as a challenge to the viewpoint of the majority of contributors to this blog. But a bit more contention would probably improve the health of many of the threads and prevent complete embarrassments such as the recent discussion on the effect of cosmic rays on the ozone hole dragging so many people into the mire:
http://wattsupwiththat.com/2009/03/26/galactic-cosmic-rays-may-be-responsible-for-the-antarctic-ozone-hole/
Comment on Tom P (09:01:36)
I agree that challenge is healthy for raising the bar, particularly any that is incising in its precision – but we haven’t seen anything in this thread that can slice the rogue metaphor.
If you looked at my paper on satellite data you know that this “El Nino that should not be there” is out of the normal ENSO sequence. I could not explain its energy source and for a time thought it had to be cosmogenic but I have changed my mind: it came from another ocean. Specifically, I regard it as Indian Ocean overflow. I regard the ENSO itself as a giant wave sloshing back and forth in a bowl we call the Pacific Ocean. The wave frequency, about four or five years between peaks, is determined by the dimansions of the ocean itself, and the energy of motion comes from trade winds that create the north and south equatorial currents. In between these two currents is the equatorial countercurrent that brings back the water trade winds have driven west, The turnaround point of these equatorial currents is near the Philippines and New Guinea which block their entrance into the Indian Ocean. If you look at the satellite radar altimetry map of sea surface anomalies you will see that the water surfacein that area is high – piled up by equatorial currents – and ready to start flowing back by gravity to bring us our next El Nino. But between New Gunea and Borneo there is an island-studied connection between the two oceans – the Indonesian passage. I hypothesize that due to unusual conditions prevailing a couple of years before 1998 El Nino, possibly caused by typhoons, monsoons, etc. sea surface rose high enough in that area to cause an overflow into the Pacific Ocean. Once in the Pacific it would be just where the equatorial coiuntercurrent starts and would naturally follow it since its surface is lower than that of the equatorial currents flanking it. And once it arrived at the eastern shore it would be indistinguishable from an El Nino except for its peak height, which was twice as high. If this sounds fantastic consider that Hurricane Katrina was accompanied by a storm surge of 25 feet and that the world record storm surge of 43 feet was recorded in northern Australia, near New Guinea, in 1899. I wrote this up with illustrations in my revised paper dated May 25th and gave it to Joe D’Aleo of ICECAP. It may take him a while to put it up but keep looking for it.