 Guest post by Steven Goddard
On the same day when President Obama and Prime Minister Brown separately warned of imminent economic catastrophe, the new US Energy Secretary Dr. Steven Chu issued a different catastrophe warning. The LA Times quoted him saying ““I don’t think the American public has gripped in its gut what could happen,” he said. “We’re looking at a scenario where there’s no more agriculture in California.” And, he added, “I don’t actually see how they can keep their cities going” either.”
This is a terrifying warning of drought, coming from a cabinet level official whom the LA Times describes as “not a climate scientist.” And perhaps a little surprising, since it was only two winters ago when the “world’s leading climate scientist” Dr. James Hansen, forecast a “Super El Niño” with severe flooding for California. Dr. Hansen has also warned of a return to wet El Niño conditions during the current year or so.
One of the commonly made claims from the AGW camp is that global warming is causing more El Niño events. Roger Pielke Sr. just did a web log on this topic.
El Niño Impacts: Weaker In The Past, Stronger In The Future?
“What about the future of El Niño? According to NCAR senior scientist Kevin Trenberth, ENSO’s impacts may be enhanced by human-produced climate change. El Niños have been unusually frequent since the mid- 1970s.
El Niño is famous for bringing copious amounts of rain and snow to California. I have spent several El Niño winters in the Bay Area where Dr. Chu lives, including the big one in 1998 when the rain was nearly continuous for months. Living Redwood trees were sliding across Highway 17 in the Santa Cruz mountains. I remember a wonderful weekend in LA in February, 2005 during their second wettest winter on record when they received six inches of rain in three days. It didn’t stop pouring for five seconds the entire weekend. According to NOAA:
(LA 2005) had its 2nd wettest rainfall season since records began in 1877 and the wettest season in 121 years. Over 37 inches of rain (37.25) fell downtown, just failing to reach the record 38.18 inches set during the 1883-1884 rainfall season. Average wet season rainfall for LA is 15.14 inches, making the 2004-2005 season 246% wetter than the 1971-2000 normal.
Snowfall in the Sierras is also normally high during El Niño years. Below is a graph of Lake Tahoe snowfall from 1918-2008 – official data taken from here. Not much of a trend, except to note that the Dust Bowl in the 1930s was dry, as Steinbeck and the Okies observed.
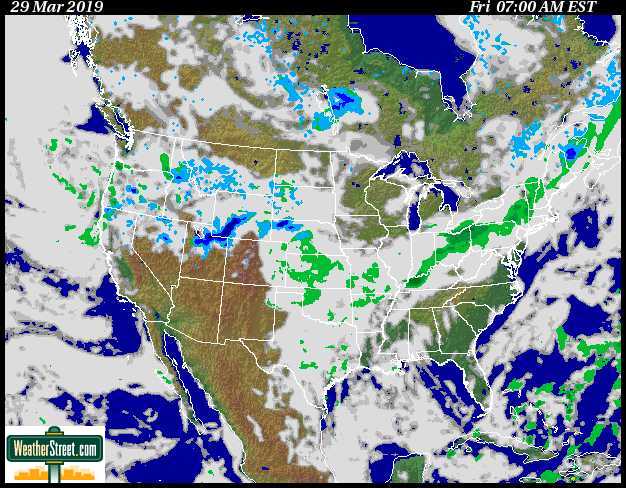
From: this spreadsheet El Niño years bring lots of water to the cities, farms and reservoirs, and allow for periods of high agricultural productivity. So I am not sure what it is that we are supposed to be terrified of – famously dry La Niña years in California, or famously wet El Niño years caused by “global warming?” The official horror story morphs so fast, it is often difficult to keep up. Reading Steinbeck, one might get the impression that dry periods are part of the normal climate cycle in California, rather than a recent invention caused by the burning of fossil fuels. President Roosevelt said at the time – “We have nothing to fear but fear itself.“Heavy rain and snow is forecast for California today.
Perhaps we now have the “Chu Effect” working in concert with the Gore Effect?

From weatherstreet.com
Ya gotta hand it to California governmental bodies. Knowing for years that the lakes are dry or drying up, knowing that the Sierra snowpack is less than normal, knowing that the Colorado River flow is much less than years past, knowing that Lake Mead and Lake Powell are way below the full mark, these governments block construction of desalination plants at every turn.
One (count em, ONE) has been approved recently (late in 2008), in Carlsbad near San Diego. It will not produce fresh water until 2011, per the company’s website.
Another one sits idle, mothballed, in Santa Barbara.
A few more are in various stages of environmental review.
People get cranky when they get thirsty. There is a reason wars were fought over water in the Wild West.
Meanwhile, farms are not planting this year. No water, so why bother?
California’s state water page may be found here.
There is a spiffy section on Climate Change, and another on Drought.
Roger E. Sowell
Marina del Rey, California (where it is indeed raining tonight)
Cooling is now Global warming…. It would seem ‘eh?
Is there no argument that can’t be won by a Molecule of carbon dioxide? : (
off topic, but has anybody seen this? Snow kills 6 Moroccan children:
http://news.bbc.co.uk/2/hi/africa/7872831.stm
So what caused the 1883-1884 wettest ever recorded rainfall season?
It’s actually a very clever policy – announce separate contradicting prophecies at different times, by different people. When later it either gets dry or floods, the masses will only remember that there was a prediction covering this event.
Somewhat OT as reported on ICECAP and linked to below http://www.americanthinker.com/2009/02/save_the_children_from_global.html
Is it possible to go for a “AGW is not science, is religeon, and should not be taught in classrooms” and bring it too a court of law where it would actually have to prove it was in fact science?
Perhaps the reason Dr Chu and Dr Hansen can’t keep there stories straight is because they have been dipping into the ether. As Dr Hunter S. Thompson wrote in Fear and Loathing in Las Vegas: “There is nothing in the world more helpless and irresponsible and depraved than a man in the depths of an ether binge.”
US Energy Secretary Dr. Steven Chu appears to be simply re-cycling an identical story (with appropriate name changes) about our western state which one of Australia’s infamous climate criers issued a couple of years ago.
I know the economy is bad over there in the US; but surely you could spring a dollar or two hiring creative writers with original scripts?
Steven Chu.
He’s the guy that told people to paint their roofs white to save energy,…..
http://motls.blogspot.com/2008/12/steven-chu-vs-sane-homeowner.html
…despite the fact that more energy is consumed in the winter to heat than in Summer to cool,…
http://www.carboncommentary.com/2008/02/20/76
…and so what might be saved in the Summer would be lost several fold over in the Winter.
In fact, that idea is so idiotic and poorly thought out that I wonder if what he won his Nobel prize for was really his own idea, or if he just had some really bright grad students who’s ideas he, eh, borrowed? (Also, in some of the tapes I’ve seen him in, he look like he’s plastered, slurring his words and not really making a lot of sense. It makes me wonder how much further he could run his car if he put his corn into it’s tank instead of his.)
Have these people no sense of history? Is everything caused by human activity? How arrogant is it to assume that?
Humans do impact on the world in various ways… Passenger pigeon etc. But we have reached a point where anything and everything seems to be attributed to human activity!
The more this goes on the less the public will believe any of it.
He has a severe case of Hockey Stick Fever.
With records only going back to 1877 (the man is also NOT very resourceful)
officially, he’s in a poor position to be yo-yoing the El La Ninao pom poms.
The story of the 49’ers and the weather patterns that follow, along the meticulous snow & rain records kept by a very prominent 1st reservoir in California history (still standing folks) that fed the No. Blumefield Ditch and all the other hydraulic mining co’s of the era escapes poor Chu.
The man needs to do his homework before opening his yap about my State.
There was a very long dry spell in Calif, but it’s clearly off Chu’s radar, and it does NOT fit any patterns seen currently.
Maybe if Tweedlee Gore and Tweedlee Chu keep running thier mouths we’ll get enough rain to fill the Reservoirs in the No. State and restore the Glaciers that the Modern Maximum has melted.
UPDATE…
One tape where he appears a bit snookered..
You don’t suppose that’s why he thinks 3degC is equivalent to 11degF? (it’s 5.4degF) And the IPCC has backed down considerably on it’s claim of a 3degC change in average global temperature, whatever that is.
Didn’t the Governor of California two years ago declare an emergency in the grape growing regions because of snow and frost damaging the vines?
The thing with burocrats pontificating about the climate is that, because they generally don’t have a clue about scientific matters, they just repeat what they are being told. They clearly need better advisors.
I wish these people stopped insulting my intelligence ….
1. I think Dr Chu will find that increasing frequencies of El Ninos is associated with the warm phase of the PDO, which we have just exited from, hence the smart bets now would be on 30 years of more La Ninas.
2. There is therefore indeed the possibility of droughts ahead in California, due to La Ninas, not El Ninos. However, as this has happened before and humankind survived in California, perhaps they will do so again?
3. One wonders whether Dr Chu is angling for a job at Kleiner Perkin Caufield and Byers in a couple of years, who are no doubt delighted that he is talking up the need for new clean tech companies and products in their region?
4. Perhaps the answer is a series of transitory canals for water shovelling around the country? After all, with any weather, it seems to chuck it down somewhere. Washington State might have too much in the years ahead and Tennessee can ship it to Florida, perhaps?
Question for Chu… I was wondering where the science is that projects such a statement, and exactly which scenario this is? What are the physical mechanisms behind such an effect and what sort of driver level and feedback is present to produce such an effect? How long will the effect last? Hmmm?
I want a job where I could just make stuff up and get paid for it. I’m creative!
If it gets too cold in California instead, will it be known as the “Ha-Chu” effect?
Every day in California is a State of Emergency.
The light bulbs at the top are all screwed in backwards.
Can we borrow Dave Archibald for a few years to come over here and straighten these quarks out?
Bob D,
In option trading terms I think the tactic is defined as a straddle.
HasItBeen4YearsYet? (00:24:39) :
UPDATE…
One tape where he appears a bit snookered.. . . .
You don’t suppose that’s why he thinks 3degC is equivalent to 11degF? (it’s 5.4degF)
I suggest you recalculate that. Dr Chu has a PhD, after all.
But seriously,
HasItBeen4YearsYet? (00:10:42) :
Steven Chu.
He’s the guy that told people to paint their roofs white to save energy, despite the fact that more energy is consumed in the winter to heat than in summer to cool . . . and so what might be saved in the Summer would be lost several fold over in the Winter.
Actually, Dr Chu has a point. If you don’t mind ruining those expensive hi-relief 40 yr shingles, painting them white will save energy. Wintertime insolation is much less than summertime, and lasts less than half the day, that is, the roof will spend much less time reflecting/absorbing in the light than it will radiating IR in darkness. The white paint will radiate less than a darker roof.
And I understand that whitewash does an even better job than latex.
And perhaps a little surprising, since it was only two winters ago when the “world’s leading climate scientist” Dr. James Hansen, forecast a “Super El Niño”
Correction: That prediction only appeared in a draft document, and Hansen removed it from the final report actually released to the public.
I am sure you would not wish to perpetuate a falsehood just because it reflects badly on Dr Hansen.
Gah! This is like some mass form of cognitive dissonance. Does anyone think for a moment that he believes this screed?
Since it was mentioned…. I follow the data for Lake Powell and check it on a regular basis.
http://graphs.water-data.com/lakepowell/
http://snowpack.water-data.com/uppercolorado/index.php
The also have a searchable data base.
http://lakepowell.water-data.com/index2.php
Last year the lakes gained quite a bit…. then the decision was made to do a massive discharge (both Powell and Mead). It seems some fish downstream wanted to wash their teeth real well or something.
It could be worse you could live in Washington:
“Antarctic bulge could flood Washington DC ”
http://www.newscientist.com/article/dn16545-antarctic-bulge-could-flood-washington-dc.html
Whilst in the dry continent of Australia: So much water is spilling out of the Burdekin Falls dam in north Queensland that it would fill Sydney Harbour every five hours and there are fears more rain could cause widespread flooding in the region.
Queensland’s Natural Resources and Water Minister, Craig Wallace, says the Burdekin could end up under water.
Weatherzone: Massive dam overflow threatens further N Qld flooding
Aussie John (23:50:53) :
So what caused the 1883-1884 wettest ever recorded rainfall season?
I do not know what dates constitute the 1883-1884 rainfall season.
But Krakatoa erupted August 26–27, 1883.
Just a thought.
“So what caused the 1883-1884 wettest ever recorded rainfall season?”
– – – – –
The high amount of precipitation that was recorded that year.
I don’t know what you are worried about – it looks like the East Coast is going to be completely flooded due to a water bulge http://www.newscientist.com/article/dn16545-antarctic-bulge-could-flood-washington-dc.html?DCMP=OTC-rss&nsref=online-news
[post deleted]
mikiwud, I don’t think you intentionally meant to be racist, but I have no choice except to interpret your post that way and I’m sorry, it is not acceptable behavior for this blog. Think about what you wrote.
~ charles the moderator going to bed on the west coast.
(sarc)Hooray for whitewashing the planet, he’s a freaking genius , and we should out law any kind of heat absorption.
First matter of business in the new world, the sun must go, we’re heating double the warmth and remember it’s for the children. (sarc/)
Keep saying that to yourselves, as you make our kids play for your retirement in wasteful big $$$ green energy investments over a non existant pollution scam.
Yeah, my kids, so bring it on, the population with only take so much BS. :i
” Well only take so much BS”
Sorry 🙂
Sorry HasItBeen4YearsYet, but your physics is wrong. White reduces both emission and absorption of radiation, black increases both. So a white house will absorb less energy from the hotter outside in summer, and reduce radiation from the hotter inside in winter. It is perfectly sensible advice.
THE problem in California is that we build as many houses as we can within the available water supply in the best, wettest, years then wonder why there is a water ‘shortage’ due to ‘drought’ the other 80%+ of the time…
Oh Well…
BTW, the comment about Cities just shows he can’t do math. About 5% of all the water in California goes to cities. The rest goes to farms, washing trout teeth, whatever. You can run the cities at full water in the worst drought around and not notice it. Similarly, we can stop all water use in every city, send everyone to New Orleans, and it would not make any difference worth mention to the farmers of the state.
The whole “don’t flush for #1” et. al. is just ginned up for political reasons. For ‘sharing’ and ‘creating awareness’…
Of course, the thing that really frosts my shorts is the point made earlier. We could have all the water anyone could ever need at about the present rate for city water, technically… if only you could get a desalinization plant completed… Plenty planned and some started. Then the protests, red tape, et. al. begin…
Protests? Who would protest? Well, stop the water and you stop the housing, industry, people, etc… It is not accidental that water and oil are under attack.
(Shades of Dr. Strangelove! They are attacking our Precious Fluids!)
They don’t do themselves any favors using scare tactics like that.
The public are not buying it as you can see at this news poll.
http://www.abc.net.au/newsradio/
Looks like about 1 out of 4 are falling for the hysteria.
http://www.rasmussenreports.com/public_content/politics/issues2/articles/23_fear_global_warming_will_end_world_soon
We have water, America:
Dam may go underwater…
It should also be kept in mind that since the last California drought in the 1980’s, the state’s population has grown ~50%. That means 50% more people competing for a relatively static and unpredictable water supply. Unfortunately, Cali’s state government seems more concerned with outlawing plastic shopping bags than planning for the future.
But do not be alarmed, Gov. Arnold Schwarzenegger has formulated a plan, which he explains in detail here: click
I view California in a very poor light. They spend there citizens money on vast, pointless and wasteful ways. Yet on things that matter, they block private enterprise and seem to expect to be subsidized by other states – examples oil, water, electricity – basic things. California is socialist and anti-capitalist.
I hate to seem harsh, but frankly, I would not shed too many tears if California dried up and blew away, or fell into the sea or simply left the United States. California does significantly more harm to the US than the benefits it provides.
California and it’s citizens are completely expendable to the health and well being of the United States, in fact, it would be desirable for it to go away.
Suprisingly CSIRO and the MSM in Australia have just blamed “Drought” on Indian Ocean Currents.
Not a CO2 molecule in sight.
http://www.theaustralian.news.com.au/story/0,25197,25014927-11949,00.html
Also check out the vote on ABC Radio website WebPoll…
http://www.abc.net.au/newsradio/
Somehow the option “Global Warming is a Myth” was included? – and it’s in front???
There is a reason that no great civilization ever arose in North America. It’s not because the Indians couldn’t do it, there were a few abortive attempts. It is because the climate lacks the required long term stability.
The US of A will eventually discover this. It will be blamed on GW.
“I know the economy is bad over there in the US; but surely you could spring a dollar or two hiring creative writers with original scripts?”
—————–
I hear that there are a lot of out of work Hollywood writers. They are used to making things up, and making it sound good.
“…despite the fact that more energy is consumed in the winter to heat than in Summer to cool,…”
In the summer, the highest energy consumption comes when the sun is highest in the sky.
In the winter, the highest energy consumption occurs when the sun isn’t shinning at all.
In addition, the sun doesn’t shine much in the winter for much of the US.
On top of that, for much of the country, roofs are covered by snow for a significant fraction of the winter, so it doesn’t matter what color you paint it.
Both Roger Sewell and I independently tackled the California water situation a few days ago.
My main point – we don’t have to wait for fifty or a hundred years for the water crisis…it’s already here!. In a nut shell, the state has not expanded its water infrastructure or storage capabilities since the 1950’s, due in part to resistance from the very powerful environmental lobby. We have overexerted our use of natural aquifers and, here in the San Joaquin Valley, an area roughly the size of Tennessee, the wells tapping into them are drying up. Because conservation has been the catch all / be all solution to every problem in the state, we have not built new dams or other water storage facilities to meet the demands of a population that has increased five fold since the fifties. Anyway, Here is the blog post I wrote.
PS. Google “flex alert” and learn it well. For some reason, other states admire what California gas done with its energy policy, which mirrors their water policy. Conserve to the point of near starvation during high demand. Don’t get me wrong. I’m all for conservation, but that can only get you so far.
E.M.Smith (02:39:56)
‘Of course, the thing that really frosts my shorts is the point made earlier. We could have all the water anyone could ever need at about the present rate for city water, technically… if only you could get a desalinization plant completed… Plenty planned and some started. Then the protests, red tape, et. al. begin… ‘
You left out lawsuits.
And people wonder why business is moving out of California and the U.S..
California does significantly more harm to the US than the benefits it provides.
I guess you like high food and produce prices, as nearly 25 % of the U.S. farm output is from California. The place is not the problem here, it’s the people in power.
There is no question that the population centers of California face several serious threats, including their water supply. Obsessing about CO2 is an unfortunate distraction that diverts attention away from any intelligent remedial actions.
An interesting story from the LA Times in 2005
http://www.latimes.com/news/local/la-earthquake08sep08,1,2126004.story?coll=la-util-news-local
U.S. Geological Survey seismologist Lucy Jones remembers attending an emergency training session in August 2001 with the Federal Emergency Management Agency that discussed the three most likely catastrophes to strike the United States.
First on the list was a terrorist attack in New York. Second was a super-strength hurricane hitting New Orleans. Third was a major earthquake on the San Andreas fault.
Much of California is a desert not fit for rattlesnakes. Thanks to the ingenuity of Man, some 20 million people live in a very arid warm place. We would not be having this conversation if California had the population of Iowa. Water is the main resource for any civilization. That is why it is not temperature but precipitation we should be worried about. Desalination plants appear to be the only recourse for California. A long period of La Ninas spell nothing but trouble for the Desert Southwest.
El Ninos usually don’t spell drought for California, as unusually strong Pacific storms result in abundent winter time rains storms, as well as high level snows.
Graeme Rodaughan… Not only just in front…at present some 91 % think
GW is a myth…Question was : Is the heat wave in Australia caused by GW?
No and yes each 4,5 % approx. … Is it a UCSPA??? [United Coordinated Sceptic
Poll Attack] … Other weather and climate-related polls:
…At what point should sporting events be called off due to heat
39C 65%
41C 21,7%
44C or above (Aussies are tough, aren’t they??) 13,4%
and lastly:
Obama’s greatest challenge?
Economy: 57,7%
Rebuilding US international status 22,0%
Climate change 8,1%
And this people voted for[?] Rudd and Company…
or not so many real Australians care for ABC AU net polls??
BTW. Water has always been a hot topic in California – Water Wars
I’m not sure where this 95 % farm use vs. 5 % residential figure came from. I suspect the usage gap is not nearly that wide. This map shows water usage in California divided by county, and includes swimming pools, tap water and agricultural inputs. The counties with higher water consumption average at about 280 to 300 gallons per day, while those counties that use the least average 150 to 180 GPD.
‘HasItBeen4YearsYet? (00:10:42) :
Steven Chu.
He’s the guy that told people to paint their roofs white to save energy,…..’
That’s just in the spring. In the fall, you paint the roof black. Then in the spring you paint it white. Then in the fall, you paint it black again. C’mon guys, you’re just not thinking GREEN…
er… black. er…white.
Oh heck.
This is a cheap and sleazy diversion. California, lock stepped with the AGW fear mantra, is bankrupt. They cannot pay tax refunds owed to the workers of California. California employees are getting sent home with no pay.
Their parks are closing.
But, by golly, they are installing gigawatts of tax payer funded solar panels, at only severalX the cost of real power plants.
AGW is doing to our formerly greatest state what AGW did to the food markets last year: causing havoc and suffering.
And AGW hype is well on the way to destroying NASA and man in space, as well.
AGW is not like believing in UFO’s UFO belief is stupid but basically harmless. AGW’s dark side is that its promoters demand, and are getting, control of the public square and the public purse. Chu, Lovelock, Gore, Hansen, are selling death. In California they are starting to reap just that.
Off Topic
http://www.telegraph.co.uk/travel/travelnews/4536352/Flights-could-be-rationed-says-environment-tsar-Lord-Turner.html
California and it’s citizens are completely expendable to the health and well being of the United States, in fact, it would be desirable for it to go away.
Jeez. You run out of gold and they toss you out in the street… um the Pacific?
Rigel, just where were you expecting California to go?
I grew up in Chinalake. For the first 6 years of my life I though all of California was desert.
The only thing I fear from the weather is how crooks and shiftie pols use it to fool the gullible.
I will apologize on behalf of California for sending Bab’s Boxer, and Grandma Pelosi to DC. Even through I never voted for either one.
In the case of our lady Speaker of the House, there is nothing that can be done about it. I feel the same way about SF as Rigel feels about Ca.
Boxer however I can effect a change there. There’s a guy I know from Orange county who wants her job in 2010. His name is Chuck Devore.
If you are tired of climate changers talking about American independance from foreign energy sources, and in the next breath protesting American coal, he’s your man.
If you are tired of enviros complaining about co2 while blocking clean domestic nuclear energy, he’s your man.
If you are filled with dread when you see Barbara Boxer wealding her new energy bill like a club, ready to break it off over your back, Chuck is your man.
Plus he has a blog.
With its roughly 16,000 employees, and a budget that is probably in the billions, the Department of Energy has not, to date, created one electron of energy! Thank you “Jimma” Carter for giving us this waste of money.
And now Steven Chu is using his post to promote his religion.
markm
Decade long droughts are nothing compared to what has happened in the past. There have been several century long droughts in the American West over the last 3000 years. There is a thread at ClimateAudit on this. See “Under Water In The Sierra Nevadas”… the remains of 200+ year old trees under a couple of hundred feet of water.
I hope Dr Chu read this article before he made his remarks. PDO and AMO are major factors affecting US weather and droughts especially PDO along the west coast and AMO along the east coast and sometime they combine in unique ways.
http://www.pnas.org/content/101/12/4136.full.pdf+html
Figure #4 of this article is especially helpful. With PDO now negative and AMO still positive we are today where we were about 1945 -1950. The weather that followed over the next 30 years was cool especially 1965 -1975,when both PDO AND AMO went negative .
Global temperatures seem to go up more than usual when both AMO and PDO are positive like 1995 -2007 and again 1925-1945. Co2 levels have very little to do with these natural climate swings. The climate swings were present well before any manmade CO2 showed any rise.
….SAVE MONO LAKE…….
one gallon jug at a time
Expect more weather events to be blamed on climate change (CC). Last year it was the floods in the midwest (naturally after they occurred). Now, since CA is experiencing low rainfall this winter it becomes a problem due to CC. The only difference now is the hysteria will comes from the US government just as it has overseas.
The good news is, despite this propaganda, it appears more and more people are starting to question CC hysteria. I can only imagine that if we were to have a snowy February in CA that the credibility of Chu would be greatly diminished.
Calfornia that formerly beautiful, wealthy, productive and just plain wonderful state has turned into a basketcase, a lot of it due to their government agencies actions.
As all the alarmists say when a weatherman or physicist state their skeptism to AGW, why should anyone pay attention to Dr Chu. He is only a physicist, not a climatologist.
Years ago, when I was a member of the National Geographic Society, ie I had a subscription. I read an article about California agriculture in the desert and irragation practices. Evidentally a visiting bishop from far away from that region asked the people at the mass to pray for rain. Later on some of the farmers said that was about to worst thing you could pray for because the irragation and the desert conditions were making the growing conditions ideal.
$600 million in the stimulus package for NASA to study climate change? I thought it was a done deal that we are doomed, etc. Should use half that money to study adaptations to climate change and the other half to advance the Singularity. We need it bad.
Nobel Prize winner Al Gore has been predicting that the WAIS will collapse. That will have the dual benefit of making Yuma, Arizona a coastal city and allowing ships to tow huge chunks of freshwater ice to the new coastal regions.
The bad news for Gore is that it will also wipe out almost the entire Democratic voting base, as can be seen in this map:
http://www.usatoday.com/news/politics/election2008/results.htm
This is really silly because the wave regime off the California coast is perfect for wave acuated pumps. A Reverse osmosis unit with inlet pressure (1000psi to 1200psi) provided by wave pumps and a pelton turbine on the outlet (700psi to800psi) would be energy positive. Local salinity impacts are easily solved by deep water discharge (cheap plastic pipe run a mile or two offshore to an area of stong current with perferations on the last few hundred feet to spread it out). The only things lacking are the will and the capital.
Google ‘McCabe PDO NOAA’ or something like it to find definitive papers on the PDO-AMO precipitation patterns. The current negative PDO-positive AMO is attended by mild SW drought conditions. When AMO follows, sometime in coming decade(some say imminently) central plains drought will be added.
But then that’s a layman’s take from rural America.
John Philip,
Would it make you happier if I said that “Dr. Hansen seriously contemplated a Super El Nino in 2007 and has already forecast a return to El Nino in 2009?
I’m not sure what your point is, because it seems clear that Dr. Hansen expects El Nino to be the dominant pattern in the future.
rigel
there are some smart ones there this blog is based in ca and i for one would not want the good Mr Watts to go anywhere.
Aussie John (23:50:53) :
So what caused the 1883-1884 wettest ever recorded rainfall season?
There was an intense El Nino event in 1884 (sources: Eguiguren 1894, Sievers 1914).
You can find a table of el nino events at: http://www.cipca.org.pe/cipca/nino/nino/feni%F1o.htm
Aussie John (23:50:53) :
So what caused the 1883-1884 wettest ever recorded rainfall season?
In California? SOI negative numbers indicate La Nino.
ftp://ftp.bom.gov.au/anon/home/ncc/www/sco/soi/soiplaintext.html
Steven Goddard
Could you send me your E-mail. I have somthing on seaice that might be of interest to you.
See: Knudsen , Mads Faurschou & Riisager, Peter. Is there a link between Earth’s magnetic field and low-latitude precipitation? Geology 2009;37;71-74 doi:10.1130/G25238A.1
http://geology.geoscienceworld.org/cgi/content/abstract/37/1/71
The Solar cycle is already near a record low. Could these factors contribute?
And how do they compare with CO2?
Sorry HasItBeen4YearsYet, but your physics is wrong. White reduces both emission and absorption of radiation, black increases both. So a white house will absorb less energy from the hotter outside in summer, and reduce radiation from the hotter inside in winter. It is perfectly sensible advice.
Winter roof reflects sunlight and house needs more heating. Paint sits on black body interior surface. Black body interior absorbs internal heat and warms the paint. Paint radiates as a black body. Not a good idea to paint the house white unless you live in a hot country.
Re: HasItBeen4YearsYet? (00:24:39) :
I took a look at that video and have extracted a few quotes:
~2:05 “the wealth of a country is proportional to it’s energy use therefore we can’t really reduce our use of energy”
~2:16 Shows graph that shows amount of electricy used per person in various countries on x axis
~2:22 y axis of graph shows standard of living (healthcare, gdp, etc)
~2:37 “Europe which is that cluster over 1/3 of the way over on the left wants to go down by a factor of two the US really has to go down and join them in order to make headroom for developing countries”
At least he admits that we are being forced to reduce our energy use in order to make room for developing countries. I wish he’d admit that we are being also forced to reduce our economy as well. For example, Carol Browner was on Socialist International’s “Commission for a Sustainable Society” that calls for the US to reduce it’s economy and for a global governance. So I would assume that anything she does is going to be owards us using less energy and having a smaller economy.
When this story of Browner’s ties to Socialist International got out, SI removed her information from it’s web page which to me is interesting… And I have yet to find one MSM liberal media source that reported this story.
Dr. Chu is correct in his warning to California. I didn’t read his entire statement so I don’t know if he was insinuating that gorebull warming was the cause. Gorebull warming has nothing to do with it. The article “The Great Droughts of Y1k” May 2001– http://www.yosemite.org/naturenotes/paleodrought1.htm details the past and warns of the future. Dr. Stine also investigates how precipitation in coastal Alaska and southern California are in opposite patterns. That is what is happening today(?) Climate Audit also reviewed this back in 2006– http://www.climateaudit.org/?p=956.
So many layers to sort out: sunspot cycles, DeVries cycles, ENSO cycles, 60 year ocean cycles, climate “Minimum” cycles and volcanic eruptions to muddy up the record. My bet is that they are all interrelated. Dr. Stine is certain that California will have another 150 year drought at some point in time.
I can imagine all sorts of doomsday scenarios that could happen.
Some have happened in the past, such as a comet or meteor crashing into the sea and causing massive tsunamis, death and destruction on a global scale. Shouldn’t we evacuate our coastlines now, before it’s too late? What does the precautionary principle dictate we do?
Shouldn’t we always gauge risk by not only possibly loss but also likeliness? Dr. Chu can’t give any real estimate on the likeliness of this happening, but he wants us to take immediate action based not on probability, or forecasts, or predictions but scenarios.
Does anybody wonder why so many skeptics think this is a hoax or scam? Do Dr. Chu and others like him think they can scare us into blindly accepting their agenda?
Welcome to the return of sound science and public policy!
Radiational cooling? Is there a hole in the CO2 “blanket” in Buffalo?
————————————————————-
Frigid temperatures take WNY by surprise
http://www.buffalonews.com/home/story/570235.html
Buffalo State College hosts the national teach-in on Global Warming Situations today — a day the local temperature bottomed out at minus 6 degrees.
“We didn’t have temperatures forecast to be quite that cold,” weather service meteorologist David Zaff said this morning. “When you have snowpack on the ground and clear skies, temperatures can plummet. It’s called radiational cooling.”
——————————————————
Power Absorption Coefficient and the Beer Lambert Law
http://www.atomicprecision.com/blog/2009/01/06/fwd-power-absorption-coefficient-and-the-beer-lambert-law/
“So carbon dioxide in the far infra red is a low absorber, it has no dipole so the absorption is collision induced (quadrupole induced dipole absorption).”
” Carbon dioxide cannot absorb an infinite amount of radiation,…carbon dioxide has a spectrum. It absorbs only at certain frequencies.”
“Carbon dioxide at atmospheric pressures has essentially no absorption because it has no dipole.”
“The planet will not heat up due to carbon dioxide because I0 / I cannot become infinite in the Beer Lambert Lw. This is a trace gas compared with water, the main gases in the atmosphere are nitrogen (about 80%) and oxygen (about 20%). None of these gases will cause run away heating. They have not done so for 4,000 million years. Obviously, in that time the Earth has developed a self regulatory mechanism. Of far greater danger to the Earth are holes in the ozone layer and pollutants other than carbon dioxide, which is needed by plants, which in turn create oxygen for mammals. Of far greater danger to the Earth i steh ripping apart of the landscape in order to make profit – wind turbines.”
——————————————————-
Absorption of Infra red radiation by CO2
http://www.atomicprecision.com/blog/2009/01/10/fwd-absorption-of-infra-red-radiation-by-co2/
References
1) _http://nov55.com/ntyg.html_ (http://nov55.com/ntyg.html) . 2) _http://brneurosci.org/co2.html_ (http://brneurosci.org/co2.html)
These sites show how CO2 absorbs infra red radiation. At its main peak, CO2 absorbs all infra red in ten metres under atmospheric conditions. There is no radiation left after ten metres. If the CO2 concentration were doubled, all infra red would be absorbed in five metres. This is not a mechanism for change of temperature AT ALL because of convection. The Stefan Boltzmann law for black body radiation was misapplied by Arrhenius because CO2 only has three absorption peaks in the infra red. This means that 94% of the so called “heat producing radiation” escapes carbon dioxide.
So the alarmists have just put temperature proportional to alpha and concentration proportional to intensity. This has little or no science in it. The other site mentioned here shows very clearly that the Beer Lambert law does not produce a temperature change mechanism. The site also discusses gross corruption in contemporary science and society. My Hall of Fame group operated in a time when science was not corrupt and all our work was published in the best peer reviewed journals and books. The AIAS exposes gross corruption in for example cosmology almost every day. we used computers extensively, and we know that use of computers must be carefully controlled. Computer models produced by climatologists are heavily criticised in numerous sites.
So all we are left with is that the weather may be changing.
I suspect nature conspires to make fools of climate and weather prognosticators of all stripes. Hansen predicts super El Nino to wash us away this year and instead we get La Nina that should dry us up. Yet, over the past 24-hours, we’ve been subjected to a longer, harder and more sustained rain in L.A. than I can remember in a very long while. My gutters flowith over! What’s up with that?
In southern Nevada, the roofs of school buses are painted white to reduce the interior heat. Almost anybody who bought a new car bought a “desert friendly” color like white, silver, light blue, etc., etc.
The point is, if you live in a hot, sunny climate, then white helps reduce your energy usage (and reduces local warming). But if you live in a cooler climate, you’ll want your roofs to be a dark color.
I don’t know what us poor fools in the temperate midwest should do. Can somebody develop a roof shingle that turns light and reflective when it’s hot but is dark when cold?
BTW: Shade trees are a wonderful thing. In the summer, the leaves help keep the sun off your home, and therefore cooler. But in the winter, when the leaves are gone, more sunlight strikes your home and this helps reduce your heating bill.
@TJA in re: great civilizations in North America
More likely than climate as a controlling factor―it’s no less stable than central or western Asia which birthed all the earliest civilizations―is the lack of domesticable work animals.
John Galt:
The answer, as you know, is YES. This thing has to be maintained or the wheels fall off. If the constant drumbeat of HUMAN CAUSED isn’t continued, people will forget, or worse, will start to remember that climate changes did not start last wednesday
To the moderator.
Sorry.
I was just refering to WW2 radio propaganda voices, no personal slight meant to anyone. Just trying to ridicule some of the rubbish they spout and get printed.
In response to the first comment post on this topic from Roger Sowell.
Your statement: “…knowing that the Colorado River flow is much less than years past, knowing that Lake Mead and Lake Powell are way below the full mark…”
This is sort of misleading. Overpopulation and over-use is why some of the lakes like Mead are only about 50% of full pool. And people forget, we live in a desert (I’ll spell that again: d e s e r t ) …which would otherwise not be so populated if it wasn’t for modern air conditioning and irrigation systems.
When I first moved to Southern California, I read a whitepaper from an expert who presented it to a city council contemplating what to do about the rapid growth in the San Diego area. The paper said we were just coming out of “a prolonged 30 year drought in Southern California”. That was 1986. We have had quite a few very wet years and very dry years since then. One of the lakes by my house that was half empty for about 5 years was suddenly filled up again two years ago because of excess rainfall. Again, this is a desert, and some of the farmers were shameful, when for years, they flooded their fields with un-metered (yes un-metered !) water for crops they had no business growing in this climate here in California.
But I would like you to visit http://lakemead.water-data.com/ and see that this year, the inflows have been running more than 70% above normal for Lake Mead and this has been consistent for more than 100 days…and last year wasn’t bad either. The problem is that the population siphons out way too much and wastes too much.
Oh, and last year, we were still snow skiing until it was almost summer… not sure where they take the snow measurements, but we had snow for skiing much later and longer than usual.
I’ve lived in Northern California for most of my 55 years. I agree that California is very poorly managed by our state government in almost every way. We haven’t increased our water storage because the government is beholden to the most extreme environmental groups.
We barely get by in years of average rainfall. Anything less than average is a problem. I say we need to be able to get by in years with only 50% of average, otherwise we’re in crisis mode every few years. Years that low, at least in the north, are very rare. It’s difficult for me to call a year with 70% of average rainfall a drought.
I keep my own rainfall records and where I live in the Sierra Nevada foothills now the average yearly rainfall is about 30″. Two years ago we had 77% of average and last year 71% of average. We are behind this year too. No one can really say what’ll happen in the next two months but right now this rainfall season is shaping up to be similar to the last two.
I should also note that we can catch up on rainfall very fast. And doom and gloom predictions are nothing new. I bought my first house in the Bay Area in the 1976, right at the start of a two year “drought.” In the summer of 1977 we were collecting wash water in garbage cans to water the garden. Watering restrictions were in place. Predictions abounded that it would take years if not a decade of average rainfall to recover from the drought. Fall of 1977 was dry. Then came January 1978. It rained for 31 straight days. The reservoirs were full. The drought was over. Doom and gloom stories disappeared from the news.
If we can’t store enough water in any year that isn’t at least average, it’s our own fault.
California has a fire ecology; the span varies according to the ecosystem. The If a fast surface wildfire courses through periodically it clears the small stuff, facilitates germination of certain plants, provides nutrients for others… If fires are not allowed to burn cyclically, we get slower, hot-hot ground fires that cause much more plant death, followed by erosion. Thus, the “prescribed” burns in Montana’s forests (they used to be called “controlled” but that was rarely the case so the terminology shifted to a more realistic description).
We’re having a false spring in Silicon Valley, where the plum trees are covered in white blossoms and the citrus are nearly all picked. It has been dry lately with just the slightest dusting of rain over the last few nights. I would love a bit of flooding, a drenching, mossy wet, huge puddles on the low spots of 101 clogging traffic, uprooted trees from the delta washing up on Marin’s beaches like whale skeletons, waves breaking over the sea walls, the need for wellies and sump pumps, sand bags and stout umbrellas…
As for Chu joining Kleiner, they’ve added some odd lots to the greentech team in the last few years, but there are still some good people there, too, and some money. The well of private capital isn’t dry, just less intrigued by risk.
As for Boxer, in high school we were good girls and avoided her block because it was known as a place where the bad kids misbehaved. I was shocked when I found out people voted for her. Yikes!
Yes, we’re overcrowded, and no, San Andreas hasn’t done the big cull yet, and yes, the weather (not climate) on the coast fluctuates a lot. The lotus eaters who moved out here expecting paradise complain, loudly. Those of us whose kin came here back when it was cheap choose to live contentedly within the drought-moss cycle, appreciating Nature in her moods.
Claude Harvey (08:20:27) :
“I suspect nature conspires to make fools of climate and weather prognosticators of all stripes. ”
————————————————————-
Nature makes no effort at all. They do an admirable job entirely on their own.
“Carbon dioxide at atmospheric pressures has essentially no absorption because it has no dipole.”
And no amount of pseudo-scientific jargon and heuristics can change this fact.
@HasItBeen4YearsYet? (00:10:42) :
He’s the guy that told people to paint their roofs white to save energy,…..
http://motls.blogspot.com/2008/12/steven-chu-vs-sane-homeowner.html
…despite the fact that more energy is consumed in the winter to heat than in Summer to cool,…
http://www.carboncommentary.com/2008/02/20/76
…and so what might be saved in the Summer would be lost several fold over in the Winter.
Yeah, but what you and your pals forgot to mention is that in the winter, the sun is lower than in the summer. That is, the white paint in the roof will have a much stronger effect in the summer than in the winter. If you also paint your facade with black and make a small slab to protect it from the summer’s sun (or even build a trombe wall), you’ll get more thermal energy in winter and much less on summer.
It rather seems a good practice. ~snip~
Not a good idea to paint the house white unless you live in a hot country. – MartinGAtkins
Surely it depends whether you’re trying to heat the house or cool it? If you want to keep it cool, you paint your house white, so that it reflects some of the solar radiation. If you want to warm your house, you paint it black, so as to absorb all the solar radiation.
But… if white is a poor emitter as well as a poor absorber, and black is the converse, then to keep your house optimally cool, you should really paint the house white in the morning, and paint it black in the evening – so that during daylight hours the house absorbs the minimum solar radiation, and during the night the house emits the maximum radiation. And conversely if you want to keep your house warm, you should do the opposite, and paint it black in the morning, and then paint it white in the evening.
Hmmm…. All that painting would be a bit of a chore though, but if you covered your house in rotatable slats (just like the blinds you find in windows), painted black on one side and white on the other (not like the blinds you find in windows), you could have a solar cell trigger an actuator motor to turn the slats in the morning and the evening.
A neighbourhood full of houses like this would see all the houses white during the daytime summer months, and black during the daytime winter months. And every day, at about 6 am and about 6 pm (depending on the season, maybe) there would be a tremendous roar as all the houses flipped their slats to turn black and then white again. And there’d be a festival, with beer and music, each year at the vernal and autumnal eqinoxes, to celebrate the neighbourhood turning black or turning white again.
I could go on,.. but I won’t.
Similar back to back dry years in late 1980s. I remember buying hay, primarily alfalfa, from farmers that sold their water rights. Nice source of profit. They were still able to get 4 cuttings, and occasionaly 5 cuttings. They had to forego the lower quality/lower yield late cuttings. Due to shortage, the premium first cuttings were very profitable, and as always made “test”, (high TDN, required by the dairies). Also, many water districts refused to permit any new meters as the supply for current users was barely adequate. Miraculously “new ” water supplies were obtained, and building surged. That drought was no where near as bad as 1976/1977. Salinity issues for many East Bay water districts in 1977 as lack of flow through the delta, allowed greater salt water intrusion. There have been a couple of years, (1990?), when we had a March “miracle”, that filled the reservoirs. I hope so.
Great article from National Geographic on the subject.
http://ngm.nationalgeographic.com/2008/02/drying-west/kunzig-text/1
Painted my pan roof over the lanai last year (for northerners that’s a tin uninsulated roof over the screened back porch). Used 3 coats of a white sealant paint and it actually lowered the summer mid-afternoon temps on the lanai by almost 10 degrees!
For my technical friends, the thermometer location is exactly the same as before the paint job, it is away from the outside wall of the house and direct sunlight does not hit it. It is located about 10 inches down from the roof. BTW, it showed 28 degrees at 8 AM this morning.
TJA said:
There is a reason that no great civilization ever arose in North America. It’s not because the Indians couldn’t do it, there were a few abortive attempts. It is because the climate lacks the required long term stability.
That’s part of it. If you haven’t already, you should read Jarred Diamond’s excellent “Guns, Germs, and Steel”. It expands on many reasons why advanced civilizations evolved in some regions and not in others. It’s ground breaking work.
Rigel (04:41:23) : California is socialist and anti-capitalist.
I hate to seem harsh,
You are being a correct reporter of the facts. I have lived in California long enough to see it under both conservative (in the older ‘Actor as Governor’ Ronald R. sense) and ‘progressive’ government. In the past we built infrastructure and an attractive business environment, we promoted industry. It is now a socialist enterprise leading the way to wealth distribution and is anti-humanity in it’s actions. Business was deemed evil some decade+ ago. Those are just facts.
Unfortunately, we ‘lead’ the nation by about a decade. What we get, you get. So our ‘conservatives’ are now RINOs like Ahhnold who’s agenda is clearly more driven by pillow talk with the Kennedy klan that he’s married to than it is to any understanding of his party; and our ‘liberals’ are more in line with the socialist workers party…
but frankly, I would not shed too many tears if California dried up and blew away, or fell into the sea or simply left the United States. California does significantly more harm to the US than the benefits it provides.
We are well on our way. Large chunks of what was once vitality and innovation are now empty buildings. I know, I worked in many of them. (There
iswas a wonderful “boiler room” area, a cauldron of change, all along Central Expressway from Santa Clara to Sunnyvale. Always dynamic, always new companies starting a new game. Now it’s “for lease 50 cents a foot? Please? Make offer???) The venture capital has packed up and moved to China, and any business with a brain will launch their new venture in Nevada, Texas, Shanghai, anywhere but here.I had a company with a dozen folks in it. I closed down rather than deal with all the, er, crud. I’m now ‘semi-retired’ in that I don’t really see where it will benefit me to start another company. I’m still vaguely interested in working, especially if it were in another state, but there isn’t much here of interest. My lawyer moved his practice to the Nevada side of Tahoe. Ditto several other past associates.
The state ideology is: Tax beatings will continue until business morale improves. And our government is now surprised that the tax revenue has hit the basement floor and is continuing to drop…
We do, however, have thriving industries involving the illegal import of drugs and non-citizens (who, once here, are given all kinds of public assistance including education for all the kids they can pack in the truck, and if one is ‘on the way’ free medical care & citizenship). Law Enforcement and the prison system are also growth areas for employment, as long as you can be selective in what laws you enforce.
By law, 1/2 the state budget must be spent on “education” so if you can put up with
political indoctrinationthe approved curriculum, there are opportunities there as well. (Though not in the classroom. The money stops in the administration level and goes to contracts to endlessly tear down and rebuild shoddy schools and recycle text books to more politically correct ones.)California and it’s citizens are completely expendable to the health and well being of the United States, in fact, it would be desirable for it to go away.
Well, we do provide some agricultural benefits. Sure, you can get good wines from Chile and vegetables from Mexico, but they don’t have as good an education or welfare system! And what about the movie industry? Suddenly all the loony lefty actors would be making ‘foreign films’! How could you feel appropriately guilty about using your heater if it was a foreign film star berating you from their private jet? Hmmm???
Look, it’s a small price to pay for us being your conscience. Just hand over about $14 Billion (oops, my bad, new month… make that $15 Billion) in ‘stimulus’ and we’ll be fine.. No, really. I mean it. Look, pop the cash or we’re gonna wash your windshield.!
Its same old song for CA.. drought, wild fire, mud slide, .. repeat.. but every year they make it sound new and different because the same stupid people keep building back in the same stupid places. I liked CA.. Lived from SF all the way down to San Diego. Theres some beautiful spots along the coast. But theres way too many people there. USGS has a lovely non global warming take on the whole deal:
http://pubs.usgs.gov/ha/ha730/ch_b/B-text1.html
But it sure doesnt sound like an effect of global warming.
PS Lots of earth shakin going on in western US.. anyone know the effects of a very active subduction zone? Have you checked your earthquake kits lately?
California is poorly managed in the fields of water and electricity. The issues
are related.
We could collect a lot more runoff, but the environmental brigades object. We
could have a lot more water used for farming and drinking, but the recent
Federal lawsuit makes it so that the Sacramento Delta Smelt gets the water,
not cities or farms. This could be mitigated by construction of the “bypass
canal”, but the environmental brigades object: farms or people might prosper.
Electricity and cooling has the same sort of idiocy. Few realize the scope
of the idiocy. Run through this thought experiment. If you discovered a free
source of energy in California, and connected it to the grid, thus solving one
of mankind’s most pressing issues, what would happen? You would have
to pay the state for the electricity that the publicly regulated utilities would
have earned! There is a STRONG disincentive to solve the generating
problems here. Even on the small scale, if solar is successful, the state
has to pay the utilities for the power the utilities did not produce.
For about 5 years I have been kicking around a solution for SoCal. The
political will does not exist, but the technology does. I call it the CAX
solution.
1) Kick everybody off Catalina, just like in WWII. Pay them well, but
kick them off.
2) Build 4 2 GW nuke plants. Use the underground pebble bed design,
cool with helium as primary heat transfer and use the ocean as secondary
cooling.
3) Run a constant 4 GW for desalinization. Sure, you need a few pipes
to the mainland.
4) Use the waste heat to do re-gassification of LPG.
5) Water storage is needed. Fine. Go right up the San Gabriel river channel
with that desal water. Cut a big tunnel to the high desert and make a large
res. that can gravity drain back into the basin.
6) Use all that rock from the tunnel and basin to make a 100 meter wide
submerged “roadway” from the shore to Catalina.
7) Any extra power can be used to generate hydrogen. Another good
candidate is arc remelt of steel scrap. Still have extra power? Refine
bauxite.
From such a plan California gets wails, screams and shrieks from the
environmental brigade, plus water, electricity, natural gas, hydrogen and
jobs. There is no new technology involved. Only political will is needed.
Hmmm…… let me see if I can find some water at Google……… ah yes here it is, over 300 in. of snow…… in CA!
http://www.nohrsc.noaa.gov/nsa/reports.html?region=National&var=snowdepth&dy=2008&dm=10&dd=13&units=e&sort=value&filter=0
Click on SQBC1 for Squaw Valley
FWIW:
http://www.sfgate.com/cgi-bin/article.cgi?f=/c/a/2009/02/04/MNV415MGLA.DTL
Gives a capsule view of California. At one time I lived in Bolinas (where Hitchcock filmed ‘The Birds’). It is dominated by a strange mix of: people with more money than brains or not much of either. They have tried to use every means possible to keep outsiders out (including the ritual of sawing down any road sign that tells you what tiny road leads to their village…) That included not expanding any resource that might lead to growth…
I only lasted a year there, the local politics were bizarre. Yet somehow that mindset has come to the rest of the state…
(FWIW, a modestly small desalinization plant that would fit in a large garage would give the town all the water they could ever need and it would not be visible to anyone nor have any detectible environmental impact… but that might lead to lack of guilt, or even, horrors! growth.)
h/t sonicfrog
Below is a link to a California Supreme Court decision that discusses water rights. The case is National Audubon Society v Los Angeles Dept of Water and Power, (33 Cal.3d 419 (1983)).
Click Here
Mike S.
“This is sort of misleading. Overpopulation and over-use is why some of the lakes like Mead are only about 50% of full pool.”
Apologies if I mislead anyone. The point is that population grew (and is growing!) and water resources actually fell — the Colorado River flow trend is negative per the USGS.
See this reference, and scroll down to Figure 3.
The shrinking flow in the Colorado, plus water re-allocation among the river pact states, leaves California more dependent on snowpack, which is rather unreliable. Alternatives that Governator Schwarzennegger proposed for building more dams to store more rainwater were shot down by the legislature (motivated by environmentalists) and at the ballot box.
Then a Federal judge ruled that perfectly good Sacramento river water must be diverted to the ocean rather than sent south to parched Southern California, in order to protect the delta smelt (a small fish that apparently is endangered, or about to be.)
So here we are. Inadequate Colorado river flow, diverted Sacramento river flow, unreliable snowpack, too few dams to catch the rainwater, and environmentalists blocking desalination plants.
Now the entire nation will pay the price, as California farms do not produce what they ordinarily would. Meat prices will likely rise, too, as cattle also require water to drink.
As I wrote before on WUWT, it would be great to see a massive federal project to build a water pipeline across America, from the Mississippi to the Colorado river. Now, that is one stimulus package project I could support. Anybody want to guess if that project is included?
Roger E. Sowell
Marina del Rey, California
Frank Perdicaro (11:46:25) :
‘California is poorly managed …’
————————————————–
Frank, your first four words says it all about California.
During the LIA, from paleo evidence (the more trustworthy type – aquifers, moisture responsive trees, etc) there were the worst mega droughts ever. How’s them apples Chu?
Frank Perdicaro (11:46:25) :
I’d say use San Nicolas Island.
I vote that when the food and water shortages turn up, the environmental lobby is at the back of the queue for receiving anything. If they are the ones causing the problems, they should be the ones that suffer most the consequences, in my opinion.
Ed (a simple old carpenter) (11:56:09) :
Bad data. Those have to be YTD cumulative figures not snow pack. Especially given they are from October.
Do note, I have personally seen 20 foot snow packs at the base of Squaw, but that’s pretty rare. Normally the peak is around 3 or 4 feet there (up a high camp, a different story).
By law, 1/2 the state budget must be spent on “education” so if you can put up with political indoctrination the approved curriculum, there are opportunities there as well. (Though not in the classroom. The money stops in the administration level and goes to contracts to endlessly tear down and rebuild shoddy schools and recycle text books to more politically correct ones.)
Oh Yes. Read This! Fresno Unified created hired a new administrator, THEN froze the budget! This was not filling a vacant post, this was creating a new one! I just spent $30,000 getting my CA teaching credential, and I gotta tell ya, looking for a teaching job… I’m feeling a bit screwed right about now.
>One of the commonly made claims from the AGW camp is that global warming is causing more El Niño events. Roger Pielke Sr. just did a web log on this topic.
I really do wonder if anyone here has any idea of climate. Water vapour holding capacity of the atmosphere goes up exponentially in temperature. Evaporation goes up linearly. You MUST slow down tropical circulation otherwise the atmospheric boundary layer rains itself dry. A slower tropical circulation MEANS a spin down in the Walker circulation giving a more El Nino like mean state and more Indian Ocean Dipole positive events.
This is exactly what the observations show. The SOI is going increasingly negative and we have seen three IOD events in a row when previous we had never seen two. We have not seen a negative IOD event now since the early 1990s – unprecedented behaviour and driver for the highly unprecedented drought in southern Australia.
The Audubon case I gave above is fairly long and full of legal jargon especially at the top.
The part dealing with the history of water is found if one scrolls down to “1. Background and history of the Mono Lake litigation.”
E.M. Smith, absolutely correct about limiting growth by blocking expansion of water (and other necessary services). When some environmentalists are off the record, that is one subject I have overheard them talk about.
Roger E. Sowell
sonicfrog (05:27:29) : I guess you like high food and produce prices, as nearly 25 % of the U.S. farm output is from California. The place is not the problem here, it’s the people in power.
I’d even go further than that.
The state has a fault line (no, not the earthquake kind) that runs through it politically. There are 2 major urban basins that dominate everything else, and there is everything else. Rural California is just as revolted about the state government and actions as anyone in the rest of ‘fly over’ country would be.
All that is really needed to ‘fix’ California is to eject the SF/Bay area counties and the LA Basin counties from the rest of the state. Split them off into little city/states. Please. Pretty Please!
But it won’t happen. The L.A. water district wants to ‘own’ water all the way to Oregon. SF gets their water from the Sierra Nevada. Nope, not a chance.
Sidebar: SFO and Hetch Hetchy…
There is a valley that was reputed by folks like John Muir to be as full of beauty as Yosemite and just as cherished. That valley is Hetch Hetchy:
http://en.wikipedia.org/wiki/Hetch_Hetchy_Valley
It was dammed up so that San Francisco could get cool, clean, mountain snow melt water to drink year round through their own private water system. So, can you guess why S.F. is not interested in water issues? Why everyone else needs to cut back and conserve? And isn’t it interesting that any thought of restoration of Hetch Hetchy is met with an iron fist from San Francisco?
Hypocrisy does not even come close.
So when you can’t get food from the San Joaquin you at least know where to go for a cool glass of mountain water and a nice Espresso …
(Me? I’d tear the dam down in a heartbeat. It was right for the times, but now we can make all the water we want from sea water. I’d rather have a large industrial facility [ somewhere in all the empty industrial spaces in SF… there’s plenty of space that business has abandoned… even a pier or two… ] and a second Yosemite class vacation spot … oh, and all that water going where it ought to have gone, to the central valley river system. I like to fish and sit by the riverbank. And eat. )
My bias? I grew up in farm country in the central valley, but now I’m stuck in the SF Bay area in one of the urban jungle counties that would be in my ‘ejecta’ group… but looking to fix that Real Soon Now…
(For folks not in the computer biz: Real Soon Now is a bit of jargon used by programmers to mean “that thing I told you I would work on, but have done nothing about even though I want to, that will probably be ignored for another year or two, but you’ve asked me about, er, that?, yeah, I’ll get to it /sarcon Real Soon Now /sarcoff This is not meant hurtfully, it is meant as a recognition of the fact that your choices are institutionally driven and you too are drowning in management expedites… )
We might be getting a little of topic with painting the house white, etc., but it is very informative and entertaining. So I will mention Dr Chu to keep it on top.
About 43 years ago my Dad, a homebuilder, built his idea of what a house should be in Connecticut. It is a raised ranch, Rudolph Matern the architect, that has lots of windows and overhangs,built on a hill at about 800ft above sealevel running lengthwise from South to North on a wooded lot with 70 foot tall oaks, ash and maple.He planned it so during the summer the sun would be high in the sky and the trees and overhangs would block out the sun. During the winter the sun would be low in the sky and the sunlight would come into the house and shine on a large brick fireplace, thereby heating the house. By the way, he was “sold”on electric heat, and plumbers that put in furances and heating systems back in the mid 1960’s said electric heat was the way to go even if it was taking away work from them. It was the atomic genie that was supposed to provide cheap abundant and reliable power. But alas, that was before environmentalism, the EPA and three Mile Island. So it was constructed with thermopanes and loads of insulation too.
Now, since Dr Chu has a PhD in Physics and a Nobel prize, I would expect something more from him than painting the roof white. Like plant shade trees too, maybe.
By the way, the house has a almost white roof, Bird Seal King 3 tab shingles, FrostBlende was the color. Reason: Pure white looks cheap, but a near white roof would be cooler in the sun and last longer than a black or dark roof.
John Philip,
Would it make you happier if I said that “Dr. Hansen seriously contemplated a Super El Nino in 2007 and has already forecast a return to El Nino in 2009?
I’m not sure what your point is, because it seems clear that Dr. Hansen expects El Nino to be the dominant pattern in the future.
I am extraordinarily cheerful, thank you. My point was a small and simple one: it was factually incorrect to say Hansen predicted a super El Nino in 2006, as you did. I am assuming that getting your facts right matters to you as an author. I daresay your pieces go through several drafts before you publish; with some early thoughts being discarded as you decide what to include/exclude or you do your background research (e.g. on coral extinction or temperature series anomaly baselines). If I were to discover a draft of yours and ascribe things in it to you that you never published well that would be less than totally ingenuous, would it not?. Dr Hansen changed his mind on that prediction and never made it in public, to state otherwise is misleading.
As to Hansen’s views on the ENSO, here’s a direct quote.Summary: the Southern Oscillation and increasing GHGs continue to be, respectively, the dominant factors affecting interannual and decadal temperature change. Solar irradiance has a non-negligible effect on global temperature [see, e.g., Reference 7, which empirically estimates a somewhat larger solar cycle effect than that estimated by others who have teased a solar effect out of data with different methods]. Given our expectation of the next El Nino beginning in 2009 or 2010, it still seems likely that a new global temperature record will be set within the next 1-2 years, despite the moderate negative effect of the reduced solar irradiance..
Have a good weekend!
I asked this question at Tamino, but nobody answered. Can anybody here help?
******
A question: I was looking at the Multivariate ENSO index at: http://www.cdc.noaa.gov/people/klaus.wolter/MEI/
Looking at the graph, ENSO seems to have been in a predominantly cooling phase until the mid-1970s, then switching to a predominantly warming phase. Am I interpreting that correctly?
If so, could some of the recent warming have been attributed to carbon forcing, when it was actually due to a flip in ENSO? Of course, the flip in ENSO could also be due to global warming, I suppose.
I’d appreciate any advice on interpreting this.
E.M.Smith
According to The World Factbook published by the CIA, if California were an independent state, it would have had the tenth largest economy in the world in 2007.
The 10th largest economy in the world cannot survive on the revenue from a US$1.7 trillion gross product. The last legislative joke-of-a-budget passed by the California legislature had a built-in deficit of US$7 billion, a deficit which is now US$14 billion and on its way to US$40 billion in the near future. Reducing the size of the governmental “White Elephant” is never considered. There is a mandate that spending shall increase and shall never decrease. Maybe California will benefit from the bailout fever now afflicting the ruling class of hope and change and loan California US$14 billion to tide us over until the next budget deficit is legislated. The independent state of California will become a dependent state of the federal government. So goes California, so goes the Nation.
Frank Perdicaro proved himself to be a master of the understatement, when he said “California is poorly managed.”
re: desalinization
For some background info on Tampa’s desal plant and some of the problems encountered. They did not go into detail about the intakes sucking in too much sea grass and clogging them up. But then, they put the plant on the east side of Tampa Bay amongst the sea grass beds and not on the Gulf of Mexico.:
http://www.water-technology.net/projects/tampa/
Some folks insist that the current Australian drought is caused by AGW/CO2. That is silly, and history disproves that assertion.
Droughts in southern Australia are routine and periodic. The last two major droughts began in the late 1930’s, and in 1895: click
Only a few years ago southern Australia rainfall was well above average: click
I didn’t notice any climate modelers saying in 2005 that southern Australia would be in for an AGW-caused 100 year drought this year. But I’m sure someone will dredge up one randomly lucky guess out of thousands of wrong guesses, to ‘prove’ that models work…
…but of course if the models work, tell us what the temperature will be in Cleveland next Tuesday. Give us your predicted high and low temps. Will there be snow, sun, sleet or rain? Maybe an eclipse?
It appears to me that far too many people in the US, including people with PhDs in science, suffer from ADD . . . Arithmetic Deficit Disorder.
sonicfrog (05:52:41) : I’m not sure where this 95 % farm use vs. 5 % residential figure came from.
It’s 5% URBAN, 95% OTHER including farm… We flush a lot out to sea for, er, fish… No way does farming get 95% of the pie. But with Oregon as precedent, when the choice comes down to beef or salmon (pasture irrigation or wash out to the sea) the water is going out to sea…
My point was not that farming gets all the water, it was that cities are not relevant to solving the issue. Frankly, that’s part of why I’d like to see massive desalinization building. If the major urban counties (SF Bay, LA Basin) were from sea water, we would finally be focusing on what is wrong. Expecting average rainfall 90%+ of the time.
We need to be doing San Joaquin ground water recharge 1/2 the time so the other half we can pull out ‘average’ amounts…
But it’s probably an out of date number. I learned it back when we had about 20 something million population (not 37 million) but we didn’t have mandatory flow restricted showers then either …
Another argument for desalination plants instead of what is currently practiced here in Southern California: waste water recycling.
This is not likely to increase real estate prices in Southern California, but….our water powers-that-be are now recycling treated water from the poop-processing-plants (P3). The treated P3 effluent water is allowed to percolate through the soil until it replenishes aquifers, then is drawn out again via wells into the potable water system. The idea is to conserve water by re-use.
The problem is that P3s do not remove some rather serious chemicals and biologically active compounds, some of which are endocrine disruptors. We are talking about synthetic female hormones here, among other baddies. And they are in the public drinking water. The amounts increase year by year as the water is recycled from well to household, unused medicines are flushed down the toilet, processed in the P3, then percolates back into the aquifer.
Perhaps this explains some rather odd behavior by many Californians?
Btw…the Los Angeles Dept of Water and Power drinks bottled water at their meetings…they were horrified when someone (a reporter!) asked why are they not drinking tap water?
At times, So Cal can be rather amusing….I drink and cook with ONLY bottled water.
Roger E. Sowell
Marina del Rey, California
“No, really. I mean it. Look, pop the cash or we’re gonna wash your windshield.!”
Looks like I’m an amateur attempting banter with professionals.
davidcobb (07:08:08) : This is really silly because the wave regime off the California coast is perfect for wave acuated pumps.
BINGO! Give that man a Cupie Doll! We can power the whole state from a patch of ocean about 1 mile x 100 miles. That power (either directly as you proposed or via electricity) can run all the desalinizers we could ever want. Saudi Arabia uses sea water to grow crops…
We are just being incredibly stupid worshiping at the alter of the god of technophobia.
gary gulrud (07:11:00) : When AMO follows, sometime in coming decade(some say imminently) central plains drought will be added.
But then that’s a layman’s take from rural America.
I’d say it’s a mite more than that (“a layman’s take”). You probably remember ‘the dust bowl’ (by elder proxy). Folks in ‘rural America’ know more about it than folks in urban areas since their lives depend on such knowings.
Guess what: About that time, they fell off a sunspot peak like we are now. (I know, I’m risking setting off a Leif Bomb 😉 They fell off a local peak about 1870-80 and into a dip.
http://en.wikipedia.org/wiki/File:Sunspot_Numbers.png
Take a look at the solar / sunspot cycle. There is a periodic drop (serveral, actually). Look at the Maunder, Dalton, etc. Notice that 172-180 years is a strong cycle (Jose) but 1/2 that is too. Notice that 1/2 that cycle we had the dust bowl? We’re now falling from a high point to what is looking ever more like a very low point. Yet, the time series is too short for statistical validity.
IFF there is anything to ‘the sun did it’ as a hypothesis, then I find myself hoping for a ‘Dust Bowl’ event as the best outcome likely. (Avoiding Dalton and Maunder events.) If we are really lucky, the up slope on a line connecting the bottoms of Maunder, Dalton, Dustbowl will just keep on going up and the present ‘dip’ will not be a downturn in a larger cycle…
IFF we are astoundingly luck, there will be no connection at all between sunspots and drought. But that looks like a weak hand given Jevons work on agricultural cycles and sunspots.
A rural layman will be more in touch with what is going on than anyone in a lab somewhere. (Farmers talk about the weather and how it is like / not like 40 or 80 years ago more than anyone I know… Heck my Dad drummed into my head what the dust bowl was like and how they coped.)
I’m just strongly hoping that Charvatova, Fairbridge, Landscheidt, Geoff Sharp (nobwainer) and Vucevik are wrong while all the time the correlations just keep stacking up behind them!
It still bothers me that this is all ‘numerology’ and that there is no mechanism demonstrated ( a couple are proposed ) and I’m still having ‘issues’ with the “astrology and magnets” aspect of some of it; but:
The recent behaviour of the ozone map over the N.pole coupled with the sudden stratospheric warming event sure is starting to look like some kind of external particle / energy / magnetic finger reached into the area and stirred our pot. Vucevik and Geoff seem to be explaining things far better than ‘settled science’ and are blowing the doors off AGW GCM predictions.
Now if the ocean cycles (PDO, ENSO, AMO, etc.) are driven by such solar events, then it all starts to line up. Yes, the ‘random’ ocean currents explain it all; but the randomness is maybe not so random… And that implies that your observations about AMO are maybe going to be ‘spot on’.
Lets just hope that changed farming practices cope better with drought this time.
And yes, I know it’s all rampant speculation and that the best accepted explanation is the semi-chaotic solar standard model along with semi-periodic ocean oscillations. But all new insight starts with a bit of whimsy and speculation; and every oscillator I’ve ever built was subject to excursions from rather minimal external events.
(Fond memories of an old ‘regenerative detector’ tube radio. Touching the insulated nob shifted the frequency by a few kHz. Had to tune it ‘off’ a smidge or leave your hand on the knob for best reception 😉 Kind of a lost art these days…)
Me? I’m doing ‘watchful waiting’. We’ll see what happens and someone will be shown right or wrong. Until then, eyes and mind are open. But I’m not looking to buy farm land in Oklahoma…
(I have bought some grain futures, though. May have to add some water company stocks 😉
Don’t know about California, but around these parts, you paint your roof white and the Homeowner’s Association will swoop down like banshees and slap you with a huge fine for every day you leave it white. They’ll wind up selling your house off and pocketing the cash if you don’t put on a new roof with “approved” shingles.
In Southern Cal. the winter of 1862-1863 probably surpassed 1882-1883. It’s been a long time since I read the article on it but it put down something like 45 inches in a month, Xmas eve till late Jan. So. Cal. was one big lake, it wiped out what was left of the Californio cattle ranches. It was also mentioned in William Brewers excellent ‘Up and Down California.
sonicfrog (12:17:51) : Oh Yes. Read This! Fresno Unified created hired a new administrator, THEN froze the budget! […]
And there, in a nutshell, we have it. No money for paper, pencils or teachers, but they can hire a $148,000.00 a year administrator. Do do what?
“Our first foray into this equity and access work, we have identified hundreds of kids we can fix and help graduate,” he said. “That’s why we need this position.”
To make sure nobody is treated unfairly or has unequal access to a school system that is going out of business..
If we are all equally impoverished, then it’s fairer and that’s betterer…
Re: wave power:
Currently, and for the next week offshore California, waves are forecast at 14-21 feet (average of highest 1/3 of all waves), with individual waves at twice the average. Of course, we are having a significant weather system, too, with gale-force winds. (source: NWS)
There is an awful lot of potential energy in them thar waves…now, getting permission from the various state agencies…oh, never mind…
E.M.Smith, at least NorCal gets to drink fairly pure water from Hetch Hetchy…while we are forced to drink recycled
sewageP3 effluent…can we allege discrimination over this? (I know, I know…I’m a lawyer…I should know this one…)Tom in Florida, re Tampa’s desalination troubles: the same outfit is building the one in Carlsbad. We are hoping they learned some lessons from the Tampa site. I don’t think our ocean water in Carlsbad is warm enough to support grass, but there will likely be other stuff/critters to deal with.
Frank Perdicaro: poorly managed, indeed. Your idea has some merit, except that a 1976 law absolutely prohibits new nuclear power plants anywhere in California. Note the hypocrisy: California has no problem importing vast amounts of power from a triple-header nuke in Arizona, Palo Verde.
In any event, nuclear power has become prohibitively expensive, at $0.25 to $0.30 per kwh, as I noted in my blog.
Roger E. Sowell
gary gulrud (14:28:37) : Looks like I’m an amateur attempting banter with professionals.
Now wait a minute. I’ve been called a lot of things, but rarely ‘professional’. I insist you take that back or buy me a beer! ;=}
(liked your McCabe PDO cite, btw)
Roger Sowell (15:47:09) : at least NorCal gets to drink fairly pure water from Hetch Hetchy…while we are forced to drink recycled sewage P3 effluent…can we allege discrimination over this? (I know, I know…I’m a lawyer…I should know this one…)
Um, only SF, and a few cities that they let have some, gets Hetch Hetchy water. Folks from places they don’t like, get to drink
pond scumbay delta water or, as you pointed out, ‘ground recharge’ …We have ground recharge where I live. I don’t think it has p3 in it, only surface run off… you know, oil, mercury, asbestos, lead, viruses, toxic sprays, … We have a domestic drinking water filter and I’m adding a whole house system with reverse osmosis. Can we be included in your SF suit? 😉
(Sidebar: the mineral from which asbestos comes is common in the hills around here. I’ve sat on a big chunk of the stuff. We also have cinnabar that seasons a local river with mercury (fishing prohibited), that runs into the bay, that people fish in,…)
@ Robert Bateman (00:21:40) :
“Maybe if Tweedlee Gore and Tweedlee Chu keep running thier mouths we’ll get enough rain to fill the Reservoirs in the No. State and restore the Glaciers that the Modern Maximum has melted.”
Sadly, it’s only AGW hot air you will hear from these two idiots. Jabba would observe that this AGW position postulated by politicians, and the likes of the shill Al Gore, does not speak well for the state of science education on either side of the pond, in that the majority of individuals do not seem to be able to determine the fallacy of the AGW nonsense, which resolution, let face it, should not be beyond the capabilities of the average high school science student.
>Some folks insist that the current Australian drought is caused by AGW/CO2. That is silly, and history disproves that assertion…
No they do not. BUT it is the hottest drought ever witnessed and the longest and has by far the lowest river flows. Global warming has exacerbated it and the lack of negative IOD events has contributed to a decline in autumn rainfall which is a unique feature of the climate in the region. There are numerous papers in the scientific literature on the warming drying trends in this region.
Meanwhile the southeast Australia – today – is experiencing the most severe February heatwave on record and will quite possible have the hottest day ever recorded. This heatwave has killed hundreds and cost 100s millions in damages. You can keep track of this horrific situation via http://www.abc.net.au/news .
Stick to the northern hemisphere Smokey…
Last year the lakes gained quite a bit…. then the decision was made to do a massive discharge (both Powell and Mead). It seems some fish downstream wanted to wash their teeth real well or something.
They dumped Shasta and Trinity (and possilby Oroville), too. The agency in charge claimed that the decision was made when the Feb. snow pack showed above normal, and that when April rolled around and no more rain/snow had fallen, their hands were tied. Maybe their feet should have been tied also.
Sorry, DJ, you can’t presume to speak for everyone else [“No they do not.”]
Plenty of people blame CO2 for anything and everything.
But if you think that CO2 is not the cause of weather events or climate changes, welcome aboard.
There has been global warming since the last Ice Age, when Chicago was buried under a mile of ice. It is a natural event, and CO2 has nothing measurable to do with it. The very *slight* global warming of the 20th century was entirely natural, as was the recent reversion to the mean.
I feel very bad for our Australian friends, because a drought like they’re experiencing is one of the toughest situations to endure. But it is entirely natural.
DJ Said:
I think you mean climate change don’t you. That’s the new in term among the hysterical alarmists.
The funny thing is that the last time I was back in Australia the country folk I spoke to said that things are looking like they did back 60-70 years ago.
There are some folks who have got a clue out in the country. Now I understand their distrust for those city-bred smarty pants.
“” E.M.Smith (16:16:55) :
gary gulrud (14:28:37) : Looks like I’m an amateur attempting banter with professionals.
Now wait a minute. I’ve been called a lot of things, but rarely ‘professional’. I insist you take that back or buy me a beer! ;=}
(liked your McCabe PDO cite, btw) “”
“Professionals” do not have jobs; they have “practices”, and they practice on their “clients”.
And since they are just practising, they aren’t too good at it; so no “professional” will ever give you a money back guarantee. Further evidence of their expertise, is that they have to have malpractice insurance to cover their a*** when they screw up.
Then finally, professionals are always protected by laws that prohibit you from horning in on their racket, and trying to “practise” yourself. So if you don’t belong to their club, you will be prosecutred for practising without a licence.
So don’t ever call me a professional; my stuff has to work or I get fired. If my customers don’t buy my products of their own free will; we go broke, and I get fired.
the mineral from which asbestos comes is common in the hills around here. I’ve sat on a big chunk of the stuff.
I can’t remember the fibrous rock in that area. Is that chrysotile?
In Colorado, the only thing we like about southern California is that it is down stream. (when we flush) I still remember the Left coast suing us over water from the Colorado River. (so they could flush)
I have trouble sympathizing with a state that waters the medians of it’s freeways. If God wants our medians green, He makes it rain.
We do have our own nutcases. High plains desert and Blue grass do not mix. My neighbor spills more water down the storm drain whenever he waters his lawn than I use in a month. His yard looks better. My bank account looks better. See comment about green medians above.
Xeriscape. Green. Conservation. As in conserving small pieces of green paper with pictures of dead presidents and statesmen.
Too simple a concept for most politicians.
Graeme Rodaughan (04:45:55) :
Added my warming is a myth vote.
DaveE.
E.M. Smith, re
“(Sidebar: the mineral from which asbestos comes is common in the hills around here. I’ve sat on a big chunk of the stuff. We also have cinnabar that seasons a local river with mercury (fishing prohibited), that runs into the bay, that people fish in,…”
Yup, that asbestos is wicked stuff…I have some dealings with that as an attorney…mostly construction-related. Contractor goes excavating in dirt then hits some of that and people nearby sue just in case they breathed a little bit.
We also have people down here who fish in creeks where signs are posted saying do not fish-water is not clean; and people swim in lagoons near Malibu where the green scum is also brown…
Retired Engineer
I also wondered about why California wastes water on the freeway medians and sides when I first moved out here. Then found that it is part of that P3 recycling plan: the water is from a poop-processing-plant effluent. Also, it is used to water golf courses, and by law all dust-control watering during construction must use recycled water, if available. No kidding, folks. That P3 recycle is everywhere.
We had a construction job where the union workers threatened to walk off because they discovered that the dust-control water was P3 effluent. The owner caved and used potable water. The P3 effluent water is unmetered and free, but the owner had to pay for the potable water. The workers were concerned that they would get very ill from the water spray entering their eyes and lungs, and into shallow cuts that most construction guys have on their hands.
And all that median-watering helps to consume CO2 from our ever-warming atmosphere. In fact, the man-planted greenery in So Cal should make every warmist happy…we are doing our part to counter the deforestation in other parts of the globe. We have a town called Woodland Hills, with lots of trees. I met a lady whose dad developed Woodland Hills, and planted the thousand and thousands of trees where there was nothing before.
I wonder if we will see any increase at Mauna Loa’sCO2 measurements later this summer, as California grows zero crops due to insufficient water, and the CO2 remains in the sky. 😉
Can we sue the State Water Department for failure to provide water, thus contributing to global warming? 😉
John Galt (08:28:08) wrote: BTW: Shade trees are a wonderful thing. In the summer, the leaves help keep the sun off your home…
And maybe add the new research, John, which shows leaves have an inbuilt capacity to monitor and control their own temperature, thereby creating a cooler zone below them in hot weather. (“Magic” is as nothing compared to the wonders of natural things.)
Tree leaves control their own temperature
>I think you mean climate change don’t you. That’s the new in term among the hysterical alarmists.
Climate scientists have always talked of climate change AND global warming.
It is the “sceptics” who made the big switch in response to research by Luntz who worked for the republican party. Thanks to the internet the truth is know by those who care to look (http://www.guardian.co.uk/environment/2003/mar/04/usnews.climatechange).
Your understanding of history and terminology is worse than the climate knowledge I see here.
>There has been global warming since the last Ice Age, when Chicago was buried under a mile of ice.
CO2 went up from 180 to 280ppm over that period. That explains a large part of the warming.
This is document extensively in the peer review climate science literature.
malcolm (12:52:13) :
Very good, that’s exactly what you’ll read about in http://www.intellicast.com/Community/Content.aspx?ref=rss&a=151 – an article by Joe D’Aleo on “Pacific Decadal Oscillations Closely Tied to ENSO”. He also has found that global temps correlate better with the PDO than with CO2. Expect 30 years of cooling….
White slows the radiative transfer, keeping the house interior temp more stable. Black increases transfer, so temp swings more inside. As far as the sides of the house, most of the time each side isn’t in sunlight, winter or summer (especially at night), so we lose more heat than we gain with black. With white, less gain in the short sunlight time, less loss in the long darkness.
Congress should pass a law mandating white roofs and white walls. Or would that be racist? Insensitive at least. Maybe green.
I recall several decades ago, I was reading up on solar water panels, and an article said that dark green paint was as effective as black. Placing my hand on different colored cars in a sunny Houston parking lot, I’d say that’s about right. Pearlescent white is the coolest.
Has anyone seen this yet? Met O announces global cooling to 2014.
http://www.telegraph.co.uk/topics/weather/4534358/Snow-Britain-Further-snow-and-ice-forecast-for-rest-of-the-winter.html
“Despite global warming there could be further colder-than-average winters in the years ahead as the climate cools naturally, the Met Office believes. Mr Britton said that the last 10-year assessment – carried out in 2004 – suggested a decade where global warming would be held back by a natural cooling trend. But beyond 2014 the climate will resume its warming trend, he said.”
If that really came from Met O it is the biggest whopper they’ve come up with yet.
In August 2007 after a failed “prediction” in January and again in April for the warmest year on record, Met O stated:
“Climate scientists at the Met Office Hadley Centre will unveil the first decadal climate prediction model in a paper published on 10 August 2007 in the journal Science. The paper includes the Met Office’s prediction for annual global temperature to 2014.
Over the 10-year period as a whole, climate continues to warm and 2014 is likely to be 0.3 °C warmer than 2004. At least half of the years after 2009 are predicted to exceed the warmest year currently on record”
The emperor has no clothes.
E.M.Smith (14:42:47) :
Guess what: About that time, they fell off a sunspot peak like we are now. (I know, I’m risking setting off a Leif Bomb 😉 They fell off a local peak about 1870-80 and into a dip.
1880 is an interesting period…there is a left over angular momentum disturbance from the Dalton group of 3 (the first one fired, the second fizzled) but it looks like SC12 could have been a single cycle grand minimum that has certainly happened in the past.
http://landscheidt.auditblogs.com/files/2008/12/ultimate_graph2.jpg
I can’t remember the fibrous rock in that area. Is that chrysotile?
Asbestos forms in Serpentine, along the Great Serpentine belt in the Mother Lode. Most asbestos in Ca. is long-fiber.
You cannot mine the stuff because there are chrome kidneys that are classified as strategic minerals in the Serpentine. So we import our chrome from Rhodesia last I checked (10yrs ago).
So we had asbestos mined that was short-fiber, the one that is dangerous to breathe.
See what happens when government acts because it looked good on paper?
AGW is an accident looking for a place to happen.
Just don’t paint your cedar shingles with latex paint, they will surely rot as moisture is trapped underneath the plastic paint.
Contractor love ignorant homeowners who paint their redwood or cedar decks with latex. They can see the money forming before their eyes.
DJ: “It is the “sceptics” who made the big switch in response to research by Luntz who worked for the republican party.”
Thanks for that link. I had a suspicion that focusing on ‘climate change’ rather than ‘global warming’ was a sceptic strategy, since we are often treated to such claims as ‘the climate is always changing’, which suggests an underlying meme.
Whatever the case, this accusation is an interesting case of projection and scapegoating. A sceptic invents the strategy, and the blame is then transferred to the warming side.
On the warming side, the IPCC has been in existence for almost 20 years now, so the phrase ‘climate change’ as a synonym for ‘anthropogenic climate change’ is hardly new. It’s hard to see how sceptics could overlook this fundamental fact.
Smokey says:
In addition to DJ’s note that rises in CO2 did indeed have something to do with the warming since the last ice age, it is also worth noting this: If your logic is to attribute the warming in the 20th century to still being due to warming out of the last ice age, we could note that if we had warmed for the last ~15,000 years since the last global maximum at a rate of ~0.7 C that was seen in the 20th century, then the Earth’s average temperature would be somewhere around or a little bit above 100 C, i.e., the above the boiling point of water, by now!
Ric Werme: Brilliant. Thanks heaps.
But I’m shocked. It’s pretty clear then that a good part of the 1950-2000 temperature trend has nothing to do with carbon forcing, and is due to PDO/ENSO interactions.
To ignore that, and attribute all the recent trend to carbon forcing, seems like unbelievably sloppy science. A classic case of model mis-specification. I can’t imagine even a bright second year econometrics student would make that mistake.
Or have I missed something? I’d hate to think AGW trend estimates were reliant models with such a basic error. Is there a trend estimate that has the PDO/ENSO component removed? Surely that would be a basic and essential building block for a credible policy making.
That’s exactly the Obama, enc., strategy as we speak, concerning the “stimulus” package qua “agenda”. It’s urgent, but most especially for those pushing it:
The only important thing for today’s LIberals [Faux Liberals] is The Agenda in itself, totally apart from anythng else, such as real effects – importantly including the untoward side-effects of The Agenda as applied.
If The Agenda is “moved forward”, they are “making progress”. If The Agenda is achieved, then they “win”, thus allegedly making themselves meaningful as existent beings. That’s really the important thing to Faux Liberals about pursuing The Agenda – making themselves [seem/feel] meaningful, in the face of being alive and thus having to live.
Unfortuneately, this tactic never achieves the satisfaction or placitude they seek, so they must keep doing the same sort of thing over and over, obsessively, kind of like a super bad “Groundhog Day” scenario.
It’s got to be Hell in there for a Faux Liberal “mind”. It’s bad enough for the rest of us on the outside who then have to deal with the practical effects of The Agenda.
It riles the experts to say so, buit I have seen white-painted weatherboard (clapboard USA?) houses still standing after a bushfire (wildfire USA) has gone through and eaten every other house of various other materials for breakfast…
Dunno quite why these experts get so het when this little piece of bush lore is mentioned.
Mr Chu appears to be taking the most extreme AGW predictions and running with them. That is most alarming. In a Westminster system, his job would equate to a top government minister? Sounds like he’s bought the whole story, and has effectively given up hope of any possibility of remedial action, the situation is so critical. Funnily enough, I can still find California oranges here in my local supermarket in Australia.
Also concerning the Trenberth. This is what he says:
” While our exploratory analyses are suggestive and form useful hypotheses for future work, climate models do not yet simulate El Niño well enough and are too different from each other to have any confidence in their projections.”
DJ Said:
You got one thing right. I am an AGW sceptic.
Both climate change and warming since the last ice age are facts of life, but I have a great deal of doubt that CO2 has anything to do with either.
I put my name to my statements.
I see you lack both the courage and decency to do the same.
Brendan H,
There is no skeptic ‘strategy,’ other than to say: prove it. Prove your AGW. Or at least provide strong empirical evidence that AGW has measurably forced the climate out of its natural historical variation. The status quo has nothing to prove; AGW believers do. That is called the Scientific Method. I swear, you folks must live in your own little bubble, believing that the status quo needs to falsify the new hypothesis on the block.
It is the other way around. The AGW hypothesis has the burden of falsifying the accepted theory that the climate varies naturally within its normal historical parameters; so far, it has failed to show this.
To repeat once again, it is up to the purveyors of any new hypothesis, such as AGW, to show convincingly that their newly invented conjecture is more credible than natural climate variation.
Runaway global warming promoters have abjectly failed to provide any solid, empirical evidence [computer models don’t count] to advance their AGW/CO2/climate catastrophe agenda.
But you folks did succeed in one thing: agreeing with the skeptic position that AGW is political, by bringing ‘republican’ into an otherwise scientific discussion.
And Joel… please. I see what you did there. By framing your argument that “at a rate of ~0.7 C that was seen in the 20th century,” you want us to assume that the .7 degree rate has been a uniformly consistent rise throughout the past 11,000 years. Don’t be silly. The fact that the .7 degree increase was almost completely retraced back to the long term trend by the end of 2008 falsifies that premise. Global temps are now at their 1980 level. Do I have to provide yet another chart?
RC would welcome you with open arms. But folks here at the “Best Science” site [which trounced RC by almost 10 – 1] own your failed AGW/CO2 hypothesis.
You’re not making any headway. Time to stop digging that hole.
Brendan H wrote:
I had a suspicion that focusing on ‘climate change’ rather than ‘global warming’ was a sceptic strategy, since we are often treated to such claims as ‘the climate is always changing’, which suggests an underlying meme.
You don’t like “climate changes”? How about Historical Variability: ice age to Roman Optimum. It’s up to the warmists to prove that the current conditions are unnatural and catastrophic.
And there was no mention of having to choose a president from AG and GWB?
>Whatever the case, this accusation is an interesting case of projection and scapegoating. A sceptic invents the strategy, and the blame is then transferred to the warming side.
The luntz PDF is on the web if you do a search. There are a number of classic interviews where climate change “sceptics” quickly correct themselves when they say global warming.
Luntz now acknowledges climate change is real and substantial threat. Sadly, those who hired him and use his communication tactic continue to believe otherwise.
Smokey: “There is no skeptic ‘strategy’…”
Notice that I said “a strategy”, not ‘the’ strategy. Luntz is a sceptic, and he developed a strategy, or at least tactic, for handling public perceptions of global warming.
“…natural historical variation. The status quo has nothing to prove…”
So ‘natural variation’ is the status quo or established position? Galileo challenged the established position. That makes AGWers = Galileo. Always knew it. Thanks for the confirmation.
“The AGW hypothesis has the burden of falsifying the accepted theory that the climate varies naturally within its normal historical parameters…”
AGW theory need only show that it is a better explanation than ‘natural variation’, which is useless as a theory since it explains everything and nothing.
“…by bringing ‘republican’ into an otherwise scientific discussion.”
I refer you back to the original comment by Richard Sharpe (17:53:36): “I think you mean climate change don’t you. That’s the new in term among the hysterical alarmists.”
Nothing very scientific about that comment. Furthermore, the context of the Luntz tactic is important: it was advice for sceptics, but not just any old sceptics, rather the Republican party and the Bush administration. Hard to downplay the importance of that context.
Rhys Jaggar (00:53:48) :
3. One wonders whether Dr Chu is angling for a job at Kleiner Perkin Caufield and Byers in a couple of years, who are no doubt delighted that he is talking up the need for new clean tech companies and products in their region?
I’m sure K.P. non exec director Al Gore could put in a good word for him…
4. Perhaps the answer is a series of transitory canals for water shovelling around the country? After all, with any weather, it seems to chuck it down somewhere. Washington State might have too much in the years ahead and Tennessee can ship it to Florida, perhaps?
My father is one of the civil engineers who developed the ‘National Water Grid’ in the UK. It ain’t rocket science. The Romans were doing this stuff 2000 years ago. Google ‘pont du gard’. An awsome structure when you stand right up close to it.
Brendan H, your last paragraph says it all. With you, AGW is completely political. Which is to say, unscientific. Go ahead, deny it. But your last paragraph makes it crystal clear to the most casual observer where you’re coming from.
I stand behind my 22:43:10 statement 100%. And I notice that you avoided answering any of the points that I raised. Let me ask you straight out: do you believe that people on this site are stupid?
Look at Katherine’s post above. Is she stupid, too? Is she deluded? Is everyone deluded — except for you and the handful of others who believe that an increase in a very minor trace gas is gonna getcha?
Tell us again how stupid we all are to accept natural climate variability. Should we unquestioningly accept what you hypothesize, without any measurable empirical evidence to back you up? And if so… why? Why should we believe that?
Joel is correct, the rate of change over the last century is at least an order of magnitude greater than that the planet undergoes when entering an interglacial, and the idea that global mean temperature is at 1980 level is absurd. [unless you indulge in some outrageous cherry-picking of individual months].
It is actually the ‘natural-only’ advocates who have the evidence shortage; no known natural driver of climate is capable of explaining the recent trend, whereas it is entirely consistent with natural fluctuation superimposed on an anthropogenically-forced rising trend.
Brendan H (01:48:15) :
So ‘natural variation’ is the status quo or established position? Galileo challenged the established position. That makes AGWers = Galileo. Always knew it. Thanks for the confirmation.”
Nice leap of logic there Mr H.
Santa Claus will be round soon with your medicine……..
Brendan H.
I think you will find that Galileo challenged the position of the tenets of the Catholic Church which was taxing the people (tithes) and enjoying the high life at everyone else’s expense on the premise of a set of beliefs that could not be proven, but nonetheless became woven into the fabric of the law of the lands globally. Does this sound familiar?
G’day Graeme Rodaughan (04:45:55),
I’va also voted for global warming being a myth along with an astounding 90+% of readers. The only problem with this is that Aunty ABC will now feel the need to indoctrinate.. umm make that educate, we non-believers. Penny Wong, the golden child of climate change debate will anaesthetise more audiences with her soporific rhetoric as Aunty tries to inculcate the myth into viewers’ and listeners’ minds. Thank the Lord for remote control 😉
John Phillip
If you were to discover that the underlying trend may have arisen almost entirely from controversial adjustments to the raw data would you change your tune?
http://wattsupwiththat.com/2007/09/19/grilling-the-data/
Said adjustments, which assume biased error in the raw data, of course defy our common understanding of instrument error by not following a normal distribution. They instead seem to add 0.6 degrees of warming to the data before it even reaches Hadley. Heaven knows what Hadley then does with the data because they won’t say. We do know that they perform further adjustments though; they’ve told us that much. We also know that GISS has introduced a higher trend by adjustments.
http://www.theregister.co.uk/2008/05/02/a_tale_of_two_thermometers
Since Hadley and Giss seem to match well in the 30’s then we can assume that their adjustments are somewhat similar. Can we trust any adjustments that not only assume error in one direction only, thus defying our common experience, but which are of a magnitude equal to the final signal. Well you might but I don’t! I’d like to see a 20th century reconstruction using only the raw data.
Of course much of the trend may well also come from the now discredited sea surface data, where the temperature was mostly ascertained by throwing a bucket over the side, scooping up some water and sticking a thermometer into it. Of course there’s a bucket adjustment to be done for that too. The last 5 years of proper sea surface temperature measurement show no rising trend: And they only got that because they adjusted an apparent cooling trend upwards. Too little data of course but a sight more reliable than the junk data that came before.
I’m fairly sure we can likely trust the satellite data from 79, which of course shows warming for 20 years and plateauing for 10 years. This short record may be ok though because the IPCC says only the since 1950 can we attribute any human warming to the data, despite the number of people (you included) who claim attribution over the entire twentieth century. And of course, from 1950 to 1975 we were supposed to have had artificially cooling by aerosols if you believe one of the more popular AGW handwaves. Was that 20 year warming trend then a recovery due to cleaner air? I don’t believe that’s a defensible argument, though it’s consistent with AGW dogma and has some papers to back it up. But then I don’t accept that natural variation has been properly accounted for either.
One of the few places we can probably trust the data is in the Arctic, where apparently it’s as warm now as it was in the 30’s. Also the relatively well-tested US data suggests the same thing. So if it’s a natural cycle then we may be in for a cooler period in the Northern hemisphere. Time will tell.
DJ (19:25:15) : “CO2 went up from 180 to 280ppm over that period. That explains a large part of the warming.”
Methinks it was the other way around.
I regret that it isn’t so because I would certainly like it a lot warmer. If we could warm our Earth by putting more CO2 into the atmosphere, then I say pump away!! Warm is good.
While I do not subscribe to consipracy theories, this is interesting:
Excerpt from
http://www.green-agenda.com/
THE GREEN AGENDA
We all want to be wise and careful stewards of the beautiful planet we call home. However, certain aspects of the modern green movement that is permeating every segment of our society are not about protecting the environment. You don’t have to dig very deep to discover the true beliefs of the influential leaders who are using genuine concerns about the environment to promote an agenda of fear and control. Please carefully consider the implications of the opinions that they so openly and freely express:
(references and sources for the quotes below can be found here)
“The common enemy of humanity is man.
In searching for a new enemy to unite us, we came up
with the idea that pollution, the threat of global warming,
water shortages, famine and the like would fit the bill. All these
dangers are caused by human intervention, and it is only through
changed attitudes and behavior that they can be overcome.
The real enemy then, is humanity itself.”
– Club of Rome,
premier environmental think-tank
consultants to the United Nations
~~~~~~~~~~~~~~~~~~~~~~~~~~~~~~~~~~~~~~~~~~~~~~~
“We need to get some broad based support,
to capture the public’s imagination…
So we have to offer up scary scenarios,
make simplified, dramatic statements
and make little mention of any doubts…
Each of us has to decide what the right balance
is between being effective and being honest.”
– Stephen Schneider,
Stanford Professor of Climatology,
lead author of many IPCC reports
~~~~~~~~~~~~~~~~~~~~~~~~~~~~~~~~~~~~~~~~~~~~~~~
“Unless we announce disasters no one will listen.”
– Sir John Houghton,
first chairman of IPCC
~~~~~~~~~~~~~~~~~~~~~~~~~~~~~~~~~~~~~~~~~~~~~~~
“It doesn’t matter what is true,
it only matters what people believe is true.”
– Paul Watson,
co-founder of Greenpeace
~~~~~~~~~~~~~~~~~~~~~~~~~~~~~~~~~~~~~~~~~~~~~~~
“We’ve got to ride this global warming issue.
Even if the theory of global warming is wrong,
we will be doing the right thing in terms of
economic and environmental policy.”
– Timothy Wirth,
President of the UN Foundation
~~~~~~~~~~~~~~~~~~~~~~~~~~~~~~~~~~~~~~~~~~~~~~~
“No matter if the science of global warming is all phony…
climate change provides the greatest opportunity to
bring about justice and equality in the world.”
– Christine Stewart,
fmr Canadian Minister of the Environment
~~~~~~~~~~~~~~~~~~~~~~~~~~~~~~~~~~~~~~~~~~~~~~~
“The climate crisis is not a political issue, it is a moral and
spiritual challenge to all of humanity. It is also our greatest
opportunity to lift Global Consciousness to a higher level.”
– Al Gore,
Nobel Peace Prize acceptance speech
~~~~~~~~~~~~~~~~~~~~~~~~~~~~~~~~~~~~~~~~~~~~~~~
“The only way to get our society to truly change is to
frighten people with the possibility of a catastrophe.”
– emeritus professor Daniel Botkin
~~~~~~~~~~~~~~~~~~~~~~~~~~~~~~~~~~~~~~~~~~~~~~~
“We are on the verge of a global transformation.
All we need is the right major crisis…”
– David Rockefeller,
Club of Rome executive member
~~~~~~~~~~~~~~~~~~~~~~~~~~~~~~~~~~~~~~~~~~~~~~~
“Humanity is sitting on a time bomb. If the vast majority of the
world’s scientists are right, we have just ten years to avert a
major catastrophe that could send our entire planet’s climate system
into a tail-spin of epic destruction involving extreme weather, floods,
droughts, epidemics and killer heat waves beyond anything we have
ever experienced – a catastrophe of our own making.”
– Al Gore,
An Inconvenient Truth
~~~~~~~~~~~~~~~~~~~~~~~~~~~~~~~~~~~~~~~~~~~~~~~
“We are getting close to catastrophic tipping points,
despite the fact that most people barely notice the warming yet.”
– Dr James Hansen,
NASA researcher
~~~~~~~~~~~~~~~~~~~~~~~~~~~~~~~~~~~~~~~~~~~~~~~
“By the end of this century climate change will reduce the human
population to a few breeding pairs surviving near the Arctic.”
– Sir James Lovelock,
Revenge of Gaia
~~~~~~~~~~~~~~~~~~~~~~~~~~~~~~~~~~~~~~~~~~~~~~~
“Climate Change will result in a catastrophic global sea level
rise of seven meters. That’s bye-bye most of Bangladesh,
Netherlands, Florida and would make London the new Atlantis.”
– Greenpeace International
~~~~~~~~~~~~~~~~~~~~~~~~~~~~~~~~~~~~~~~~~~~~~~~
“This planet is on course for a catastrophe.
The existence of Life itself is at stake.”
– Dr Tim Flannery,
Principal Research Scientist
~~~~~~~~~~~~~~~~~~~~~~~~~~~~~~~~~~~~~~~~~~~~~~~
“Climate Change is the greatest threat that
human civilization has ever faced.”
– Angela Merkel,
German Chancellor
~~~~~~~~~~~~~~~~~~~~~~~~~~~~~~~~~~~~~~~~~~~~~~~
“Climate change is real. Not only is it real, it’s here,
and its effects are giving rise to a frighteningly new
global phenomenon: the man-made natural disaster.”
– Barak Obama,
US Presidential Candidate
~~~~~~~~~~~~~~~~~~~~~~~~~~~~~~~~~~~~~~~~~~~~~~~
“We simply must do everything we can in our power to
slow down global warming before it is too late.”
– Arnold Schwarzenegger,
Governor of California
~~~~~~~~~~~~~~~~~~~~~~~~~~~~~~~~~~~~~~~~~~~~~~~
…continued at
http://www.green-agenda.com/
http://scienceandpublicpolicy.org/images/stories/papers/originals/jan_co2_report.pdf
SPPI MONTHLY CO2 REPORT – JANUARY 2009
The Bush Years: 8 years of global cooling
SPPI’s Monthly CO2 Report shows that throughout the eight years of George Bush’s presidency there has been a downtrend in global temperature at a rate equivalent to 2 °F (1.1 °C) per century. Main points –
Since Al Gore’s climate movie An Inconvenient Truth was launched in January 2005, global cooling has occurred at the equivalent of 11 °F (6 °C) per century. If this very rapid cooling were to continue, the Earth would be in an Ice Age by 2100.
The UN’s climate panel, the IPCC, had projected temperature increases at 4.5 to 9.5 °F (2.4 to 5.3 °C) per century, with a central estimate of 7 °F (3.9 °C) per century. None of the IPCC’s computer models had predicted a prolonged cooling.
The IPCC’s estimates of growth in atmospheric CO2 concentration are excessive. They assume CO2 concentration will rise exponentially from today’s 385 parts per million to reach 730 to 1020 ppm, central estimate 836 ppm, by 2100.
However, during President Bush’s eight-year term, CO2 concentration rose in a straight line towards just 575 ppmv by 2100.
This alone halves the IPCC’s temperature projections. Since 1980 temperature has risen at only 2.5 °F (1.5 °C) per century.
The University of Colorado has published no sea-level data from the JASON
monitoring satellite since the summer of 2008.
However, sea level has been rising at just 1 ft (32 cm) per century, well below the IPCC’s recently-reduced 2 ft maximum.
Sea ice extent in the Arctic recovered to the 30-year average during the early winter of 2008. In the Antarctic, sea ice extent reached a record high late in 2007, and has remained plentiful since. Global sea ice extent shows no trend for 30 years.
The Accumulated Cyclone Energy Index is a 24-month running sum of monthly energy levels in all hurricanes, typhoons and tropical cyclones. The Accumulated Cyclone Energy Index hit a 30-year low in October 2008.
A paper explaining how SPPI’s CO2 and temperature graphs are computer-generated is under peer review and will be available soon.
For future editions of the Monthly CO2 Report, go to http://www.scienceandpublicpolicy.org
The Chu Effect seems to be kicking in hard. NCEP is forecasting 7+ inches of rain for the Central Valley of California over the next two weeks.
http://wxmaps.org/pix/prec1.html
Brendan H (01:48:15) :
AGW theory need only show that it is a better explanation than ‘natural variation’, which is useless as a theory since it explains everything and nothing.
John Philip (03:17:05) :
It is actually the ‘natural-only’ advocates who have the evidence shortage; no known natural driver of climate is capable of explaining the recent trend, whereas it is entirely consistent with natural fluctuation superimposed on an anthropogenically-forced rising trend.
Interesting set of propositions.
Guys, you can’t have it both ways. Time to huddle and see if you can agree, before you try to convert the unwashed masses.
HINT: I would want to revisit the phrase “no known natural driver of climate is capable of…” Your sense of climate history sound suspiciously ‘Lyellian.’ I’m sure there are many posters here who can point you to historical instances of change as “rapid” or more rapid than the 20th c. uptick. Whether the cause of these trendings has been definitively established is not at issue (HINT: Google “Svensmark”). I trust you will acknowledge that they were not, like the warming trend from c. 1880-1940, a result of human CO2 emmissions.
That’s assuming that the real cause of the 20th c. dynamic is not heat islands, data corrupted by manipulation, and other, um, “natural” causes like the power of money to deform institutionalized science. And its also assuming that we ignore the increasingly evident divergence between accumulating C02 and stable or even slightly declining temperatures over the past 8 years.
“Scare,” a two-minute video highlighting the scare tactics of global-warming alarmists was produced for the Heartland Institute. Heartland released the video in the wake of former vice president Al Gore’s claim before a U.S. Senate committee January 28 that “scientists are practically screaming from the rooftops” about the threat of global warming.
The first part of “Scare” shows President Barack Obama asserting that “the science is settled” on global warming and alarmist predictions of death and destruction. The voice-over suggests some of the alarmist propaganda is backed by “corporations heavily invested in so-called green technology.”
With video footage of social and political unrest flashing, the video warns that the “cost of force-feeding these technologies into every corner of our lives could bankrupt a world already teetering on financial ruin.”
The second half of the video features several science-based facts about climate change, including that the Earth has been cooling in recent years and global temperatures have been warmer than today for most of the past 10,000 years.
It concludes by inviting viewers to attend the International Conference on Climate Change, where they can learn the Earth isn’t in crisis, and the presenters “have the science to prove it.”
“This is a provocative video on one of the most important public policy issues of day,”said Joseph Bast, president of The Heartland Institute. “Heartland has distributed more than 1 million videos and books presenting scientific and economic facts that show global warming is not a crisis. We hope this video and the conference it is helping to promote are the final stake in the heart of global warming alarmism.”
The video is available on several sites on the Web, including YouTube, Heartland’s Facebook page, and at http://www.heartland.org
I agree with you, but I actually don’t mind when this happens, as there has been a major shift recently – previously, the Penny Wongs and the MSM could get away with trying to indocrinate, since most people didn’t have an opinion one way or the other.
But the public opinion has changed (as we see in the poll, limited though it is). Now, the more desperate the AGWers get, the more nonsense they make up (like the report stating that global warming can cause a change in Earth’s rotational axis – yeah right!). They are making bigger fools of themselves, and more people are seeing this. So bring it on, I say, let’s see where it leads.
I wonder if Anthony, or any of the stats experts who post here, have seen any studies of public statements (media, gov’t, etc.) that chart the use of the terms “Global Warming” and “Climate Change” versus the meteorological season.
I’d bet the same entities (AP, NYT, GISS) use “global warming” in the summer and “climate change” when it’s cool.
Video called “Snowjob” quoting scientists…
Joel Shore (21:00:32) :
In addition to DJ’s note that rises in CO2 did indeed have something to do with the warming since the last ice age, it is also worth noting this: If your logic is to attribute the warming in the 20th century to still being due to warming out of the last ice age, we could note that if we had warmed for the last ~15,000 years since the last global maximum at a rate of ~0.7 C thatDwas seen in the 20th century, then the Earth’s average temperature would be somewhere around or a little bit above 100 C, i.e., the above the boiling point of water, by now!
Why would anyone want to assume that the trend you are discussing is linear? And if it is supposed to be linear, your theory of causation has been falsified by the last eight years of stable temps coupled with significantly rising C02 — a trend that, in my estimation, appears likely to continue for the forseeable future as we enter what looks to be a doozy of a solar minima.
Face it: the system is more complex by an order of magnitude than CO2 models allow. There are other long term factors, such as the size and strength of the solar magnetosphere and its impact on low level cloud formation, as well as oceanic thermal mass and thermal flows, antarctic albedo, etc, that are at least as important as C02.
Drivers like changes in the solar magnetosphere (and other factors influencing cloud formation) have been shaping the planet’s climate for millions of years, producing the kind of oscillations in temperature incorrectly identified by Al Gore as being caused by C02 increase, without the help of human beings.
Could CO2 be an influence? Sure. Maybe. But, as others have said on this thread, the burden of proof is on the warmists, and so far, you’ll haven’t even come close to supplying it.
“I don’t think the American public has gripped in its gut what could happen,” he said.
Chu made clear that he sees public education as a key part of the administration’s strategy to fight global warming…
But he said public awareness needs to catch up. He compared the situation to a family buying an old house and being told by an inspector that it must pay a hefty sum to rewire it or risk an electrical fire that could burn everything down.
“I’m hoping that the American people will wake up,” Chu said, and pay the cost of rewiring.
This is straight out of George Orwell. We have the ministry of Truth needing to “educate” the masses who still haven’t “gripped in its gut what could happen”, meaning we still aren’t ALARMED enough about what “could happen”. Indeed, they even admit that this “education” is a key part of their strategy.
His analogy of course is entirely false, and just more alarmist nonsense. What else could one expect, though, from the Ministry of Truth?
The American people are, for the most part, wide awake, and aware that AGW alarmism has very little to do with truth, and mostly hype and pure fantasy, and that politicians and fraudsters like Gore have their greedy, grubby hands on their wallets. Woe betide them when the rest wake up.
Here is a Video by warmers who DO believe in conspiracy theories (when in doubt, blame big oil).
The Climate Change Denial Industry
My comment:
Fossil fuels (oil, coal and natural gas) comprise over 85% of global primary energy – the remainder is mostly nuclear and hydro. Wind, geothermal and solar don’t amount to much, and neither do biofuels. It is ironic that so many people in the developed world loath energy companies, and yet fossil fuels are essential to keep them and their families from freezing and starving. Many Europeans and North Americans have bought into this irrational hatred – as they huddle in their homes during this cold winter, perhaps some of them will realize that rational energy policies and capable energy companies are essential for their survival.
Regards, Allan
E.M.Smith (14:42:47) :
It still bothers me that this is all ‘numerology’ and that there is no mechanism demonstrated ( a couple are proposed )
Love your posts, E.M.
I believe that Svensgard’s proposed mechanism for how decreased solar magnetosphere can produce increased cloud cover (which causes warming everywhere but in Antarctica) is not only well understood but has been experimentally demonstrated (and CERI is gearing up to see if it can be verified).
For my money, Geoff Sharp and the Landscheit folks seem to have solved the other half of the equation, which is what causes oscillation in the sun’s magnetic field. To me it seems only natural that the sun will be influenced by the planets in the way they have not only postulated but demonstrated through historical analysis that it must be.
DJ (19:22:35) :
That’s so cool – the Green movement picked up on a Bushism and made it a feather in their cap? Back in the American Revolutioinary war days, the Brits referred to the colonials as Yankee Doodle Dandys as derogatory term, but we embraced the term to annoy the heck out of the Brits.
And all this time I thought the AGW community adopted the the term to avoid talking about how cooling might negate concerns about warming.
Wow,
Our earth must be rewired! I guess next the plumbing will go, then the roof, then we’ll need a new driveway… Heck, maybe we should knock it down and rebuild!!!
malcolm (21:19:36) :
You just have to come to the right blog. Tamino wouldn’t have given you that link. 🙂
I prefer to stick to the science but in this field you have to fall back on politics, religion, and chasing the money. It’s all very annoying, depressing, and expensive.
Glad to have helped open your eyes. When you have a chance, check out http://wermenh.com/climate/index.html or click my name above. BTW, I’ll be posting a “State of the Climate” article there pretty soon.
Someone ought to tell Chu he sounds like a kook.
John Philip (03:17:05) says:
Joel is correct, the rate of change over the last century is at least an order of magnitude greater than that the planet undergoes when entering an interglacial, and the idea that global mean temperature is at 1980 level is absurd. [unless you indulge in some outrageous cherry-picking of individual months].
John Philip – Your temperature graph is seriously misleading at
http://www.woodfortrees.org/plot/uah/from:1980/mean:60
You accuse others of outrageous cherry-picking, but whoever concocted this 60-month running mean is guilty of exactly that – was this your doing?
Try plotting the actual monthly data by substituting “1” for “60” in the appropriate box – then you will see real data, and the absence of any significant LT warming trend.
For those who prefer the UAH LT data source, see
http://www.atmos.uah.edu/data/msu/t2lt/tltglhmam_5.2
psi (06:13:45) :
I believe that Svensgard’s proposed mechanism for how decreased solar magnetosphere can produce increased cloud cover (which causes warming everywhere but in Antarctica)
Increased cloud cover causing warming everywhere but in Antarctica is not Svensmark’s theory.
John Philip,
Please don’t post charts by Caspar Amman. He has been widely discredited, both at CA and here: click
sonicfrog (18:16:29) :
I can’t remember the fibrous rock in that area. Is that chrysotile?
Serpentine, the ‘non-fibrous’ variant. But after weathering to microscopic particles…
From: http://en.wikipedia.org/wiki/Asbestos
White
Chrysotile, CAS No. 12001-29-5, is obtained from serpentine rocks which are common throughout the world
Asbestos can be found naturally in the air outdoors and in some drinkable water, including water from natural sources.[20] Studies have shown that members of general (non-occupationally exposed) population have tens of thousands to hundreds of thousands of asbestos fibers in each gram of dry lung tissue, which translates into millions of fibers and tens of thousands of asbestos bodies in every person’s lungs.[21]
Asbestos from natural geologic deposits is known as “Naturally Occurring Asbestos” (NOA). Health risks associated with exposure to NOA are not yet fully understood, and current US federal regulations do not address exposure from NOA. Many populated areas are in proximity to shallow, natural deposits which occur in 50 of 58 California counties and in 19 other U.S. states. In one study, data was collected from 3,000 mesothelioma patients in California and 890 men with prostate cancer, a malignancy not known to be related to asbestos. The study found a correlation between the incidence of mesotheliomas and the distance a patient lived from known deposits of rock likely to include asbestos, the correlation was not present when the incidence of prostate cancer was compared with the same distances. According to the study, risk of mesothelioma declined by 6 percent for every 10 kilometers that an individual had lived away from a likely asbestos source.[22]
Of course, it’s worse if you smoke. Especially some brands:
Kent, the first filtered cigarette on the market, used crocidolite asbestos in its “Micronite” filter from 1952 to 1956.[14]
Allan M R MacRae (07:59:12) :
John’s graph doesn’t show data for 1980, it starts with the mean of 1980-1985. It also ends 2.5 years before now. Instead of displaying stuff with just all the glorious noise, my I suggest displaying both? See http://www.woodfortrees.org/plot/uah/from:1980/mean:60/plot/uah/from:1980 – not only does it show the whole period (perhaps I should’ve started a few years earlier, but it helps to keep the Y-axis over a more familiar range). The smoothed data is flat enough to force a lot of exaggeration in the Y-axis, the noise is enough to show why you need smoothing to bring out the long term trend, but the trend now looks small enough and appears to be heading down.
Hmm, it may not be long before all the warming of the last positive PDO goes away. Interesting, I didn’t expect that to happen for a decade or two.
Hmm, this is cute – with 12 month smoothing, then the start point is warmer than the end point. http://www.woodfortrees.org/plot/uah/from:1980/mean:12/plot/uah/from:1980
The trend is still positive, it’ll take time for current conditions to remove the warm period before the PDO flip.
Roger Carr (19:10:38) :And maybe add the new research, John, which shows leaves have an inbuilt capacity to monitor and control their own temperature, thereby creating a cooler zone below them in hot weather. (”Magic” is as nothing compared to the wonders of natural things.)
Tree leaves control their own temperature
Roger, thank you! That link:
http://www.sciencecentric.com/news/article.php?q=08061131
Had such gems (bold added by me) as:
In addition, weather-forecasting models rely on accurate estimates of surface-water evaporation, much of which comes from tree leaves. Knowing the temperature of these leaves is crucial to an accurate prediction of future climate scenarios.
The research, published online in this week’s Nature, contradicts the longstanding assumption that temperature and relative humidity in an actively photosynthesising leaf are coupled to ambient air conditions. For decades, scientists studying climate change have measured the oxygen isotope ratio in tree-ring cellulose to determine the ambient temperature and relative humidity of past climates. The assumption in all of these studies was that tree leaf temperatures were equal to ambient temperatures.
Which assumption this report shows is in error…
And in some ways, my favorite:
Although there are few studies that compare tree-canopy temperatures throughout an entire growing season, a recent study using infrared thermal imaging of a mixed forest in Switzerland agreed with the current study: canopy temperature was 4-5 degrees (Celsius) higher than the cool, ambient air temperature of Switzerland.
So can we blame global warming on the trees??? 😉
But seriously, if we’re measuring temperatures and not recognizing the difference between a tree leave field and a ploughed field, we can get 4-5C of ‘warming’ that is, in fact, very very green …
DJ (19:22:35) : It is the “sceptics” who made the big switch […]
(http://www.guardian.co.uk/environment/2003/mar/04/usnews.climatechange).
Your understanding of history and terminology is worse than the climate knowledge I see here.
The Guardian… now there’s a great peer reviewed scientific journal for you…
Isn’t the IPCC the Intergovernmental Panel on Climate Change? Hmmm?
BTW, a google of: “Climate Change” 2002 yields ‘about 22,500,000 hits.
2001 yeilds 22,100,000 hits.
1990 yields 12,900,000 including on the top page both WHO and the U.N.
I think 1990 precedes your 2002 memo to the Pres to get with the current usage…
HINT: Do basic google sanity check before posting tripe from daily rags.
Something weird going on up in the Arctic. Looks like something took a bite out of the ice cap and then the whole thing came down with gray chicken pox.
REPLY: Links? Pictures?
JamesG above mentions the WUWT 9/19/07 post “Grilling the Data”.
In the comments to that post, is a link to a NOAA data adjustment chart:
http://www.ncdc.noaa.gov/img/climate/research/ushcn/ts.ushcn_anom25_diffs_pg.gif
Does anyone have a copy of that chart, as the above link seems to be dead?
Never mind. The link now works for me. Silly computers.
Wow. Even google “Climate Change” 1980
turns up stuff:
The Millenial Files – Global Climate Change and Warming, 1980-86
1980. In a report to President Carter, 13 U.S. government agencies stated … “ Inter-governmental panel on Climate Change…a United Nations group of 2500 …
Katherine: “You don’t like “climate changes”?”
If you read my comments again, you will notice that ‘climate change’ is in quotes. I was referring to the phrase as used by a political operative, Frank Luntz, who suggested using the term ‘climate change’ to downplay concerns about global warming.
The term ‘climate change’ has for long been an accepted way of referring to the effects of global warming, and the IPCC has been in existence now for 20 years.
“It’s up to the warmists to prove that the current conditions are unnatural and catastrophic.”
No. AGW climate scientists need only show that AGW is the best explanation for the current climate, ie that AGW best explains the evidence. Proof is a mathematical, not a scientific, concept.
peter_ga (22:25:11) :
Mr Chu appears to be taking the most extreme AGW predictions and running with them. That is most alarming. In a Westminster system, his job would equate to a top government minister?
I think that’s about right. Think of him as “The U.S. Ministry of Energy Minister”
Sounds like he’s bought the whole story, and has effectively given up hope of any possibility of remedial action, the situation is so critical.
The problem is psychological. The basic mind set of the AGW, green, et. al. movement is that we are all doomed because we are evil. Since basic tenets of any religious belief system can not be challenged (if you wish to stay in it); he has no choice but to ‘buy the whole story’ and ‘give up hope’…
Funnily enough, I can still find California oranges here in my local supermarket in Australia.
This is actually a direct result of economic laws.
The cost of a product + cost of shipping goes up with distance. If you ship the least valuable stuff a long ways it is only slightly cheaper than the best stuff since shipping becomes a larger percentage of price, so folks buy the best. If kept locally, the cheaper stuff is a very large percentage cheaper than the best stuff, so folks buy more of the cheap stuff. It’s a ‘better deal”.
The end result is that you will have good California Oranges in your stores long after I can find none in mine… Strange, but true…
(This is also part of why they sell 1/4 pound lobsters at roadside stands in Maine, but bigger ones are air freighted around the world…)
Roger Carr (21:41:29) :
It riles the experts to say so, buit I have seen white-painted weatherboard (clapboard USA?) houses still standing after a bushfire (wildfire USA) has gone through and eaten every other house of various other materials for breakfast…
Dunno quite why these experts get so het when this little piece of bush lore is mentioned.
I don’t understand it either. There is no need for homes to ever burn in brush fires.
White stucco outside, tile roof, steel ‘storm shutters’ over windows (to prevent radiative heat transfer to drapes et. al.) and undercoat the eaves with retardant materials. Oh, and no brush growing against the house…
Cheap. Easy. Rarely done…
Smokey: “With you, AGW is completely political…Go ahead, deny it.”
No it’s not.
“But your last paragraph makes it crystal clear to the most casual observer where you’re coming from.”
Let’s try that again. A political party operative offers PR advice to obfuscate the science of global warming. That makes me a political operative? You’ve probably heard of a non sequitur.
“Look at Katherine’s post above. Is she stupid, too? Is she deluded?”
Whether or not you accept AGW is a matter of judgement. I cannot say with any certainty how people arrive at their judgements. I think some people on both sides of the issue arrive at their position through temperament and ideological views. Since I don’t know Katherine, I cannot say how she arrived at her views.
“Should we unquestioningly accept what you hypothesize, without any measurable empirical evidence to back you up?”
Smokey, you have a habit of wearing your heart on your sleeve. I am not demanding that you unquestionably accept anything, and especially not what I say. You find the evidence for AGW unconvincing. That’s fine. But most climate scientists who are doing the scientific work accept AGW, with whatever uncertainties about some aspects and possible outcomes.
Psi: “Time to huddle and see if you can agree, before you try to convert the unwashed masses.”
No need. I’m talking about ‘natural variation’ as a theory to rival ‘AGW’. The overarching term ‘natural variation’ is consistent with all phenomena, and therefore “explains everything and nothing”.
This is exactly what the observations show. The SOI is going increasingly negative … – unprecedented behaviour and driver for the highly unprecedented drought in southern Australia.
The SOI has been strongly positive for the last 2 years.
http://www.bom.gov.au/climate/current/soi2.shtml
The so called drought in a smallish area of south eastern Australia isn’t ‘highly unprecedented ‘. It isn’t even ‘ordinarily unprecedented’. It’s within the normal climate range for the area as shown by the climate record.
As is normal with positive SOI/La Nina conditions, the north of Australia has had recent widespread heavy rain and floods.
BTW, I live in southern Australia and not only have our recent annual rainfall been normal to a little above normal, the trend over recent years has been toward wetter years, again consistent with a positive SOI and PDO shift.
The models and AGW proponents like Hansen who predicted negative SOI conditions and more El Ninos were plain wrong.
And people like DJ who claim to have knowledge and deride the rest of us for not having that knowledge, need to get over their cognitive dissonance at the models and claimed experts failing in their predictions and look at current data.
Brendan H, in a rhetorical sleight of hand, says:
Except, that since those climate scientist you claim mostly agree, are no where near to understanding the planet’s climate systems, so you cannot dismiss natural variation in the system. The confidence with which you assert human agency reminds me of the problems early scientists had in removing man from his central position in the universe. This time around it also has a strong feel of religion and politics.
To get an feel for the quality of some of those so-called climate scientists it is worth checking out ClimateAudit.
Smokey says:
Here is where you have made a fatal error: Yes, it is true in science that a hypothesis has to convince one’s fellow scientists in order to become accepted in the scientific community. Indeed, it must and indeed that is what AGW has done.
Now, you personally may not be convinced, but there is no rule that AGW remains an unsubstantiated hypothesis just because YOU believe it to be so any more than evolution remains an unsubstantiated hypothesis because lots and lots of people on the web seem to think this is the case (as a google search on “evolution unsubstantiated hypothesis” will verify). Or, to put it another way, it may remain an unsubstantiated hypothesis in your mind but that bears absolutely no relation to its status according to the scientific community.
JamesG … I’m fairly sure we can likely trust the satellite data from 79, which of course shows warming for 20 years and plateauing for 10 years.
I see: so the satellite data is clean but the adjusted surface record suspect? This gives us the opportunity to assess just how severe is the contamination from these adjustments by comparing the two…. Hmmmm – do you see anything to worry about? I don’t.
Alan MRM John Philip – Your temperature graph is seriously misleading at ….You accuse others of outrageous cherry-picking, but whoever concocted this 60-month running mean is guilty of exactly that – was this your doing?
Yep, I commonly use a 5 year smoothing as a way of averaging out the large interannual variability [aka noise] and so show the underlying trend. But then so does a lot of the climate science discipline, its a totally standard, mundane, unremarkable practice, and it clarifies, it does not mislead.
y plotting the actual monthly data by substituting “1? for “60? in the appropriate box – then you will see real data, and the absence of any significant LT warming trend.
I wish that were true, however the linear trend shown was the trend in the raw data, approx 0.13C / decade in UAH, pretty much consistent with the IPCC projections for this period. Certainly the proposal of no change since 1980 is unsupported by the data. Here is all the data, with OLS trend and 5 year mean.
For those who prefer the UAH LT data source, see
http://www.atmos.uah.edu/data/msu/t2lt/tltglhmam_5.2
If you click the ‘raw data’ link on the graph, you will see that this is the data that is being plotted.
Smokey: Please don’t post charts by Caspar Amman. He has been widely discredited I think we are best relying on the moderators to choose what may or may not be referenced, don’t you? Two blogs ‘discredit’ peer-reviewed journal papers? That day has yet to come, but since you dislike that particular messenger, here’s the message again: http://www.ipcc.ch/ipccreports/tar/vol4/english/wg1figspm-4.htm
Dammit – there’s a broken link in the last post, here’s the para again
Yep, I commonly use a 5 year smoothing as a way of averaging out the large interannual variability [aka noise] and so show the underlying trend. But then so does a lot of the climate science discipline, its a totally standard, mundane, unremarkable practice, and it clarifies, it does not mislead.
When is WordPress going to get a ‘Preview’ button??
REPLY: John if the lack of a preview button irritates you so much, please go elsewhere. I have no control over it. – Anthony
Joel Shore says:
That seems to be a hobbyhorse of yours, doesn’t it Joel. That is, insinuating in as many ways as you can that those of us who are not convinced of the AGW religion are creationists.
For the record, again, I find that “much in Biology does not make sense until you understand natural selection and evolution.” However, I have moved well beyond the simplistic and Marxist views of Stephen Jay Gould and Lewontin.
Also, for the record, the evidence that the Earth is billions of years old is convincing and that the Universe is even older is also convincing.
Gee… even google “climate change” 1975 gives us 6,200,000 hits including:
Climate Change Prediction — Broecker 283 (5399): 175 — Science
In 1975, Science published my paper “Climate change: Are we on the brink of a pronounced global warming?” (1). This paper was prompted by the observation …
http://www.sciencemag.org/cgi/content/full/283/5399/175f – Similar pages
by W Broecker – 1999 – Cited by 2 – Related articles
It sure looks to me like ‘global warming’ and the use of the phrase ‘climate change’ have been joined at the hip since birth. Long before 2002. (But a google of 1970 yielded talk of ice ages; though several recent pages were also caught that tried to claim there was no claim of impending ice in 1970… based on there not having been ‘a consensus’ – just lots of scary cover stories in popular magazines by scientists… uh huh… )
You know Brendan H. and DJ, that memo certainly does show that W. was slow on the uptake. A full 27 years late at least. God that guy is slow some times… Or is your position that the Republicans were conspiring for 27 years and only then sent the memo to W.? Or that W. was ‘leading the way’ from 27 years after the fact? Or what? (Oh, never mind; we all know W. caused WWII, and created malaria as a plot against Africa, and is really the antichrist reborn, and…) /sarcoff>
Hint: Horse in front, cart in back. Horse pointed forward. Cart with wheels down.
Anthony, re arctic ice grayness- I noticed it also on the nsidc.org,
Link is here.
My wizardry is small for this one. Perhaps one of you Gandalfs can look into this.
Ric Werme (10:05:09) says:
Hmm, this is cute – with 12 month smoothing, then the start point is warmer than the end point. http://www.woodfortrees.org/plot/uah/from:1980/mean:12/plot/uah/from:1980
The trend is still positive, it’ll take time for current conditions to remove the warm period before the PDO flip.
My comment:
Very good points Ric.
Note that the UAH data source shows Monthly LT’s and 12-Month Running Means, but not 60 months RM’s.
Here is a skill-testing question for general discussion, if there is any interest:
Based on your knowledge of climate science, including paleoclimatology, which would be better for humanity and the environment – global warming or global cooling? Feel free to qualify (and quantify) your answers.
Regards, Allan
Hi Ric,
Please look at the first graph at:
http://www.iberica2000.org/Es/Articulo.asp?Id=3774
This graph suggests there has been no net global warming since 1940, despite an ~800% increase in humanmade CO2 emissions.
I used Hadcrut3 ST from 1940 (despite of its warming bias), and UAH LT thereafter.
This is the result when one plots the FULL PDO cycle, instead of attempting to extrapolate the WARMING HALF-CYCLE, as many warmists do.
I suggest it is no more valid to extrapolate temperatures since ~1980 rising into the future, than it is to extrapolate temperatures falling into the future since 1998. These practises simply extrapolate one segment of a natural cyclical parameter, and are unlikely to have any long-term validity.
What do you think?
Regards, Allan
Allan M R MacRae,
I looked at your paper on the website you linked to. Very impressive work! Thanks.
@Allan M R MacRae (16:31:22) :
“Here is a skill-testing question for general discussion, if there is any interest:
Based on your knowledge of climate science, including paleoclimatology, which would be better for humanity and the environment – global warming or global cooling? Feel free to qualify (and quantify) your answers.
Regards, Allan”
I’m interested and I’ll bite. As for which condition is better for humanity, look at world population distributed by latitude. Civilization has voted and the the areas with temperature extremes lose. Water and food availability are more important than temperature but water and food are less abundant where the temperatures are extreme.
As for which condition is better for the environment, life will find a way. There is life everywhere on earth. When temperature conditions change, some species fail and others move in to fill the niches left by failed species.
“Which is better for the environment warmer or colder?” is by far the more interesting question. The planet earth cares not a whit if there any life on its surface unless there is evidence that planets are sentient. Is Mother Earth somehow superior to the sun or the moon or Mother Mars or Mother Venus?
John, try this before posting:
http://w3schools.com/html/tryit.asp?filename=tryhtml_basic
John Philip
“I see: so the satellite data is clean but the adjusted surface record suspect? This gives us the opportunity to assess just how severe is the contamination from these adjustments by comparing the two…. Hmmmm – do you see anything to worry about? I don’t.”
But of course you just pointed out the main reason why I’m fairly sure about it – from 1979 at least. Independent verifications are really nice. So is 3rd party review by the way, but such a thing seems to be not only completely missing but very actively discouraged in climate circles. There is of course some suspicion that Hadley are now largely tracking the satellite data mind you. We’ll probably never know for sure though because they won’t say.
Of course you’ll knew that the most substantial adjustments are made to the pre-1979 data did you, which means your comparison is somewhat invalid? Of course if i were a suspicious sort I might think that if satellite measurements hadn’t been available then the trend from 1979 on in Hadley wouldn’t be showing a plateau at all. As it is, they have almost succeeded in getting away with sweeping upwards adjustments to the satellite and the radiosonde measurements for the tropical troposphere – in line with model ensemble predictions of course. Upwards, always upwards! So much for the normal distribution of errors.
Sorry, Anthony. I was referring to the NSIDC image. It changed rather dramatically in the last day or so. There’s a pie-shaped wedge that’s gone gray and other areas that must be losing ‘old ice.’
Thank you for your thoughts HR – very much appreciated.
I will now take a shot at my question:
Based on your knowledge of climate science, including paleoclimatology, which would be better for humanity and the environment – global warming or global cooling?
I refer to the plot of temperature vs time for the past ~430,000 years at
http://www.brighton73.freeserve.co.uk/gw/paleo/400000yrfig.htm
This plot shows Earth has experienced ~4 deep-freeze Ice Ages, one every ~100,000 years, with warm intervals averaging about 10,000 years. We are now about 10,000 years into our current warm period, and can another Ice Age could start at any time…
Since these Ice Ages typically include several kilometres of ice thickness over most of the “developed” world, it is reasonable to expect that humankind and the natural environment will experience serious challenges for survival. Over time, both systems may heal themselves, but the process will not be pretty.
The global warming argument seems to have been framed as if natural Ice Ages did not exist – so let us frame our discussion within this fiction for the moment. I find the arguments in favor of catastrophic humanmade global warming to be unconvincing. As stated previously, temperature extrapolations of a natural warming half-cycle, the strongest point in the warmist argument, are almost certainly false. Examination of a full PDO cycle shows no net warming since 1940, in spite of an ~800% increase in humanmade CO2 emissions. The sensitivity of Earth’s temperature to atmospheric CO2 is insignificant.
Furthermore, CO2 lags temperature at all measured time scales. The warmist argument therefore seems based on the premise that the future can cause the past. If this were true, many of us would now be selling our depleted stock portfolios at the peak of the market, many months ago.
Regards, Allan 🙂
@Allan M R MacRae (16:31:22) : “Here is a skill-testing question for general discussion, if there is any interest:
Based on your knowledge of climate science, including paleoclimatology, which would be better for humanity and the environment – global warming or global cooling? Feel free to qualify (and quantify) your answers.”
Normal human body temperature is 98.6 F. Most humans are not covered with hair or fur to keep warm in cool temperatures. Humans have sweat glands for cooling not warming however we die if our body core temperature goes below 80 F. Humans evolved eating fruits and vegetables that grow in warmer climates. It seems logical that humans are designed for warm climates with 88 -92 F being optimal.
Richard Sharpe says:
You misapprehend my point. I am not claiming that you or any other AGW-doubters are creationist (other than Roy Spencer, who has pretty much identified himself as such). What I am pointing out are the parallels in the argumentation. I would tend to say that if you can pretty much take a statement or argument and substitute the word “evolution” for “AGW” and find similar sort of argumentation out there, that is a bad sign.
As I have stated before, the analogy is not absolutely perfect. And, I freely admit that on a quantitative certainty scale there is still more legitimate room to argue for a low climate sensitivity than for evolution to be wrong. (Although, as I have said before, people who actually doubt more basic aspects that have overwhelming evidence such as the basic radiative effect of CO2 or who embrace Beck’s nutty ideas are probably akin to “young earth creationists”.)
However, the analogues are there for all to see: The statement about it (evolution or AGW) being an “unsubstantiated hypothesis”, the fact that people who have only have a limited understanding of the science feel that they still know enough to come to conclusions at odds not only with most experts in the field, but also with all the major scientific academies and societies. And, even some of the arguments are similar. For example, the argument by Gerlich and Tscheuschner that the greenhouse effect violates the 2nd law of thermodynamics parallels the argument that evolution violates the 2nd law of thermodynamics. And, of course, there are the arguments about how their legitimate scientific views are being repressed, e.g., peer review is being used to keep their ideas out sound very much like what you hear in the movie “Expelled”.
Joel Shore,
I find in dealing with the AGW issue, that it is the AGW believers who are using more religious terms and argument styles than the skeptics.
Evolution is sound science, and has been tested from fossil to lab to field study of present.
AGW evidence is quite different: Nearly always based on some proponent extracting huge conclusions from data seldom outside the MOE. AGW leadership making global statements about the implications of their work in areas far outside their area of study.
AGW leaders, like Hansen, making specific predictions that are wrong. AGW leaders calling for the jailing of those who disagree. Those behaviors have far more in common with religious thinking than science. Or even reasonable behavior.
The recent work regarding the alleged warming of portions of Antarctica is a great case in point.
The record is quite clear that within very small periods of time, the AGW consensus was that a cooling Antarctica was exactly what AGW predicted. Oddly enough that is what the data showed. Now, without any reconciliation with that specific prediction, a new study comes along and claims it is warming- a tiny bit, but still warming, and that is now exactly what AGW was predicting.
The public square is littered with these sort of about faces from the AGW community.
The other thing that is clearly faith based in the AGW community is how any weather event, drought, flood, storm, calm, heat wave or cold snap, no matter if predicted or not, is *proof* of AGW.
So while it may be fun to defend AGW by playing word games, it does not hide the pattern of AGW at all.
I think you misapprehend your own point. The validity of one theory does not pertain to the validity of another, totally unrelated theory. This is nothing but a non-sequitur.
Allan M R MacRae (19:13:56) Post-Script:
Another problem with Ice Ages (as if there were not already enough), is the very low level of CO2 in the atmosphere, as low as ~180 ppm if the previous plot is to be believed, at
http://www.brighton73.freeserve.co.uk/gw/paleo/400000yrfig.htm
Since most plants do not survive well below ~200ppm atmospheric CO2, a prolonged Ice Age could put severe strain on plants, the base of the food chain.
The fact that many plant and animal species have survived the last several Ice Ages suggests that perhaps the CO2 levels were not actually as low as suggested by ice core analyses. Are there other explanations?
The alleged “pre-industrial level” of CO2 at ~280ppm is uncomfortably close to the fatal 200ppm. As CO2 is naturally sequestered in carbonates and fossil fuels over geologic time, it is reasonable to expect that all life on Earth will ultimately cease due to CO2 starvation.
Does anyone else find the current demonization of CO2 by the warmists just a bit ironic? Instead of fining energy companies for producing fossil fuels, maybe we should be subsidizing them for extending life on Earth, if only for a little while. 🙂
Richard Sharpe: “…you cannot dismiss natural variation in the system.”
I am not dismissing natural variation. I was replying to this claim: “The AGW hypothesis has the burden of falsifying the accepted theory that the climate varies naturally within its normal historical parameters…”
The claim is that there is or was an accepted “theory” of natural climate variation. But such a theory is useless, since all climate phenomena can be explained as ‘natural variation’. A theory is a more specific claim, along the lines: ‘the cosmic rays done it’, or “water vapour is a negative feedback’ etc.
EM Smith: “You know Brendan H. and DJ, that memo certainly does show that W. was slow on the uptake.”
We’re talking about intention. The original claim was: “I think you mean climate change don’t you. That’s the new in term among the hysterical alarmists.” This claim implies bad faith and intent to deceive on the part of AGWers.
We have shown that the idea to use ‘climate change’ in preference to ‘global warming’ in fact arose on the sceptic side, in an attempt to ‘manage’ the issue. We have also pointed out that the term ‘global warming’ has been used interchangeably with ‘climate change’ for many years.
These items of evidence refute the above claim. You have now agreed with us. Thanks for the confirmation.
Joel: “And, of course, there are the arguments about how their legitimate scientific views are being repressed, e.g., peer review…”
And funding, careers, peer pressure, religion (‘secular humanism’), hidden agendas. Creationist arguments all. Did I mention funding?
Roger Sowell (15:30:40) :
From some other odd data, I’ve concluded that the image is made up of a bunch of stripes of image draped across the globe. (Think paper mache.) I haven’t seen the gray before, but I’d bet it is old or stale data used to fill in missing data from a more recent pass.
I’m sure it’ll get resolved over the next day or two.
I called myself the Resident Wizard of Mudge during my freshman year at CMU. Is that good enough for Gandalf status?
Brendan H says:
My theory, a very specific theory, is that the AGWers have deliberately poured CO2 into the environment. (Note, this is sarcasm.)
The first thing you have to demonstrate is that there is a problem. If CO2 level vary naturally within certain bounds, and there is lots of evidence from the past of higher CO2 levels than today, then your theory is worthless, as it too does not explain anything.
Note. To qualify my previous statement.
I do think there is adequate evidence that humans are contributing to the increased levels of CO2 we are seeing in the atmosphere. That is, they are one component.
I don’t think it will lead to any sort of thermal runaway or other disaster. I also think that plants will thrive as a result and I suspect that life in the oceans will benefit.
Brendan H wrote:
No. AGW climate scientists need only show that AGW is the best explanation for the current climate, ie that AGW best explains the evidence. Proof is a mathematical, not a scientific, concept.
You don’t like the term “proof” even though you use “evidence”? Okay.
As far as I understand, the AGW hypothesis is that man-made CO2 is the cause of the rapid increase in temperature. How do you test this hypothesis? Where is the empirical data that supports this hypothesis? And, no, statistical models don’t count as empirical data. How can the AGW hypothesis stand when global temperatures have been declining for the past 10 years while CO2 levels continued to rise during the same period?
If “AGW best explains the evidence” such that the elevated temperatures in the last century were due to man-made CO2, where did the man-made CO2 that caused the Medieval Warm Period and the Roman Optimum come from? If the elevated temperatures back then were not due to man-made CO2, why would those in the 20th century be due to man-made CO2? How did man-made CO2 shut off the natural mechanism that caused the Medieval Warm Period and the Roman Optimum?
Brendan H wrote:
I am not dismissing natural variation. I was replying to this claim: “The AGW hypothesis has the burden of falsifying the accepted theory that the climate varies naturally within its normal historical parameters…”
The claim is that there is or was an accepted “theory” of natural climate variation. But such a theory is useless, since all climate phenomena can be explained as ‘natural variation’.
Useless for what? Fear-mongering? Calls for political action?
@Michael D Smith (01:10:46) :
“If it gets too cold in California instead, will it be known as the “Ha-Chu” effect?”
Gore-zundheit
@Mike McMillan (01:30:11) :
“I suggest you recalculate that. Dr Chu has a PhD, after all.”
Sorry, Mike. Zero degrees C is 32 degF. 3 degrees C is 37.4 degF. If you can’t do the arithmetic, I suggest you find a 3rd grader who can help you. If you can’t find a grade school student, this link may help you…
http://www.wbuf.noaa.gov/tempfc.htm
It’s people like Mike who think that Zero-Bungler’s “stimulus” debacle will help instead of cause massive damage. Sigh.
@ John Philip (15:10:43) :
When I am being conscientious (not always, as you can tell from the errors in some my posts) I enter my post in another website where they do have a preview, and check and correct it, then come back and post it here. It’s a little bit of a pain, but not overly so.
When talking about white roofs, do not forget that absorption takes place in the visible and the infrared, while emission is infrared only. Absorption in the visible and infrared are not related, e.g. you have radiator paint that is white in the visible and black in the infrared.
Furthermore it pays off to look at what Chu actually said. I took the first hit on google. It goes to an interview with the Taipei Times
Flat roof buildings in cities, no paint required. Motl refers to the very same interview. Interestingly, the interview does not even mention paint, while on Motl’s blog you will find
(emphasis added)
John Philip (03:17:05) :
“It is actually the ‘natural-only’ advocates who have the evidence shortage; no known natural driver of climate is capable of explaining the recent trend, whereas it is entirely consistent with natural fluctuation superimposed on an anthropogenically-forced rising trend.”
I hope you’re satisfied with that, because that’s all you’ve got. A teeny trend from CO2 that can’t even overcome a solar minimum and a PDO flip in tandem. And I bet you still hang on to your aerosols to explain all the cooling during the last warm to cool flip of the PDO. No volcanoes to pin the current cooling on. And that recent warming trend which you fiercely hang on to as some kind of ‘proof’, had underneath it the PDO flipping warm as well as the AMO.
You can’t shush that ‘weather noise’ with the pathetic whimper of CO2.
Joel Shore (19:42:05)
I tend to look upon AGW and creationism as unsubstantiated hypotheses. What’s more, I am somewhat worried by the AGW defenders almost religious way of approaching those who dare to disagree. After all, “jail the deniers” is not all that far away from “death to the infidel” or “crucify the christians”, at least not conceptually.
this graph suggests there has been no net global warming since 1940, despite an ~800% increase in humanmade CO2 emissions.
I used Hadcrut3 ST from 1940 (despite of its warming bias), and UAH LT thereafter.
What do you think?
I think you have spliced together two anomaly time series with different baselines [UAH is the anomaly from 1979-1999, Hadley from 1961 – 1990], and therefore drawing any conclusions drawn from the graph is as valid as comparing the heights of two people when one of them is standing on a box.
Katherine -“And, no, statistical models don’t count as empirical data.”
Just a small correction – the GCMs are not statistical models, they are ‘physical’ models. I’m not convinced that makes them any more accurate, but it’s important to understand the difference.
For example, one hears the argument that the banks’ models let them down so badly that we should not trust climate models. The (reasonable) response is that financial models were statistical not phsyical, so the argument isn’t a good one.
John Philip (04:22:04) :
Allan said:
This graph suggests there has been no net global warming since 1940, despite an ~800% increase in humanmade CO2 emissions.
I used Hadcrut3 ST from 1940 (despite of its warming bias), and UAH LT thereafter. What do you think?
JP says: I think you have spliced together two anomaly time series with different baselines [UAH is the anomaly from 1979-1999, Hadley from 1961 – 1990], and therefore drawing any conclusions drawn from the graph is as valid as comparing the heights of two people when one of them is standing on a box.
Allan says: You are wrong JP. The different anomaly baselines don’t matter here, since there is no net warming from ~1940 to ~1980 in the Hadcrut3 Surface Temperature (ST), and no net warming in the UAH Lower Troposphere (LT) temperature from ~1980 to present.
My statement that there has been no net global warming since 1940 is even more likely to be correct, since the ST data has been demonstrated to have a significant warming bias (~0.2C since ~1980, and probably another ~0.2C for the previous 40 years). Therefore, it is probable there has been minor global cooling since 1940, but this is well within the range of data uncertainty (as is the entire AGW hypothesis).
To demonstrate warming, your side chooses to extrapolate the warming half of the last climate cycle (since ~1976). I choose to show the entire cycle, since ~1940, and it shows NO NET GLOBAL WARMING SINCE ~1940.
The need to splice datasets is justified in this case since there are no satellite temperatures before 1979, and the ST datasets have many quality problems including poor spatial coverage and the aforementioned warming bias.
In general, I do share your concerns about data splicing.
There was, for example, no valid reason for Mann to splice together 2 datasets (dendro temperatures and ST’s ) in his famous 1998 “hockey stick” paper. Perhaps he spliced in the ST data to avoid the “Divergence Problem” (a DOWNWARD-SLOPING hockey stick blade), which would have shown global COOLING since the 1970’s. Google “Divergence Problem” for more info.
Another more recent example with Mann as co-author was Steig’s hypo (unlikely to be true, imo) about western Antarctic warming – where some of the evidence of warming was provided by erroneously splicing together ST datasets from two distant locations “Harry” and “Gill” and representing it all as “Harry”. Harry is located far inland, while Gill is on the coast. The jury is still out on whether this datasplice significantly affected the results, but it was certainly an error. See wattsupwiththat or http://www.ClimateAudit.org for updates on the “Harry met Gill” saga.
JP – if you wanted to make a valid point about the dangers of datasplicing, why didn’t you just use these two fine examples of Mann-made global warming?
Regards, Allan 🙂
Allan M R MacRae (17:33:36) :
It’s engrained into electrical engineers that looking at part of a cycle is fraught with misunderstanding. It’s often important, e.g. when looking at peak loads, but full cycle analysis provides a baseline for meaningful comparisons.
That variable cycle lengths of the PDO, sunspots, etc make the math more difficult, to be sure. Things with a fixed cycle, like the seasonal effect of CO2 measurements at Mauna Loa are easy deal with (i.e. remove) to make the long term trend clear, and what’s left is predictable, at least in warming conditions.
Sometimes you can get away with a partial cycle, e.g the average temperature during the warming phase of a PDO suggests that may be the same as the average temperature of the cooling phase. On the other hand, extrapolating the rise into the future is completely stupid. However, that’s not what the warmists are doing! They don’t see the PDO as influencing temperature, they see CO2 as the culprit and note that CO2 is increasing exponentially and therefore the logarithmic response to CO2 concentrations means a steady upward trend.
There are two problems with that:
1) The feedback parameter is way too high due to not taking PDO warming into account.
2) What looks like an exponential curve may not be – I’ve never seen a model for it like I have for the effect that CO2 has. In particular, even if the increase in CO2 over the 280 ppm baseline is exponential, then the curve fitting equation would take the form 280 + A e^year, where A is a coefficient that describes the rise. The log() of that is nowhere close to a straight line, but something that declines over time.
ODE TO STEIG (AND MANN), ON ALLEGED ANTARCTIC WARMING
NOW THE WORLDWIDE PRESS IS SWARMING,
‘ROUND ANOTHER
FINE EXAMPLE OF MANN-MADE GLOBAL WARMING!
JUST LIKE THE FAMOUS HOCKEY STICK,
THEY USED THE OLD
“SPLICE TOGETHER TWO DATASETS” TRICK.
******************
I said in my previous post:
A clarification of that last sentence – the log(CO2 concentration) curve does monotonically increase, but the slope declines. Hmm. I may be all wet, it may increase. The time to double the total CO2 starts out as being much longer than the (constant) time to double the amount over 280 ppm, but the former time gradually reduces with the latter being the theoretical limit.
Need to do some more digging or curve fitting myself. Don’t have time this month!
Jeff Alberts says:
You miss the point. The way science has advanced in our society and the way that our societies have advanced through the harnessing of science and technology is by listening to the best sound science. However, there are a few interesting cases where there is a gap between what the prevailing scientific view in the field is (and what the scientific societies say and so forth) and between what a small but vocal minority of scientists and non-scientists say. The gap is so large that you have, for example, scientists in support of a theory that many of this other group believe to be “an unsubstantiated hypothesis”.
In such a case, I think it is quite instructive to look at these interesting cases and compare them and see what we might learn from them. In particular, if one hears a certain argument against AGW, one can ask, “Does this sound similar to arguments that I hear against evolution, a theory that I know to be extremely well-founded scientifically?”
Look, the fact is that there is absolutely nothing surprising that there are a number of people around making the claims about AGW that you skeptics make. The case of evolution shows us that it is entirely to be expected in the case where a well-grounded scientific theory goes against strong religious, philosophical, or political beliefs or economic interests, independent of the merit of that theory. In fact, what would be surprising would be if this did not happen…And, in fact, what is increasingly surprising is the number of organizations (such as fossil fuel companies, power companies, etc) who now accept the basic science of AGW even though it is not in their economic interests to do so…or certainly not in their interests if it is not in fact a well-grounded scientific theory (and they certainly resisted for a while).
@ bluegrue (03:20:18) :
“you can be reducing 10 [percent] to 20 percent of the air conditioning load.” — Ahhhh CHU!
Is that for peak AC load in an uninsulated cardboard box in the dog days of Summer?
“…the answer to energy efficiency is not always as black and white as one might think. Roof systems that have good performance levels can be specified to provide competitive energy-efficient solutions. With the initial cost per R-value for insulation averaging about 2 cents per square foot, the cost to offset the benefit provided by a white roof system is slight.”
http://www.professionalroofing.net/article.aspx?id=183
I.e., better insulation is the answer, with roof color making a difference only in summer and only very slightly on well insulated homes, at least in the Chigago area.
And then there’s the expense of re-tiling a roof, probably not amortized vs energy consumption over the lifetime of the roof, even here in CentFla (the last re-tiling was done with white, which from the ubiquitous molds are now nearly black in many places).
So, if you’re building a NEW home in a warm climate, white may be the way to go. But in the North, I wouldn’t rush into it, especially until after the cooling that’s expected blows over, possibly not for 10 to 20 years.
I pity the pilots who have to fly over the all-white city. Think “snow-blind in summer.”
Joel Shore:
Well, since you ask, the answer is an unequivocal “No.” Unless, of course, you’re referring to the private conversation that goes on between your ears. And I notice that you’re once again trying to promote AGW from a failed hypothesis to a theory. Stop it. AGW is not a theory.
Forget the tortured analogies, and ask yourself: where is the real world evidence that increases in CO2 will lead to runaway global warming? Last time I checked, CO2 was rising and global temperatures were falling: click
Don’t give us any computer model fantasies, give us empirical evidence that carbon dioxide causes global warming.
Mr Green Jeans:
You taken one thing said by one person (James Hansen) and blatantly misrepresent what he actually said. (I don’t defend what Hansen said…I don’t think it was particularly constructive to the discussion but what he said bears little relation to how you have represented it.)
And, if you want to talk about witchhunts, you need look no further than Congressionman Barton’s meddling into the whole “hockey stick” controversy in such a heavy-handed way that even his fellow Republican, House Science Committee Chairman Sherwood Boehlert denounced it by saying ( http://sciencepolicy.colorado.edu/prometheus/archives/climate_change/000497letter_from_boehlert.html ):
As I recall, the scientific societies like the NAS as AAAS also weighed in on this. However, for the most part, the “skeptics” seemed to be cheering Barton on.
Yup…And, today it is colder in Rochester than it was yesterday even though we are heading toward spring. Man, who promoted that silly “seasonal cycle” garbage from to a theory from an “unsubstantiated hypothesis”!?!
And, let’s see, what do those climate models that you deride predict will happen over 8 year periods under steadily-rising CO2 levels…Hmmm, let’s see…It looks like they expect there is a significant chance that temperatures will fall over any given period (and, of course, there is a much larger probability that they will fall over SOME periods of this length): http://www.realclimate.org/index.php/archives/2008/05/what-the-ipcc-models-really-say/langswitch_lang/in
@ Graeme Rodaughan (23:56:48)
“Is it possible to go for a “AGW is not science, is religeon, and should not be taught in classrooms” and bring it too a court of law where it would actually have to prove it was in fact science?”
Is the photo in this article admissible as evidence?
A commenter on Motyl’s website tipped them off to this
“Let’s develop better micro-organisms that break down the cellulose…I hope 30 years from now a that substantial fracton of transportation fuels will be raised from crops” — Chu
Hope? …30 years? I thought drilling for oil, which we don’t have to “hope” for because it is there, was a pipe dream because it would allegedly take 10 years to get to market?
Also, here’s something else to Chu on…
http://www.caivp.org/category/tags/steven-chu
So Joel
Looks like models “predict” then according to your last post. And here I was thinking that they were only “scenarios”.
Also, the models apparently predict cooling……or warming. Does it take a model to do this? or can anyone throw out a guess like this?
“The way science has advanced in our society…is by listening to the best sound science.”
This makes no sense. How is science advanced by listening only to “best sound science”? Who gets to decide what is “best” and “sound”? Why should that be blindly accepted? I think science would have advanced very little if everyone just stopped questioning and working when some body of persons declared an idea the “best” out there.
I got a kick that this story was called an example of Mannian enHansenment.
Joel Shore says:
The way science has advanced in our society and the way that our societies have advanced through the harnessing of science and technology is by listening to the best sound science.
However, there are a few interesting cases where there is a gap between what the prevailing scientific view in the field is (and what the scientific societies say and so forth) and between what a small but vocal minority of scientists and non-scientists say. The gap is so large that you have, for example, scientists in support of a theory that many of this other group believe to be “an unsubstantiated hypothesis”.
Ah, yes, Joel, the “there is a consensus” fantasy. That one never gets old, particularly as you people find 1001 different ways of putting it. First of all, the “consensus” claim is more about politics than science. It is a way of “shutting up” your oponents, and shutting down debate. That is not how science works.
Secondly, there is not, nor was there ever any “consensus”, other than in the fevered minds of the AGW ideologues.
For example, in the 2007 IPCC report, only 52 scientists authored the much-hyped IPCC 2007 Summary for Policymakers, and only four UN scientists in the IPCC peer-review process explicitly endorsed the key chapter blaming mankind for warming the past 50 years. Big consensus.
Meanwhile, the latest 231-page U.S. Senate Minority Report report — updated from 2007’s groundbreaking report features the skeptical voices of over 650 prominent international scientists, including many current and former UN IPCC scientists, who have now turned against the UN IPCC. Indeed, the number of skeptical scientists, which include those who were previously hesitant to declare their skepticism, plus those who now have serious doubts and/or concerns about the AGW hypothesis is growing continually. This must indeed be alarming to AGW proponents, as evidenced by the increased shrillness of their alarmist cries, and calls for “immediate action”.
Joel, your comparison of the science skeptical of AGW with arguments against evolution is nothing but a thinly-veiled ad hominem. Further, you calling AGW a “well-grounded scientific theory” is simply laughable. You then come up with another beaut of an ad hominem, implying that we skeptics/climate realists are simply motivated by “strong religious, philosophical, or political beliefs or economic interests, independent of the merit of that theory”. This is nothing but a bald-faced lie on your part, but typical of an AGW True Believer.
This graph suggests there has been no net global warming since 1940, despite an ~800% increase in humanmade CO2 emissions.
I used Hadcrut3 ST from 1940 (despite of its warming bias), and UAH LT thereafter.
This is the result when one plots the FULL PDO cycle, instead of attempting to extrapolate the WARMING HALF-CYCLE, as many warmists do.
Ah the penny drops! At first glance it seems that the only way the graph supports the startling claim of no net warming since 1940 is to compare Hadley 1940 with UAH April 2008, but it now dawns on me that the claim is Hadley – no net warming from 1940-1980, then UAT no net warming 1980 to [April] 2008 thus bingo! no net warming since 1940…
So, ignoring for a moment that the two series measure different physical quantities, it does look like a small net cooling from 1940 to 2008. But is a conclusion based on just three data points robust? Why the choice of 1980 as a crossover year when the UAH data starts in 1979? Why the comparison with the year 1980 with just one month – April 2008?
Was 1940 an unusually warm year perchance? … click Was April 2008 anomalously cool? … click Hmmm…
In fact the UAH data shows an end-to-end rise of 0.382C from its first data point in December 1978 [-0.199C] to its last in December 2008 [0.183C] which matches the calculated linear trend. The Hadley annual average rose by 0.061C from 1940 to 1980, so combining the two dataets actually gvies a net rise of 0.44C from 1940 to 2008.
Can the result be radically amended by picking a different start date? Well By choosing 1950 as the start of the PDO cycle we get
Hadley 1950: -0.293
Hadley 1979: +0.046
A net change of 0.34C, add that to the UAH change 1979-2008 and using the same ‘method’ I can claim a net change from 1950 to 2008 of 0.72C, or 1.2C/century! Here’s the UAH and HAdley data together, with the UAH offset to coincide at Jan 1979: http://www.woodfortrees.org/plot/uah/from:1979/offset:0.1/plot/hadcrut3vgl/from:1940/plot/hadcrut3vgl/from:1940/trend
Neil Crafter says:
The point simply is that the climate variations over short enough time scales are dominated by processes such as ENSO that are very sensitive to initial conditions but over longer time scales. What it means is that one simply cannot make conclusions regarding whether or not CO2 is a dominant forcing by looking over periods that are too short to determine a climate trend that is resilient to these shorter-term issues.
I am sorry that nature behaves in a way that you don’t find appealing but, hey, what can we do?
AKD says:
Well, that probably wasn’t one of my best sentences. You edited out the more sensible part of it though, which is that society advances by considering the best sound science, which is why we have organizations such as the National Academy of Sciences set up to provide the public and policymakers with an overview of the current scientific thinking.
There is still something to the part of my sentence that you left in. And that is that the peer-review system has indeed been found useful for increasing the signal-to-noise ratio in science well above what it is like outside of the scientific journals. So, I would say that scientists are the one who should be evaluating if their colleagues’ contributions are good and sound enough to merit publication.
I suspect broken links and such like maybe down to the new IE8, which has known issues.
Bruce, is it really significant that fewer scientists prepared the summary of a report than worked on the report itself? And what does and only four UN scientists in the IPCC peer-review process explicitly endorsed the key chapter blaming mankind for warming the past 50 years , [which is also stated on Inhofe’s website] actually mean? If you look at the document behind this claim from climate data analyst John Mclean it is clear he is referring to reviewers of the Second Order Draft only, thus ignoring all comments to the First and Zero order drafts, which were far higher in number. Secondly the main points of review comments are to suggest changes and correct errors, I am not aware that lack of ‘explicit endorsement’ in response to a request for comments tells you anything about the document’s support, in fact probably the opposite – if I put out a document for review and get few comments back it usually indicates reviewers are happy to sign off on the content. The list of the 619 contributing authors to the IPCC working group on the Physical Science can be found here. Is your point that because each and every one did not make a comment ‘explicitly endorsing’ the relevant chapter then we should believe they do not support its conclusions? Can you name any other multi-authored document where this is the case?
Inhofe’s list of ‘over 650 prominent international scientists’ has some elements of pure comedy, and maybe 30-40 actual dissenting scientsts. I leave others to judge their prominence. Read the entry on Alan Titchmarsh for example [note they misspell his surname] and you will see he says this I’m sure we are contributing to global warming, and we must do all we can to reduce that . Read the website of this TV gardening show presenter and popular novelist and marvel at how he manages to find the time also to be a ‘prominent international scientist’ and how he has managed to keep it quiet 😉
Off-topic, [and apparently a post on this is in preparation, however as this is a response to a point, please bear with me] but the concensus is robust, as demonstrated by this survey in EOS that found 97% of climate scientists agree that global warmng is real, and human activity is a significant causal factor. Another smaller survey by Roger Pielke had majority explicity endorsing the IPCC with equally-balanced minorities opining that the IPCC were over or understating the severity of the problem.
Then there are the joint statements by the Science Academies of major countries, the literature review by Naomi Oreskes …
@ HasItBeen4YearsYet? (10:59:33)
You are perfectly correct that white roofs are just one aspect, insulation is important, too, and of course their is no one-size-fits-all solution for all climates. Prior to air-conditioning your ancestors developed different housing suited for the local climate in different parts of the USA. That’s experience you can build on for new houses.
I find it very curious, that Motl and many here on this blog entry attribute to Chu, that he advocates rebuilding all roofs, when in the interview Chu answers explicitly to a question about building new, energy-efficient buildings. Or do you have other sources than that Taipei Times interview?
P.S.: HasItBeen4YearsYet?, I’ve had a look at the site
http://www.geocraft.com/WVFossils/greenhouse_data.html
you pointed me to on the “WaPo pundits …” entry. Please have a look at my reply, the data the site presents is flawed, to put it mildly. Details over there.
“The point simply is that the climate variations over short enough time scales are dominated by processes such as ENSO that are very sensitive to initial conditions but over longer time scales. What it means is that one simply cannot make conclusions regarding whether or not CO2 is a dominant forcing by looking over periods that are too short to determine a climate trend that is resilient to these shorter-term issues.”
In other words, there is no way to know for sure, however give us all your money anyway, or the polar bears and the coral get it….
Reply to John Philip (13:06:55) :
Here is the UAH Global LT anomaly for 24 months, starting in January 2007. The high is +0.594C; the low is -0.183C. a range of ~0.8C.
Everything the warmists are panicking about is well within the range of natural variation, and we have seen good examples of that variation in just the past 24 months.
Remember the 1998 El Nino spike – from all the howling of the warmists, you’d think the world was going to burn up within days. Then the LT temperature dropped right down to where it was before.
End of panic. Also end of warmists’ credibility – and the 1998 Mann hockey stick fiasco did not help – “Hey, let’s just eliminate the Medieval Warm Period and Little Ice Age from the historic record – maybe nobody will notice!”.
*************************
Following is year, month, UAH global LT anomaly dC
Source: http://www.atmos.uah.edu/data/msu/t2lt/tltglhmam_5.2
2007 1 0.594
2007 2 0.450
2007 3 0.403
2007 4 0.244
2007 5 0.199
2007 6 0.203
2007 7 0.255
2007 8 0.286
2007 9 0.201
2007 10 0.231
2007 11 0.209
2007 12 0.114
2008 1 -0.046
2008 2 0.020
2008 3 0.089
2008 4 0.015
2008 5 -0.183
2008 6 -0.114
2008 7 0.047
2008 8 -0.007
2008 9 0.161
2008 10 0.166
2008 11 0.251
2008 12 0.183
Tim Clark (09:04:01) :
psi (06:13:45) :
I believe that Svensgard’s proposed mechanism for how decreased solar magnetosphere can produce increased cloud cover (which causes warming everywhere but in Antarctica)
Increased cloud cover causing warming everywhere but in Antarctica is not Svensmark’s theory.
Ok, if you say so.
If you mean that someone other than Svensmark originated the idea, I have no comment.
But if you mean that Svensmark does not endorse this theory, you are wrong.
On pages 82-90 of The Chilling Stars you will find extensive discussion of what Svensmark and Calder term the “antartic anomoly.”
The term is explained in the book as the theory that “when cloudiness decreases, the world will warm up and the southern continent will cool down” (88). Svensmark and Calder further assert that “Cloudiness is the only forcing agent that directly predicts the Antarctic climate anomaly, without the need for any further processes” (88).
Now where we?
I see, So the previous argument was ‘no net GW 1940-April 2008’, now you illustrate that April 2008 was nearly 0.6C cooler than Jan 2007, so you could have written ‘substantial net GW 1940-Jan 2007’!.
The relatively large interannual variation is well-known, and not expeced to disappear. It is the reason why ‘trends’ based on just individual start and end points are suspect. The problem is that this ‘weather noise’ is superimposed on a longer term, externally-forced risng trend, as revealed by smoothing out the noise using a linear fit, or a multi-year average.
Weather fluctuations or ‘noise’ have a noticeable effect even on monthly-mean global-mean temperature, especially in Northern Hemisphere
winter. Weather has little effect on global-mean temperature averaged over several months or more. The
primary cause of variations on time scales from a few months to a few years is ocean dynamics,
especially the Southern Oscillation (El Nino – La Nina cycle), although an occasional large volcano can
have a cooling effect that lasts a few years. The 10-11 year cycle of solar irradiance has a just barely
detectable effect on global temperature, no more than about 0.1°C, much less noticeable than El Nino/La
Nina fluctuations.
The past year (2007) witnessed a transition from a weak El Nino to a strong La Nina (the latter is perhaps beginning to moderate already, as the ocean waters near Peru are beginning to warm). January 2007 was the warmest January in the period of instrumental data in the GISS analysis, while, as shown in Figure 1, October 2007 was # 5 warmest, November 2007 was #8 warmest, December 2007 was #8
warmest, and January 2008 was #40 warmest. Undoubtedly, the cooling trend through the year was due to the strengthening La Nina, and the unusual coolness in January was aided by a winter weather fluctuation. The reason to show these is to expose the recent nonsense that has appeared in the blogosphere, to the effect that recent cooling has wiped out global warming of the past century, and the Earth may be headed into an ice age. On the contrary, these misleaders have foolishly (or devilishly) fixated on a natural fluctuation that will soon disappear.
James Hansen
JP and other warmists
Note to JP and other AGWarmists
Please see
http://hallofrecord.blogspot.com/2009/01/decadal-occurrences-of-statewide.html
This depicts the monthly record high temperatures by US State. Summary here
http://2.bp.blogspot.com/_b5jZxTCSlm0/SYSo9zKsjOI/AAAAAAAACr4/QDiDREshL5Q/s1600-h/Corrected+-+Table+1880s-2000s+High+Temperature+Frequency.JPG
The 1930’s have the greats number of “all-time” record high months (112).
Next is the 1950’s (72).
Next the 1980’s (61) and 1910’s (60) and the 1990’s (52).
The 2000’s have experienced only 19 to date.
This data provides significant evidence that at least in the USA, there has been no warming (and some probable cooling) since 1940.
John Philip (20:35:54) :
I wonder why Dr. Hansen didn’t say the unusual warmth in the other January was aided by a winter weather fluctuation.
Oh that’s right, warm months are AGW, cool months are fluctuations. I should know that by now.
John Philip (20:35:54) says (excerpt):
The past year (2007) witnessed a transition from a weak El Nino to a strong La Nina (the latter is perhaps beginning to moderate already, as the ocean waters near Peru are beginning to warm). January 2007 was the warmest January in the period of instrumental data in the GISS analysis, while, as shown in Figure 1, October 2007 was # 5 warmest, November 2007 was #8 warmest, December 2007 was #8 warmest, and January 2008 was #40 warmest. Undoubtedly, the cooling trend through the year was due to the strengthening La Nina, and the unusual coolness in January was aided by a winter weather fluctuation. The reason to show these is to expose the recent nonsense that has appeared in the blogosphere, to the effect that recent cooling has wiped out global warming of the past century, and the Earth may be headed into an ice age. On the contrary, these misleaders have foolishly (or devilishly) fixated on a natural fluctuation that will soon disappear.
– James Hansen
Allan says:
I am pleased to hear that someone still takes GISS ST data AND James Hansen seriously. I don’t.
My previous post is one effective counter to Hansen’s nonsense above. Repeating, the 1930’s have the greats number of US “all-time” record high months at 112, versus only 19 to date for the 2000’s.
The September-October 2008 “Hot Russia” data-swap fiasco finished me with GISS. There is no quality control at GISS. Details at
http://wattsupwiththat.com/2008/11/12/corrected-nasa-gistemp-data-has-been-posted/
GISS typically exhibits more warming than Hadley ST, UAH LT and RSS LT.
When I must use ST data, despite its warming bias, I use Hadley, not GISS.
Katherine: “As far as I understand, the AGW hypothesis is that man-made CO2 is the cause of the rapid increase in temperature. How do you test this hypothesis?”
You can take measurements of temperature. You can then test for scenarios that exclude and include anthropogenic factors, including CO2, and compare the results with observed temperatures.
http://www.ipcc.ch/ipccreports/tar/vol4/english/wg1figspm-4.htm
“…global temperatures have been declining for the past 10 years…”
The temperature level for the post-1998 years has been at a higher level than for pre-1998 years:
http://wattsupwiththat.com/2009/02/04/rss-global-temp-anomaly-makes-a-significant-jump/#comments
More importantly, temperatures have been rising for the past 150 years. AGW is about climate. The relevant factor is the long-term trend, and the long-term trend is upwards.
“How did man-made CO2 shut off the natural mechanism that caused the Medieval Warm Period and the Roman Optimum?”
Anthropogenic CO2 does not “shut off” natural mechanisms. Rather, it enhances or modifies existing mechanisms. So, for example, in a warmer world the El Nino effect is enhanced, dry areas may become dryer, wet areas wetter, and so on.
Or, net cooling since 1000ce-any time since…
Brendan H (22:57:47) : You can take measurements of temperature. You can then test for scenarios that exclude and include anthropogenic factors, including CO2, and compare the results with observed temperatures.
The estimated anthropogenic CO2 increase is but 3% of total atmospheric CO2,
or about 11 ppm. Do you seriously want the expenditure of trillions of dollars to remove this 11 ppm? If you believe that will stabilize world temps then I have some nice land in south Florida I would like to sell you.
Allan M R MacRae (22:06:18) :
GISS typically exhibits more warming than Hadley ST, UAH LT and RSS LT.
What do you mean by ‘typically’? The Hadley trend since the 1880 beginning of the GISS record is greater than GISS –
http://www.woodfortrees.org/plot/gistemp/from:1880/to:2009/trend/offset:-0.125/plot/hadcrut3vgl/from:1880/to:2009/trend
GISS is very slightly greater over the past thirty years, but it is UAH that is evidently the divergent record, with GISS, Hadley and RSS being tightly grouped:
http://www.woodfortrees.org/graph/hadcrut3vgl/from:1979/offset:-0.15/mean:12/plot/gistemp/from:1979/offset:-0.24/mean:12/plot/uah/mean:12/plot/rss/mean:12/plot/hadcrut3vgl/from:1979/offset:-0.15/trend/plot/gistemp/from:1979/offset:-0.24/trend/plot/uah/trend/plot/rss/trend
REPLY:Yes you can fit GISS to match the other three climate metrics, as you have done above, using offsets. But you miss the point: GISS has a presentation issue, they use a different (older) anomaly baseline than the other sets. If they used the same baseline as the others, this issue would disappear because their visual public graph would look like the others. Since you are a defender of GISS, why not ask them to conform? I’m sure that in the interest of fostering a correct graphical presentation to the public, they will use the more recent baseline like the other 3 climate metrics do. – Anthony
Tom in Florida says:
Estimated by who? That is just silly talk. The current levels of CO2 are about 385 ppm, or about 105 ppm above the pre-industrial baseline. The anthropogenic part is essentially that full 105 ppm (which is fortunately only about half of the amount of CO2 that we have actually released into the atmosphere from burning fossil fuels because the oceans and biosphere have been able to absorb some of it.)
Ric Werme says:
No, the warm months are AGW + fluctuations and the cool months are AGW + fluctuations. However, the “cool months” aren’t that cool compared to what they used to be because the AGW is added in…and the warm months are often record-breaking or close to it because the AGW is added in.
Anthony,
I’m sure that in the interest of fostering a correct graphical presentation to the public, they will use the more recent baseline like the other 3 climate metrics do. – Anthony
But the other three don’t use ‘the more recent baseline’ – HADCRUT3 uses Jan 1961 – Dec 1990 (30 years), UAH & RSS both use Jan 1979 – Dec 1998 (20 years). GISTEMP is Jan 1951 – Dec 1980 (30 years).
There is nothing ‘incorrect’ about a different choice of baseline, and nor does it make any difference whatsoever to the analysis of change in temperature. The only difference is in the anomaly figures themselves, these being all consistently higher or lower for the entire period. As for a “correct graphical presentation” I simply don’t know what you mean, unless you’re suggesting that either Hadley or RSS/UAH are somehow baselined to a “correct” zero anomaly?
This is not an issue to anyone with a simple understanding of anomalies relative to baselines, although it certainly does seem to feed the false perception that GISS ‘exhibits more warming’.
I am not a defender of GISS (what an odd idea – why should I be? It doesn’t even show the greatest warming over its record period!). Since it is evident that there is some divergence between the records, especially over short time scales, I favour looking at all of the records in the way that woodfortrees does in presenting its ‘temperature index’. Favouring only the highest or the lowest indicator of warming for any particular period without referencing the others would typically be an indication of cherry picking.
For all that’s written on this blog suggesting GISS adjustments introducing warming to their temperature record, there seems to be precious little evidence of them succeeding in doing so relative to the majority of records. If one wanted to examine what had been done to a record because one was concerned about its divergence one would start with UAH, that is entirely obvious (UAH may be perfect, of course, but it is clearly the least confirmed by others).
My previous post is one effective counter to Hansen’s nonsense above. Repeating, the 1930’s have the greats number of US “all-time” record high months at 112, versus only 19 to date for the 2000’s.
Allan, The Continental USA is just 2% of the surface of the planet, it’s regional warming during the 30s and 40s is actually well-known and the cause, while a source of some interesting speculation, is unlikely to tell us very much about the current global warming. The source of your figures admits as much:
I have excluded Alaska and Hawaii from this animation because they are distinct and separate climate zones
Quite.
GISS typically exhibits more warming than Hadley ST, UAH LT and RSS LT.
Actually, if you plot the linear trend in the four major global mean temperature since the inception of satellite data, you find that three of them agree well, with one clear outlier.
The temperature level for the post-1998 years has been at a higher level than for pre-1998 years
And contrary to a much-repeated claim, all the indices of global mean temperature show a significant rising trend over the last 120 months, this being the usual definition of a decade.
JP
“For all that’s written on this blog suggesting GISS adjustments introducing warming to their temperature record, there seems to be precious little evidence of them succeeding in doing so relative to the majority of records.”
You Sir, are willfully ignorant. Those of us who have looked into GISTemp no longer find reporting their results as ingenuous to be candid or honest in any fashion.
Joel Shore (08:59:21) :
“Tom in Florida says: The estimated anthropogenic CO2 increase is but 3% of total atmospheric CO2, or about 11 ppm.
Estimated by who? That is just silly talk. The current levels of CO2 are about 385 ppm, or about 105 ppm above the pre-industrial baseline. The anthropogenic part is essentially that full 105 ppm ”
The numbers come from here: http://www.geocraft.com/WVFossils/greenhouse_data.html
I used “estimated” because this is dated 2000.
Do you really mean to say that essentially all of the 105 ppm increase is man made?
Where do you come up with that idea?
@ Tom in Florida,
For all I can see the site you quote pulls its numbers out of thin air. The references for the deciding data in table 1 on that site come not from the cited references. See below for details, I repost my entry from the “WaPo Pundits …” thread
———–
Monte Hieb, the author of that page, lists in his table 1 the “natural” and “man-made” additions to CO2 from pre-industrial levels to today, indicating that just 14% of the rise in atmospheric CO2 mixing ratio is man made. He claims that the data is from U.S. Department of Energy in the table description. Tough luck, the DOE page he references (or see an older version at Archive.Org) holds no such “man-made” vs. “natural” information, only the well-known GHG increase data, which constitutes the rest of table 1. At a minimum, the table description is misleading, as it attributes the numbers of “man-made additions” and “natural additions” to the DOE and takes its name to give it credibility. In the footnote 1 Hieb offers an additional source, namely the IEA Greenhouse Gas R&D Programme, where the data section is not publicly available. Cool, no source for the two data columns Hieb bases his entire argument on. But hey, if you look at the IEA pages you will find, that they defers readers to the IPCC for details. Now, if you look at sections 2.3.1 and 7.3.1.2 of the IPCC FAR WG1 report, the IPCC attributes the entire change from pre-industrial about 280ppm to todays about 370ppm in atmospheric CO2 to human activities.
So your “source” uses unsourced data, which is in stark contradiction to generally accepted findings, to make the argument that human contribution to climate change is negligible. You do not expect me to trust anything on that page, do you?
P.S.: Before you ask, yes, I have e-mailed the above info to Hieb, too, including a link to this discussion.
————
I have yet to hear of Hieb.
I failed to include the links of my post, sorry. Here they are:
1) <a href=”http://cdiac.esd.ornl.gov/pns/current_ghg.html”DOE page he references
2) older version at Archive.Org
3) IEA […] defers readers to the IPCC for details
4) IPCC FAR WG1 report
gary gulrud (11:24:48) :
“For all that’s written on this blog suggesting GISS adjustments introducing warming to their temperature record, there seems to be precious little evidence of them succeeding in doing so relative to the majority of records.”
You Sir, are willfully ignorant. Those of us who have looked into GISTemp no longer find reporting their results as ingenuous to be candid or honest in any fashion.
Would you care to give me evidence of my wilful ignorance, Gary, rather than just asserting the prejudice you have built up over time? I have given my evidence as follows:
Simon Evans (08:32:18) :
Allan M R MacRae (22:06:18) :
GISS typically exhibits more warming than Hadley ST, UAH LT and RSS LT.
What do you mean by ‘typically’? The Hadley trend since the 1880 beginning of the GISS record is greater than GISS –
http://www.woodfortrees.org/plot/gistemp/from:1880/to:2009/trend/offset:-0.125/plot/hadcrut3vgl/from:1880/to:2009/trend
GISS is very slightly greater over the past thirty years, but it is UAH that is evidently the divergent record, with GISS, Hadley and RSS being tightly grouped:
http://www.woodfortrees.org/graph/hadcrut3vgl/from:1979/offset:-0.15/mean:12/plot/gistemp/from:1979/offset:-0.24/mean:12/plot/uah/mean:12/plot/rss/mean:12/plot/hadcrut3vgl/from:1979/offset:-0.15/trend/plot/gistemp/from:1979/offset:-0.24/trend/plot/uah/trend/plot/rss/trend
What is your evidence to counter the above?
REPLY: Simon, as I pointed out earlier, you can make the data sets nearly match when you use offsets such as is available in the woodfortrees interface.. What Gary and many others speak of is the PUBLIC PRESENTATION that GISS puts out, using an older, outdated baseline that the other three metrics do not use. Plus, all of the adjustments they do which when examined in detail, seem nothing more than arbitrarily applied on a station by station basis. So, I don’t see you argument using links above as particularly convincing. I view GISS as an outlier on many levels, as do others, which is why it gets little respect here. – Anthony
Hey, would you guys clarify what point your are trying to make, so that the people who have not been following your arguements have a clue?
I will point this out, the person that used the term “willfully ignorant” is using
“loaded” language. I would have a tendancy to discount ANYTHING from that author.
Signed:
Worked in Nuclear Power for 20 years, experienced enough “loaded language” for one lifetime.
“” John Philip (15:49:27) :
<>
Inhofe’s list of ‘over 650 prominent international scientists’ has some elements of pure comedy, and maybe 30-40 actual dissenting scientsts. I leave others to judge their prominence. Read the entry on Alan Titchmarsh for example [note they misspell his surname] and you will see he says this I’m sure we are contributing to global warming, and we must do all we can to reduce that . Read the website of this TV gardening show presenter and popular novelist and marvel at how he manages to find the time also to be a ‘prominent international scientist’ and how he has managed to keep it quiet 😉 “”
So John; you have managed to dispose of precisely one of the “more than 650” on Inhofe’s list, which contains “maybe 30-40 actual dissenting scientsts “, so by my count, you now have only another 609 to disqualify according to your standards. And so far you have not proven the falsehood of even one of the scientific grounds on which ANY of the 650 chose to come out publicly and voice their dissent in some way or another.
I’ve read quite a few of those statements; and yes they range all the way from “maybe I believe in AGW, but I don’t know if it is any cause to worry.” to “no way in hell is any action of humans responsible for any global warming that may or may not be occurring.” and everything in between.
They include statements that “the AGW thesis has not been proven by any available observational data, to “So long as we have the oceans on earth, we can neither change the temperature of this planet either up or down, even if we wanted to.”
Why not try presenting scientific evidence against their arguments, instead a hollow blanket ad hominem assault on the persons; most of whom, you know absolutely nothing about.
I’m somewhat familiar with that last declaration; since I made that statement publicly; and several times.
I also predicted in June 2004, that when the floating sea ice melts, the sea level will go down; not up. That was published (Jan 2005 Physics Today). That was roundly ridiculed by none other than Spencer Weart, whose book “The discovery of Global Warming”, I was commenting on; actually I was commenting on Morrison’s review of that book.
It took till around June 2006 for a British/Dutch team of real live international climatologists, to report on ten years of actual real data measurement using a European polar satellite to prove that the sea level of the arctic ocean was falling at 2 mm per year (therby confirming that the floating arctic sea ice was indeed melting over that decade. They state, that they were “very confident” of their data, but did not know why that should happen; and they would “wait for the theoreticians to catch up with the real measured data.” Well at least one “theoretician” was a good two years ahead of them.
And all the available long term ice core proxy data, shows that the global surface temperature changes occur hundreds of years ahead of the atmospheric CO2 changes; which was the point on which I queried Morrison’s review of the Weart’s book.
So other than the fact that we have NO reliable global surface temperature data that predates about 1979-80, which is about when both the satellite temperature measurements started, and also when the ocean buoy experiments started, which prove that prior to then, all of the ocean surface water temperature data; which after all is only 70 % or so of the global surface; was completely false.
So other than the ground based surface temperature historic data are junk, and also that the surface temperature sampling regimen is in gross violation both spatially, and temporally with the Nyquist sampling Theorem; so that recovery of even an average value is impossible; we have the absurd realization, that even accurate knowledge of an accurate mean global surface Temperature, tells us precisely nothing about whether the earth is radiating more energy than it receives (cooling down) or radiating less energy than it receives from the sun, and hence warming up.
So John; try attacking the science arguments of any of Inhofe’s list of 650 “shysters”, instead of the persons; or alternatively present some actual measured data; rather than computer generated fiction. that passes for most of the IPCC scare mongering predictions. I’d be happy if you can reduce the three to one obligatory fudge factor in their wild predictions, to say a +/-30% error.
But I agree with you that the ad hominem mass attack is second only to the straw man debating technique.
George
George E. Smith (15:53:50) :
So John; you have managed to dispose of precisely one of the “more than 650″ on Inhofe’s list, which contains “maybe 30-40 actual dissenting scientsts “, so by my count, you now have only another 609 to disqualify according to your standards.
No, George – evidence of one example of dishonesty is evidence enough of dishonesty. There are many, many, many more, but I for one will not waste much time in trying to discover where your critical level of doubt kicks in. If I posted one statement that you knew to be dishonest (rather than simply mistaken) I would expect you to discount all else that I might say, and quid pro quo.
You can find plenty of debunking of the Inhofe list on the web if you are genuinely interested in knowing whether or not you’re being conned:
http://www.thedailygreen.com/environmental-news/latest/inhofe-global-warming-deniers-scientists-46011008
http://scienceblogs.com/deltoid/2008/12/how_many_inhofes_list_compared.php
http://blogs.tnr.com/tnr/blogs/environmentandenergy/archive/2008/12/15/inhofe-s-650-quot-dissenters-quot-make-that-649-648.aspx
http://climateprogress.org/2008/12/11/inhofe-morano-recycles-long-debunked-denier-talking-points-will-the-media-be-fooled-again/
– and so on and on.
RE: The alleged “pre-industrial level” of CO2 at ~280ppm is uncomfortably close to the fatal 200ppm. As CO2 is naturally sequestered in carbonates and fossil fuels over geologic time, it is reasonable to expect that all life on Earth will ultimately cease due to CO2 starvation.
Yes, this is a grave danger. When the Industrial Revolution commenced, we may have literally been nearing the ultimate disaster. So, perhaps a few centuries were bought. And now? Projecting conservatively, CO2 should peak out later this century. Then what?
SteveSadlov (18:22:54) :
“RE: The alleged “pre-industrial level” of CO2 at ~280ppm is uncomfortably close to the fatal 200ppm. As CO2 is naturally sequestered in carbonates and fossil fuels over geologic time, it is reasonable to expect that all life on Earth will ultimately cease due to CO2 starvation.
Yes, this is a grave danger. When the Industrial Revolution commenced, we may have literally been nearing the ultimate disaster. So, perhaps a few centuries were bought. And now? Projecting conservatively, CO2 should peak out later this century. Then what?”
Steve, no problem,
1. we simply produce more cement
2. we detonate a few nukes to promote volcanic eruptions.
3. We release all the CO2 again that the zealots are going to put in the ground for the next 30 years.
4. we increase the human population and make them drive bicycles 10 hours a day.
( a cyclist at speed produces the same amount of CO2 as a gasoline car driving at a speed of 30 mph. See: http://www.youtube.com/watch?v=Rvr6z8neCFk
I think this will do the job, nothing to worry about.
Two posts by meteorologist Joe d’Aleo
“Taking a Time Machine Ride Back to the 1960s or 1800s? ”
On temperature cycles and global cooling
http://icecap.us/index.php/go/joes-blog/taking_a_time_machine_ride_back_to_the_1960s_or_1800s/
On global cooling since 2002
http://icecap.us/images/uploads/MSUCRUvsCO2.jpg
Simon,
Much has been written about GISS ST data unreliability but I frankly haven’t the interest in finding the references for you – this dialogue is unproductive, like throwing sand.
Here is a response-in-kind to your and JP’s cherry-picking – the problem is we are now all covered in cherry juice, and are no wiser than before.
http://www.woodfortrees.org/plot/gistemp/from:1998/to:2009/trend/offset:-0.125/plot/hadcrut3vgl/from:1998/to:2009/trend
George – it was Bruce Cobb who introduced the Inhofe/Morano list as ‘disproof’ of the concensus amongst scientists, my response was to point out, with perhaps the most extreme example, that the list of prominent, sceptical, scientists actually contains many who clearly fail to qualify on one or more of these criteria, hence does not even dent the concensus. Morano’s aim is propaganda rather than science and his modus operandi is to trawl the media for any vaguely ‘sceptical’ statement – whether it is from a politician [e.g. Lord Lawson], an economist [e.g. Richard Tol, who is certainly not a sceptic of AGW], an engineer [e.g Bob Edleman], a mathematician [e.g. Richard Mackey] or indeed a TV Gardener, and then spin it up into the demonstrably untrue statement that here are ‘650 prominent scientists’ who disagree with the concensus. Once again it seems that ‘scepticism’ is unevenly applied; if I were a US taxpayer I would be outraged at my money being expended on this absurd and meritricious document.
As for engaging with the ‘scientific arguments’ proposed in Morano’s document, this would be a pure waste of my time. The place for scientific arguments to be advanced is the scientific literature, not some PR exercise. If these arguments have merit the proponents can publish them in a paper in the appropriate journal for scrutiny by the appropriate experts, so far precious few of these Morano’s eminences have attempted this, the ‘gold standard’, scientificially speaking, and the concensus is in fact based upon the findings in the published literature.
If you’re really interested, Ray Pierrehumbert, who in my view does qualify as an eminent scientist, and author of a textbook on the Physics of Climate, and who clearly has more patience than I, engages with Morano in the comments to this discussion [Especially comments 51, 72, 91, 96, 109, 144, 185, 199, 204] on a NY Times blog, making Marc Morano this offer … so how about we play it this way: Every time you respond, I’ll expose another one of your skeptics. I’m in no rush. Maybe in a few months we’ll get to the bottom of your list …, continued here [comments 60, 81, 111, 113, 156, 174, 196, 197, 200, 219, 264, 304, 394, 450, 415, 434-5, 450, 453, 481, 485, 521, 550, 558, 564, 578, 581, 867 ] until the moderator closed out the comments at 1200.
Cheers.
See how George Bush conquered global warming – page 7.
In truth, George didn’t have much to do with it – it was all Al Gore’s doing; right after he invented the internet. 😉
http://scienceandpublicpolicy.org/images/stories/papers/originals/jan_co2_report.pdf
The Bush Years: 8 years’ global cooling
SPPI’s Monthly CO2 Report shows that throughout the eight years of George Bush’s presidency there has been a downtrend in global temperature at a rate equivalent to 2 °F (1.1 °C) per century.
Main points –
Since Al Gore’s climate movie An Inconvenient Truth was launched in January 2005, global cooling has occurred at the equivalent of 11 °F (6 °C) per century. If this very rapid cooling were to continue, the Earth would be in an Ice Age by 2100.
The UN’s climate panel, the IPCC, had projected temperature increases at 4.5 to 9.5 °F (2.4 to 5.3 °C) per century, with a central estimate of 7 °F (3.9 °C) per century. None of the IPCC’s computer models had predicted a prolonged cooling.
The IPCC’s estimates of growth in atmospheric CO2 concentration are excessive. They assume CO2 concentration will rise exponentially from today’s 385 parts per million to reach 730 to 1020 ppm, central estimate 836 ppm, by 2100.
However, during President Bush’s eight-year term, CO2 concentration rose in a straight line towards just 575 ppmv by 2100. This alone halves the IPCC’s temperature projections. Since 1980 temperature has risen at only 2.5 °F (1.5 °C) per century.
The University of Colorado has published no sea-level data from the JASON monitoring satellite since the summer of 2008. However, sea level has been rising at just 1 ft (32 cm) per century, well below the IPCC’s recently-reduced 2 ft maximum.
Sea ice extent in the Arctic recovered to the 30-year average during the early winter of 2008. In the Antarctic, sea ice extent reached a record high late in 2007, and has remained plentiful since. Global sea ice extent shows no trend for 30 years.
The Accumulated Cyclone Energy Index is a 24-month running sum of monthly energy levels in all hurricanes, typhoons and tropical cyclones. The Accumulated Cyclone Energy Index hit a 30-year low in October 2008.
A paper explaining how SPPI’s CO2 and temperature graphs are computer-generated is under peer review and will be available soon.
For future editions of the Monthly CO2 Report, go to http://www.scienceandpublicpolicy.org.
Anthony Watts, Steve McIntyre and Joe d’Aleo have all done outstanding work on ST data integrity, or the lack thereof. Here is a good compilation.
Response to Gavin Schmidt on the Integrity of the Global Data Bases
By Joseph D’Aleo, CCM, AMS Fellow
http://icecap.us/images/uploads/URBANIZATION_IN_THE_TEMPERATURE_DATA_BASES.pdf
Allan M R MacRae says:
I don’t see how Simon’s use of all the data available from when the satellite record started until now is cherrypicking. It is simply comparing the datasets over the entire time period for which one could possibly compare all 4 data sets…And, importantly, it is over a long enough time period that the error bars for the trends are relatively small and thus the comparison is meaningful.
By contrast, your comparison is over a much shorter time period and one for which, if you haven’t cherry-picked, I certainly can’t figure out any rational justification for. Furthermore, the trends (while they may like dramatic the way you have plotted them) are smaller in magnitude and the error bars are likely considerable. And, given that trends over shorter time periods are likely to be more greatly affected by differences in the analysis (e.g., the GISS data includes the arctic region while the HADCRUT data does not), it is not surprising to see some divergence of this sort for trends in noisy data over short time periods. So, while “covered in cherry juice” you may be, but I don’t think it is fair to blame Simon for any of it.
“No, George – evidence of one example of dishonesty is evidence enough of dishonesty. ”
Oh, really?
“Would you care to give me evidence of my wilful ignorance, Gary, rather than just asserting the prejudice you have built up over time?”
Please review, at your leisure, the evidence at CA and its voluminous threads. I used Fortran 77 in Numerical Analysis back in the day, I wrote scripts to wend one ASCII parsing routine with the next. GISTemp code is a crime against nature.
Arguing the superiority of ground-based data for its Arctic data, and finding it all interpolated was minor. Finding that a routine to identify rural sites by light cast at night was not used to correct nearby urban sites for UHI but to adjust the rural data prior to the baseline of these very sites was the clincher.
Hansen is a fraud, QED. The ‘debate’ is over.
Re: Waves off California coast: from NWS for 2-10-2009:
TONIGHT
NE PORTION….SW WINDS 20 TO 30 KT EARLY…BECOMING
SHIFTING WINDS 15 TO 25 KT LATE. SEAS BUILDING TO 21 TO 26 FT.
SW PORTION…W TO SW WINDS 25 TO 35 KT EARLY…SHIFTING TO NW 35
TO 45 KT LATE. SEAS BUILDING TO 26 TO 34 FT…HIGHEST SW.
NUMEROUS SHOWERS THROUGHOUT.
gary gulrud (11:39:23) :
“No, George – evidence of one example of dishonesty is evidence enough of dishonesty. ”
Oh, really?
I have posted that the Hadley trend exceeds the GISS trend over the latter’s period of record. Is that true or is it false? A simple question that invites a simple, honest answer. Lucia has blogged to the same effect:
http://rankexploits.com/musings/2009/trends-since-1900-gisstemp/
I look forward to your response.
“”” John Philip (01:51:56) :
George – it was Bruce Cobb who introduced the Inhofe/Morano list as ‘disproof’ of the concensus amongst scientists, my response was to point out, with perhaps the most extreme example, that the list of prominent, sceptical, scientists actually contains many who clearly fail to qualify on one or more of these criteria, hence does not even dent the concensus. “””
Must be something wrong with my new browser John; so it erased the part where you quoted Bruce Cobb; leading to me to presume it was your assertion.
That must be why I can’t decipher half of the posts here, since it is not clear who is saying what, rather than cut and pasting something someone else said. After 12 reposts and pastes, it gets a little confusing.
And yes I’ve read quite a few of those ad hominem blogs to see how they rate the persons on Morano’s list; those with whom I am familiar. Typical of the ad hominem approach; they seldom get much right. And who vets the bloggers? Cheapest thrill in town hiding behind a curtain with a booming voice that people are supposed to shudder over.
For the record, Marc Morano, actually collects whatever he can find in anything that appears to be some recognised publication; such as New Yprk times for example. If it leads to a real scientific paper citation, he will obtain that; or try to obtain it, so he can send that out to his mailing list.
He has a short list of maybe 30-40 people; well actually several lists, since some people don’t want to bother with a lot of those things they already know about. And those on the short list actually communicate with each other, so they can vet any paper that Morano turns up, and inform him (in their opinion) as to whether it is real, imaginary, exaggerated, total nonsense or what have you, so he can wean out stuff that it BS.
I belong to the AAAS among other Scientific Societies, eg The Optical Society of America;one of the founding groups of the American Institute of Physics; so I routinely send Morano the weekly table of contents of SCIENCE magazine, and sometimes point to climate or energy articles that he may find of use to circulate, or for his own education. He can only access the abstracts for such articles from AAAS, but I can send him the full paper if he finds it interesting.
So to you it may appear like propaganda; which would be understandable because nobody in the Climate Science Community would ever stoop to propaganda; But I believe Marc Morano considers it a service to Senator Inhofe, and his EPW Committee minority group; to keep them up to date on related matters.
Somewhat of a contrast to Barbara Boxer who simply has Hansen or Al Gore come in and bloviate.
If you are quite happy with your government operating in that mode; that is your choice. I’m not a citizen, so I don’t communicate directly with Senator Inhofe; I think that is usurping privileges I don’t have; but it seems worthwhile to me to at least try and educate Marc Morano,to the extent that he can understand the issues.
But I can certainly understand that those who swill at the public trough, may feel that to be threatened by public disclosure of the reality of climate situations. It would be inconvenient for some to suddenly find the government not funding their gravy train; when the truth sinks in. They might have to actually go out and get a real job, in a real economy.
So our new President urges sudden action on his “Stimulus” package, which he swears contains no pork; but somehow it creates 400,000 new government jobs at a cost of $220,000 each; would that I be so lucky as to make that kind of money. And after they build that bridge (the non pork bridge) then of course all those people will be unemployed again. I call that a spending bill, not a stimulus bill.
John – You can nitpick the list of 650 scientists all you want, but your claim that the list “does not even dent the concensus” is absurd, and just political spin on your part. Especially since, “the consensus” is all just a myth to begin with, and actually based on politics, not science. But, since you are so interested in your mythical, political “consensus”, check out this recent posting on this blog for a number of links to articles totally debunking the so-called “consensus”.
Link
the concensus is in fact based upon the findings in the published literature.
Wow, so we have a myth based upon computer models based upon a long-discredited hypothesis. Talk about being on shaky ground!
Allan M R MacRae:
By the way, Lucia (who is hardly a stalwart defender of the IPCC) has a post on the “artfulness” of one of the graph’s (p. 6) in this propaganda piece over at her blog: http://rankexploits.com/musings/2009/more-artful-graphs-from-monckton/
Bruce Cobb says:
So, are you saying that the ability to assemble a list like Inhofe has shows that any consensus on climate change is a myth? If so, would you say the same is true in regards to evolution on the basis of this list: http://www.christiananswers.net/q-eden/edn-scientists.html If not, what makes the one case different from the other?
Reply: I’m going to allow this post because the analogy it makes has some logical validity however, discussions of creationism and intelligent design are prohibited at this site. This will not be allowed to spin out into a discussion of such. ~ charles the moderator
“I look forward to your response.”
Fake but accurate.
Joel Shore,
You might want to read what Lucia says in full. I like this from your link in particular:
“I find that the IPCC projected trend for this period would be rejected if we use 90% confidence levels.”
What do you think she is trying to say about the IPCC?
As to the pedigrees of those who are skeptical of AGW, sine most of the IPCC is no more qualified, and many of the AGW leadership are the same, I think this is a red herring for the AGW community to further dissemble with.
Joel Shore says:
So, are you saying that the ability to assemble a list like Inhofe has shows that any consensus on climate change is a myth? If so, would you say the same is true in regards to evolution on the basis of this list: http://www.christiananswers.net/q-eden/edn-scientists.html If not, what makes the one case different from the other?
No Joel. The Inhofe list is evidence that whatever “consensus” there was is actually losing ground, and is one example only. Do try to keep up.
And Joel, your feeble attempt to compare skeptics with anti-evolutionists is nothing more than a blatant ad hominem, and is very typical of the sleazy tactics you and your ilk continually use. It is a measure of the complete lack of any scientific foundation of your arguments that you feel the need to resort to that.
Not really. The sat records aren’t nearly long enough to have covered several of the known and emerging (as far as our knowledge is concerned) ocean, atmospheric and solar cycles. They’re just blips in time, really.
Bruce Cobb:
It is not evidence of that at all. I would look toward more objective measures than Inhofe press releases. Some such measures: The Global Climate Coalition has gone defunct and many of the companies that were part of it now accept the science on AGW. And, more and more corporations, including ones in the power industry, are accepting the science. Amongst scientific organizations, even the American Society of Petroleum Engineers, which was the only major scientific society with an openly challenging statement on AGW has adopted a new statement which one would best characterize as “non committal” (see here: http://en.wikipedia.org/wiki/Scientific_consensus_on_climate_change ).
That’s just silly. It is not ad hominem at all. You are the ones who are introducing this list of Inhofe’s as some sort of important piece of evidence. Now, we can tell you ’til we are blue in the face that the credentials of most of the signers are not very impressive (and a few of the more impressive ones have apparently asked to be taken off of the list). [And, as an aside since you mention it, we can also tell you ’til we are blue in the face where you get the science wrong…and have actually spent considerable time here doing so.]
However, sometimes when someone presents a piece of evidence such as this list which they somehow think is so compelling, the easiest way to point out why it is not compelling is to show how a similar list can be created to argue for a point of view that I think a much wider group of us here, in both the AGW and skeptics-of-AGW camps, would agree is not scientifically tenable. It’s sort of “a demonstration is worth a thousand words” statement.
I have sort of an interesting story / analogy in this regard: Several years ago, Harper’s Magazine published in their “readings” a piece by an English professor by the name of Wallace who took various paragraphs from Lewis Carroll’s work and created anagrams that were quite ghoulish and in some cases even somewhat confessional, and tying this in with Carroll’s known enjoyment of anagrams and word games, he tried to argue that this suggested that Lewis Carroll should be considered the prime suspect of having been “Jack the Ripper”.
Now, I am sure that someone could give a nice lecture about how easy it is to anagram a long enough piece of text to say virtually anything…and he might manage to convince some people to be very skeptical of Wallace’s thesis. However, what two brilliant readers did instead was to take the first paragraph of Wallace’s piece and produce from it an anagram that had him confessing to killing Nicole Simpson and framing O.J. Their anagram was so good…in fact so much better than any of them in Wallace’s piece…that I was skeptical that it was an an exact anagram and actually wrote a piece of code to verify to myself that it was!
By providing such a compelling demonstration, what these two people did was to create a stronger argument why Wallace’s thesis was bunk than anyone could possibly have made directly. And so (in an admittedly less brilliant and creative way), that is what I am trying to do here: I can argue until I am blue in the face about how easy it is to find the names of 650 scientists to agree with something, especially if you set your standards low enough, or I can simply provide a demonstration of the fact that similar lists do indeed exist to defend a scientific idea that I think we could have quite wide agreement here is not tenable.
If anyone wants to read the Lewis Carroll anagram story, there is a Wikipedia page about it: http://en.wikipedia.org/wiki/Jack_the_Ripper,_Light-Hearted_Friend (Yeah…I know this is a tangent, but trust me, it is a very amusing one!)
Jeff Alberts says:
Well, compared to the sort of lengths of time over which trends seem to have attracted interest around here, I would say they are considerably more than just blips in time. Furthermore, the sort of statistical evaluations that one can do to determine the uncertainty in a trend from the behavior of the data show the trends to be much less uncertain than for the trends over the shorter time periods of, say, ~10 years or less that have been so popular of late.
hunter says:
Actually she then goes on to say, “The trend would fail to reject at 95% confidence.”
Furthermore, you have to be very careful in how you play the game with these confidence levels. This is best illustrated by the point that if you repeat a study 10 times, it is very likely by chance to find that in one of the studies, you reject a hypothesis at the 90% confidence level even if it is correct. In this case, we have lots of years of data that are somewhat analogous to the repeating of a study many times (not quite because of correlation in the data and such). And, we know for the fact that we are now just coming off a significant La Nina that caused a significant cooling over the last couple of years. So, it would also be interesting to ask: Did the trend through, say, 2006 also reject at the 90% confidence level? And, a few years from now, what does the trend show?
Along these lines, here is a study of how the temperature trends were comparing with the IPCC predictions through 2006: http://www.sciencemag.org/cgi/content/abstract/sci;316/5825/709 At that point, the temperature trends were not only within the IPCC projections…They were actually toward the high end. So, I would caution against trying to jump to conclusions too quickly unless you want to give yourself whiplash!
You won’t have seen me say anything about so-called trends in recent years. So I can’t speak to that. I’m not sure how you can determine uncertainty with a incredibly short 30 year data set. How do you know a 30 year trend is “certain” over a 10 year one? And given that, a thousand year trend would be even more certain.
There are standard ways to compute the uncertainty in a linear trend from a data set on the basis of how much the data deviate from a straight line. For data that has noise that has no correlation in time, it is pretty straightforward. For temperature data sets, where such time correlations do exist, it gets more complicated.
Admittedly, such trend analyses can’t speak to the point of whether the trend is part of a longer term cycle (over some time period longer than the data) …but it can speak to the question of how reliable the estimate of the linear trend is for the data over the time period that the data is analyzed.
New All-Time Low Temperature Recorded in Maine
http://www.erh.noaa.gov/car/News_Items/2009-02-10_item001.htm
Minus 50 degrees F on 16 January 2009, breaking the old record of -48dF set in 1925.
I recently read a news report out of the UK that claimed the extreme cold just experienced in Europe was caused my global warming. No, it did not seem to be a satire – just another tall tale from that lovable but goofy global warming gang.
I really wish the warmists were right – I am getting tired of all this damned cold – but the groundhog and I expect the LT anomaly to drop considerably by May 2009.
Stay tuned, and bundle up!
Regards, Allan
It may have been this article, or another similar one.
“Warming causes cooling… … Down is up… …Less is more.”
http://www.telegraph.co.uk/topics/weather/4436934/Snow-is-consistent-with-global-warming-say-scientists.html
Snow is consistent with global warming, say scientists
By Richard Alleyne, Science Correspondent
Last Updated: 6:41AM GMT 03 Feb 2009
Britain may be in the grip of the coldest winter for 30 years and grappling with up to a foot of snow in some places but the extreme weather is entirely consistent with global warming, claim scientists.
Temperatures for December and January were consistently 1.8 F ( 1 C) lower than the average of 41 F (5 C)and 37 F (3C) respectively and more snow fell in London this week than since the 1960s.
But despite this extreme weather, scientists say that the current cold snap does not mean that climate change is going into reverse. In fact, the surprise with which we have greeted the extreme conditions only reinforces how our climate has changed over the years…
icecap.us comments:
Sorry guys, the jig is up. Yes weather is different from climate but a climate regime change has taken place which will mean this kind of weather will happen more frequently. Your excuses and claims will seem more and more ludicrous with each passing storm or cold day/season. Better either open you minds or start looking for another line of work.
http://www.telegraph.co.uk/topics/weather/4436934/Snow-is-consistent-with-global-warming-say-scientists.html
So, Allan M R MacRae, please be so kind and point out, where exactly your “Warming causes cooling” quote comes from.
Joel Shore says:
The Global Climate Coalition has gone defunct and many of the companies that were part of it now accept the science on AGW. And, more and more corporations, including ones in the power industry, are accepting the science.
Who cares what an industry group or individual corporations do or say about AGW? Can you say “self-interest”? Being on board the AGW bandwagon is good for the bottom line, that certainly doesn’t mean it is good science. Nice try, Joel.
That’s just silly. It is not ad hominem at all. You are the ones who are introducing this list of Inhofe’s as some sort of important piece of evidence.
Nonsense, Joel. Of course it’s ad hominem. Now you are simply being disingenuous. It is a deliberate attempt on your part to try to tar skeptics with the same brush as the anti-evolutionists. Nice try.
Besides, you conveniently ignore all of the other evidence debunking the consensus myth in the recent posting on this blog giving a number of links to articles totally debunking the so-called “consensus”.
Finally, your mythical consensus is purely a political construct, useful for propaganda purposes. In no way does it validate the flimsy science of AGW, but people who aren’t familiar with how science works often don’t know that, which of course is what the AGW propagandists are counting on.
The Chu Effect is proving potent. Tahoe is forecast to receive 43 inches of snow over the next five days.
http://www.accuweather.com/us/ca/lake-tahoe/AB957/forecast.asp?partner=forecastfox&traveler=1&zipChg=1&metric=0
Bruce: It is clearly useless to argue with you. You will continue to believe what you want to believe. No amount of evidence will convince you of the scientific consensus on AGW…and no piece of evidence arguing otherwise, no matter how flimsy, will be considered too poor.
Good luck in convincing the world that the National Academy of Sciences and the analogous bodies in all the other G8+5 countries are merely “AGW propagandists” or stooges for them and that Sen. Inhofe and Viscount Monckton represent the voice of scientific reason! I think even most of his Republican senate colleagues think Inhofe is off his rocker on this.
Joel: It is clearly useless to argue with you. You will continue to believe what you want to believe. No amount of evidence will convince you that your precious “scientific consensus” on AGW is both mythical and purely a political construct that AGWers need to cover for the fact that their arguments are completely lacking a scientific basis. You are simply an AGW True Believer, and no amount of logic or science will sway people like you. It’s sad, really.
Re: the NAS, etc. Clutching at straws, aren’t we? It’s a well-known fact that the pro-AGW “statements” of those organizations are put out by a limited, select group, and that the members do not have any say, nor do they get a vote on those statements. They are for political purposes only.
Yes, of course, end your argument with a couple of ad homs! Why not? Nothing changes with you AGWers. Good luck [snip]. Fortunately, there are fewer and fewer of you, as the smarter ones are jumping ship like rats.
Reply: comparison not allowed on either side ~ charles the moderator.
http://news.bbc.co.uk/2/hi/science/nature/7885036.stm
Obama ‘must act now’ on climate
The planet will be in “huge trouble” unless Barack Obama makes strides in tackling climate change, says a leading scientist.
Prof James McCarthy spoke on the eve of the annual meeting of the American Association for the Advancement of Science (AAAS), which he heads.
The US president has just four years to save the planet, said Prof McCarthy.
“The calibre of scientific advice that is close to this man is truly exceptional.