UPADATED AT 8:30AM PST Sept 2nd-
More on SIDC’s decision to count a sunspeck (technically a “pore”) days after the fact. NOAA has now followed SIDC in adding a 0.5 sunspot where there was none before. But as commenter Basil points out, SIDC’s own records are in contrast to their last minute decision to count the sunspeck or “pore” on August 21.
There is an archive of the daily SIDC “ursigrams” here:
http://sidc.oma.be/html/SWAPP/dailyreport/dailyreport.html
If you select the ursigrams for August 22 and 23, you get the reported data for the 21st and 22nd:
August 21:
TODAY’S ESTIMATED ISN : 000, BASED ON 07 STATIONS.
SOLAR INDICES FOR 21 Aug 2008
WOLF NUMBER CATANIA : 011
10CM SOLAR FLUX : 067
AK CHAMBON LA FORET : ///
AK WINGST : 004
ESTIMATED AP : 005
ESTIMATED ISN : 000, BASED ON 14 STATIONS.
August 22:
TODAY’S ESTIMATED ISN : 000, BASED ON 11 STATIONS.
SOLAR INDICES FOR 22 Aug 2008
WOLF NUMBER CATANIA : 013
10CM SOLAR FLUX : 068
AK CHAMBON LA FORET : ///
AK WINGST : 003
ESTIMATED AP : 003
ESTIMATED ISN : 000, BASED ON 11 STATIONS.
In both cases, the daily estimated “International Sunspot Number” based on multiple stations, not just the Catania Wolf Number, was 000. So how did SIDC end up with positive values in the monthly report?
UPDATED at 2:42 PM PST Sept 1st –
After going days without counting the August 21/22 “sunspeck” NOAA and SIDC Brussels now says it was NOT a spotless month! Both data sets below have been recently revised.
Here is the SIDC data:
http://www.sidc.be/products/ri_hemispheric/
Here is the NOAA data:
ftp://ftp.ngdc.noaa.gov/STP/SOLAR_DATA/SUNSPOT_NUMBERS/MONTHLY
The NOAA data shows July as 0.5 but they have not yet updated for August as SIDC has. SIDC reports 0.5 for August. It will be interesting to see what NOAA will do.
SIDC officially counted that sunspeck after all. It only took them a week to figure out if they were going to count it or not, since no number was assigned originally.
But there appears to be an error in the data from the one station that reported a spot, Catania, Italy. No other stations monitoring that day reported a spot. Here is the drawing from that Observatory:
ftp://ftp.ct.astro.it/sundraw/OAC_D_20080821_063500.jpg
ftp://ftp.ct.astro.it/sundraw/OAC_D_20080822_055000.jpg
But according to Leif Svalgaard, “SIDC reported a spot in the south, while the spot(s) Catania [reported] was in the north.” This is a puzzle. See his exchange below.
Also, other observatories show no spots at all. For example, at the 150 foot solar solar tower at the Mount Wilson Observatory, the drawings from those dates show no spots at all:
ftp://howard.astro.ucla.edu/pub/obs/drawings/dr080821.jpg
ftp://howard.astro.ucla.edu/pub/obs/drawings/dr080822.jpg
Inquires have been sent, stay tuned.
Here is an exchange in comments from Leif Svalgaard.
——-
REPLY: So What gives Leif….? You yourself said these sunspecks weren’t given a number. I trusted your assessment. Hence this article. Given the Brussels folks decided to change their minds later, what is the rationale ? – Anthony
The active region numbering is done by NOAA, not by Brussels. The Brussels folks occasionally disagree. In this case, they did. Rudolf Wolf would not have counted this spot. Nor would I. What puzzles me is this:
21 7 4 3
22 8 4 4
The 3rd column are ’spots’ in the Northern hemisphere, and the 4th column are ’spots’ in the Southern hemisphere [both weighted with the ‘k’-factor: SSN = k(10g+s)]. But there weren’t any in the south. The Catania spot was at 15 degrees north latitude, IIRC. Maybe the last word is not in on this.
——–
Hmm….apparently there’s some backstory to this. There is a debate raging in comments to this story, be sure to check them. – Anthony
# MONTHLY REPORT ON THE INTERNATIONAL SUNSPOT NUMBER #
# from the SIDC (RWC-Belgium) #
#——————————————————————–#
AUGUST 2008
PROVISIONAL INTERNATIONAL NORMALIZED HEMISPHERIC SUNSPOT NUMBERS
Date Ri Rn Rs
__________________________________________________________________
1 0 0 0
2 0 0 0
3 0 0 0
4 0 0 0
5 0 0 0
6 0 0 0
7 0 0 0
8 0 0 0
9 0 0 0
10 0 0 0
11 0 0 0
12 0 0 0
13 0 0 0
14 0 0 0
15 0 0 0
16 0 0 0
17 0 0 0
18 0 0 0
19 0 0 0
20 0 0 0
21 7 4 3
22 8 4 4
23 0 0 0
24 0 0 0
25 0 0 0
26 0 0 0
27 0 0 0
28 0 0 0
29 0 0 0
30 0 0 0
31 0 0 0
__________________________________________________________________
MONTHLY MEAN : 0.5 0.3 0.2
========================================================
ORIGINAL STORY FOLLOWS:
Many have been keeping a watchful eye on solar activity recently. The most popular thing to watch has been sunspots. While not a direct indication of solar activity, they are a proxy for the sun’s internal magnetic dynamo. There have been a number of indicators recently that it has been slowing down.
August 2008 has made solar history. As of 00 UTC (5PM PST) we just posted the first spotless calendar month since June 1913. Solar time is measured by Coordinated Universal Time (UTC) so it is now September 1st in UTC time. I’ve determined this to be the first spotless calendar month according to sunspot data from NOAA’s National Geophysical Data Center, which goes back to 1749. In the 95 years since 1913, we’ve had quite an active sun. But that has been changing in the last few years. The sun today is a nearly featureless sphere and has been for many days:

Image from SOHO
And there are other indicators. For example, some solar forecasts have been revised recently because the forecast models haven’t matched the observations. Australia’s space weather agency recently revised their solar cycle 24 forecast, pushing the expected date for a ramping up of cycle 24 sunspots into the future by six months.
The net effect of having no sunspots is about 0.1% drop in the TSI (Total Solar Irradiance). My view is that TSI alone isn’t the main factor in modulating Earth’s climate.
I think it’s solar magnetism modulating Galactic Cosmic Rays, and hence more cloud nuclei from GCR’s, per Svensmark’s theory. We’ve had indications since October 2005 that the sun’s dynamo is slowing down. It dropped significantly then, and has remained that way since. Seeing no sunpots now is another indicator of that idling dynamo.
Graph of solar Geomagnetic Index (Ap):

Click for a larger image
Earth of course is a big heat sink, so it takes awhile to catch up to any changes that originate on the sun, but temperature drops indicated by 4 global temperature metrics (UAH, RSS and to a lesser degree HadCrit and GISS) show a significant and sharp cooling in 2007 and 2008 that has not rebounded.In the 20 years since “global warming” started life as a public issue with Dr. James Hansen’s testimony before congress in June 1988, we are actually cooler.

Click for a larger image
Reference: UAH lower troposphere data
Coincidence? Possibly, but nature will be the final arbiter of climate change debate, and I think we would do well to listen to what it’s saying now.
Joe D’Aleo of ICECAP also wrote some interesting things which I’ll reprint here.
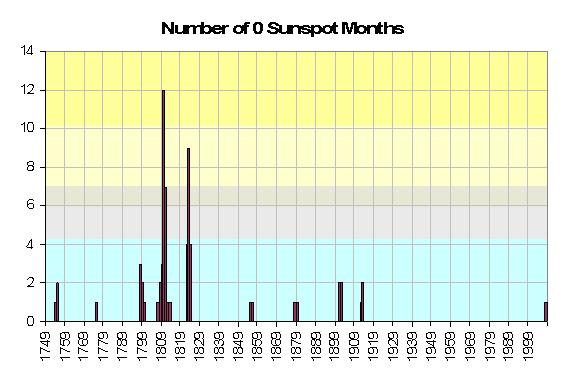
…we have had a 0 sunspot calendar month (there have been more 30 day intervals without sunspots as recent as 1954 but they have crossed months). Following is a plot of the number of months with 0 sunspots by year over the period of record – 23 cycles since 1749.
See larger image here.
Note that cluster of zero month years in the early 1800s (a very cold period called the Dalton minimum – at the time of Charles Dickens and snowy London town and including thanks to Tambora, the Year without a Summer 1816) and again to a lesser degree in the early 1900s. These correspond to the 106 and 213 year cycle minimums. This would suggest that the next cycle minimum around 2020 when both cycles are in phase at a minimum could be especially weak. Even David Hathaway of NASA who has been a believer in the cycle 24 peak being strong, thinks the next minimum and cycle 25 maximum could be the weakest in centuries based on slowdown of the plasma conveyor belt on the sun.
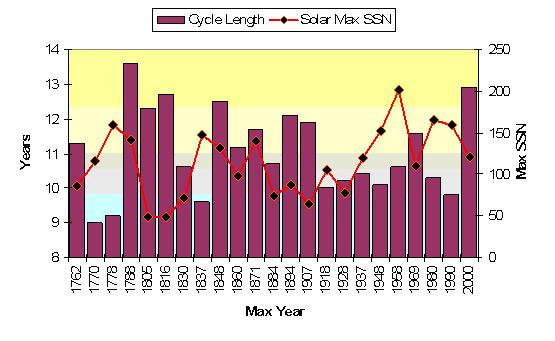
In this plot of the cycle lengths and sunspot number at peak of the cycles, assuming this upcoming cycle will begin in 2009 show the similarity of the recent cycles to cycle numbers 2- 4, two centuries ago preceding the Dalton Minimum. This cycle 23 could end up the longest since cycle 4, which had a similar size peak and also similarly, two prior short cycles.
See larger image here.


Will this mean anything for climate in our near future? Possibly. But we’ll have to wait to see how this experiment pans out.
When the sun dies
Where will they all hide?
I want to move from the country
Live a sin and a lie then
Nobody ever believes me
You tried to call me a cynic
But I’d say I’m realistic
You are the ones who have hurt me
I want to live in the city
See my reflections
They’re all I have now
See my reflections
They’re all and they’re all I…
When the sun dies
Where will they all hide?
When the sun dies
Where will they all hide?
I’ll be watching you
When the sun dies
Where will they all hide?
I’m starting work on my ski lodge and lift here in FL! Make your reservations now!
On a more serious note, it might be a good time to start stocking up on non-perishable foodstuffs. It’s a lot easier to get crops to grow with a half-degree temperature increase than it is to grow them under a blanket of snow and ice. Of course, The Great Goreacle & his hysterical hand puppet, James Hansen, will say that the approaching glaciers are proof that AGW is true, thus ensuring themselves of billions of dollars in
carbon creditssnake oil sales.Keep up the great work, Anthony. (And all you other
deniersskeptics out there in the land of science.)The sun appears to be blushing in the upper left hand quadrant.
It’s not your fault, sun.
Wonder how long into this quiet sun we’ll have to go before there’s so much cooling that funding gets channeled into studying the effects of solar activity (of all sorts) on the climate. But by then the AGW believers will be chanting on about how the cooling is masking the warming – can’t lose all that funding.
So B.C. above can refer to “the Great Goreacle”, but I get my hands slapped for “McOld” in the previous thread. And I know that I’ve seen lots and LOTS of nicks for Al Gore since I’ve been reading this site.
Nice double standard you have here, guys. Perhaps you need to realize that not all Dems are AGW true believers.
::grumble::
REPLY: Julie you have a point. We have a couple of moderators now, and I didn’t see the one above until just now. Perhaps I’m overly sensitive, but lately I’ve been getting a lot of spam posts calling McCain and Palin all sorts of names, and I delete those since they are part of a political push. So lets all just not call people names please. -Anthony
julie,
You got a point. But your other posts were charming. I think the intent is for you not to demean yourself. It is sound advice. Please keep posting.
In case someone is wondering how we can measure the magnetic field strength of the Sun, google Zeeman Effect.
BC, the main problem your ski resort will face in Florida isn’t lack of snow; it’s lack of mountains, hills, or even bumpy bits. You really ought to consult a reality expert. 🙂
Al Gore is just the messenger. Human nature is to shoot the messenger and say the messenger is out to make big bucks.
Robert, apparently you’re not familiar with the HUGE mountains of phosphate mine tailings, aka “gypsum stacks“, that we have scattered all across West-Central FL. 😉
Might as well use ’em for something, since the trace amounts of naturally-occurring radioactivity in ’em makes the ‘Loons go apoplectic anytime someone comes up with a proposed use for the material, such as roadbeds or foundation filler. (Thus saving thousands of acres of land from being mined, solely for dirt, each and every year.)
thus ensuring themselves of billions of dollars in
carbon creditssnake oil sales.That is terribly unjust and I must object: After all, when the carny sold you snake oil, you actually got the snake oil.
David, hanging– using only Gaia-friendly, organically-grown hemp rope, of course— hypocritical snake oil salesmen is the “green” way of dispatching them, these days. Carbon-emitting energetic projectiles are passé . Ya’ gotta keep up with the program, sir. Remind us to “CC” you on the next memo.
😉
Mr. Jones, you are absolutely correct. Would “Ponzi scheme scam artists” be more accurate?
Alright, I’ve taken up enough of Anthony’s bandwidth for tonight. 🙂
I lived long enough to see Alan Greenspend be discredited. Another Al, another milepost to reach.
Al Gore is just the messenger. Human nature is to shoot the messenger and say the messenger is out to make big bucks.
He’s a fraud and a liar, and yes, out to make big bucks off of that fraud. But, you can call him a “messenger” if you want, David.
Julie: I think “McOld” is hilarious. BTW, I voted for Gore in 2000. Now, I can’t stand him.
[REPLY: Nonetheless, we will refrain from renaming the current candidates. FWIW, I am a liberal skeptic, myself, for now a “big tent” Republican (for liberal reasons), but theoretically that could change at any time.–Evan]
::grumble::
Bear with us.
We do have to maintain some double standard around here.
Yet we have refrained from namegaming either of the current candidates (and, as I’m sure you can imagine, that is a sword that cuts both ways).
Heh. This is beginning to sound pretty much like I thought it would when I saw that solar cycle graph from an earlier posting. The actual Year 2020 might give new meaning to the saying that “hindsight is always 20/20.”
Mr. D’Aleo says: “These correspond to the 106 and 213 year cycle minimums. This would suggest that the next cycle minimum around 2020 when both cycles are in phase at a minimum could be especially weak.”
If this proves true, this sounds pretty ominous. Here is what I mean:
The PDO will be in the middle of its Cool Phase, and the AMO is set to switch over to being less active itself at some point. Dr. Gray, in his latest forecast of Atlantic Hurricane seasonal acitivity disabuses his readers of the notion that AGW is to blame for hurricanes (see page 34 here: http://typhoon.atmos.colostate.edu/Forecasts/2008/aug2008/aug2008.pdf). He also, thereby, provides a pretty approximate date for the AMO, although that is certainly not the only factor in hurricane formation. Still, I feel the case is pretty strong. If it follows Dr. Gray’s example of 25 years, and if it began in 1994 as his graphics seem to say, then that puts the switch back to less active (or Cool, if you like) to 2019.
If this is a minimum, even if it is minor in comparison with other historical minima such as Dalton’s or Maunder’s, that still does not bode well for that time frame (circa 2020). It take time to prepare for such things, if first one decides to prepare for such things, and particularly so on a national or global scale. And the way we are going now with AGW worriers dominating our political establishments is not good. Twelve years may seem like a long time; however, particularly if you have kids, you know it isn’t. We are not out of time yet, but we seem to be on the clock.
Uneasily, I shall say…I guess we shall see.
From Led Zepplin’s “Thank You”:
“If the sun refused to shine, I would still be lovin’ you.”
I told my wife today that I will be fulfilling that promise.
(Yes, that was our wedding song.)
statePoet1775, thanks for your reply. I do get the point – but at the same time, I wish you guys would de-link the whole Republican = AGW skeptic; Democrat = AGW true believer. It does not help our skeptical cause to blast all liberals as sheeple when it comes to AGW… because they are the ones we need to reach. I should know – I’m one of them who was convinced (converted??) by what I read here – and I tell whoever will listen about this site.
That being said, I’m glad you like my (infrequent) comments. 🙂
re: the Sun – personally, I’m looking forward to skiing in the Texas Hill Country in the winter of 2014-15 🙂
[snip] (trying for a snip)?
[and succeeding~charles the moderator]
Or how about Biden his time since he’s next in line?
julie,
I would guess the strongest skeptics are my herd, libertarians. I was agnostic on AGW but thought we could handle it without destroying the economy in the process. Now I even doubt AGW. This is great drama.
David G. Mills
What should we do when the messenger distorts the message?
e.g. by inflating the ocean rise by some 2000%?
Sen. Kerry appears to excel in ad hominem attacks claiming: “Palin as a member of the “flat-earth caucus,” and “He’s chosen somebody who doesn’t believe climate change is man-made.”
Perhaps Sen. Kerry should read Watt’s post above on the sun.
<a href=”http://www.climatechange.alaska.gov/docs/govrpt_jul08.pdf”Governor Palin stated:
During her Newsmax interview, when asked: “What is your take on global warming and how is it affecting our country?” Palin replied:
“If the sun refused to shine, I would still be lovin’ you.”
I like the Hendrix take. Less mushy.
Corrections to links:
D.53 (2008). See
IPCC Central Tendency of 2C/century: Still rejected.
Keenlyside et al.
Governor Palin Climate Change Sub-Cabinet
Koutsoyiannis et al 2008: On the credibility of climate predictions
I wanna see the sun
spotted up in the sky.
Not till the warmers are silenced.
BC, the main problem your ski resort will face in Florida isn’t lack of snow; it’s lack of mountains, hills, or even bumpy bits.
Robert, those deficiencies don’t stop them from skiing in Terre Haute, IN.
BC It never cease to amaze me how scientist types want the non-scientist types to carry their water for them. But as soon as the water turns to shit, they blame the water carrier for stinking up the place.
But if you want to abuse the water carrier, it is your prerogative.
I still like Al Gore though I now think that solar activity is the most likely cause of the warming of the 1900’s. I don’t think its Al’s fault that he trusted the wrong scientists or accepted the scientific “consensus.”
Or until the earth has been warm enough, and the sun quiet enough for long enough that the [snip] realise they have to find a new theory for why AGW is wrong.
David G. Mills says,
“I still like Al Gore though I now think that solar activity is the most likely cause of the warming of the 1900’s. I don’t think its Al’s fault that he trusted the wrong scientists or accepted the scientific “consensus.””
If it’s not Al Gore’s fault, whose is it? You or I didn’t jump to similar conclusions. He reached his level of incompetence long ago, and is apparently blissfully unaware of it. What’s more, he’s at the forefront of creating the “consensus” myth that you describe.
“statePoet1775 (19:28:30) :
Or how about Biden his time since he’s next in line?”
Okay, NOW you owe me a keyboard! (actually, you owe me a laptop. So much for drinking and reading this blog at the same time.) ::snort:: ROFL
” Bruce Cobb (19:34:29) :
Julie: I think “McOld” is hilarious. BTW, I voted for Gore in 2000. Now, I can’t stand him.”
Bruce, ME TOO. As late as 8 months ago I was wanting him (Gore) to run for Pres again and save the planet. Then I found WUWT, and that was THAT. Thank God for this blog!
What stops you people who defend Al Gore from noticing his massive level of “Do as I say, not as I do” hypocracy. His monthly electric bill for his Tenn. mansion would pay mine for 33 1/3 years. Plus his monster houseboat B.S. 1, plus his fleet of large vehicles, plus his private jet flights. He is the type specimen for: ‘I know he is lying, his lips are moving’.
evanjones (19:21:28) :
After all, when the carny sold you snake oil, you actually got the snake oil.
Amazingly apt criticism.
David G. Mills “I still like Al Gore though I now think that solar activity is the most likely cause of the warming of the 1900’s. I don’t think its Al’s fault that he trusted the wrong scientists or accepted the scientific “consensus.””
But please can I blame him for taking the Noble Peace Prize? Or at least not returning it now that he must know he was wrong?
[…] Read the story over at Watts Up With That… […]
All I can say from my deck on Vancouver Island is its been damned cold this summer. Right now its more like October than the end of August. But we were warned that global warming could cause global cooling, so I guess its still my fault. On the positive side, if this keeps up, we could be skiing much sooner. I drove up to the local ski resort today and it was a cool 10C. I’d like to say that this is not normal, but weather/climate is variable, at least here, so normal would seem to be whatever we have at the moment.
If the continuing lack of sun spots means cooler times ahead, then I’ll have to dig out that parka that I used to wear during Winnipeg winters.
Looking back to other “phase changes” its likely that the AGW crowd will just switch to AGCooling without skipping a beat. The media and their cast of supporting scientists have done it before.
For now, I’m reminded of a Beatles song, Here comes the sun.
Bruce, ME TOO. As late as 8 months ago I was wanting him (Gore) to run for Pres again and save the planet. Then I found WUWT, and that was THAT. Thank God for this blog!
Nobody beats the Rev!
I spotted both Gore and Clinton in 1984 as potentially good presidents. (But I had learned my lesson by the end of ’93.) By 2000 I had Pal Al sized up as a mouse studying to be a rat.
And I was highly prejudiced against global warming from the very getgo, what with being fresh off the resources debate, and the exact same damn dudes pushing GW that pushed the anti-growth movement.
Until recently, AGW believers and skeptics have been mostly aligned according to conservative/liberal affiliations. I think this is because most of the proponents have been liberal (certainly here in the US, the biggest proponent is a liberal) and conservatives are reacting to the solutions to AGW which generally are wealth redistribution schemes which go under various names such as Carbon Trading/Taxing/Caps.
In science, I am apolitical to AGW. Either it exists to a measurable/meaningful degree or it does not. I currently believe it does not exist in any meaningful manner.
I am sure it bothers many skeptics to be called ‘flat-earthers’ by the likes of John Kerry and other politicians who appear to lack even the most fundamental understanding of the science itself, but these are the slings and arrows of outrageous fortune.
We skeptics need to avoid being drawn into the politicization of climate change and stick to the science and the facts.
Joe D’Aleo wrote:
Even David Hathaway of NASA who has been a believer in the cycle 24 peak being strong, thinks the next minimum and cycle 25 maximum could be the weakest in centuries based on slowdown of the plasma conveyor belt on the sun.
Hathaway has shown a very poor [that is with low significance] correlation or relationship between observed cycle strength and conveyor belt speed [two cycles back]. The correlation is barely there and fails completely for cycle 19, the biggest of them all. Curiously, David has been an active supporter of the HAO dynamo model by Dikpati et al. This model and several similar models all predict [or actually use] just the opposite relationship, namely that a slow belt means a large cycle coming. The reason is obvious [even for people that are not dynamo experts], namely, that the longer the flux stays down below the tachocline [because of a slow circulation], the longer the dynamo process can operate on [i.e. amplify] the flux and the stronger will the cycle be. So, the dynamo models predicting a high cycle are consistent with the observed slow conveyor belt speed. So, a slowdown of the speed will signal a large cycle ahead according to these much heralded dynamo theories. It is, to me, strange that Hathaway thinks otherwise and yet actively promotes the Dikpati dynamo model. Wonders never cease.
Can someone please explain (in simple words that even I can understand) why the TSI varies only by very small amounts (did I read 0.2%) while individual wavelengths/bands like UV can vary by much more. I think I have seen reference to 5% or more.
The TSI seems to be a mechanism the AGW believers use to make it seem as if solar variation cannot be responsible for climate change.
John Riddell (22:58:33) :
Can someone please explain (in simple words that even I can understand) why the TSI varies only by very small amounts (did I read 0.2%) while individual wavelengths/bands like UV can vary by much more. I think I have seen reference to 5% or more.
This is because the UV is such a small part of the total. It is like the variation of the amount of loose change in your pocket compared to your net worth [or at least I hope so for you 🙂 ]
Anthony,
the year 1816, the year without summer: There occured a very big volcano eruption (Tambora in Indonesia) with about 100 km3 blown into the atmosphere, in 1815. This was on top of a low solar activity period.
Dr. Svalgaard,
in your post up above you say,
“Hathaway has shown a very poor [that is with low significance] correlation or relationship between observed cycle strength and conveyor belt speed [two cycles back]. The correlation is barely there and fails completely for cycle 19, the biggest of them all. Curiously, David has been an active supporter of the HAO dynamo model by Dikpati et al. This model and several similar models all predict [or actually use] just the opposite relationship, namely that a slow belt means a large cycle coming. The reason is obvious [even for people that are not dynamo experts], namely, that the longer the flux stays down below the tachocline [because of a slow circulation], the longer the dynamo process can operate on [i.e. amplify] the flux and the stronger will the cycle be. So, the dynamo models predicting a high cycle are consistent with the observed slow conveyor belt speed. So, a slowdown of the speed will signal a large cycle ahead according to these much heralded dynamo theories. It is, to me, strange that Hathaway thinks otherwise and yet actively promotes the Dikpati dynamo model. Wonders never cease.”
My question is, if cycle 24 is, as you think, a low activity cycle, will this completely negate the validity of the Dikpati dynamo model, or can it be tweaked somehow?
Kim
EvanJones “After all, when the carny sold you snake oil, you actually got the snake oil.”
They sure saw you coming! 😉
We mustn’t worry about the lack of sun spots. The weather in Boston is very fine.
Why do hotels in America only give you one tea bag? That is a much more worrying state of affairs than a lack of sunspots. It’s a good thing I brought over my own supply (tea bags, not sunspots).
A happy Labo(u)r Day to you all.
Weather anecdote:
Earliest ever recorded snowfall on Mt Fuji in Japan.
http://www.japantoday.com/category/national/view/snow-fell-on-mt-fuji-aug-9-at-earliest-time-ever
[Note: A single weather event is not an indication of climatic change]
Above link hat tip to:
http://klimakatastrophe.wordpress.com/
“Why do hotels in America only give you one tea bag?”
Boston? Tea?
‘Nuff said.
Leif Svalgaard (23:04:02) :
This is because the UV is such a small part of the total. It is like the variation of the amount of loose change in your pocket compared to your net worth [or at least I hope so for you 🙂
Hey isn’t loose change heavier than butterflies ! 🙂
UV may be small but it does have a significant effect in the stratosphere. the hard part is proving a link exists(or series of links).For a small force to have an impact it needs to act at a tipping point (gasp!) By this I’m talking about ball being balanced on a hill, with either side being a positive feedback, like for instance the neutral state of ENSO. Once the system gains inertia then the small forcing becomes irrelevant. Of course this smaller system can be part of a much larger system that undergoes stabilizing negative feedback. Like a hill in between two mountains. so how does the ball get back up the hill after it falls off? easy, all you need is some wobble at the right time, such as a man on a trapeze or a skateboarder in a bowl. Earth has at least two forms of wobble that can provide momentum, seasonal cycles and solar cycle oscillations.
Hey I have idea for a way to model for climate.
put a coin in bowl with an indentation in the middle and shake back and forwards! 🙂
I’m not sure that 0.1% is that insignificant in the long run (20 years).
Is my logic here somewhat correct?
The last I knew the earth was about 16 degrees Celsius or 289 Kelvin. Some of the heat comes from below ground but a boatload comes from the sun. The temperature of the Universe is about 3 degrees Kelvin. If the earth would be 3 degrees without the sun that means that a 0.1% variation would change the earth’s temperature by 0.286 degrees. If, without the sun the earth would be about 100 K a 0.1% variation would change the earth’s temperature by 0.189 degrees.
I know the continents, oceans and atmosphere has a tremendous amount of heat built in but in the long-term it shouldn’t matter.
[…] few years. The sun today is a nearly featureless sphere and has been for many days…." (fonte Sun has first spotless calendar month since June 1913 Watts Up With That?) Da notare che giugno 2008 è stato uno dei più freddi degli ultimi anni "….temperature […]
“BREAKING NEWS”
SIDC Brussels says NOT a spotless month!
They officially counted that sunspeck:
# MONTHLY REPORT ON THE INTERNATIONAL SUNSPOT NUMBER #
# from the SIDC (RWC-Belgium) #
#——————————————————————–#
AUGUST 2008
PROVISIONAL INTERNATIONAL NORMALIZED HEMISPHERIC SUNSPOT NUMBERS
Date Ri Rn Rs
__________________________________________________________________
1 0 0 0
2 0 0 0
3 0 0 0
4 0 0 0
5 0 0 0
6 0 0 0
7 0 0 0
8 0 0 0
9 0 0 0
10 0 0 0
11 0 0 0
12 0 0 0
13 0 0 0
14 0 0 0
15 0 0 0
16 0 0 0
17 0 0 0
18 0 0 0
19 0 0 0
20 0 0 0
21 7 4 3
22 8 4 4
23 0 0 0
24 0 0 0
25 0 0 0
26 0 0 0
27 0 0 0
28 0 0 0
29 0 0 0
30 0 0 0
31 0 0 0
__________________________________________________________________
MONTHLY MEAN : 0.5 0.3 0.2
COOPERATING STATIONS : 65 59 59
PILOT STATION : Specola Solare Ticinese, Locarno
__________________________________________________________________
Reproduction permitted if source mentionned
R. Van der Linden
avenue Circulaire, 3 B-1180 BRUXELLES – BELGIUM
I’m signed up to get email alerts from the SIDC, and that’s where I got the above table of monthly sunspot numbers, issued at 9:45 UTC.
Here’s the web link to the same data
http://sidc.oma.be/products/ri_hemispheric/
I am interested to see how this will affect the winter. If we see a continued significant cooling the AGW movment will remain unaffected even if it becomes severe. It would force the addition of another layer of calculation to the models which would still have the magic layer about CO2 putting more moisture in the atpmosphere. We’ll be in the next ice age before they consider that the models might be wrong.
For those of us who recognize that trashing our economy is a greater problem than 1 degree C mother nature may be throwing us a nice juicy bone. Once again we would show that the weatherman ain’t always right.
noconsensus.wordpress.com
Robert Wood (18:44:00) :
BC, the main problem your ski resort will face in Florida isn’t lack of snow; it’s lack of mountains, hills, or even bumpy bits. You really ought to consult a reality expert. 🙂
Reality is that you don’t need a hill, just a change of elevation.
Think sinkhole.
Speaking of 1913….
This graph of geomagnetic aa index shows the average of 2006-2007 to be the calmest since 1913-1914.
http://www.ngdc.noaa.gov/stp/GEOMAG/image/aastar07.jpg
The two Russian solar physicists who bet James Annan in 2005 $10,000 that the earth would be cooler, not warmer, over the following ten years are looking good.
AUGUST 2008
PROVISIONAL INTERNATIONAL NORMALIZED HEMISPHERIC SUNSPOT NUMBERS
Date Ri Rn Rs
__________________________________________________________________
1 0 0 0
2 0 0 0
3 0 0 0
4 0 0 0
5 0 0 0
6 0 0 0
7 0 0 0
8 0 0 0
9 0 0 0
10 0 0 0
11 0 0 0
12 0 0 0
13 0 0 0
14 0 0 0
15 0 0 0
16 0 0 0
17 0 0 0
18 0 0 0
19 0 0 0
20 0 0 0
21 7 4 3
22 8 4 4
23 0 0 0
24 0 0 0
25 0 0 0
26 0 0 0
27 0 0 0
28 0 0 0
29 0 0 0
30 0 0 0
31 0 0 0
__________________________________________________________________
MONTHLY MEAN : 0.5 0.3 0.2
REPLY: So What gives Leif….? You yourself said these sunspecks weren’t given a number. I trusted your assessment. Hence this article. Given the Brussels folks decided to change their minds later, what is the rationale ? – Anthony
Fatbigot – enjoy. Hope it is Dilmah tea you have carried over there 😉
To all our American friends – have a good one.
Kim Mackey (00:18:23) :
My question is, if cycle 24 is, as you think, a low activity cycle, will this completely negate the validity of the Dikpati dynamo model, or can it be tweaked somehow?
Dikpati’s model is what is technically called a ‘flux transport’ model. That is, the magnetic field is moving with the plasma flow and then goes where the plasma is going with the speed the plasma is going.
Other dynamo models are ‘diffusion’ models, where the magnetic field only partly follows the flow and it allowed to ‘diffuse’ across the flow and thus can move faster to depth than the flow.
Yet others are ‘shallow’ dynamos where the amplification takes place much nearer the surface.
Flux transport models tend to have a long ‘internal memory’ [i.e. integrates over several cycles] because the conveyor belt moves to slowly. The two other classes of models tend to have a short internal memory [half a cycle].
I once asked Mausumi Dikpati your question and she said [and I would concur] that a small cycle 24 really would be a death knell to the flux transport models. So, they cannot be tweaked. But there are lots of other models, some of which do predict a low cycle, so we are not back to the drawing board.
Leif Svalgaard (06:33:05) :
AUGUST 2008
MONTHLY MEAN : 0.5 0.3 0.2
REPLY: So What gives Leif….? You yourself said these sunspecks weren’t given a number. I trusted your assessment. Hence this article. Given the Brussels folks decided to change their minds later, what is the rationale ? – Anthony
The active region numbering is done by NOAA, not by Brussels. The Brussels folks occasionally disagree. In this case, they did. Rudolf Wolf would not have counted this spot. Nor would I. What puzzles me is this:
21 7 4 3
22 8 4 4
The 3rd column are ‘spots’ in the Northern hemisphere, and the 4th column are ‘spots’ in the Southern hemisphere [both weighted with the ‘k’-factor: SSN = k(10g+s)]. But there weren’t any in the south. The Catania spot was at 15 degrees north latitude, IIRC. Maybe the last word is not in on this.
Julie, I agree with you that it is a huge mistake to turn a scientific issue into a political war, and I also wish we could get far, far away from that. However, we have to be honest and admit exactly why that has happened. This theme, and I have a link to a transcript to prove this, is being pushed every day by leading democrats, and it is a conscious political decision by them to make this one of their campaign issues.
So – tragically, mistakenly, foolishly – the democrats this year have decided to lash themselves to this issue. There was no good reason for them to have made this mistake – but they have, and that is the group you need to address if this situation is ever going to change.
http://liberalvaluesblog.com/?p=4132
from the interview, John Kerry, this weekend: “With the choice of Governor Palin, it’s now the third term of Bush-Cheney, because what he’s done is he’s chosen somebody who actually doesn’t believe that climate change is manmade.”
Sorry to get in so late, I just fled Houston because of the AGW-induced hurricane coming. I’m up in Iowa to avoid the flooding.
evanjones (19:21:28) :
After all, when the carny sold you snake oil, you actually got the snake oil.
David Corcoran (21:23:24) :
Amazingly apt criticism.
Amazingly asp criticism.
John Riddell (22:58:33) :
Can someone please explain (in simple words that even I can understand) why the TSI varies only by very small amounts (did I read 0.2%) while . . .
The TSI seems to be a mechanism the AGW believers use to make it seem as if solar variation cannot be responsible for climate change.
Just a back of the envelope calculation –
Since the earth would be about as cold as the PLANET Pluto without the sun, I’d guess we owe around 250 K to TSI.
0.2% of that would be 0.5 degrees K, which is a big variation if you look on the temperature charts used in the AGW debate.
Got in so late my comment showed up on the next entry. Sorry, the previous belongs on the Spotless month entry.
julie (18:12:04) :
I’ve taken to editing some of the text I quote to fix typos and occasionally change Algore to Al Gore. I haven’t quite figured out if I should flag them with [brackets] or otherwise call attention to them, or if I’d be better off just ignoring posters who call people names.
Though, I confess I do like the suggestion of the Gore Minimum. Easier to explain than the Eddy Minimum which is more deserving.
“…REPLY: So What gives Leif….? You yourself said these sunspecks weren’t given a number. I trusted your assessment. Hence this article. Given the Brussels folks decided to change their minds later, what is the rationale ? – Anthony”
I am very interested to find this out as well.
I get the daily reports from the SIDC.
Every single one of them for the month of August said “today’s estimated ISN [International Sunspot Number]: 000 ”
Here’s the message from the morning of 21 August
Issued: 2008 Aug 21 1224 UTC
:Product: documentation at http://www.sidc.be/products/xut
#——————————————————————–#
# GEOALERT message from the SIDC (RWC-Belgium) #
#——————————————————————–#
GEOALERT BRU234
UGEOA 30512 80821 1218/ 9930/
10212 20212 30212
99999
PLAIN
NOTE: the above forecasts are valid from 1230UT, 21 Aug 2008 until 23 Aug 2008
PREDICTIONS FOR 21 Aug 2008 10CM FLUX: 066 / AP: 003
PREDICTIONS FOR 22 Aug 2008 10CM FLUX: 067 / AP: 002
PREDICTIONS FOR 23 Aug 2008 10CM FLUX: 066 / AP: 002
COMMENT: The only sunspot group on the solar disk (Catania number 84,
no NOAA number yet) is small and weak, so it is unlikely to produce a
C-flare. The Earth is currently inside the slow (around 400 km/s) solar
wind flow with average (around 4 nT) magnitude of the interplanetary
magnetic field. We expect quiet geomagnetic conditions.
TODAY’S ESTIMATED ISN : 000, BASED ON 10 STATIONS.
I have just sent an email to the Director of SIDC, Ronald Vanderlinden, asking for clarification:
21 7 4 3
22 8 4 4
Ronald, we are puzzled why SIDC reports spots in the southern
hemisphere in August. The spot reported by Catania was in the north.
Why is Rs not zero?
And Anthony, NOAA did not flip.
REPLY: OK then I’m at a loss to understand the chain of spot counting…are you saying NOAA always counted this?
Amongst several other locations worldwide, the observer at the Mt. Wilson Observatory (University of California, Los Angeles) takes daily observations of the sun, and produces a drawing of any sunspots seen.
http://www.astro.ucla.edu/~obs/cur_drw.html
When they did their observation yesterday, August 31, at 14:30 UTC, they printed a big “No Spots Seen Today,” followed by the date and time, the “seeing conditions” (4 on a scale of 5 yesterday – very good), the name of the observer, and then a remark at the bottom of the observation:
“43 days without sunspots”
To my knowledge, only the observer at Catania, Italy recorded a spot.
Would SIDC count an official sunspot, based on an observation from only one station?
.. Why did it take them a month to figure out if the spec should be considdered a sunspot?
Well, heres some free speculation as to why:
In march, sunspots of cycle 24 (the last we have seen) was so small that it got some attention that they where caled sunspots… but.. It kept cycle 24 “alive” officially.
Now.. in August 2008 the little speck happened to belong to cyclw 23. Damn.
And no official sunspot number came out.
The thing is:
By officially recognicing the speck in august as a sunspot, it will further press away any official minimum, because the minimum is when there are more cycle 24 sunspots than cycle 23.
And now, a little late, after Watts up article about sunspot free month, they decided to officially have another cycle 23 sunspot. Damn. Plague or Cholera?
SORRY: A week! Not a month!
These miserable idiots at NOAA are doing this for one reason only- for propaganda. They just don’t want and will not allow the skeptics to have any ammunition. This is a case of science corrupted by politics. I’d like to maroon these fools on an iceberg.
REPLY: let’s wait and see what the explanation is before we hurl invective please. – Anthony
Anthony, change the title of the post. NOAA did not flip.
REPLY: Please elaborate. I’ve chnaged the title to be more generic.
The numbering of last month’s speck a week after the fact gives the appearance of the politicization of science.
I hope that Leif is correct that this story is not over yet.
Meanwhile, the sun knows nothing of our numbering controversy on Earth and remains in a deep minimum. A bogusly numbered spot will not reduce the number of Svensmark clouds one whit.
Leif, the last word *is* in; this is not a science based flip flop and anyone who says it is, is suspect, as far as I see it. The emperor has no clothes.
I didn’t flee Houston during category 5 Gilbert in 1988. It missed Houston and we had a lovely day.
20 years later Gustav made landfall as a category 2. More proof that hurricanes are getting stronger due to AGW? The last category 5 to make landfall in the US was in 1992.
Wait, what?
Anthony, did _NOAA_ change their mind as well?!
I thought it was just Brussels that decided to count it, and NOAA maintained their numbers at zero.
Who’s counting what (and why)?!
Folks, take a breath. Scientists have changed data taken in the past since scientific inquiry began. Most often it is done for accuracy’s sake. I don’t see propaganda in action here. Maybe someone was sick that day and just hadn’t gotten around to assigning a number. Maybe they have a desk piled high with work. Maybe somebody came up with a more lucid argument to number it anyway. I am not losing sleep over a single sunspot from cycle 23. Besides, I am more interested in what other aspects of the Sun affect my cold hands, butt, and feet than breaking a record of one month.
This wouldn’t be the first time an ‘adjustment’ was made to get the desired results. And probably not the last.
Why should he change the title of this post, Leif? I say no, no, no!
This is a clear case of politics and nothing you can say will change that. Anthony, stick to your guns. We all saw how this came down in real time.
REPLY: The possibility exists for human error, particularly since Catania reporting stations data is in question. I’m not the expert on sunspot counting process, Leif is, so I’ll defer to him. There’s plenty of time to throw flame later if indeed this is a decision rather than error.
David Gladstone (07:40:51) :
“These miserable idiots at NOAA are doing this for one reason only- for propaganda. They just don’t want and will not allow the skeptics to have any ammunition. This is a case of science corrupted by politics. I’d like to maroon these fools on an iceberg.”
Well, I’ve worked with one of the space weather forecasters, and I can vouch for him as a damn good guy. The forecasters interact directly with the customers, and that’s their focus – getting the best possible information to the customer.
Of course, if management is “influencing” the official count in a way that is contrary to standard practice and their official policy, that should be a national scandal with congressional investigations.
I still don’t know why NOAA 1) didn’t count it, and 2) didn’t say a WORD about it (as Brussels DID), when some of their daily products include a “comments” section.
I would like to know NOAA/SWPC official policy on spots that are clearly there, but are considered “too small” or otherwise “uncountable,” even if the policy is just, “ignore it, it’ll be gone soon anyway.”
As Stalin said, it’s not the people who cast the votes who count, it’s the people who count the votes. Stalin was the supreme brutal realist and he was right.
I’m sorry you caved on this, Anthony. This is a clear case of political influence and Leif is dead wrong. He should be held to a higher standard of proof than what he’s offered here.
REPLY: This may yet change. For now I’m being cautious until I get a clear explanation. Yes it smells, but at the same time I’ll wait to hear what the explanation is. I’m as upset about it as you are, but I’d rather cave to caution than to emotion.
“Besides, I am more interested in what other aspects of the Sun affect my cold hands, [user-snip], and feet than breaking a record of one month.” Pamela the Read
Too warm here in Tucson.
Weather tis nobler and not.
Some like it cold.
Some like it hot.
I love how Kerry and the democrats seems to make the assertion that Palin’s position on AGW is a negative in this campaign.
It amazes me how a vocal 10% of the US population has the Government firmly believing that 100% of us think it is a problem.
The August sun-blemishes should not have been counted but I think that it was a better safe to count them then get blamed for not counting them later. I think the 29 other ZERO days speak loudly to the issue.
To turn a phrase used in AGW camps a lot, “a single instance does not negate a trend” The trend clearly is lower activity and a spot free calendar month is really a psychological milestone. Keep watching, you are going to get another chance at it.
John-X, I don’t care if someone’s a good guy- nothing could be more irrelevant! That’s just a waste of words, imo. This is not about persons or friends; this is about scientific truth and politics. I want to see how these weasels try to to sell this as honest science. It just won’t fly with me. I’ve already sent out the original article and will continue to do so no matter what anyone says. This is a war of words and science isn’t in the room.
Reply: There’s a Daily tech article on it that’s made Drudge,
http://www.dailytech.com/Sun+Makes+History+First+Spotless+Month+in+a+Century/article12823.htm
so NOAA and SIDC will be in full public glare on this one. – Anthony
David G. Mills (20:07:54) : But if you want to abuse the water carrier, it is your prerogative. I still like Al Gore though I now think that solar activity is the most likely cause of the warming of the 1900’s. I don’t think its Al’s fault that he trusted the wrong scientists or accepted the scientific “consensus.”
You only need to look at Al’s record to know differently.
Al has vacillated from statements to the effect that every American has the right to cheap gasoline (it’s in one of his books and I’m too lazy to look up which) to his current stance.
Al has claimed to be American technology’s biggest boon (invented the Internet donchya know) yet was almost solely responsible for the Triana spacecraft (aka GoreSat in some circles now known as DSCOVR). The only spacecraft conceived without a mission — in a Lagrangian orbit no less. Al’s idea essentially: we should have a camera in orbit constantly looking at the Earth. You should have seen the scrambling to find things for it to do. The final mission instrument complement was all after the fact add-on. When it comes to technology I think Al is clueless.
What misleads Al isn’t the “consensus” so much as belief in his own ability to forecast the direction of the wind.
Disclosure: I worked on Triana.
NOAA and SIDC are independent of each other. Nobody is influencing anybody else. NOAA did not count the region, following their rules. SIDC did count, following their rules. So far, so good. They can disagree a little without any problems. I am puzzled why SIDC reports a spot in the southern hemisphere, when the Tiny Tim was in the North. I have asked SIDC and we shall see. No need to dream up any conspiracy theories.
“but I’d rather cave to caution than to emotion.”
One reason we love this site.
Here is the answer form SIDC:
Dear Leif,
We’ve already discussed this before. The separation of the one spot over the two hemispheres is due to the fact that some observers do send us wrong locations. We do not just use Catania for that. Purely based on statistics, it is impossible to decide who is right and who is wrong, so for an automated procedure it is difficult to handle. Nevertheless, it is obvious a wrong result, and will be correctly manually when we provide the definitive numbers. We could do the same thing for the provisional numbers already, but we prefer not to interfere manually at that time.
Kind regards
Ronald
Leif and I have had long arguments about basic science by email and I shared his replies with several physicists who could clearly perceive the gaps in his knowledge of Einstein’s gravity theory *and* his sense of absolute certainty in what he doesn’t know. Like all too many other specialists, he doesn’t see the forest for the trees. I give no one a free pass, but indeed, we will see how this plays out in the coming days.
Actually this issue points up the need for a revamping of science education in this country. When an eminent physicist like Lee Smolin has to write a book called ‘The Trouble with Physics’ and attack the rot and political and money corruption at the foundations of science, we know there’s trouble in River City.
“Spotless month” is just a headline. The fact is that there are hardly any, and it’s been that way for ages. Even if someone _did_ sneak in and write a few 2’s and 3’s where there used to be 0’s, that doesn’t change the big picture. It’s a second-order effect, and not worth worrying about.
And NOAA did not “count the sunspeck after all” as the title of this thread suggests.
REPLY: Leif, there is a lot of confusion on this, then WHO did count the sunspot? SIDC? NOAA?
Who made the decision to count it? Initially I thought is was SIDC, but then in your earlier comments you said “NOAA is responsible for numbering the active regions”.
So where does the decision get made, and who makes it? Is it an individual or by committee, or by procedural analysis of data?
UPDATE: I see you answered in a previous comment, so please ignore the question, comments passed in the ether.
One of the problems is that SOHO was down during this period so it is a little difficult to double-check.
There is 1 image from August 21, 2008 which does show a few small spots (although these are sometimes instrument artifacts and you need to animate over multiple images to see if the spots rotate with the Sun. Instrument artifacts stay in one place. Unfortunately with no other images around the time, one cannot use this test.)
http://sohowww.nascom.nasa.gov/data/realtime/javagif/gifs_small/20080821_0102_mdi_igr.gif
Although June 1913 is officially said to have had no sunspots, Stefko in Moscow reported sunspots on June 3 and 4th. None of the other 20 observers reported any sunspots in June 1913.
The reports of sunspots by Stefko can be found in volume 11, page 109 of Astronomische Mittheilungen, written by A. Wolfer.
Back to the Future
Back to the Future II
Back to the Future III
Folks, I have sent this to SIDC:
Ronald,
It is disturbing that these things happen. Rudolf Wolf’s procedure of ranking the observers in order of trustworthiness and have a very good ‘primary’ observer and only fill in from other observers when there were missing data was a good one.
Clearly some manual quality control is needed in real time. You can expect a fair amount of heat on this, so it will be good to be proactive.
Folks,
let’s pace down littla bitta. I aggree with Pamela.
As lot of us think, there possibly will come quite a bunch of another spotless days, possible even spotless months.
And if not? We can allways return to the drawing board.
I don’t understand where the attribution to NOAA comes from. One source I routinely follow for sunspot data is
http://www.dxlc.com/solar/
As I understand it, this site relies on NOAA, not SIDC, but proffers the following caveat:
“Unofficial, accumulated value based on the Boulder (NOAA/SWPC) sunspot number. The official international sunspot number is typically 30-50% lower.”
This is clearly not the case here, because NOAA/SWPC has recorded no sunspot since 7-20. The daily data is available here
http://www.swpc.noaa.gov/ftpdir/indices/dayind/
and it supports the DXLC graph showing no sunspots since 7-20.
So it seems to me that the NOAA/SWPC data still support the claim of a spotless August. It is just SIDC that has counted something.
Since SIDC “is typically 30-50% lower” than the NOAA number, maybe they left off a negative sign? 🙂
David Gladstone (08:12:48) : John-X, I don’t care if someone’s a good guy- nothing could be more irrelevant! That’s just a waste of words, imo. This is not about persons or friends; this is about scientific truth and politics.
Well, part of being a “good guy” is being honest. Would that count? And as far as whether we had a month with NO sunspots vs. a FEW does it really matter? Exactly how much has this degraded the skeptics point?
If you ask me, Joe D’Aleo’s point about other “months” being spot free is far more damaging to the Daily Tech headline of “First Spotless Month in a Century” than a “flip-flop” on last month’s count. It’s a lot like counting blue moons — an accident of the calender.
Is Pluto a planet? Does it really matter if it’s called one or not? Why would anyone care anyway? Is the “flip-flop” on Pluto’s status indicative of conspiracy? How is it any different than the sun sot thing?
I think seeing conspiracy in some wavering over whether or not a particular solar feature should be called a sunspot is just being a bit knee-jerk. Maybe you’re right but I still don’t see any real gain one way or the other.
I think they simply wanted a SC24 spot to count this way the ‘solar cycle progressing normally’ crowd can sleep easy for the next couple of weeks.
Funny how similar specks weren’t counted earlier in the year but now, suddenly, they are.
I guess the next step is making a definition for what consists of a sunspot. The same way they designated Pluto a ‘dwarf planet’ because ‘planet’ had not been defined since the ancient Greeks.
My opinion, if the spot is small enough that one needs specialized equipment to see it, as opposed to the method used to count spots ‘back in the day’, then it shouldn’t be counted. The same spot wouldn’t have been counted back in the 1700’s and 1800’s and we’re still adding on to the same data set. If they want to start counting every little speck on the sun, then make a new data set.
Even if the official count for August is 1 sunspot, well, no BFD. It’s still getting colder and we could be in for a long chill. I’d rather see more sunspots and a return of a cool climate via the PDO and AMO turning negative. At least it won’t be a repeat of the Maunder or Dalton Minima. A lot of people will die if those Minima events reappear.
Basil (09:10:03) :
So it seems to me that the NOAA/SWPC data still support the claim of a spotless August. It is just SIDC that has counted something.
There was a tiny ‘spot’ on August 21-22. Or, more accurately, what is called a ‘pore’. The difference is whether there is a well-defined penumbra surrounding the dark central part, the umbra. The pore was observed by Bill Livingston [as I have reported in this blog] and he even measured its magnetic field and temperature [and found the pore to be just on his projected trend for disappearance of spots by 2015]. The issue is whether to count the pore and here NOAA and SIDC seem to differ. A side-issue is why SIDC reported the pore to be present in both hemispheres at the same time. This is clearly wrong as they have admitted. A procedural question is why they chose not to check into this “at that [sic] time”.
Those Italians must have one serious observatory to count that sunspeck, according to SOHO (NASA) the sun appeared ‘blank’.
DAV (08:18:52) :
“…Disclosure: I worked on Triana.”
Am I correct that Triana, DSCOVR or GoreSat was never launched, that we paid $100M for it, and that we’re paying $1M per year to keep it in storage?
If so, I say, launch the damn thing. I for one think that continuous weather satellite images from the L1 perspective would be useful.
Douglas Hoyt (08:52:03) :
Although June 1913 is officially said to have had no sunspots, Stefko in Moscow reported sunspots on June 3 and 4th. None of the other 20 observers reported any sunspots in June 1913.
The policy in Zurich was to have a ‘primary’ observer [usually the Zurich observer – maybe always], and to report his count for the day, unless the weather or other things prevented observations. In such cases, a ‘secondary’ observer’s count would be used, or if that was unavailable, a ‘tertiary’ observer, etc. They did not tote up all observers and report the average as is done now. One can argue which is best, but when you change method like this you screw up the statistics and the homogeneity of the series.
Isn’t it likely that this short duration speck wouldn’t have been noticed in 1913? Are we really comparing apples to apples when we compare these old observations with modern ones made with the latest technology and vastly more eyes on the sun?
Nathan Stone (09:47:34) :
Isn’t it likely that this short duration speck wouldn’t have been noticed in 1913? Are we really comparing apples to apples when we compare these old observations with modern ones made with the latest technology and vastly more eyes on the sun?
There are indications that the modern counts are too high with possible repercussions for reconstructions of TSI and the climate debate.
Tad off topic, but the ASU temps look like this August is going to come in about .31 F cooler than last August.
Come one guys, chill out (yeah, just like the climate). Whether or not different organizations assign a zero the August ISN is not going to influence the climate over the next decade one whit. If climate models come up with significantly different forecasts based on the length of spotless days, then those models need to be taken back to the drawing board.
Does this change how interesting the current solar activity is? No.
Does this change expectations for cycle 24? No.
Could there have been a countable sunspot that was missed because it lived its life on the far side of the Sun? Yes.
Does this change the Guiness Book of Climate Records? Well, if there was such a book, it might – the record isn’t settled yet (thank you Leif for taking this on), but scientifically a record is just a curiosity. It is significant for political and propaganda purposes, but fudging temperature records is so much more effective. No one here was planning to use a spotless August for propaganda purposes, right?
What’s the the ISN for September going to be? Well, so far, it might be 0.
There really is a lot more to life than counting sunspecks. Or so I thought. I’ve been wrong before.
Lots of interesting information here–thanks for all the hard work. A very good read.
(08:36:20) :
REPLY: Leif, there is a lot of confusion on this, then WHO did count the sunspot? SIDC? NOAA?
Who made the decision to count it? Initially I thought is was SIDC, but then in your earlier comments you said “NOAA is responsible for numbering the active regions”.
So where does the decision get made, and who makes it? Is it an individual or by committee, or by procedural analysis of data?
NOAA and SIDC are independent and make their own decisions regardless of the other. NOAA numbers the ‘active region’ if [according to their – very specific rules] it qualifies to be considered as such. As far as I know, this decision is made by a person – not always the same one, but the rules are clear, so different person would make the same decision. SIDC does not number regions but adds up counts from a large number {~60] observers to form an average. This is done by an automated procedure and is [it seems] not checked manually. I have suggested to them to make a real-time manual check, but I don’t think it will have any effect. You know, a knee-jerk reaction to suggestions like this is to hunker down, batten the hatches, and do nothing, waiting for the storm to blow over. If this blog can help change this that would be great.
John-X (09:44:19) : Am I correct that Triana, DSCOVR or GoreSat was never launched, that we paid $100M for it, and that we’re paying $1M per year to keep it in storage? If so, I say, launch the damn thing. I for one think that continuous weather satellite images from the L1 perspective would be useful.
Yep. Launching is not my decision, though. I’m all for it. Certainly hate to see what I’ve worked on lying around in mothballs. Just as I hated when HST (which I also worked on) sat in storage for all that time. Maybe it will be launched eventually just as HST.
But there are several factors keeping it on the ground; not the least of which is its political football status. Budget is becoming a real issue at NASA, especially for unmanned near-Earth projects. To put it in operation could cost well over 10x the annual storage cost. To give an example, HST’s monthly budget is around $25M per month albeit it is a much larger project being likely the penultimate Large Telescope. The “honor” for last is currently being held by another project I worked on, Spitzer. Sad to think that Spitzer’s namesake is on the last of his concept, though.
Can people (Leif, that means you) handle a technical question today or is today reserved for ranting?
What puzzles me is how an equation like k(10g+s) can yield 4. Leif, can you explain that a bit better?
If there was one countable sunspeck in the northern hemisphere, that would be 1 group(g) and 1 speck/spot(s) and hence k would be 11. Are the 3s and 4s due to averaging observations from the multiple observers? And are there three observers?
I understand the southern hemisphere data is counted as a typo, so I’m happily ignoring that.
Hey, doesn’t this set a new record for the most excitement over a single digit number? Oops, ranting again.
Leif,
I’m aware of the sun speck/tiny tim sunspot that appeared briefly in August. My point was that NOAA didn’t count it, but SIDC did. So that leads to two things (well more, but two that I’m writing about). First, on NOAA’s count the claim that August was “spotless” still holds, and second, given this, why is the contrary claim being attributed to NOAA? It seems that NOAA and SIDC are at odds on whether or not the August sun speck should have been counted. As you’ve said, NOAA hasn’t flipped, and by reckoning shouldn’t have figured in the update to the original post at all.
As others have said, it really doesn’t change anything. Whatever happened in August happened, and we’re still looking at an unusually quiet minimum, with whatever that portends for the future. That’s my claim (“unusually quiet minimum”), based on a comparison to the last few cycles. I know you disagree.
Basil
“If so, I say, launch the damn thing. I for one think that continuous weather satellite images from the L1 perspective would be useful.” John-X
Yes, it has a radiometer on it so maybe it could measure the energy reflected/radiated away from earth so we determine the long term heating trend on earth. Le Mr. Al G. get the credit for putting the global warming debate to bed.
Spotless, but not speckless.
I agree with Ric, the sun is awfully darn quiet. Squibble all you want over a few specks. It’s nonsense.
Leif Svalgaard (09:35:22) :
“A side-issue is why SIDC reported the pore to be present in both hemispheres at the same time. This is clearly wrong as they have admitted. A procedural question is why they chose not to check into this “at that [sic] time”.”
And that in every one of their daily reports for August, they listed the ISN as “000,” then in their monthly report, listed the ISN (Ri) as 7 and 8 for 21 and 22 August respectively.
They MENTIONED the speck in the dailies, NOTED it had a Catania Number (84) but no NOAA number, but offered no commentary on why it would or would not be included in any count.
I had assumed, right up until I got the email of the monthly report first thing this morning, that the SIDC count was going to be zero for the entire month, and likewise with NOAA, which AVOIDED any mention of the speck.
In fact, in NOAA/SWPC’s daily “Analysis of Solar Active Regions and Activity,” issued at 22:00 UTC daily, there is a comment on spotless days, such as this one from yesterday’s report:
“Analysis of Solar Active Regions and Activity from 30/2100Z
to 31/2100Z: Solar activity was very low. The visible solar disk
remained spotless.”
http://www.swpc.noaa.gov/forecast.html
On the days when the speck or pore was present, the “visible disk” comment was simply omitted without explanation.
Opps,
Seeing Anthony’s latest update, I can see where a claim of implicating NOAA in this comes from.
But as I and others have posted, and which anyone can check by looking here:
http://www.swpc.noaa.gov/ftpdir/indices/dayind/
the raw data shows no sunspots since 7-20.
So Leif, do you know where the “0.5” came from in the NOAA report? Are they just reporting the SIDC number, and ignoring their own data?
REPLY: Somebody please save those offline before they change, I don’t want to be the only source if they do. – Anthony
Now here’s an interesting summary of current climate drivers:
http://www.onlineopinion.com.au/view.asp?article=7824&page=0
Hat tip J Marohasy
Let’s see what comes out of NOAA/SWPC in the next few days when they post their report for August. What SIDC has put out sounds like a preliminary report. I expect the lines between NOAA & SIDC will be buzzing while they debate the merits of that little speck. If the prediction of no spots by 2015 holds then all this fuss over one speck will pale. But watching scientist argue over this is most fascinating.
Many solar scientists are present.
An ignorant question.
The Sun ejects particles, positive and negative, right.
After 4 billion years.
The Sun is positive or negative?
Sorry … a link please
Basil (10:30:12) :
So Leif, do you know where the “0.5″ came from in the NOAA report? Are they just reporting the SIDC number, and ignoring their own data?
The sunspot number at http://www.swpc.noaa.gov/SolarCycle/ is [as it should be] the official SIDC number.
Leon Brozyna (10:36:23) :
I expect the lines between NOAA & SIDC will be buzzing while they debate the merits of that little speck
I don’t think so. Their rules were laid down long ago and they don’t care for such discussions. It will be interesting to see if SIDC even fixes their “obvious” error. I’ll not bet on it.
Duane & Lucy: Eight or nine months ago, I too believed in AGW. What changed my mind was reading about sunspots and the Maunder Minimum. Suddenly, there appeared to be an equally good scientific explanation for the global warming of last century. But the vast majority of the population has not heard of it. Most of the people who are messengers for the anti-AGW crowd never mention it either. Governor Palin hasn’t said a thing about it yet. Then we have thoughtful people like Lief who is unconvinced by it.
I am a progressive; not a liberal. Progressives are much more akin to Libertarians on issues like foreign policy, monetary policy and matters of science than they are like liberals. So it surprises me not one iota that Gore and Kerry are still saying the things they say.
But politicians, all politicians, have much the same dilemma as lawyers (my profession) when it comes to matters of science. We do not have the luxury of waiting a hundred years till science resolves an issue. We have to go with the best information at the time or the consensus at the time. Last time I checked, AGW is is still the consensus. And the media is doing nothing to promote solar activity as the cause of global increases in temperature. When the media begins reporting it, I think many liberals will change their tune. After all, global cooling could be more catastrophic than global warming.
And whether its global warming or global cooling, we are going to get taxed to prevent it. That is the New World Order. Better get used to it.
From the SWPC website http://www.swpc.noaa.gov/ftpdir/weekly/README3
“TERMS AND DEFINITIONS:
The official International Sunspot Number (RI) is issued by the Sunspot
Index Data Center (SIDC) in Brussels. Data and plots are available from
the SIDC web site at
http://sidc.oma.be
The Space Weather Prediction Center (SWPC) issues a preliminary sunspot number.
At http://www.swpc.noaa.gov/ftpmenu/indices.html see
Daily Solar Data — last 30 days
Daily Solar Data — current quarter”
This sounds as though NOAA (“preliminary”) defers to Brussels (“official”).
From the same page:
“UPDATE SCHEDULE:
The Solar Cycle products are updated once a month and are
put on-line the first Tuesday after the new values are available.
The latest values are usually available on the 3rd of every month.”
So their graphs of the Solar Cycle progression should be updated tomorrow, with the values by Wednesday.
“Here is the NOAA data: ftp://ftp.ngdc.noaa.gov/STP/SOLAR_DATA/SUNSPOT_NUMBERS/MONTHLY”
I still only see data through July on this table. Are you getting August data Anthony?
REPLY: You are correct, July is showing 0.5 not August
Julie,
“I’m one of them who was convinced (converted??) by what I read here – and I tell whoever will listen about this site.”
Just go all the way and vote McCain/Palin in November.
🙂
Really the Republican party has become a well of far more diverse ideas than the Democrat party. Look at what the Dems did to Lieberman when he disagreed with the dem-majority on ONE issue. (the war.)
I think after you see what your party and so called “liberals” smear Palin with in the next two months you’ll see what Hypocrites the party majority has become.
Fernando Mafili (10:38:15) :
The Sun is positive or negative?
The Sun puts out equal amounts of both charges and so stays neutral. You can see this by imagining what would happen if some extra negative charge were to move away from the Sun against gravity. Since the electric force is 1000,000,000,000,000,000,000,000,000,000,000,000,000 times stronger than gravity, the extra negative charge [electrons] would immediately pull up an equivalent positive charge to match, so there is no net charge.
DAV- words do make a difference. It does matter. Pluto is a planet despite what planet despite what TV faux physicist Tyson says. It does make a difference if something is or isn’t true. Your approach is sloppy, imho. Mine may be knee-jerk, but I’ve got a lot of fast twitching muscles and I use ’em to think and respond fast. Our sciences are in a mess because there’s no way to falsify anything anymore, just like string theory which sucks up all the funding, and no matter that observation and experiment shows that it is not only unimportant, but not true!. A real scientist tries harder than anyone to falsify his own theories. This whole deal smells more than Caylee Anthony’s trunk and despite assurances that there was no influence, I say anyone who believes that can buy a bridge i have here!
mbuel (11:12:20) :
“Just go all the way and vote McCain/Palin in November.”
Going all the way would mean a write-in vote:
Palin/McCain
Doesn’t this present the dilemma — What would we have seen with the technology of 1913?
I’m voting for the girl.
Anthony, I know this has been a heck of a lot of frustration and hard work over one, apparently miscounted, spot.
I want to thank you, and salute you once again for doing it with excellence, maintaining your high standards of decorum, and probably generating more worldwide interest in this than would otherwise be possible.
Cheers,
J-X
Got ’em.
Second column is the sunspot count.
d> grep -A 1 Number 08*dayind.txt | grep 999
0801dayind.txt- 0 66 67 A0.0 -999
0802dayind.txt- 0 66 67 A0.0 -999
0803dayind.txt- 0 66 67 A0.0 -999
0804dayind.txt- 0 66 67 A0.0 -999
0805dayind.txt- 0 67 67 -1.0 -999
0806dayind.txt- 0 67 67 -1.0 -999
0807dayind.txt- 0 66 67 -1.0 -999
0808dayind.txt- 0 66 67 -1.0 -999
0809dayind.txt- 0 -1 -1 -1.0 -999
0810dayind.txt- 0 -1 -1 -1.0 -999
0811dayind.txt- 0 -1 -1 -1.0 -999
0812dayind.txt- 0 -1 -1 -1.0 -999
0813dayind.txt- 0 -1 -1 -1.0 -999
0814dayind.txt- 0 66 66 A0.0 -999
0815dayind.txt- 0 -1 -1 -1.0 -999
0817dayind.txt- 0 -1 -1 -1.0 -999
0818dayind.txt- 0 -1 -1 -1.0 -999
0819dayind.txt- 0 -1 -1 -1.0 -999
0820dayind.txt- 0 -1 -1 -1.0 -999
0821dayind.txt- 0 -1 -1 -1.0 -999
0822dayind.txt- 0 -1 -1 -1.0 -999
0823dayind.txt- 0 -1 -1 -1.0 -999
0824dayind.txt- 0 -1 -1 -1.0 -999
0825dayind.txt- 0 -1 -1 -1.0 -999
0826dayind.txt- 0 -1 -1 -1.0 -999
0827dayind.txt- 0 -1 -1 -1.0 -999
0828dayind.txt- 0 -1 -1 -1.0 -999
0829dayind.txt- 0 -1 -1 -1.0 -999
0830dayind.txt- 0 -1 -1 -1.0 -999
0831dayind.txt- -1 -1 -1 -1.0 -999
The first part of 0831:
:Product: Daily Space Weather Indices dayind.txt
:Issued: 2008 Sep 01 1815 UT
# Prepared by the US Dept. of Commerce, NOAA, Space Weather Prediction Center
# Product description and SWPC contact on the Web
# http://www.swpc.noaa.gov/wwire.html
#
# Daily Space Weather Indices
#
#
:Solar_Indices: 2008 Aug 31
# SWO Sunspot Penticton Radio 90-day Radio GOES-10 X-ray Stanford Solar
# Number Flux 10.7cm Flux 10.7cm Bkgd Flux Mean Field
-1 -1 -1 -1.0 -999
So one file will need to be updated. Either that or we’re in the negative part of the projection range. 🙂
tarpon (11:31:12) :
Doesn’t this present the dilemma — What would we have seen with the technology of 1913?
It is not technology, it is procedure that is different. But, really, no spots or one tiny one doesn’t make any difference. The psychological impact of a spot-free month is undeniable, though. Physically, it doesn’t make much difference.
The reason that discussions about sunspots or other climate issues are important is that the AGW has been highly politicized from the U.N. through most world governments, exploited by politicians, and used by corporations ($$) so many times any weather event such as melting glaciers, endangered polar bears, melting of the Artic, or other notable weather artifact are used to convince the world that AGW is real. BTW consensus is not science but it is pervasive in the news media especially with respect to politics and science.
John-x Thanks
I’ve located the drawings from Catainia observatory that day
ftp://ftp.ct.astro.it/sundraw/OAC_D_20080821_063500.jpg
ftp://ftp.ct.astro.it/sundraw/OAC_D_20080822_055000.jpg
John-X (11:09:20) :
Hmm, I nearly posted July data myself. Where’s this summer going?
Non-zero June (from 16th) and July data:
0617dayind.txt- 11 66 70 A0.0 -999
0618dayind.txt- 11 65 70 A0.0 -999
0619dayind.txt- 11 65 70 A0.0 -999
0620dayind.txt- 11 65 70 A0.0 -999
0621dayind.txt- 11 65 70 A0.0 -999
0622dayind.txt- 11 65 70 A0.0 -999
0718dayind.txt- 11 65 66 A0.0 -999
0719dayind.txt- 12 66 67 A0.0 -999
0720dayind.txt- 11 66 67 A0.0 -999
0719’s 12 means 1 group of spots containing 2 spots.
My interpretation [as of now] is that the number that will go into the NOAA/NGDC (National Geophysical Data Center) database is the “official” number, and NOAA/NGDC [it seems to me] define that as the number from the SIDC in Brussels.
So unless SIDC revises their count (which Leif has already said he wouldn’t bet on), then both the SIDC and the NOAA/NGDC monthly number for August will be 0.5, same as July.
If anyone knows otherwise or has a different interpretation, please tell me.
REPLY: There’s a point to be made yet. NOAA is closed for the labor day holiday, they won’t check emails until tommorrow morning. Perhaps some well written emails to NOAA-NGDC would give them pause for revaluation?
Leif, do you have sugegsted contacts?
Seemed curious that NOAA didn’t number the spot. They’ve shown no problem doing that in the last few that have been there. Wonder if these specks are borderlining their rules and it becomes a judgment call for the person on duty. I’ve no problem with others numbering the spot. It was there. The southern hemisphere is definitely an “oops” that’ll be corrected, I’m sure. Personally, it’s no big deal, but shedding light on these procedures is a good thing.
One spot, half a spot whatever, don’t you think we have more eyes with better equipment looking at the sun today than in any other time in history?
So who’s to say 1913 spot count is to the same standards as today’s? Or how about 1750’s spot count or near lack of one? Maybe they missed a few?
Just a thought
wattsupwiththat (11:41:32) :
“I’ve located the drawings from Catainia observatory that day
ftp://ftp.ct.astro.it/sundraw/OAC_D_20080821_063500.jpg
ftp://ftp.ct.astro.it/sundraw/OAC_D_20080822_055000.jpg”
OUTSTANDING!
So where the heck did that “southern [solar] hemisphere” stuff come from?
These both say latitude 15N.
Did SIDC base their count ONLY on Catania, or were there other observers who reported the speck or pore?
REPLY: There’s a point to be made yet. NOAA is closed for the labor day holiday, they won’t check emails until tommorrow morning. Perhaps some well written emails to NOAA-NGDC would give them pause for revaluation?
I think NOAA’s call was correct. Those were pores, not spots. I’ll ask Bill Livingston what he thinks. NOAA is so bureaucratic that one has to through channels. Check the website.
[…] Story here. […]
David Gladstone (11:19:22) : DAV- words do make a difference. It does matter. Pluto is a planet despite what planet despite what TV faux physicist Tyson says. It does make a difference if something is or isn’t true. Your approach is sloppy, imho. Mine may be knee-jerk, but I’ve got a lot of fast twitching muscles and I use ‘em to think and respond fast. Our sciences are in a mess because there’s no way to falsify anything anymore
Then you think the definition is everything? I’m curious: what scientific theory has just becomes unfalsified by a small change in someone’s definition?
In re my approach being sloppy: How can something that doesn’t exist have an attribute? My opinion is that since we are discussing statistical events, it really matters little if there are 0, 3 or even 10 sunspots. It will hardly affect any correlation derived from the count. Besides, many of the things we call “sunspots” probably weren’t observable in the 18th century and the numbers we observe now are not the same as then. So effectively, definitions have changed.
In fact, they change frequently in other disciplines as well. Pluto is no longer classified as a planet according to the IAU. Bet you aren’t aware that the official atomic weight of oxygen was changed to be exactly 16 because it was more convenient? A bad day for scientific integrity, eh?
Frankly, I think this current foofarah over conspiracies is embarrassing to witness. I’m sure it will supply endless fodder for pogie look-at-the-silliness pointing.
John-X (10:59:14) :
“’UPDATE SCHEDULE:
The Solar Cycle products are updated once a month and are
put on-line the first Tuesday after the new values are available.
The latest values are usually available on the 3rd of every month.’
So their graphs of the Solar Cycle progression should be updated tomorrow, with the values by Wednesday.”
That might not happen. Today’s a holiday and I suspect the update might be delayed until Tuesday, next week. I remember that the posting for the June figures didn’t happen until 8 July. And whether they report a value of 0 or .5 for August is a minor matter. What I’m waiting to see happen is for Hathaway to pull his team together to revise their prediction on SC24.
DAV (12:43:16) :
I basically agree with you. But just for the record, it is 12C carbon that is defined as exactly 12. Oxygen is what it is:
http://physics.nist.gov/PhysRefData/Handbook/Tables/oxygentable1.htm
Leon Brozyna (12:48:50) :
“…whether they report a value of 0 or .5 for August is a minor matter. What I’m waiting to see happen is for Hathaway to pull his team together to revise their prediction on SC24.”
And that might not happen until Spring
http://www.swpc.noaa.gov/SolarCycle/SC24/index.html
“The Panel expects to update this prediction annually.”
and this was the latest update
“June 27, 2008 During the annual Space Weather Workshop held in Boulder, CO in May, 2008, the Solar Cycle 24 Prediction Panel released an update to the prediction for the next solar cycle. In short, the update is that the panel has not yet made any changes to the prediction issued in April, 2007…”
Leif Svalgaard (13:18:18) : I basically agree with you. But just for the record, it is 12C carbon that is defined as exactly 12.
I stand corrected. I couldn’t remember if it was oxygen or carbon that became the standard. I found the following link and stopped when I read “A number of elements had atomic weights that were nearly whole numbers on the oxygen=16 standard.” Should have been more careful. Guess I am sloppy 🙂 Anyway, thanks for the correction!
http://books.google.com/books?id=3ZGW6wE5JDYC&pg=PA14&lpg=PA14&dq=official+atomic+weight+asimov&source=web&ots=QZP4FDH4Ie&sig=iufIwczvboAlGzaJGCah-R33TFs&hl=en&sa=X&oi=book_result&resnum=4&ct=result#PPA14,M1
John-X (13:35:19) :
“June 27, 2008 During the annual Space Weather Workshop held in Boulder, CO in May, 2008, the Solar Cycle 24 Prediction Panel released an update to the prediction for the next solar cycle. In short, the update is that the panel has not yet made any changes to the prediction issued in April, 2007…”
I think they are in a slight hurry? Their prediction is that solar minimum is to occur in March, 2008 (+/-6months). Given that minimum is established 6 months after the fact, the cycle 24 spots must pick up relatively soon now for minimum to occur within March 2008+6months, i.e. September 2008?
I think NOAA has left it at 0?
John-X (13:35:19) :
Leon Brozyna (12:48:50) :
“…whether they report a value of 0 or .5 for August is a minor matter. What I’m waiting to see happen is for Hathaway to pull his team together to revise their prediction on SC24.”
And that might not happen until Spring
http://www.swpc.noaa.gov/SolarCycle/SC24/index.html
“The Panel expects to update this prediction annually.”
Do not confuse Hathaway [and his team] with the SWPC panel prediction. they have nothing to do with each other [apart from the fact that David was once a member of the panel].
Seems to me that they should also be using 1750`s or earlier equipment to check for sun spots not specks that would not be seen in that era.
I haven’t read all the comments yet. But, in an earlier post, I asked how long these sun-specks lasted. I thought maybe 12 hours. Is this so? Are there time limits to become a real suns spot?
Secondly, I reckon, in all innocence, that it took a week because the authorities that be were getting concerned about all the “month-without-a-sunspot” talk going around the climate realists groups.
OK, I will rephrase it — How do we know the same procedures were used in June 1913 as they are using today– And the spots were viewed the same way ….. For that matter, how did they measure sunspots in 1813? The question is still relevant even if it’s not technology but eyesight that drew the charts.
I see the exact same problem with using 1800s thermometers versus those in use today —- and trying to make sense out of charts down to 0.01 degree.
I see a data measurement integrity strain developing through the whole of the observed climate data, which would not stand up to normal scientific scrutiny. It is simply a guessing game, turned into a political parlor game — to extract more tax money from the unwary.
Tax money or grant money? To scientists, its all about the grant from big government or big business.
And therein lies the credibility problem.
Ric Werme (10:01:03) wrote: “Come one guys, chill out (yeah, just like the climate). Whether or not different organizations assign a zero the August ISN is not going to influence the climate over the next decade one whit.”
Ric, I’ve always enjoyed your posts as well as info on your website. But I think your remarks on this situation are out of character.
It’s not only the data per se, it’s the INTEGRITY of the dataset. Many datasets, as you know, are used, manipulated, and twisted by the [snip] to support their AGW claims. This seems to just another example.
Jack Koenig, Editor
The Mysterious Climate Project
http://www.climateclinic.com
Folks,
Just a retired engineer here who taught some telecom once upon a time. In the courses we examined cause and effect. My statement at the time was “If it walks like a duck, quacks like a duck, and looks like a duck, you can say its a duck with a reasonable chance of being correct.” One tiny sunspot one way or another will not affect the outcome over many days without them. The majority of the stories about the sun are about some really distrubing changes in activity, and we’re not talking an increase here.
A zit doesn’t mean acne, and while the idea of a calendar month without spots is a good talking point, it doesn’t change the picture that the sun is asleep.
Time will tell if it wakes up – the other stories on the plasma flow and magnetic field strength and temps are far more troubling than just the single spottett (spotet – spottet – um, yea you get it!)
Mike
May 10, 2006: The Sun’s Great Conveyor Belt has slowed to a record-low crawl, according to research by NASA solar physicist David Hathaway. “It’s off the bottom of the charts,” he says. “This has important repercussions for future solar activity.”
http://science.nasa.gov/headlines/y2006/10may_longrange.htm
My questions would be:
Why are we counting specks at all? Do they have some scientific value?
Do they (as I rather suspect) have some propagadist value that the Sun is not after all, contrary to reports, spotless this month? Ergo, global cooling cannot be setting in because the Sun is not spotless.
There may be some honest scientific value in it, but given that this is coming from Brussels (home of the EU and the IPCC) I sincerely doubt this is anything more than an effort to “slow the train” of news that the Sun is spotless and what this might mean for the globe and for AGW.
Cracks in the dike. Simply cracks in the dike.
Please, Anthony, or Leif, can you answer my question?
How long were these sun-specks apparent? I figure 12 hours.
How long do they need to be seen before they become “spots”?
I imagine some bright light will realize there is future funding for understanding why the sun went to sleep and triggered global cooling. Of course, this will lead to someone claiming to have a solar-engineering solution that will wake the sun up.
Hmmmm… perhaps I should write up a treatment and pitch it to Hollywood?
Bobby: You suspect right, slow the train until they can concoct some other nonsensical theory — try and brush off the obvious.
The speck has political propaganda value. Nothing more, nothing less. Consider the headline “Sun spotless first calender month since June 1913” and the impact it would have on the ordinary ill informed citizen. Heck people might even think the sun has something to do with Earth’s climate. Probably figured that out one day while laying on the beach.
As an engineer, I find the whole climate data and debate something that if this were the quality of data presented to me for an engineering decision, I would immediately fire the engineers. Sure science is supposed to be different, debate and all that, but there is still the issue of individual integrity.
It’s odd all the fudge goes only one way.
And now for something different. While others are talking about predicting SC24, here is my latest and “greatest” regression analysis attempt at projecting earthly temperature anomalies. Listed below are the August 2007 actual numbers for 4 datasets and my predicted numbers for August 2008
Year ====== Hadley GISS UAH RSS
2007 actual== 0.370 0.56 0.286 0.367
2008 predict= 0.293 0.41 0.048 0.090
I have a suggestion.
Why not set up a dual sunspot record.
1) A Wolf record utilizing only equipment available in 1848 ( this would mean that the “k” factor would be “1” and not a SWAG).
2) A Modern Number based on the best equipment available today.
As it is now, the Wolf fomula seems to do OK near the top of the cycle, but at the minimum there will be more of these controversies about whether a spot is to be counted. Later this year those two satelites will be in position to view the entire sun at once. How will this affect sunspot Numbers listed?
SWAG = Scientific Wild A** Guess as opposed to a WAG that I could give.
David, actually Al Gore IS out to make big bucks. He is co-founder, co- owner and chairman of a firm that invests in “green” companies: Generation Investment Management LLP These investments are bound to increase in value significantly if he can keep AGW constantly in the news cycle. Much of what he is doing is providing indirect marketing for his company.
He has a big conflict of interest in this debate. It doesn’t mean that he is wrong. Maybe he is a visionary who saw an opportunity and took advantage of it. But everything he says should be taken with a grain of salt.
Bill Livingston actually saw the ‘spots’ and says:
“Certainly this was a pore(s). Without penumbrae”
So, they were not spots, but pores. And pores should not be counted [and are not when the Sun is active – there may be scores of them at any given time], only real spots with a penumbra [the fuzzy area between the central very dark area and the surrounding photosphere (see: http://en.wikipedia.org/wiki/Image:Sunspot-2004.jpeg ). Looking at that group, I would count 19 spots [and I think Rudolf Wolf would have too -reading his descriptions of how he did things]. His successor, Wolfer, insisted on counting all spots that he could see within the penumbra, and would probably have counted ~40 total [try to count yourself and see what number you come up with and get a feeling for how difficult this is]. Wolfer himself determined that one should adjust [there is that dreaded word again] his counts by a factor of 0.6 to match Wolf’s counts, and that is what Zurich and SIDC have been doing ever since Wolf’s death in 1893 [when he could no longer complain].
Since Catania reported pores on Aug.21-22, these must have lived at least 24 hours, unless you want to entertain the idea that they died within a few hours and then reformed again the next day just in time to be observed by Catania.
So it all comes down to if one should count pores. I and Rudolf Wolf and NOAA don’t think so. Wolfer and SIDC think that pores should be counted. Nobody is more ‘correct’ than the other in this, it is always a question of judgment.
REPLY: “Pore judgement” if you ask me. – Anthony
[…] Follow The Sun on Watts Up With That? […]
They sure saw you coming! 😉
Well, it was either that or cod-liver oil, so the choice was easy.
The day we fell to their level
The day the sun died
The day every dream was burned
The day the sun died
God definitely has a sense of humor.
Turning off the Sun, soon after the politicians and the consensus scientists (feeding on public funds) told us that they knew how to control Earth’s climate!
All is well,
Oliver K. Manuel
“Truth is victorious, never untruth.”
http://myprofile.cos.com/manuelo09
Solar Terrestrial Activity Report has just stopped their consecutive spotless streak count and acted like it never happened, but perhaps strangely/suspiciously, the sunspot graph does not show the spot on August 21; it is just a flat line still. Jan Alvestad now lists 0.5 as the spot count for August without saying why.
http://dxlc.com/solar/
That little spot… what ever it was… was really tiny and almost undetected even by the most powerful telescopes. This brings questions on the past black spots-free months. If today with all our technology we were not able to see this spot, imagine 100, 200 or even 300 years ago how they could see those tiny spots. By bet is than they could not and so it was recorded that month without spot were maybe in fact filled with those micro black spots. But that we will never know.
Note to Oliver K. Manuel (21:53:44): Nice lines, sir!
Wish, though, you would put your web page inside a table so it didn’t spread right off the screen. Very interesting reading; but difficult due to the bleed.
Hi Guys,
Sorry but some of us have families and have to have “fun” over the weekend. Leif is exactly correct and that a few surprises does not mean a birthday party. Let the cycle progress and then we will see. Gustav will make an impact no doubt. That is what is important right now. Wait for Hanna
my 10 cents worth
I thought that 30 months represents momentum fairly well,
by adding spot counts for this time and dividing by 30 we get and average number
here are the results.
1811
25.7/30=0.86
1913 11
87.6/30=2.92
1934 11
236/30=7.8
2008 09-01
259/27=9.6
265/30=8.8
1954
462/30=15.4
notes
second set for 2008 is fudged for sept. and oct.
counts start on may and end on october.
well as we see we are close to the period of 1933,34
and at 3 times the number of 1912,13 (Dalton Minimum)
links to cycles of warm and cold no need for instraments to see this!
note 1978-1979 IE blizard of 78
hey keep up the good work, will be a laugh to see the agw’s explane what’s comming after the fact. 🙂
http://www.glerl.noaa.gov/data/ice/atlas/ice_charts/index.html
To Jnicklin,
“Looking back to other “phase changes” its likely that the AGW crowd will just switch to AGCooling without skipping a beat. The media and their cast of supporting scientists have done it before.”
Refer to http://news.smh.com.au/national/big-chill-a-symptom-of-climate-chaos-20080901-46yx.html
This article blames CO2 for “cooling” – now CO2 does everything and AGW cannot be falsified.
I ashamed to say that Australia (my home) appears to have won the gold medal in climate gullability.
Johnny B: “I think that most fat people feel bad about their weight, and certainly have to suffer the physical discomfort and social embarassment of being fat.”
I agree that we should be sensitive about fat people, given their often visible discomfort about their appearance. School-yard taunts such as ‘lard-arse’, ‘blubber-guts’ and ‘Michael Moore’ can be very hurtful, and not only to the younger chubby cheeks but also to the older porker.
My practice on these occasions is to use strictly denotative descriptors such as ‘very large person’, and I find that fatties are often pleasantly surprised and even a little flattered by such neutral and respectful terms.
That said, the hard question must be asked: are very large people pulling their weight in society? Regrettably, I have to say no. There is a good argument that our more solid citizens are free-riding off the svelte and slender, and that this burden is a sizeable one. For example, very large people create disproportionate wear and tear on the public sidewalks, even as their vast bulk prevents the free and unfettered movement of their fellow citizens.
However, while the very large person’s hefty footprint – carbon or otherwise – is a substantial issue, I don’t believe that heavy-handed government regulations or onerous taxation is the answer. I am sure that, given sufficiently generous inducements, there would be ample opportunity for very large people to tackle the weighty issues that confront them every day as a matter of course, or rather, many courses.
My empathy can only carry so much baggage, though. It’s undeniable that the full-bodied are a gross negative externality, although this aspect is probably beyond the purview of government. The only recourse of the normal majority in this case is to grin and bear it.
While some folks have advocated calling the next solar minimum the “Al Gore Minimum”. I’d like to suggest that in addition to reminding them of the proper name “Landscheidt Minimum” that they be consoled with the suggestion to call the cold climate associate with it:
“The Al Gore Cold Period” just a thought 😉
I also suspect that it ought to be considered to be “Bond Event 0” since it fits the pattern…
Oh, and speaking of mangling names, shouldn’t we now admit that Al Gore won the Nobel PeaCe Prize? 😉
I am not a republican. I’m a registered independent. They are all crooks… (though MaCain & Palin have convinced me to stop being quite so cynical for One More Time; and yet I’d be happy if Obama won because we could finally bury the White Guilt monster… maybe I just don’t have enough passion in me to be in a political party, right or left wing…
I agree with the sentiment that we will have plenty of time to count spotless months. My Pink Brandywine tomato has failed to set fruit all “summer” here in San Jose, Ca. (the Siberian is doing fine.) It’s cold, feels like about 1 month ahead of schedule. I’m a 50 something native of Ca. so have a long personal database of experience. Things are ‘not right’ and headed colder.
It would be interesting to check the ‘degree day’ statistics from the wineries. The major factor in proper grape ripening is the total time spent warm. Any modern large winery ought to calculate the degree-days along with measuring fruit sugar. I’m sure someone (U.C.Davis?) has the statistics. Just don’t know where to get them.
We’ll know it’s cooler for sure if the German style whites are record breakers while the dark reds are thin and insipid… Anyone got grant money for a taste test? 🙂
[…] from “Sunspeck counts after all…Sun DOES NOT have first spotless calendar month since June 1913“, Anthony Watts, posted at his blog Watts Up with That, 1 September […]
NEWS
Jan Janssens has updated his famous Spotless Days page (using the data as provided by SIDC).
http://users.telenet.be/j.janssens/Spotless/Spotless.html
He lists the spotless streak as 31 days, from 21 July to 20 August, rank #22 since 1849.
“Pending further review of the preliminary daily sunspot data by SIDC, the period from 21 July 2008 till 20 August 2008 is one of the longer ones since the beginning of daily solar observations in 1849…”
Commentary he posted about the spot, sunspeck or pore on August 22
http://users.telenet.be/j.janssens/Engnieuwtjes.html#Zon
Leif Svalgaard (20:35:10) :
Well, the Aug 21 drawing shows 1 speck (maybe even 1 pixel, but let’s not go there) and the 22 Aug drawing shows 3. Any spots that formed just after the 8/21 drawing and disappeared just before the 23.8 check would have lived about 47 hours.
We could argue a lot about that, so please accept my apology-in-advance for mentioning it.
I fear we’re all guilty of “pore science” too.
“Pending further review of the preliminary daily sunspot data by SIDC,…”
I love the idea that the referee might go “under the hood,” as in the NFL (National Football League), then come out on the field and announce the call:
“After further review, the sunspots’ feet were out-of-bounds. The ruling on the field is reversed – NO Touchdown! The ball will be placed at the 44-day yard line.”
Prof. Manuel.
Thank you for posting that link! Very interesting stuff indeed.
“REPLY: “Pore judgement” if you ask me. – Anthony”
I agree. As Leif pointed out earlier, and again above, the standard practice is to NOT count pores.
This is not merely a judgment call, or honest people honestly disagreeing.
As Leif also pointed out earlier, to change the counting rules means that today’s sunspot counts and historical sunspot counts DO NOT MATCH, and we do not have a proper historical series based on OBJECTIVE (if imperfect) counting rules.
This problem REQUIRES that someone go in and correct the record to make it a proper series again.
And if the person or group doing the “adjusting,” is either incompetent or has a different agenda, we all know where that leads.
You’d think that after the whole Iraq War .. Bush lied meme, that people would be a bit more skeptical of (world) government truths. Afterall it was the consensus of the global intelligence community that Saddam Hussein had WMD (chemical & biological at least), so a consensus on Global Warming goes relatively unchallenged.
Fool me once .. shame on you.
Fool me twice .. shame on me.
But remember that it is an imperative that lawmakers do something now, lest the whole Global Warming thing will be “cured” by Nature, leaving them without any chance of claiming credit for ending the warming trend.
REPLY: You need to talk to SOD, our resident Iraq War debunker. He doesn’t seem to embrace this message. – Anthony
Tim Lindt (23:24:45) :
http://www.glerl.noaa.gov/data/ice/atlas/ice_charts/1977/index.html
http://www.glerl.noaa.gov/data/ice/atlas/ice_charts/1977/pages/c77feb09_jpg.htm
Someone else agrees with your first assessment of no sunspots: Dailytech.com (see http://tinyurl.com/562srq)
More fuel for the fire.
There is an archive of the daily SIDC “ursigrams” here:
http://sidc.oma.be/html/SWAPP/dailyreport/dailyreport.html
If you select the ursigrams for August 22 and 23, you get the reported data for the 21st and 22nd:
August 21:
TODAY’S ESTIMATED ISN : 000, BASED ON 07 STATIONS.
SOLAR INDICES FOR 21 Aug 2008
WOLF NUMBER CATANIA : 011
10CM SOLAR FLUX : 067
AK CHAMBON LA FORET : ///
AK WINGST : 004
ESTIMATED AP : 005
ESTIMATED ISN : 000, BASED ON 14 STATIONS.
August 22:
TODAY’S ESTIMATED ISN : 000, BASED ON 11 STATIONS.
SOLAR INDICES FOR 22 Aug 2008
WOLF NUMBER CATANIA : 013
10CM SOLAR FLUX : 068
AK CHAMBON LA FORET : ///
AK WINGST : 003
ESTIMATED AP : 003
ESTIMATED ISN : 000, BASED ON 11 STATIONS.
In both cases, the daily estimated “International Sunspot Number” based on multiple stations, not just the Catania Wolf Number, was 000. So how did SIDC end up with positive values in the monthly report?
REPLY: Thanks Basil. I sent you some email last week, have not heard a response. – Anthony
Thank you! Oliver Manuel:
It makes me feel a little ignorant. (Or crazy).
….Efforts to understand unusual weather or abrupt changes in climate have been plagued by deficiencies of the standard solar model (SSM) [1]. While it assumes that our primary source of energy began as a homogeneous ball of hydrogen (H) with a steady, well-behaved H-fusion reactor at its core, observations instead reveal a very heterogeneous, dynamic Sun. As examples,
the upward acceleration and departure of H+ ions from the surface of the quiet Sun and abrupt climatic changes, including geomagnetic reversals and periodic magnetic storms that eject material from the solar surface are not explained by the SSM. The present magnetic fields are probably deep-seated remnants of very ancient origin. These could have been generated from two mechanisms. These are: a) Bose-Einstein condensation [2] of iron-rich, zero-spin material into a rotating, superfluid, superconductor surrounding the solar core and/or b) superfluidity and quantized vortices in nucleon-paired Fermions at the core [3]…..
http://www.omatumr.com/abstracts2003/jfe-superfluidity.pdf
“As Leif also pointed out earlier, to change the counting rules means that today’s sunspot counts and historical sunspot counts DO NOT MATCH, and we do not have a proper historical series based on OBJECTIVE (if imperfect) counting rules.
This problem REQUIRES that someone go in and correct the record to make it a proper series again.”
Already been done. See Hoyt, D. V., and K. H. Schatten, 1998. Group sunspot numbers: A new solar activity reconstruction. Solar Physics, 181, 491-512.
Svalgarrd doesn’t like but prefers a proxy. Unfortunately his proxy is not homogeneous as explained in the following paper:
Does sunspot number calibration by the “magnetic needle” make sense?
In Press, Corrected Proof, Available online 10 May 2008
K. Mursula, I. Usoskin, O. Yakovchouk
whose abstract says:
It has been suggested recently that early sunspot numbers should be re-calibrated and significantly corrected using the observed daily range of the geomagnetic declination (so-called rY values). The suggested “correction” method makes an a priori detrending of the rY series and then extends the linear regression between rY and sunspot numbers established for the last 25 years to earlier times. The suggested “correction” of sunspot numbers by roughly 30% goes far beyond the traditional estimates of observational uncertainties of sunspots. Concentrating here on Zürich sunspot numbers (Rz), we demonstrate that the rY values do not actually imply that the observed Rz values in the 19th century are systematically underestimated. Rather, we find that the Rz numbers are fairly uniform after mid-19th century. The suggested “correction” is largely induced by the detrending of the rY series, which enhances the rY-based sunspot activity in the 19th century relative to later times. We also show that while the annually averaged declinations have a rough relation between sunspots and other related solar parameters, this relation is strongly seasonally dependent and, therefore, not sufficiently accurate or uniform to allow annually averaged rY values to be used as a very reliable proxy of solar activity in early times.
The Wolf Sunspot Number and Group Sunspot Number were derived using entirely different observers and agree rather closely for 1880 to 1995. There is no trend difference between them and only small differences in sunspot peak values such as in 1957.
The Group Sunspot Number is constructed by ratioing the observations made by different observers to calibrate the observers to the standard observations of the Royal Greenwich Observatory. Observations back to 1795 can be homogeneous with a rather high confidence (plus/minus 10%) and for 1730 to 1795 with less confidence. Isotopic proxies agree with the Group Sunspot Number reconstruction.
This story has been Slashdotted,
http://science.slashdot.org/article.pl?sid=08/09/02/142218
so expect SIDC’s decision to change at the last moment to be in full glare of techies worldwide.
[…] 2008 has made solar history. As of 00 UTC September 1st 2008 (5PM PST) we just witnessed the first spotless calendar month since June 1913.This was determined according to sunspot data from NOAA’s National Geophysical Data Center, […]
The above comment by Leif Svalgaard about sunspot measurements:
“So it all comes down to if one should count pores. . . . . , it is always a question of judgment.”
Reminds me of Leif’s comment on August 09, 2008 at 18:39:12 pm in the spaceweather discussion of Solar Cycle 24 about the solar neutrino measurements at the Sudbury Neutrino Observatory:
“Remember that nobody has yet been able to tell the difference between neutrinos and antineutrinos.”
http://solarcycle24.forumco.com/topic.asp?TOPIC_ID=353&whichpage=8
Actually solar neutrino measurements at the Homestake Mine by Ray Davis counted only electron neutrinos that induced the following nuclear reaction:
v (electron neutrino) + Cl-37 -> Ar-37
That same Homestake Mine might have been used to count electron anti-neutrinos predicted by the Iron Sun:
_
v (electron anti-neutrino) + Cl-35 -> S-35
According to the Iron Sun hypothesis, two anti-neutrinos are produced for each neutrino made in the Sun [O. Manuel, “The need to measure low energy anti-neutrinos (E < 0.782MeV) from the Sun,” Physics of Atomic Nucleus 67 (2004) 1959-1962; Yad. Fiz. 67 (2004) 1983-1986: http://arxiv.org/abs/astro-ph/0410168 ]
–
v/v = 2
However, the Homestake Mine was flooded with water, instead of using this expensive solar neutrino counting facility to test the Iron Sun hypothesis.
Yet all is well,
Oliver K. Manuel
“Truth is victorious, never untruth.”
http://myprofile.cos.com/manuelo09
wattsupwiththat (08:34:54) :
“This story has been Slashdotted,”
You’re enjoying this, aren’t you? 🙂
I saved four of the ursigrams at work, I’ll save more at home tonight. Key data:
$ egrep ‘ISN|WOLF’ meu23*
meu234.htm:TODAY’S ESTIMATED ISN : 000, BASED ON 10 STATIONS.
meu234.htm:WOLF NUMBER CATANIA : 000
meu234.htm:ESTIMATED ISN : 000, BASED ON 25 STATIONS.
meu235.htm:TODAY’S ESTIMATED ISN : 000, BASED ON 07 STATIONS.
meu235.htm:WOLF NUMBER CATANIA : 011
meu235.htm:ESTIMATED ISN : 000, BASED ON 14 STATIONS.
meu236.htm:TODAY’S ESTIMATED ISN : 000, BASED ON 11 STATIONS.
meu236.htm:WOLF NUMBER CATANIA : 013
meu236.htm:ESTIMATED ISN : 000, BASED ON 11 STATIONS.
meu237.htm:TODAY’S ESTIMATED ISN : 000, BASED ON 09 STATIONS.
meu237.htm:WOLF NUMBER CATANIA : 000
meu237.htm:ESTIMATED ISN : 000, BASED ON 18 STATIONS.
I’d like to know how Wolf numbers are converted between ISN (International Sunspot Number, I believe, though Interpolated Sunspot Number might be part of the answer). Note that their monthly reports refer to “Provisional international and normalized hemispheric daily sunspot numbers.”
And who are these “other stations” and what sort of ranking is there?
Man is the only creature that uses the earths resources, and that’s not fair! The earth has feelings too. I think humans should cut down on carbohydrates, because Al Gore has already proven that human flatulence has caused ozone depletion. Lets save the mosquitos, the spotted owl, the baby seals, the polar bears, the rain forrest, and return to the primitive. Hell, who cares about mankind anyway? “They told me to say that”
So lets all forget about spotless days now. Its not important anymore. You guys messed it up and the cow is out of the barn now.
Douglas Hoyt (08:25:52) :
Svalgaard doesn’t like but prefers a proxy. Unfortunately his proxy is not homogeneous as explained in the following paper:
Does sunspot number calibration by the “magnetic needle” make sense?
In Press, Corrected Proof, Available online 10 May 2008
K. Mursula, I. Usoskin, O. Yakovchouk
Doug, Although not pertinent to the topic, I’ll just have to rebut that: http://www.leif.org/research/AGU%20Spring%202008%20SP23A-07.pdf
Whether the “sunspec” should be counted or not is more of just an interesting statistical sidenote to the bigger picture of continued low solar activity & an increasing long cycle 23. The important thing is that this is giving us a chance to test the solar hypothesis – the sun as a significant driver of climate. That is exciting as a scientist. The solar hypothesis suggests a colder climatewith longer cycle / lower activity. It will be interesting to see if this verifies and to what degree (see plot by Archibald on Icecap : http://icecap.us/images/uploads/HanoverNH.JPG )
Always remember this should be about pursuing science – regardless of the answer & how it fits a particular politcal agenda.
This is a shame! Another blow in what science should be. As someone pointed out, if one counts micro-spots this way, values a century ago are certainly much lower than they were.
I support that someone call this the “Gore minimum”. Mother nature and the Sun will make sure he gets exposed. In some time, taking the Nobel away from him and the IPCC will be the hot way to go.
Ecotretas
http://ecotretas.blogspot.com
Svalgaard’s link above states: “We now assume that this holds back in time for the whole rY-series [detrended by normalizing to its mean].”
Mursula et al.’s paper shows why this assumption is wrong.
Graeme Rodaughan (23:55:57) “its likely that the AGW crowd will just switch to AGCooling without skipping a beat.”
Already happened, see ICECAP today quoting Sydney Herald. “Big Chill a symptom of Climate Change… Forget global warming – the latest problem is global cooling… The freezing temperatures are proof of the urgent need to cut carbon pollution, according to WWF development and sustainability program manager Paul Toni.”
[…] discussione e’ “in diretta” a questo link, dove partecipa l’esperto Leif […]
NEWS
“Spotless Month” story quoted by Rush Limbaugh – nationwide, millions of listeners, ~600 radio stations. Stated without mention of SIDC non-zero count or any controversy, just that August was spotless.
He who gets to the media first, wins.
Sun Makes History: First Spotless Month in a Century
The record-setting surface of the sun. A full month has gone by without a single spot (Source: Solar and Heliospheric Observatory (SOHO))
Sunspot activity of the past decade. Over the past year, SIDC has continually revised its predictions downward (Source: Solar Influences Data Center)
Geomagnetic solar activity for the past two decades. The recent drop corresponds to the decline in sunspots. (Source: Anthony Watts)
A chart of sunspot activity showing two prior solar minima, along with heightened activity during the 20th century (Source: Wikimedia Commons)
Drop in solar activity has potential effect for climate on earth.
The sun has reached a milestone not seen for nearly 100 years: an entire month has passed without a single visible sunspot being noted.
http://www.dailytech.com/Sun+Makes+History+First+Spotless+Month+in+a+Century/article12823.htm
REPLY: For me it wasn’t about “winning” it was about reporting on something significant as it happened. I had no idea (nor did many others) that SIDC would all of the sudden change, and count a sunspeck or “pore” as a spot. – Anthony
Doug,
We dilettantes would also like to see the mathematic threorems behind a correction of data in one domain arising from one non-linear phenomena at the photosphere with data from another domain from a distinct non-linear phenomena arising at the earth where no mapping, transform between or relations for either are proposed.
[…] It’s 71 Days Without A Sunspot 2 09 2008 Confusion reigns tonight on the date the last sunspot has been seen. Until yesterday, it had been July 18 with sunspot […]
Is Pluto a planet? Regardless of the latest definition, if you are standing on a solid body with appreciable gravity, and can pick up rocks from its surface, then regardless of what body it is orbiting around, it’s a planet. The Moon is a planet – if you fall on it you will hurt yourself. It is orbiting around the Earth, but it’s also going around the Sun once a year. Maybe Pluto is a planet in my sense, but not a Planet in the classical sense.
Well, as of now, solarcycle24.com is counting 31 spotless days in August. Or are they showing 30.5—oh well, no matter. Even if it turns out to be 30, this cycle is certainly showing a different minimum pattern than the last.
http://www.solarcycle24.com/graphs/sunspotgraph.gif
Thanks Lucy S,
(I was quoting jn above me). The problem we face is a highly motivated political movement which is trashing science to achieve it’s ends.
We need more scientists to stand up and defend their own profession and point out the pseudoscientific basis of the current AGW scare.
The consequences of not doing so will involve (I suspect) a substantial reduction in the living standards of the whole world and an increased death rate amongst the poor due to the lack of effective economic development.
WRT sunspots – at this juncture – any physical evidence contrary to the AGW thesis needs to be “managed”.
CONFIRMED
NOAA (Boulder) defers to SIDC (Brussels) for the “official” number.
ftp://ftp.ngdc.noaa.gov/STP/SOLAR_DATA/SUNSPOT_NUMBERS/MONTHLY
So the official number for August, now and forever, is 0.5
Only the southern [solar] hemisphere goof-up will be corrected.
The fact that NOAA has also counted that “speck” comes as no surprise and it’s not from holding any conspiracy suspicions. There’s the fact that there were terrestrial based observations, with manual drawings of the disturbances. I would suppose that processing such manual notes would delay recording the data. NOAA may have been aware of the event and, through normal inertia, never went back to amend the data they had while SOHO was acting up.
It doesn’t change the fact that such slow solar activity shows no sign of changing. The next several months should prove fascinating.
Maurizio
per favore, L’Osservatorio di Catania.
Inserisci qui gli altri fogli di lavoro.
g = Giorno
tutti sono il primo giorno del mese di agosto 2008. (??????)
please, L’Osservatorio di Catania .
Insert here the other spreadsheets.
g = Day
all are the first day of the month of August 2008. (??????)
hmmmmm???
Malcolm Miller (16:24:41) :
“Maybe Pluto is a planet in my sense, but not a Planet in the classical sense.”
What’s something you can jump off of and not return?
http://wermenh.com/deimos.html
Douglas Hoyt (08:25:52) :
From the abstract of Mursula et al.’s paper: “Rather, we find that the Rz numbers are fairly uniform after mid-19th century. The Wolf Sunspot Number Rz and Group Sunspot Number Rg were derived using entirely different observers and agree rather closely for 1880 to 1995. There is no trend difference between them and only small differences in sunspot peak values such as in 1957.”
This paper is typical of the type of papers that defend status-quo, complete with vague statements like “we find that the Rz numbers are fairly uniform after mid-19th century”. What does that mean? Presumably that Rz is pretty good. Other statements are flatly wrong, like “Rz and Rg […] agree rather closely for 1880 to 1995, using the loose “rather closely” phrase. To see how wrong it is, we simply just form the ratio between Rg and Rz [omitting a few values where Rz is close to zero, where the ratio is undefined] and plot that ratio as a function of time. this is an exercise that anybody can easily do in, say, twenty minutes using publicly available data. Here is what I get: http://www.leif.org/research/RgRz-Ratio.png . It is quite clear [and quantitative] that the ratio has a discontinuity of 20% in the 1940s when Waldmeier took over production of the Zurich sunspot number [as well as another one in about 1890]. So, to say that all is well is plainly wrong. It could, of course, be the case as Mursula et al. maintains that Rz is pretty good and that it is Hoyt and Schatten’s Group Number Rg that is wrong. Either way, it shows that our measures of sunspots and solar activity are not on firm ground.
Graeme Rodaughan (16:54:56)
“We need more scientists to stand up and defend their own profession and point out the pseudoscientific basis of the current AGW scare.
The consequences of not doing so will involve (I suspect) a substantial reduction in the living standards of the whole world and an increased death rate amongst the poor due to the lack of effective economic development.”
The consequences of doing so may involve a substantial reduction in living standards (and government grants) of the scientist brave (foolish) enough to stand up. Always look out for #1.
Please Leif, do not say that some kind of measurement is not up to snuff and has calibration problems. The list of shaky ground measuring devices is getting quite long and Anthony is only one man. Besides, it is a bit difficult to drive to some satellite and inspect, photo, and otherwise survey such measuring devices.
Basil (07:45:44) :
Anthony, I copied down the whole year’s worth of ursigrams.
Yesterday upon the Sun
I spied a spot that wasn’t fun.
It wasn’t there again today.
I wish that spot would stop its play.
Leif,
I agree, I remember a post something like that on CA about a paper that says it is rigorous, agree and other statements but not it is or it is not. Science is not vague interpolations of the facts. I myself do indulge in far off ideas but I say so in my statements. Leif has great patients in my far flung ideas. He also has great patients in responding to all with no ill will. My hat off to you Leif.
Leon Brozyna (17:27:06) :
The fact that NOAA has also counted that “speck” comes as no surprise and it’s not from holding any conspiracy suspicions.
Folks it is really quite simple [but tedious]. I have tried to explain it before but clearly failed. Let me try again:
NOAA assigns a region number to a collection of spots that represent a clear physical grouping of some significance. They have established criteria for this and the assignment is done almost in real time and is available shortly after the end of each UT [Greenwich Time] day and hence labeled one day earlier]. Here is the one for today, referring to the 2nd Sept.: http://www.swpc.noaa.gov/ftpdir/forecasts/SRS/0903SRS.txt which reads:
:Product: 0903SRS.txt
:Issued: 2008 Sep 03 0031 UTC
# Prepared jointly by the U.S. Dept. of Commerce, NOAA,
# Space Weather Prediction Center and the U.S. Air Force.
#
Joint USAF/NOAA Solar Region Summary
SRS Number 247 Issued at 0030Z on 03 Sep 2008
Report compiled from data received at SWO on 02 Sep
I. Regions with Sunspots. Locations Valid at 02/2400Z
Nmbr Location Lo Area Z LL NN Mag Type
None
IA. H-alpha Plages without Spots. Locations Valid at 02/2400Z Sep
Nmbr Location Lo
None
II. Regions Due to Return 03 Sep to 05 Sep
Nmbr Lat Lo
None
and for the 23nd August http://www.swpc.noaa.gov/ftpdir/forecasts/SRS/0823SRS.txt which reads:
:Product: 0823SRS.txt
:Issued: 2008 Aug 23 0031 UTC
# Prepared jointly by the U.S. Dept. of Commerce, NOAA,
# Space Weather Prediction Center and the U.S. Air Force.
#
Joint USAF/NOAA Solar Region Summary
SRS Number 236 Issued at 0030Z on 23 Aug 2008
Report compiled from data received at SWO on 22 Aug
I. Regions with Sunspots. Locations Valid at 22/2400Z
Nmbr Location Lo Area Z LL NN Mag Type
None
IA. H-alpha Plages without Spots. Locations Valid at 22/2400Z Aug
Nmbr Location Lo
None
II. Regions Due to Return 23 Aug to 25 Aug
Nmbr Lat Lo
None
Note the ‘None’ [my emphasis]. The above was picked from their website right now, and has not been changed since it was issued on Aug.23rd. They have not changed their mind, and not taken their time doing so, or any such nonsense.
Now, the last ‘active region’ assigned a number by NOAA was on July 20th:
http://www.swpc.noaa.gov/ftpdir/forecasts/SRS/0721SRS.txt . Here is what the report reads:
:Product: 0721SRS.txt
:Issued: 2008 Jul 21 0033 UTC
# Prepared jointly by the U.S. Dept. of Commerce, NOAA,
# Space Weather Prediction Center and the U.S. Air Force.
#
Joint USAF/NOAA Solar Region Summary
SRS Number 203 Issued at 0030Z on 21 Jul 2008
Report compiled from data received at SWO on 20 Jul
I. Regions with Sunspots. Locations Valid at 20/2400Z
Nmbr Location Lo Area Z LL NN Mag Type
1000 S12W05 179 0010 Axx 01 01 Alpha
IA. H-alpha Plages without Spots. Locations Valid at 20/2400Z Jul
Nmbr Location Lo
None
II. Regions Due to Return 21 Jul to 23 Jul
Nmbr Lat Lo
None
The number ‘1000’ is the region number [minus 10000, so the ‘real’ region number was 11000 – simply numbered from 1 and up since they started the count in the 1970s]
So, a correct statement would be: “There were no active regions in August”
The region number is not ‘the number of spots [regions] seen on a given day’ but the sequence number of the spot [region] since they started counting.
NOAA in summary reports lists the SIDC number, as is proper. So there is no discrepancy, no conspiracy, no problem. I may be partly to blame for [some] of the confusion. On my website, I maintain [ page 8 of http://www.leif.org/research/Most%20Recent%20IMF,%20SW,%20and%20Solar%20Data.pdf ] a plot of the average number of ‘active regions’ recognized as such by NOAA as a function of time for the last few cycles. This is my own ‘summary plot’ that is fairly insensitive to Tiny Tims.
The chairman of our panel even showed it in one of his presentations (slide 10 of http://www.swpc.noaa.gov/SolarCycle/SC24/Biesecker2008.ppt ) – look very closely at the tiny lettering at the top of the graphs.
Now, the SIDC in Brussels has its own method for calculating the sunspot number from a large number [~60] of co-operating observatories. They may or may not count a Tiny Tim [or pore] depending on things like the number of stations reporting it as seen or how long it has lived. They have automated the calculation and may from time to time be victims of bad input data, as they were this time around when some stations reported the pore in the wrong hemisphere. They may go back and change the [clearly marked as] ‘provisional’ and ‘preliminary’ count given at the end of each month [if they discover any errors]. It is unfortunate that there was an error this time as it fueled conspiracy theories and other nonsense. And also unfortunate that they reported a [preliminary] SSN of 000 on the two days where Catania actually had data. I have urged that a manual quality control be inserted somewhere in the loop, but doubt that they will do anything about it.
It is a judgment call whether to count a pore. I would argue that the one on Aug.21 should not have been counted [and Wolf would certainly not have counted it], but admit that the three on the Aug.22 with some justification might qualify.
Lastly, there is a another sunspot number around, derived every day from the observations collected by the Solar Division, AAVSO: http://www.aavso.org/observing/programs/solar/ called the ‘American sunspot number’ . Real-time values can be found here: http://www.hamqsl.com/solar.html .
The NOAA SWPC Space Weather Operations (SWO) collects these data and publishes them here: http://www.swpc.noaa.gov/weekly/index.html
It is noteworthy that for Aug.21-22, this ‘America’ or ‘SWO’ or ‘Boulder’ SSN was zero. BTW, I’m not 100% sure about where that data really comes from and how it is processed. The official international sunspot number from SIDC is typically 30-50% lower than the American SSN.
http://space.newscientist.com/article/dn14652-suns-face-virtually-spotfree-for-months.html
For those climate change skeptics forever looking for any kind of ammunition to support their agenda, this is just not that relevant. I’d really suggest anyone who cares enough to comment publicly or call AGW ‘psuedoscience’ (as has occurred in this forum) to be diligent enough to have at least a minimal understanding of the science (eg. to have read and understood at least some of the wikipedia article on, say, global warming).
Solar cycles are factored into the models and have been for decades, as are almost all of the arguments commonly thrown up by sceptics (the vast, vast majority of whom have no professional background in climate research). Of course if there are phenomenon leading to unforeseen increases in solar output this will effect climate in the short-term – they may even give us some more time by slowing some of the positive feedback effects of AGW, which would be great. And obviously, the complexity of all the positive and negative feedback mechanisms are huge sources of imprecision in modeling the speed of AGW and related problems (such as ocean water pH).
But lets not let wishful thinking get in the way of science. Looking for evidence to support how you want reality to be is not science. Its the opposite of science.
Ric Werme (19:47:55): “…I wish that spot would stop its play.”
Go, Ric! Man after my own whims and fancies.
Leif gets some ink from the folks at NewSocialistScientist.com.
The last two paragraphs are a classic example of the subtle way that those purporting to be “unbiased science journalists” hide their AGW agenda in plain sight.
To wit:
So, in the Gorewellian Parallel Universe™, high sunspot activity merely means you lose your cell phone signal or have to surf the ‘Net by candlelight. But, according to their interpretation, only low sunspot activity is associated with a “cooler climate”.
In their world, if A=B and B=C, then A ≠ C.
Is there not a single AGW disciple out there who can see the utter cognitive disconnect here?
http://www.swpc.noaa.gov/ftpdir/indices/DSD.txt
Sept 3 2008 no sunspots for August or are my bifocals in trouble again.
REPLY: No you don’t need bifocals – Anthony
Oops. Sorry Leif. I didn’t see that you’d already posted the link to the article. As a preemptive clarification, I was associating you with the author(s) of the article in the AGW comments.
BTW, is it mandatory for guys with kick-@ss Norse names, such as “Leif Svalgaard” to have at least one set of Viking horns on hand at all times in case someone calls an impromptu raid on a village? 😉
March 10, 2006: … This week researchers announced that a storm is coming–the most intense solar maximum in fifty years. … “The next sunspot cycle will be 30% to 50% stronger than the previous one,” she says. If correct, the years ahead could produce a burst of solar activity second only to the historic Solar Max of 1958…..Dikpati’s forecast puts Solar Max at 2012. Hathaway believes it will arrive sooner, in 2010 or 2011. “History shows that big sunspot cycles ‘ramp up’ faster than small ones,” he says. “I expect to see the first sunspots of the next cycle appear in late 2006 or 2007—and Solar Max to be underway by 2010 or 2011.”
http://science.nasa.gov/headlines/y2006/10mar_stormwarning.htm
*was = wasn’t. Sorry. Sometimes even double-checking doesn’t catch everything. (Just ask SIDC!)
@ Leif Svalgaard (20:12:05) :
Thanks for taking the time (& for your patience) in explicating the processes involved and the differences between SWPC & SIDC. It’s like comparing apples and oranges – they’re similar but not the same. The thing for an outsider to remember {raising hand} is that there is no nefarious conspiracy.
“The suggested “correction” method makes an a priori detrending of the rY series and then extends the linear regression between rY and sunspot numbers established for the last 25 years to earlier times.”
This is called circular reasoning, assuming what one purports to prove.
“at least a minimal understanding of the science (eg. to have read and understood at least some of the wikipedia article on, say, global warming).”
This is rather like showing up for lecture and discussion half-way thru the semester and ripping your fellow student for not having read Cliff Notes.
Daz, thanks for your comments. However, you say:
Of the 23 models relied upon by the IPCC, the total number of models that use solar cycles for the IPCC forecasts (as opposed to the hindcasts) is exactly two (really one, because the “two” are the GISS ER and EH variations). [See FAR Table 10.1)
So no, they are not factored into the models as you so blithely claim. In fact, the models use very few forcings for their forecasts, viz:
Variables Used for Forecasts in FAR GHCMs100% used CO2 as a variable.
100% used CH4 as a variable.
100% used N2O as a variable.
100% used SO4 as a variable.
96% used CFCS as a variable.
61% used STRAT OZONE as a variable.
57% used TROP OZONE as a variable.
35% used BLACK CARBON as a variable.
30% used 1ST INDIRECT as a variable.
22% used 2ND INDIRECT as a variable.
22% used SEA SALT as a variable.
17% used VOLCANIC as a variable.
13% used DUST as a variable.
13% used LAND USE as a variable.
9% used NITRATE as a variable.
9% used SOLAR as a variable.
Given that, your claims about how the “vast, vast majority” of sceptics have no professional background rings a bit hollow … pot, meet kettle. Do your research and homework first, general comments will get eaten alive here if they are not true.
Best of luck,
w.
Gary Gulrud (21:52:40) :
“The suggested “correction” method makes an a priori detrending of the rY series and then extends the linear regression between rY and sunspot numbers established for the last 25 years to earlier times.”
This is called circular reasoning, assuming what one purports to prove.
You would benefit from actually reading my paper http://www.leif.org/research/AGU%20Spring%202008%20SP23A-07.pdf on this, rather than citing second-hand misconceptions of the issue.
The trend is well-understood (due to the secular decrease of the Earth’s magnetic field) and should be removed to be scientifically honest [if you know that the response function of your instrument (the Earth itself) has changed, you should not ignore that]. Second, the trend is small, so is a second-order effect anyway. Third, the ‘error’ in the sunspot number does not just accumulate linearly with time [as you would get if removed a linear trend], but discontinuously, coinciding with changes of observers].
B.C. (21:12:31) :
*was = wasn’t. Sorry. Sometimes even double-checking doesn’t catch everything. (Just ask SIDC!)
Except that I don’t think they even check once…
Daz Rees (20:31:56) :
Hi Daz,
Could you please supply references to the following.
1. A published science paper that clearly demonstrates the causal link between rising CO2 levels and rising global temperatures – such that rising CO2 must cause rising global temperatures.
2. A published science paper that clearly outlines the falsification criteria for Anthopomorhic Global Warming. I.e. what are the specific, measurable criteria that – if found would refute AGW. For example a measured cooling period in the presence of ever increasing CO2 would have to last for how long before AGW was proven to be false.
For the record, my agenda is the promotion of open, transparent, and non-politicised science.
I am also concerned about the diversion of resources away from solving real environmental and human problems such as water quality and water availability, by politicians who seem to believe the AGW is the cause of all adverse environmental phenomena. While they believe the cause is AGW (which seems like a myth to me) the real root causes of problems will not be addressed.
Also to Daz,
Note that “demonstration” means an empirical, hard data, demonstration.
Computer Generated models do not qualify as a demonstration of anything except the abilities of the programmers involved.
Also to Daz,
A causal link – must be causal – not a correlation.
have fun :-).
Gary Gulrud (21:52:40) :
“The suggested “correction” method makes an a priori detrending of the rY series and then extends the linear regression between rY and sunspot numbers established for the last 25 years to earlier times.”
“This is called circular reasoning, assuming what one purports to prove.”
Gulrud is exactly right. It is clear from Svalgaard’s responses that he has not read Mursula’s paper. Mursula shows that Svalgaard’s method of detrending is wrong. He is throwing out the signal and then claiming that there is no signal.
Perhaps Svalgaard would be better off by assuming the variations in rY from minimum to minimum represent real differences between solar minima.
Svalgaard claims that in the 1880s that only 60% of the sunspot groups were observed and 40% were missed. There are two photgraphic runs during that period and both of them agree with each other to better than 10%. The Royal Greenwich Observatory photographs measured sunspot areas to 1 millionth of the area of the solar disk. The other other program was equally good. There is no way that these careful observers was missing 40% of the spot groups. Svalgaard’s claims are just ridiculous.
The Solar Influences Data Analysis Center in Brussels, Belgium, will soon be able to identify sunspots that are a mere one hundreth the size of the controversial August “sunspecks”. “There will never again be a spotless month if we can help it”, a spokesman said.
The Solar Influences Data Analysis Center, Protecting Mankind From Solar Minima
Not Really
Leif Svalgaard (20:12:05) :
“And also unfortunate that they reported a [preliminary] SSN of 000 on the two days where Catania actually had data.”
I believe you’ve said that the process is relatively automatic. Do you know how they handle a situation where some stations report a spot, and others do not? I think knowing that is important to resolving questions about the integrity of the process. It seems to me that “averaging” the reports would be very misleading, so I doubt that is what they do. I mean, either a spot is there, or it is not. It is not “half a spot” if half the stations report it, and half of them do not. I don’t know what the threshold should be, since I don’t the issues underlying the measurements taken here, but it seems to me the only way for the process to work would be to report the spot if “X number” of stations report it. In this case, it seems that only Catania reported it. Surely the threshold should be higher than if “1 station” reports it.
You mention that the daily numbers are preliminary. So also is the monthly report at this time. (As you no doubt know, but for the benefit of others, a formal monthly report comes out about mid-month.) So what is the process by which preliminary numbers are made final? Knowing that, too, would seem important to understanding the integrity of the process.
Finally, you mention that there are ~60 stations that report sunspots. But from the few SIDC reports I’ve viewed, it would appear as if only a fraction of those stations are counted in the daily SIDC “ursigram.” I know stations fail to report on a given day from time to time, but surely not this many, this often. Is it a situation where SIDC is dependent on the individual stations reporting to them, and they go with what they’ve got, and that the small number of reporting stations is not an indication that observations were not actually taken at the non-reporting stations? Assuming that is the case, shouldn’t the monthly number be based on a more concerted effort to get what reports actually exist from all ~60 stations?
Is there a list of the stations anywhere?
Basil
After the explanations that Leif has provided, including his communication with SIDC specifically about this issue, I am satisfied that both NOAA and SIDC followed their own procedures.
No conspiracies or political influence need be invoked to explain what happened.
I found documentation on the NOAA SWPC website that adequately explained their procedures.
I didn’t find such documentation on the SIDC website, but the explanation Leif received and posted above cleared it up.
In that explanation, SIDC clearly seems to realize that their automated counting process is flawed, which raises serious concern about why they continue to use it, especially as Leif points out, without manual quality control – when NOAA and the NGDC database depend entirely on the SIDC count as the “official” number.
Mt. Wilson’s daily sunspot drawing yesterday contained the remark, “45 days without sunspots,” so at least unofficially, the streak goes on.
As a side note, the “Spotless August” story continues to circulate, on the web and in the popular press – no mention of the SIDC non-zero count or any of what we’ve been talking about.
I think that’s unfortunate, especially if we also have a “Spotless September,” as the total – unofficial – streak, however long it ends up, will take on something of an “Urban Legend” character.
Once again, Anthony provides THE place to get the truth and the whole story.
Leif wrote:
Thanks Leif for explicating the differences further. Such competitiveness in science! Reminds me of Kissinger’s comments about disputes in academia, but in this case the stakes have suddenly become big.
This discussion about sun”specks” is neither here nor there. The crucial question is whether the Sun was scrutinised to the same level of detail in the years under comparison. This is almost certainly not the case: 90 years ago there was no reason to find the last tiny “speck”, now apparently even a miniscule feature qualifies. The result of such a comparison is nonsensical. The data to me are totally convincing in that they show that the Sun is now is as little, or even less, “specked” than during a similar period about a century ago. Given that in many places a cooling trent is observed, ignoring the possibility that the Sun has something to do with it will only be defended by the religious, the true believers of the GW brigade.
Mauna Loa numbers out, looks like trend reestablished.
Tony:
Now really! How offtopical of you!
Just so we don’t get all groovy too quickly, Saddam retained 20 – 50 kilos of bomb-grade uranium permitted by the UN IAEA since 1991. Worse yet plutonium refinement efforts started anew in 1998 at al Tuwaitha.
Just to put this into perspective, the Hiroshima bomb was made using 25 kilos.
Ed Zuiderwijk:
The salient points should stand that this minimum is unique in its steep drop in sunspot activity in conjunction with much lower magnetic output. Leif rightly cites other deep minima that preceded strong solar cycles, so sunspot counts and TSI aren’t enough, even facular UV may not vary sufficiently in the long term to explain the statistical trend relationship between climate and sunspots.
That leaves us with solar magnetic output and cosmic rays. Historical C14 & Be10 data representing cosmic ray flux still fall all over the place despite the historical correlations (read: statistical trends) between long-term drops in sunspots and cooler climate.
So the science is incomplete, but are the historical trend correlations sufficient to make for good science? I surmise from Livingston’s and Janssens’ statements we might concede “No.” Whether the solar science community keeps a higher litmus for science than does the climate science community speaks better of solar science.
This leaves us with what seem salient but are still functionally anecdotal points of lowered solar output and a contemporaneous slight cooling trend with science lacking a solid causal link (not to denigrate Svensmark). In this case patience will prove a virtue and may prove a good nostrum for alarmism within the next few years.
To our benefit Leif has been willing to enter the fray and has been candid about his view on alarmist statements from either global cooling or warming blocs. This current heated debate about a solar pore will prove a minor blip in the overall outcome, the 10.7 cm magnetic flux appears to be gaining ground against the other metrics.
And purely speculative on my part, but AFAIK one climate factor that hasn’t been investigated is changes in marine thermomagnetic convection. Could flux in solar magnetism & wind interact sufficiently with the Earth’s magnetic field so to yield any effect in the seas?
Ed Zuiderwijk (06:49:13) :
“This discussion about sun”specks” is neither here nor there. The crucial question is whether the Sun was scrutinised to the same level of detail in the years under comparison. This is almost certainly not the case: 90 years ago there was no reason to find the last tiny “speck”…”
The speck or pore of August may well have been observed in 1913. The question is would it have been counted in 1913, and SHOULD it have been counted for August 2008.
It’s an important question as observing capabilities increase. Have a look at this image from 2002
http://antwrp.gsfc.nasa.gov/apod/ap021114.html
claimed to be one of the sharpest views of the sun ever.
Now the question is not merely what is a sunspot and what is not, but what is a penumbra and what is not.
If we can now resolve small penumbrae around very small spots that would have previously been considered pores without penumbrae, that confuses the situation even further.
“…Given that in many places a cooling trent is observed, ignoring the possibility that the Sun has something to do with it will only be defended by the religious, the true believers of the GW brigade.”
It’s going to be more difficult than that. As recently as Monday, cold climate was blamed on global warming.
http://news.smh.com.au/national/big-chill-a-symptom-of-climate-chaos-20080901-46yx.html
The “logic” seems to be, “if it’s this COLD, it must be even WARMER than we thought!”
I’ve been [casually] looking into the weather of 1913 – not serious research yet, mind you – looking for anecdotal similarities with this year.
One similarity is the dismal weather in Europe. It was funny to read the news archives about American tourists in Europe, “thoroughly disgusted,” and impatiently waiting for the next boat home.
The spring US tornado outbreaks were similar, as was the flooding (Indiana and Ohio with record floods).
The devastating Great Lakes Storm – 250 killed, 19 ships lost, 19 others stranded – well, that remains to be seen. I for one will not be planning a Great Lakes cruise this November.
In Denver, Colorado, Greatest Snowfall From One Storm (all-time): 45.7 inches December 1-6, 1913.
Another feature of 1913 weather was a warm Christmas, in many places in the US and in Europe. A warm Christmas this year would tend to deflate any popular notion of global cooling.
My point is, amongst the religious, yes, you are correct. And as the article from Sydney shows, colder weather merely PROVES global warming, for the true believers.
Amongst the vast majority of people, a cold winter this year will subject “AGW” to increasing mockery, and make political moves such as this year’s US Carbon Tax bill less and less likely, no matter who wins the election.
My prediction is for a cold winter, with frequent outbreaks of Arctic air across the US east of the Rockies, a predominant northwesterly wind flow in the upper Midwest and across the Great Lakes (a typical feature of an NAO (North Atlantic Oscillation) cold phase), leading to huge totals of lake-effect snow in the US “snow belt; frequent episodes of atmospheric “blocking” over the eastern North Atlantic (also typical of cold NAO), which cause Scandinavian and even Siberian Arctic air to stagnate over the UK and northern Europe, so this winter’s temperatures will average well below normal for the UK, Russia, and all of Europe north of the Alps.
Patterns which favor frequent US lake-effect snow also favor mild weather in the west (trough in the east, ridge in the west), so not as frigid west of the Rockies, but there will be significant snowfall in the Pacific Northwest, including Portland and Seattle metro areas.
News stories to watch for this cold winter:
Lake effect snow – cities in the “snow belt” buried under several feet of snow each big event;
another big Great Lakes Storm, with hurricane force winds;
substantial losses in the Florida citrus crop, AND in the Texas citrus crop (e.g. Lower Rio Grande valley grapefruit), due to penetration of Arctic air to low latitudes, which also means we will also see at least one “Tehuantepecer”
http://en.wikipedia.org/wiki/Tehuantepecer
news stories about the cold winter in the UK, Europe and Russia, including temperature records and snowfall records;
Some (DEFINITELY not a majority) of the “consensus” scientists cashing in their “AGW” chips and accepting that at the very least, the relationship between CO2 and temperature is not linear, and that the real climate does not behave according to the “AGW” hypothesis
One of the Biggest weather stories of winter 2008-2009 will of course be the price of heating oil. Especially for many people in the US northeast, this may be the least affordable winter ever.
Ironically, those of us electrically heated (especially with hydro), usually considered expensive and inefficient heating, may see very little change in our heating bills.
Good job at providing a story line to this event Anthony….. Far as I am concerned, they wouldn’t have spotted this 90 years ago or considered it relevant. Therefore it isn’t a spot for the purpose of our definition….. But of course it still is a noted feature.
Douglas Hoyt (04:41:16) :
Svalgaard claims that in the 1880s that only 60% of the sunspot groups were observed and 40% were missed. There are two photographic runs during that period and both of them agree with each other to better than 10%. The Royal Greenwich Observatory photographs measured sunspot areas to 1 millionth of the area of the solar disk. The other program was equally good. There is no way that these careful observers was missing 40% of the spot groups. Svalgaard’s claims are just ridiculous.
Once you begin to use words like ‘ridiculous’ about other people’s work it shows that emotions have taken hold of your critical sense. I am not saying that anybody’s measurements are wrong or careless. When splicing together a long time series from data taken by different observers there is always the issue of constancy of calibration and my claim is that the various calibrations employed for the splice(s) are not correct, and that therefore the time series are not homogeneous and their long-term trends suspect. Instead of going far back in time where it is very hard to reconstruct what went on, we can take one of the recent discontinuities and examine that. Between solar cycles 17 and 18 Max Waldmeier took over as ‘producer’ of the Zurich sunspot number, Rz. He introduced an artificial ‘jump’ in Rz of ~20%, in the sense that the Zurich sunspot number [and hence also the SIDC number, since it is spliced to the end of Rz trying to maintain a correct calibration across the change in 1979] since 1945 is too high by 20%. Similar jumps happened in the 1890s and in 1849 coincident with end and start of Wolf’s tenure.
But let us examine the most recent jump where we probably have the best data. To eliminate the issue of detrending we’ll only consider a relatively short interval on either side of the jump.
Since Rg is much less influenced by the jump caused by Waldmeier we shall assume that Rg was homogeneous across the jump [Doug can tell us if it was not]. We shall also assume that the sunspot areas measured at Greenwich were OK across the jump. So, [and everybody can do this quickly from publicly available data] let us simply compute the average Rz for solar cycles 16 and 17 [1923-1945] before the jump and for solar cycles 18 and 19 [1946-1964] after the jump and compare with:
1: averages of Rg [we find Rz to be 21% higher than Rg]
2: averages of sunspot areas [we find Rz to be 18% higher than the areas converted to equivalent sunspot numbers using the same formula throughout]
3: averages of geomagnetic variation rY [we find Rz to be 23% higher than rY converted to equivalent sunspot numbers using the same formula throughout]
So, these three independent methods all show the same jump. In particular, on might note that if rY also finds the same jump contrary to the claim by Mursula et al. that rY is too inaccurate for this.
So, it is possible to check on the calibrations, to discover that they are deficient, and to correct them. The last word on this is not in yet as there is a lot more 19th century geomagnetic data that can be used to corroborate the correction – and work is in progress to recover that data.
One might [as Hoyt does] automatically assume that the Group Sunspot number is by definition superior to anything else. Rg has, for example’ been used to ‘show’ that the Maunder Minimum was very well observed [even better than the sunspot number in the 19th century]. I show here [from Hoyt’s data] the purported observations by Picard in 1665:
NUMBER OF SUNSPOT GROUPS FOR THE YEAR: 1665
AS OBSERVED BY: PICARD, J., PARIS
Day Jan Feb Mar Apr May Jun Jul Aug Sep Oct Nov Dec
—————————————————————
1 0 0 0 0 0 0 0 0 0 0 0 0
2 0 0 0 0 0 0 0 0 0 0 0 0
3 0 0 0 0 0 0 0 0 0 0 0 0
4 0 0 0 0 0 0 0 0 0 0 0 0
5 0 0 0 0 0 0 0 0 0 0 0 0
6 0 0 0 0 0 0 0 0 0 0 0 0
7 0 0 0 0 0 0 0 0 0 0 0 0
8 0 0 0 0 0 0 0 0 0 0 0 0
9 0 0 0 0 0 0 0 0 0 0 0 0
10 0 0 0 0 0 0 0 0 0 0 0 0
11 0 0 0 0 0 0 0 0 0 0 0 0
12 0 0 0 0 0 0 0 0 0 0 0 0
13 0 0 0 0 0 0 0 0 0 0 0 0
14 0 0 0 0 0 0 0 0 0 0 0 0
15 0 0 0 0 0 0 0 0 0 0 0 0
16 0 0 0 0 0 0 0 0 0 0 0 0
17 0 0 0 0 0 0 0 0 0 0 0 0
18 0 0 0 0 0 0 0 0 0 0 0 0
19 0 0 0 0 0 0 0 0 0 0 0 0
20 0 0 0 0 0 0 0 0 0 0 0 0
21 0 0 0 0 0 0 0 0 0 0 0 0
22 0 0 0 0 0 0 0 0 0 0 0 0
23 0 0 0 0 0 0 0 0 0 0 0 0
24 0 0 0 0 0 0 0 0 0 0 0 0
25 0 0 0 0 0 0 0 0 0 0 0 0
26 0 0 0 0 0 0 0 0 0 0 0 0
27 0 0 0 0 0 0 0 0 0 0 0 0
28 0 0 0 0 0 0 0 0 0 0 0 0
29 0 -99 0 0 0 0 0 0 0 0 0 0
30 0 -99 0 0 0 0 0 0 0 0 0 0
31 0 -99 0 -99 0 -99 0 0 -99 0 -99 0
means: 0.0 0.0 0.0 0.0 0.0 0.0 0.0 0.0 0.0 0.0 0.0 0.0
[The -99 are days that do not exist, like February 31st]. From this tabulation one may see that Hoyt claims that Picard observed on every single day [in spite of the louse weather at the height of the LIA] and found not a single spot in 365 days of observations, giving a yearly sunspot [group] number of zero. For many [even most] of the other years and other observers it is the same story. This is clearly wrong as there must have been many days with overcast. Yet, this kind of ‘data’ is used to bolster Hoyt’s claim that the Maunder Minimum is very well established and that the Group Sunspot Number is on solid ground.
So, in closing, there are good reasons to believe that our various sunspot numbers series are not on firm ground and that conclusions based on them about long-term trends [e.g. as shown is some reconstructions of TSI] are shaky as well.
There is nothing ‘ridiculous’ in taking a good hard look at [sacrosanct] data and finding deficiencies.
Svalgaard states: “For many [even most] of the other years and other observers it is the same story. This is clearly wrong as there must have been many days with overcast.”
This statement is clearly not true and was treated by me in the paper
Hoyt, D.V., and K. H. Schatten, 1996. How well was the Maunder Minimum observed? Solar Physics, 165, 181-192.
There were very few periods longer than a week when the sun was not observed. Picard did observe actively in 1665 and there were zero spots during that year are based upon two independent statements. If you drop the years where all days are labeled zero, you still get a Maunder Minimum.
I did not say that Svalgaard’s re-examination was ridiculous. I said his conclusions for the 1880s that 40% of the sunspots were missed is ridiculous and I stand by that. The observers were not as bad as that.
The ratio Rz/Rg will be higher for periods when the sun is more active since it will pick up the complexity of sunspots through the count of individual spots in a group. Rz/Rg is a measure of complexity of sunspots.
IMO, this post’s gist centers on the significance of a “pore” spotted in Catania, and whether or not that “pore” should count as a “sunspot.” I did not notice any mention of a “sunspot pair” (allegedly?) observed in Slovakia on the same day — photo at http://www.universetoday.com/category/solar-astronomy/
What’s up with that?
Douglas Hoyt (10:04:59)
Svalgaard states: “For many [even most] of the other years and other observers it is the same story. This is clearly wrong as there must have been many days with overcast.”
This statement is clearly not true…
Well here are some others. If need be, I can show all of them, but I really don’t need to because you already know this.
NUMBER OF SUNSPOT GROUPS FOR THE YEAR: 1665
AS OBSERVED BY: FOGEL, M., HAMBURG
Day Jan Feb Mar Apr May Jun Jul Aug Sep Oct Nov Dec
—————————————————————
1 0 0 0 0 0 0 0 0 0 0 0 0
2 0 0 0 0 0 0 0 0 0 0 0 0
3 0 0 0 0 0 0 0 0 0 0 0 0
4 0 0 0 0 0 0 0 0 0 0 0 0
5 0 0 0 0 0 0 0 0 0 0 0 0
6 0 0 0 0 0 0 0 0 0 0 0 0
7 0 0 0 0 0 0 0 0 0 0 0 0
8 0 0 0 0 0 0 0 0 0 0 0 0
9 0 0 0 0 0 0 0 0 0 0 0 0
10 0 0 0 0 0 0 0 0 0 0 0 0
11 0 0 0 0 0 0 0 0 0 0 0 0
12 0 0 0 0 0 0 0 0 0 0 0 0
13 0 0 0 0 0 0 0 0 0 0 0 0
14 0 0 0 0 0 0 0 0 0 0 0 0
15 0 0 0 0 0 0 0 0 0 0 0 0
16 0 0 0 0 0 0 0 0 0 0 0 0
17 0 0 0 0 0 0 0 0 0 0 0 0
18 0 0 0 0 0 0 0 0 0 0 0 0
19 0 0 0 0 0 0 0 0 0 0 0 0
20 0 0 0 0 0 0 0 0 0 0 0 0
21 0 0 0 0 0 0 0 0 0 0 0 0
22 0 0 0 0 0 0 0 0 0 0 0 0
23 0 0 0 0 0 0 0 0 0 0 0 0
24 0 0 0 0 0 0 0 0 0 0 0 0
25 0 0 0 0 0 0 0 0 0 0 0 0
26 0 0 0 0 0 0 0 0 0 0 0 0
27 0 0 0 0 0 0 0 0 0 0 0 0
28 0 0 0 0 0 0 0 0 0 0 0 0
29 0 -99 0 0 0 0 0 0 0 0 0 0
30 0 -99 0 0 0 0 0 0 0 0 0 0
31 0 -99 0 -99 0 -99 0 0 -99 0 -99 0
means: 0.0 0.0 0.0 0.0 0.0 0.0 0.0 0.0 0.0 0.0 0.0 0.0
Fogel in Hamburg also had a perfect record. no clouds there either.
For 1664:
NUMBER OF SUNSPOT GROUPS FOR THE YEAR: 1664
AS OBSERVED BY: PICARD, J., PARIS
Day Jan Feb Mar Apr May Jun Jul Aug Sep Oct Nov Dec
—————————————————————
1 0 0 0 0 0 0 0 0 0 0 0 0
2 0 0 0 0 0 0 0 0 0 0 0 0
3 0 0 0 0 0 0 0 0 0 0 0 0
4 0 0 0 0 0 0 0 0 0 0 0 0
5 0 0 0 0 0 0 0 0 0 0 0 0
6 0 0 0 0 0 0 0 0 0 0 0 0
7 0 0 0 0 0 0 0 0 0 0 0 0
8 0 0 0 0 0 0 0 0 0 0 0 0
9 0 0 0 0 0 0 0 0 0 0 0 0
10 0 0 0 0 0 0 0 0 0 0 0 0
11 0 0 0 0 0 0 0 0 0 0 0 0
12 0 0 0 0 0 0 0 0 0 0 0 0
13 0 0 0 0 0 0 0 0 0 0 0 0
14 0 0 0 0 0 0 0 0 0 0 0 0
15 0 0 0 0 0 0 0 0 0 0 0 0
16 0 0 0 0 0 0 0 0 0 0 0 0
17 0 0 0 0 0 0 0 0 0 0 0 0
18 0 0 0 0 0 0 0 0 0 0 0 0
19 0 0 0 0 0 0 0 0 0 0 0 0
20 0 0 0 0 0 0 0 0 0 0 0 0
21 0 0 0 0 0 0 0 0 0 0 0 0
22 0 0 0 0 0 0 0 0 0 0 0 0
23 0 0 0 0 0 0 0 0 0 0 0 0
24 0 0 0 0 0 0 0 0 0 0 0 0
25 0 0 0 0 0 0 0 0 0 0 0 0
26 0 0 0 0 0 0 0 0 0 0 0 0
27 0 0 0 0 0 0 0 0 0 0 0 0
28 0 0 0 0 0 0 0 0 0 0 0 0
29 0 0 0 0 0 0 0 0 0 0 0 0
30 0 -99 0 0 0 0 0 0 0 0 0 0
31 0 -99 0 -99 0 -99 0 0 -99 0 -99 0
means: 0.0 0.0 0.0 0.0 0.0 0.0 0.0 0.0 0.0 0.0 0.0 0.0
Picard has perfect weather 1664
NUMBER OF SUNSPOT GROUPS FOR THE YEAR: 1664
AS OBSERVED BY: FOGEL, M., HAMBURG
Day Jan Feb Mar Apr May Jun Jul Aug Sep Oct Nov Dec
—————————————————————
1 0 0 0 0 0 0 0 0 0 0 0 0
2 0 0 0 0 0 0 0 0 0 0 0 0
3 0 0 0 0 0 0 0 0 0 0 0 0
4 0 0 0 0 0 0 0 0 0 0 0 0
5 0 0 0 0 0 0 0 0 0 0 0 0
6 0 0 0 0 0 0 0 0 0 0 0 0
7 0 0 0 0 0 0 0 0 0 0 0 0
8 0 0 0 0 0 0 0 0 0 0 0 0
9 0 0 0 0 0 0 0 0 0 0 0 0
10 0 0 0 0 0 0 0 0 0 0 0 0
11 0 0 0 0 0 0 0 0 0 0 0 0
12 0 0 0 0 0 0 0 0 0 0 0 0
13 0 0 0 0 0 0 0 0 0 0 0 0
14 0 0 0 0 0 0 0 0 0 0 0 0
15 0 0 0 0 0 0 0 0 0 0 0 0
16 0 0 0 0 0 0 0 0 0 0 0 0
17 0 0 0 0 0 0 0 0 0 0 0 0
18 0 0 0 0 0 0 0 0 0 0 0 0
19 0 0 0 0 0 0 0 0 0 0 0 0
20 0 0 0 0 0 0 0 0 0 0 0 0
21 0 0 0 0 0 0 0 0 0 0 0 0
22 0 0 0 0 0 0 0 0 0 0 0 0
23 0 0 0 0 0 0 0 0 0 0 0 0
24 0 0 0 0 0 0 0 0 0 0 0 0
25 0 0 0 0 0 0 0 0 0 0 0 0
26 0 0 0 0 0 0 0 0 0 0 0 0
27 0 0 0 0 0 0 0 0 0 0 0 0
28 0 0 0 0 0 0 0 0 0 0 0 0
29 0 0 0 0 0 0 0 0 0 0 0 0
30 0 -99 0 0 0 0 0 0 0 0 0 0
31 0 -99 0 -99 0 -99 0 0 -99 0 -99 0
means: 0.0 0.0 0.0 0.0 0.0 0.0 0.0 0.0 0.0 0.0 0.0 0.0
\
Fogel, too
NUMBER OF SUNSPOT GROUPS FOR THE YEAR: 1664
AS OBSERVED BY: WEIGEL, E., JENA
Day Jan Feb Mar Apr May Jun Jul Aug Sep Oct Nov Dec
—————————————————————
1 0 0 0 0 0 0 0 0 0 0 0 0
2 0 0 0 0 0 0 0 0 0 0 0 0
3 0 0 0 0 0 0 0 0 0 0 0 0
4 0 0 0 0 0 0 0 0 0 0 0 0
5 0 0 0 0 0 0 0 0 0 0 0 0
6 0 0 0 0 0 0 0 0 0 0 0 0
7 0 0 0 0 0 0 0 0 0 0 0 0
8 0 0 0 0 0 0 0 0 0 0 0 0
9 0 0 0 0 0 0 0 0 0 0 0 0
10 0 0 0 0 0 0 0 0 0 0 0 0
11 0 0 0 0 0 0 0 0 0 0 0 0
12 0 0 0 0 0 0 0 0 0 0 0 0
13 0 0 0 0 0 0 0 0 0 0 0 0
14 0 0 0 0 0 0 0 0 0 0 0 0
15 0 0 0 0 0 0 0 0 0 0 0 0
16 0 0 0 0 0 0 0 0 0 0 0 0
17 0 0 0 0 0 0 0 0 0 0 0 0
18 0 0 0 0 0 0 0 0 0 0 0 0
19 0 0 0 0 0 0 0 0 0 0 0 0
20 0 0 0 0 0 0 0 0 0 0 0 0
21 0 0 0 0 0 0 0 0 0 0 0 0
22 0 0 0 0 0 0 0 0 0 0 0 0
23 0 0 0 0 0 0 0 0 0 0 0 0
24 0 0 0 0 0 0 0 0 0 0 0 0
25 0 0 0 0 0 0 0 0 0 0 0 0
26 0 0 0 0 0 0 0 0 0 0 0 0
27 0 0 0 0 0 0 0 0 0 0 0 0
28 0 0 0 0 0 0 0 0 0 0 0 0
29 0 0 0 0 0 0 0 0 0 0 0 0
30 0 -99 0 0 0 0 0 0 0 0 0 0
31 0 -99 0 -99 0 -99 0 0 -99 0 -99 0
means: 0.0 0.0 0.0 0.0 0.0 0.0 0.0 0.0 0.0 0.0 0.0 0.0
And Weigel !
Hoyt, you represent these tables as observations. As raw data.
I have not [yet] studied all the original records, but is is not credible that there were no data gaps. Perhaps Picard said “in all of 1665 I didn’t see a single spot”. That is not the same as making up data that purports to document that he observed on every single day, missing missing one, never having a cloud to obscure his view all day long, in spite of the supposedly bad waether during the LIA.
The ratio Rz/Rg will be higher for periods when the sun is more active since it will pick up the complexity of sunspots through the count of individual spots in a group. Rz/Rg is a measure of complexity of sunspots.
There is some truth to that [as the ratio changes slightly within a cycle], but that is a second order effect, as you and the readers on this blog can verify by looking at page 11 of http://www.leif.org/research/AGU%20Spring%202008%20SP23A-07.pdf . I don’t think the complexity of the sunspots changes when the observer changes.
There were very few periods longer than a week when the sun was not observed
Yet your raw data shows none of those missing observations. You show a perfect record. And, of course, may have some reasons to make up the data, like “well, this is the Maunder minimum, after, all, so even when he didn’t observe for a week there probably weren’t any spots anyway”. But making up data like this is, in my book, not a thing to do.
Douglas Hoyt (10:04:59) :
If you drop the years where all days are labeled zero, you still get a Maunder Minimum.
Doug, your statement here reminds me of an occasion where Uri Geller [the spoon-bender] was debunked by showing that he had cheated and switched spoons. A true believer commented: “so what, he cheated this time, but there were many other times where his exploits were genuine…” 🙂
Svalgaard, you are getting very emotional. The years where all zero spots are used are based upon statements by observers that no spots were observed by them that year. The original observations recording the exact dates of observations are now lost. You have to go with the observations you have. Again this was covered in the paper I referred to above.
There are at least 14 statements giving beginning and end dates where people reported no sunspots. In my research, I uncovered some previously unknown observers who did give dates and in all cases it confirmed the 14 statements.
I have looked at the rY time series and I would say it has discontinuities in it at 1900 and 1950, not the 1893 and 1945 dates that you give. The dates 1900 and 1950 have nothing to do with changes in Rz observers.
The rY series would appear to be the inhomogeneous time series which doesn’t agree with direct observations of the sun.
Douglas Hoyt (10:04:59) :
The ratio Rz/Rg will be higher for periods when the sun is more active since it will pick up the complexity of sunspots through the count of individual spots in a group.
So, Rz/Rg is high when R [either one of them] is high, this, of course, means that the inverse is also true: Rg/Rz is low when R is low. I do not doubt this. It means that the sunspot number series measured by Rg is skewed towards even lower numbers at low activity [compared to Rz], enhancing any upward trend [cycles 18-22 were generally high] thus making it look like there is an even bigger long-term change.
Now, one can argue which one to use. Rg or Rz? Since you stopped producing Rg 13 years ago, there is a tendency for people to use Rz [or its modern equivalent Ri], except, of course, if they want to show that the sunspot number was much lower in the past – then they will use the lowest series they can find. Personally, I have no real preference, as long as one can get to a correctly calibrated series. My point being that we are not there yet.
I don’t know if anybody else is following this exchange [that may be a bit arcane] and a blog like this may not be the best place for it. Especially not when people begin to get hot under the collar.
I guess that I forgot a closing ‘italic’ token, here is what it should be:
Douglas Hoyt (10:04:59) :
The ratio Rz/Rg will be higher for periods when the sun is more active since it will pick up the complexity of sunspots through the count of individual spots in a group.
So, Rz/Rg is high when R [either one of them] is high, this, of course, means that the inverse is also true: Rg/Rz is low [… as in the previous post…]
Douglas Hoyt (11:09:33) :
I have looked at the rY time series and I would say it has discontinuities in it at 1900 and 1950, not the 1893 and 1945 dates that you give. The dates 1900 and 1950 have nothing to do with changes in Rz observers.
The discontinuities are not in rY. It doesn’t have any. !945 was a sunspot minimum year and any problems with the sunspot number would only begin to show a few years later.
The rY series would appear to be the inhomogeneous time series which doesn’t agree with direct observations of the sun.
rY since 1890 is based on continuous [objective] observations from the German station Potsdam-Seddin-Niemegk supported by several other long-term series Vieques-San Juan [1902-today], and Cheltenham-Fredricksburg [1901-today]. The ‘direct observations’ are subjective assessments of the rules to use, to wit the very debate in this blog.
Leif Svalgaard (11:16:34) :
“I don’t know if anybody else is following this exchange [that may be a bit arcane] and a blog like this may not be the best place for it.”
By all means, continue (as long as Anthony is ok with it).
What’s been exposed in the August pore controversy is a significant counting problem that needs a resolution somehow.
Do you agree that increased resolution of observations, including SDO (Solar Dynamics Observatory) satellite observations available perhaps as early as this winter – said to be much higher resolution than SOHO, STEREO, etc., – will aggravate this problem in the future?
How will such extremely high-resolution (spatial AND temporal) observations be reconciled with the lower resolution historical record?
REPLY: Carry on, all the conversation is relevant. – Anthony
John-X (11:40:51) :
What’s been exposed in the August pore controversy is a significant counting problem that needs a resolution somehow.
Do you agree that increased resolution of observations, including SDO (Solar Dynamics Observatory) satellite observations available perhaps as early as this winter – said to be much higher resolution than SOHO, STEREO, etc., – will aggravate this problem in the future?
There are three issues here:
1: the current discrepancy wrt Aug.21-22. This is just the result of slightly different rules and perhaps some sloppiness and lack of quality control. There is, perhaps, a slight chance of improvement and more transparency and that is always good.
2: The much higher resolution data is not needed for counting sunspots. What is needed is an index of solar activity or even several such indices as a single number does not cover the complexity of solar activity. There already better indices, e.g. F10.7 and MgII.
3: The real problem is accurate calibration of the historical record with the latest index or indices and that is an ongoing research topic [or should be – because I don’t think the record is correctly calibration. Doug may think that his Group Sunspot Number is the last word like when he said that “this has already been done” as response to my call for a better calibration.
The long-term calibration is extremely important in view of the worry about climate change on the Earth and in space [yes, there is something called ‘space climate’ – http://www.issc2.ro/ ]. Long-term planning requires long-term assessment of the ‘boundary condition’ under which all our actions take place. Both the trends and the extremes [the two parts of ‘climate’].
“Since you stopped producing Rg 13 years ago . . .” The reason it was not extended beyond that time is because my position did not allow it. Indeed my position did not allow any publications. Partly because of these restraints, I retired in 2000.
“The discontinuities are not in rY.” I should have said the discontinuities in the differences between Rz and rY appear to be around 1900 and 1950.
“rY since 1890 is based on continuous [objective] observations from the German station Potsdam-Seddin-Niemegk . . .” And Rg since 1874 is based largely upon continuous [objective photographs overlain with a grid that can detect spots larger than 1 millionth of the solar disk] observations of sunspot groups by the Royal Greenwich Observatory (RGO). RGO doesn’t have observing technique changes at 1893 and 1945 or at 1900 and 1950.
I am busy writing a book and have another book come in the mail today that I am obligated to read and review, so I will cease commenting on this thread.
Douglas Hoyt (12:29:18) :
I am busy writing a book and have another book come in the mail today that I am obligated to read and review, so I will cease commenting on this thread.
Doug, good luck with your book and thank you [and Ken] for the tremendous amount of wonderful detective work involved in digging up all those old sunspot observations. Work that rivals Wolf’s. Now it is up to the rest of us to make sense of it all and calibrate everything so future research can proceed confidently on a solid foundation.
Best,
Leif
Well, I wasn’t going to comment again, but I do have one question. Did any metal buildings go up around the Potsdam rY station in the 1890s and 1940s that could effect their measurements? Or changes within the buildings themselves?
Thanks for the compliment, Leif.
[…] Doch er ist ausgeblieben. Jetzt zeigt sich, dass der August der erste Monat seit 1913 war, in dem kein einziger Sonnenfleck beobachtet werden konnte. Nun gibt es einen Zusammenhang zwischen […]
Douglas Hoyt (13:09:16) :
Well, I wasn’t going to comment again, but I do have one question. Did any metal buildings go up around the Potsdam rY station in the 1890s and 1940s that could effect their measurements? Or changes within the buildings themselves?
Geomagnetic observatories are deliberately located in ‘remote’ areas and the measurements are made in specially constructed non-magnetic building in open field, far from anything else. The main problem is urban growth that makes once ‘remote’ areas less remove with time. Electric trams and trains also louse up the data. These environmental conditions are carefully monitored and the stations moved slightly to prevent disturbances from becoming problematic. The observatory moved from Potsdam to nearby Seddin in 1909 and from Seddin to nearby Niemegk in 1932. The old and new stations were run in parallel for several years to ensure that the data is homogeneous. In fact, even before a new site is selected, several sites are surveyed and tested, such as to ensure that conditions are as much as possible the same at the old and new stations. In any event, the disturbances that the observers fuss about when deciding to move are an order of magnitude or more smaller than the range (rY) if the daily variation. So are not a problem [that’s why they move the stations in the first place – to avoid having a problem].
Thanks for the compliment, Leif.
It is well deserved.
REPLY: Sounds like our surface thermometer problem, except climate scientists don’t seem to bother moving thermometers when they go askew, they simply say they can “correct” the measurment environment.
Lets call this one the Urban Magnetic Effect “UMI” – Anthony
Leif Svalgaard (14:02:48) :
REPLY: Sounds like our surface thermometer problem, except climate scientists don’t seem to bother moving thermometers when they go askew, they simply say they can “correct” the measurement environment.
Maybe they can correct if done ‘correctly’. So, just like with the sunspots it all comes down to how you calibrate old data. This calibration problem does not exist in the same sense for the geomagnetic data because it is dealt with explicitly and prevented from even occurring.
There is still the problem of the ‘thermometer’ itself changing with time: The Earth’s magnetic field is decreasing; that increases the conductivity in the ionosphere and hence the electric currents that flow there. These currents produce the magnetic effect [rY] that I [and Rudolf Wolf !] use to calibrate the SSN. To get a correct calibration, one must first remove the known drift of the instrument, hence the debate about the ‘detrending’.
Ric Werme (10:13:33) :
What puzzles me is how an equation like k(10g+s) can yield 4. Leif, can you explain that a bit better?
If g=1 and s=1, the SSN would be 10*1+1=11 without the k-factor. Let’s say that a certain observatory has a bigger telescope than our standard observatory so that they see three times as many spots, then its SSN would be 10*1+3 = 13. To be able to compare the two numbers, one sets k=11/13 for the observatory with the bigger telescope. Of course, k is not determined from just one case, so many years of data go into determination of k. Ideally, since each observer has his own k, all sunspot number series should agree [they don’t, of course, but close enough].
“emotions have taken hold of your critical sense”
Hume dispensed with the illusion of Dispassionate Reason some time back.
“By all means, continue”
And when the discussion of whether something needs doing is finished, lets hear re: the very many issues with what was done by Svalgaard and Cliver, please.
Gary Gulrud (16:02:51) :
lets hear re: the very many issues with what was done by Svalgaard and Cliver, please.
If you are really interested, please lay out what particular subjects [but stay on topic] have you special interest and attention. What keeps you awake at night that we can help alleviate. With Anthony’s concurrence I’ll be glad to spread some light in the darkness.
Wow. I guess Anthony needs to buy a ticket on the Shuttle. Next stop, GOES. But I think he will need a bit more support to survey THESE stations.
Apologies if this has already been pointed out. Some sunspots appear to be much easier to identify if the “correct” filters are used during observation.
Therefore a better definition of “sunspot” is needed, such as “it appears in at least 3 filters” or “it can be seen in the SOHO MDI channel” or whatever else. Otherwise when the Sun wakes up, the count is going to be truly enormous, and comparisons with the past impossible.
I want a free trip in the space ! i would love that, to see the earth , the sun like in that film… “Sunshine” !
Dr. Tony Phillips at the excellent website
http://spaceweather.com
has weighed in on the August sunspot controversy.
You should read his remarks in their entirety. Here is a brief excerpt
“…There has been much speculation in the solar “blogosphere” about the length of the ongoing solar minimum. The sun has been mostly blank for a long time and people are wondering when the next solar cycle is going to begin. Some observers claim we’re entering a climate-altering minimum of historic proportions.
“There’s no evidence to back up these claims…
“…If the sun remains blank for another year, it’s time to re-think our assurances, but for now, all is well.”
[…] post, my interested was piqued when I found out that the sun is extremely quiet currently, with one or perhaps zero sunspots in a month for the first time since 1913 (see […]
John-X (14:32:00) :
“…There has been much speculation in the solar “blogosphere” about the length of the ongoing solar minimum. The sun has been mostly blank for a long time and people are wondering when the next solar cycle is going to begin. Some observers claim we’re entering a climate-altering minimum of historic proportions.
“There’s no evidence to back up these claims…
Indeed, Dr. Phillips is right on.
not sure about the “historic proportions” but sure it does look like a different one than the previous 8 cycles…
http://users.telenet.be/j.janssens/Spotless/Spotlessevolution.png
http://users.telenet.be/j.janssens/Spotless/Spotlessallcycles.png
Historic? It certainly does looks like it. Climate-altering? May be, or may not.
There must be a middle way between absurdist claims of the world going to be shattered, and tut-tutting
omnologos (15:51:23) :
not sure about the “historic proportions” but sure it does look like a different one than the previous 8 cycles…
http://users.telenet.be/j.janssens/Spotless/Spotlessevolution.png
If you look closely, you can see the blue line having light blue, dashed lines on either side, and the red line having pink, dashed lines on either side. These are ‘uncertainty’ bands. The green curve is squarely inside both dashed bands and there is therefore no statistically significant ground for saying that the green belongs with the red or with the blue. Hence, the current situation is very much within the normal variation and is not unusual at all.
[…] the back-and-forth revelations about August 2008 being spotless for the whole of humanity apart from one observer in Ca…, whose keen eye has made both SIDC and NOAA change their mind, a friend pointed me in the direction […]
I knew such a comment would be coming and that’s why I posted the link to the second graph too.
I agree that there is nothing yet to shout about. But of cycles 16 to 23 the one most resembling 24 is 18, and higher than that there’s only 16 and 17.
Also look how the curves peaked at an ever lower level between 16 and 23 (I may be confused by the various colors there but the statement before is generally true if I am not mistaken).
Cycle 24 is “historic” in the sense that it has reversed the downward trend. By how much? And should we care? I do not know. Let’s see how it evolves.
When there will be more data, we will be able to claim if the variation is “normal” nor not. But for now, is silence the only option?
By the way: I just published a blog with links to two PSPT solar picture archives.
For that blog I have extracted the pictures from Aug 21-22 showing how activity was indeed visible, but not exactly to the human eye…
omnologos (16:51:25) :
Cycle 24 is “historic” in the sense that it has reversed the downward trend. By how much? And should we care? I do not know. Let’s see how it evolves.
Be sure not to conflate high and low. The graphs show days with no spots, hence going high means lower activity. You say that cycle 24 most resembles cycle 18. Cycle 18 was one of most active cycles observed, rivaling cycles 21 and 22. So, will cycle 24 be a high cycle or a low cycle?
Leif Svalgaard (14:52:37) :
“…Indeed, Dr. Phillips is right on.”
subject to “re-thinking,” as he says
“…If the sun remains blank for another year, it’s time to re-think our assurances, but for now, all is well.”
I wonder why Dr. Phillips would say this…
Surely, whether Cycle 23 is 12 years, 13 years, or umpteen years, all is well.
Surely if Cycle 24 never produces another spot, all is well.
What difference would it make, other than for purely academic and aesthetic interests?
Why would any assurances need to be re-thought?
Is he talking about assurances to satellite operators? To NASA astronauts? To ham radio operators? To astronomers? To whom?
Who is being assured of what, and what will they or we be assured of if the assurances are re-thought?
Does Dr. Phillips KNOW all is well, or does Dr. Phillips HOPE all is well?
Geez, I know I’m reading too much into this, but now I’m worried – what is it that is going to become – UNWELL –
“…If the sun remains blank for another year…”
?
JohnX,
Those are some really good questions. I hope Leif takes a shot at them.
John-X (19:13:59) :
Leif Svalgaard (14:52:37) : “…Indeed, Dr. Phillips is right on.”
subject to “re-thinking,” as he says
That is just CYA-stuff.
“…If the sun remains blank for another year…”
I would actually welcome a blank Sun for a couple of decades. that would allow us to test our understanding of solar physics by providing us with the ‘ground-state’ of the system Many nonsensical notions would be cleared away…
Don’t be afraid of another LIA. The Spoerer solar minimum was deeper than the Maunder minimum, and yet the temperature was high.
Leif Svalgaard (17:19:27) :
You say that cycle 24 most resembles cycle 18. Cycle 18 was one of most active cycles observed, rivaling cycles 21 and 22. So, will cycle 24 be a high cycle or a low cycle?
most interesting times indeed, we are living
Maurizio Morabito says.
Apologies if this has already been pointed out. Some sunspots appear to be much easier to identify if the “correct” filters are used during observation.
Could I ask if these same filters were used in the early 1800`s or before.
If modern observations are to be compared with historical ones should not historical equipment be used in tandem with modern equipment, this all reminds me of the increase in hurricanes in recent years, better equipment = more hurricanes.
Another question…if the G-band (C) filter is used to identify sunspots more easily:
then what should one make of the quite-low contrast feature visible on Aug 21? Or is that the definition of a “pore”?
just asking
Rob (06:03:14) :
omnologos (06:25:48) :
about newer technology for detection of spots
Solar physicists are [and have long been] keenly aware of the issues stemming from improved techniques, and have tried their best to correct for them such as to preserve the uniform calibration of the sunspot series. Much of the discussion about this centers on how good those corrections are. The effect of solar activity on the Earth’s ionosphere and the subsequent geomagnetic response is independent of our improving technology, as the response is of the order of 5-10 minutes of arc, which has been achievable since the 18th century. So there is a direct and technology-independent way of calibrating the solar observations.
NEWS
NOAA SWPC (Space Weather Prediction Center) Solar Cycle progression page (graphs) updated with data through August 31
http://www.swpc.noaa.gov/SolarCycle/
Leif Svalgaard (20:04:23) :
“…Don’t be afraid of another LIA…”
Hey, who’s afraid?
Without the Little Ice Age, ice skates may not have been invented.
No ice skates, no hockey.
No hockey, no hockey moms.
I say L.I.A. NOW!
“I’ll be glad to spread some light in the darkness.”
Oh, dear, me lead? Again toss questions into the abyss?
Ok, new queries only.
What does one hope to gain linearly regressing non-linear functions? Are the non-linear functions, in fact, colinear?
Why then cast about for the best fit for a slope coefficient?
Why is using smoothed data tenable? Does it have anything to do with the foregoing issues?
What kind of noise are you eradicating with the lost data, white, brown, red,…?
“Solar Cycle progression page (graphs)”
What an improbable turn the Sun is about to take! Surely it’ll black out from the excessive G-force.
Gary Gulrud (14:37:42) :
Oh, dear, me lead? Again toss questions into the abyss?
Ok, new queries only.
You will have to be specific [data, paper, equation, …], otherwise they are just going into the abyss.
Leif “The Spoerer solar minimum was deeper than the Maunder minimum, and yet the temperature was high.”
How do you figure that, and where was the temperature “high”?
The Spoerer Minimum is said to have occured 1415–1534 A.D.
From Wiki:
“Starting in the 13th century, pack ice began advancing southwards in the North Atlantic, as did glaciers in Greenland. The three years of torrential rains beginning in 1315 ushered in an era of unpredictable weather in Northern Europe which did not lift until the 19th century. There is anecdotal evidence of expanding glaciers almost worldwide. In contrast, a climate reconstruction based on glacial length[3] shows no great variation from 1600 to 1850, though it shows strong retreat thereafter.
For this reason, any of several dates ranging over 400 years may indicate the beginning of the Little Ice Age:
1250 for when Atlantic pack ice began to grow
1300 for when warm summers stopped being dependable in Northern Europe
1315 for the rains and Great Famine of 1315-1317
1550 for theorized beginning of worldwide glacial expansion
1650 for the first climatic minimum”
http://en.wikipedia.org/wiki/Little_Ice_Age
Leif “The Spoerer solar minimum was deeper than the Maunder minimum, and yet the temperature was high.”
How do you figure that, and where was the temperature “high”?
Now what has the Spoerer minimum to do with your ill-befitting high-brow previous lament:
What does one hope to gain linearly regressing non-linear functions? Are the non-linear functions, in fact, colinear?
Why then cast about for the best fit for a slope coefficient?
Why is using smoothed data tenable? Does it have anything to do with the foregoing issues?
What kind of noise are you eradicating with the lost data, white, brown, red,…?
But let that slide. Now for the Spoerer minimum.
If we assume that solar activity modulates GCRs, then we can use 10Be and 14C to gauge the depth of the minima, that’s how we know their relative depths. At http://www.leif.org/research/TSI%20From%20McCracken%20HMF.pdf page 2 you can see for your self. Please do not get distracted by the calibration error around 1950. It does not alter the relative depths of the Spoerer and Maunder minima.
You may assume, that when I make a statement that the Spoerer minimum was deeper, that in fact it was [to the best of the evidence].
Now about the temperature. Temperature reconstructions are difficult to get correct because of the determined effort of some to produce a hockey stick. An important series of data that has recently become available suggests the following reconstruction:
http://www.climateaudit.org/wp-content/uploads/2008/07/tornet78.gif
You can follow the long discussion of this on climateaudit.
Leif,
So the Spoerer minimum (1415–1534 A.D.) was “deep”. As to temperatures as you say being “high”, I find the unequivocal statement to be a little bold in light of the fact, as you say, reconstructions being “difficult”. Yet Mann’s Hockey stick shows a considerable drop around 1400 -1600 AD, and then there is the historical evidence of climate change to the colder and wetter at least in the northern hemisphere. It follows the medieval warm period: “Medieval Warm Period was a time of warm weather around 800-1300 AD during the European Medieval period. Initial research on the MWP and the following Little Ice Age (LIA) was largely done in Europe, where the phenomenon was most obvious and clearly documented.”
http://en.wikipedia.org/wiki/Medieval_Warm_Period
Funny that AGWers talk down regional changes as if they aren’t the result of global changes, yet when something happens regionally, as in the Arctic melt, it’s said to be part of global climate change.
But to get back on track, I’ll ask again, what makes you so sure that at the time of the Spoerer Minimum temperatures were “high”, and where were they “high”?
Glenn (16:08:58) :
then there is the historical evidence of climate change to the colder and wetter at least in the northern hemisphere.
The evidence you cited:
1250 for when Atlantic pack ice began to grow
1300 for when warm summers stopped being dependable in Northern Europe
1315 for the rains and Great Famine of 1315-1317
[…here is the Spoerer minimum…, no mention of cold…]
1550 for theorized beginning of worldwide glacial expansion
1650 for the first climatic minimum
notes cold periods before and after the SM, but not during, consistent with the Tornetraesk [Northern Europe] graph I referred you to [did you look at it?].
A global perspective [albeit with poorer time resolution] comes from analysis of 20,000 boreholes all over the world. You can read about it here “Huang, S. P., H. N. Pollack, and P.-Y. Shen
A late Quaternary climate reconstruction based on borehole heat flux data, borehole temperature data, and the instrumental recordGeophys. Res. Lett., 35, L13703, doi:10.1029/2008GL034187. 4 July 2008
or just look at their main Figure here: http://www.leif.org/research/T-Boreholes.png
It shows that the little Ice age did not start before 1500. You see, when I make statements they are backed by evidence from scientific papers that I have read carefully [not Wikipedia]. As with all reconstructions there are always uncertainties, but they work both ways. You might as well doubt that it was cold during the SM since [as you claim] the data is so poor.
Another reference:
Phenological data series of cherry tree flowering in Kyoto, Japan, and its application to reconstruction of springtime temperatures since the 9th century by Yasuyuki Aono *, Keiko Kazui
has this:
ABSTRACT
Changes in springtime temperature in Kyoto, Japan, since the 9th century were reconstructed, using the phenological data series for cherry tree (Prunus jamasakura), deduced from old diaries and chronicles. Phenological data for 732 years was made available by combining data from previous studies. The full-flowering date of cherry trees fluctuates in accordance with temperature conditions during February and March.[…] Calibration enabled accurate estimation of temperatures in the instrumental period, after 1880; the root mean square error (RMSE) of temperature estimates was determined to be within 0.1 °C, after smoothing by local linear regression over time spans of 31 years. The results suggested the existence of four cold periods, 1330-1350, [Spoerer minimum here], 1520-1550, 1670-1700, and 1825-1830, during which periods the estimated March mean temperature was 4-5 °C, about 3-4 °C lower than the present normal temperature[…].
Again showing that there was no dramatic cooling in Japan during the SM. It would seem that the notion that Grand Solar Minima’s connection with cold climate is not well founded.
—
As I have said, you may assume that I know what I’m talking about when I make statements. Of course, ‘know’ is a big word, so should always be interpreted as ‘as far as I can tell from the evidence’.
Leif, In your last post you have me confused with Gary Galrud, although I may be guilty as well of “ill-befitting high-brow previous lament”.
Glenn: I forgot the reference: “International Journal of Climatology, Volume 28 Issue 7, Pages 905 – 914, 1 Aug 2007, DOI: 10.1002/joc.1594. Do me the favor of reading it.
Hmm. I had thought the Greenland colonies were hulled in well before 1500. Am I mistaken?
You know as well as I that we could trade references, or as you say “evidence” all day long, and not come to an agreement. Some are in support of your contention, some are not.
It appears to me that you are trying to impress and argue from authority. If so, would you really want to convince others on that basis?
I’ll put historical narratives about famine and cold weather above borehole data anyday, and I did not as you say, claim that the data is poor. You did.
Of course you can equivocate on what “cold” is, but from your last reference, I’d say that 3 or 4C below present temp can not be interpreted as not being “cold”. And that is in Japan, not a global temp decrease for those Minimas. But from that article “The results suggested the existence of four cold periods…” You do realize that “cold” is not quite the same as your statement “and yet the temperature was high”?
evanjones (18:21:03) :
Hmm. I had thought the Greenland colonies were hulled in well before 1500. Am I mistaken?
No, they were done in by the cold in the 1300s, and strife with the Inuit. In 1350 somebody was sent to the northern settlement – Vesterbygden – but all he met were Inuit. The last written proof of the Norse in Greenland was a wedding in the Hvalsey Church in 1408 [or 1407?]. After that they were gone [or at least we have no records or 14C dates any later].
Wiki has”The Western Settlement was abandoned around 1350. In 1378, there was no longer a bishop at Garðar. After 1408, when a marriage was recorded, no written records mention the settlers. It is probable that the Eastern Settlement was defunct by the late 15th century although no exact date has been established.”
http://en.wikipedia.org/wiki/History_of_Greenland
evanjones (18:21:03) :
I had thought the Greenland colonies were hulled in well before 1500. Am I mistaken?
The Holocene, Vol. 7, No. 4, 489-499 (1997)
DOI: 10.1177/095968369700700411
Interdisciplinary investigations of the end of the Norse Western Settlement in Greenland
L.K. Barlow et al.
Abstract:
The loss of the Norse Western Settlement in Greenland around the mid-fourteenth century has long been taken as a prime example of the impact of changing climate on human populations. This study employs an interdisciplinary approach combining historical documents, detailed archaeological investigations, and a high-resolution proxy climate record from the Greenland Ice Sheet Project 2 (GISP2) to investigate possible causes for the end of this settlement. Historical climate records, mainly from Iceland, contain evidence for lowered temperatures and severe weather in the north Atlantic region around the mid-fourteenth century. Archaeological, palaeoecological and historical data specifically concerning the Western Settlement suggest that Norse living conditions left little buffer for unseasonable climate, and provide evidence for a sudden and catastrophic end around the mid-fourteenth century. Isotopic data from the GISP2 ice core provide annual- and seasonal-scale proxy-temperature signals which suggest multiyear intervals of lowered temperatures in the early and mid-fourteenth century. The research synthesized here suggests that, while periods of unfavourable climatic fluctuations are likely to have played a role in the end of the Western Settlement, it was their cultural vulnerabilities to environmental change that left the Norse far more subject to disaster than their Inuit neighbours.
Thanks for the answers, guys! Very informative. (I had heard it as 1405, but that’s close enough for government work.) And, yes, I’d heard the Vikings wouldn’t adapt to the Inuit lifestyle (which I suppose makes them a pretty fair climate proxy).
Good to have that confirmed. Thanks for the sourcing.
I’ve also heard about the early 14th century as when a whole slew of European crop failures occurred.
I have one more question, and I don’t know if the answer exists, but at the height of the MWP, how much of Southern Greenland was iced up? Today, of course, the ice goes down to the southernmost extremities.
And is there any hint about sea levels? Back then they were into those damned “T-maps” that are useless for geographical purposes. (And it wasn’t until the Age of Exploration that they really got serious.) Are there any bio/geological reconstructions of medieval sea levels?
Well, okay. More than one more question . . .
(I’ll save my questions about the Vinland Map for later–though it seems fairly clear to me, for a number of reasons, it’s got to be the old fakeroo. )
Glenn (18:12:50) :
Leif, In your last post you have me confused with Gary Galrud, although I may be guilty as well of “ill-befitting high-brow previous lament”.
Yes, sorry about that.
Glenn (18:32:35) :
You know as well as I that we could trade references, or as you say “evidence” all day long, and not come to an agreement. Some are in support of your contention, some are not.
It appears to me that you are trying to impress and argue from authority. If so, would you really want to convince others on that basis?
No not at all. I hate authority-arguments.
Of course you can equivocate on what “cold” is, but from your last reference, I’d say that 3 or 4C below present temp can not be interpreted as not being “cold”
I’m trying to parse this one, by reversing the negatives: ‘4C below present cannot be interpreted as being warm‘ -> ‘4C below present can be interpreted as cold. Thus we agree that is was cold.
And that is in Japan, not a global temp decrease for those Minimas.
The other location was northern Europe. I thought it was good that it was in Japan, showing that is was not a regional European thing.
“The results suggested the existence of four cold periods…” You do realize that “cold” is not quite the same as your statement “and yet the temperature was high”?
The periods were 1330-1350, 1520-1550, […] thus on either side of the Spoerer Minimum. So the Spoerer minimum was not one of those four cold periods, so I do not understand your “You do realize that “cold” is not quite the same as your statement “and yet the temperature was high”?” Please explain what you meant. Maybe I confused you by writing “1330-1350, [Spoerer minimum here], 1520-1550,” where I had simply shown that the SM was between two of the cold periods.
About trading references, mine were specific and recent.
Little Ice Age in Southern Hemisphere?
http://www.worldclimatereport.com/index.php/2008/04/21/little-ice-age-in-southern-south-america/
evanjones (19:02:22) :
I have one more question, and I don’t know if the answer exists, but at the height of the MWP, how much of Southern Greenland was iced up? Today, of course, the ice goes down to the southernmost extremities.
I don’t know off the top of head, except that the Vikings settled more along the West coast rather than at the southernmost tip.
And is there any hint about sea levels? Back then they were into those damned “T-maps” that are useless for geographical purposes. (And it wasn’t until the Age of Exploration that they really got serious.) Are there any bio/geological reconstructions of medieval sea levels?
Sea level in general has long been known to fluctuate. Probably more because of tectonic forces rather than climate. a famous example is http://findarticles.com/p/articles/mi_m1134/is_4_108/ai_54574597/pg_1?tag=artBody;col1
And THAT map is fake.
And THAT map is fake.
I can list around a half dozen compelling reasons why it must be a fake. (For that matter, 90% of maps “discovered” at that time have later been proven to be fakes.)
Yet fairly recently, Columbia University (IRRC) saw fit to pronounce it genuine and insured it for 25,000,000 smackers. (I howled in protest.)
They had some phony-baloney excuse about the anatase that seemed like a stretch and a half. (“Princess Anatase” anyone?) No explanation for any of the other glaring fallacies.
(Is that smoke I smell in the rare books room?)
Interesting article on Sea Level. Makes me more sympathetic to Moerner’s frustration with the IPCC.
” otherwise they are just going into the abyss.”
More help? Next time consider collaboration with someone like Koutsoyiannis before the first draft.
Leif, so “we agree that is was cold.” Is this your way of saying you were wrong when you claimed “The Spoerer solar minimum was deeper than the Maunder minimum, and yet the temperature was high”? That wasn’t in reference to the time period between these minimas, and both minima are recognized as coinciding with cold periods.
Glenn (15:42:33) :
Leif, so “we agree that is was cold.” Is this your way of saying you were wrong when you claimed “The Spoerer solar minimum was deeper than the Maunder minimum, and yet the temperature was high”?
No, the article said:
“The results suggested the existence of four cold periods, 1330-1350, 1520-1550, 1670-1700, and 1825-1830, during which periods the estimated March mean temperature was 4-5 °C, about 3-4 °C lower than the present normal temperature”.
None of those four include the Spoerer Minimum.
I was just trying to make sense of your statement:
I’d say that 3 or 4C below present temp can not be interpreted as not being “cold”.The double negatives cancel out so we agree that 3 or 4C below present temp is ‘cold’.
But from that article “The results suggested the existence of four cold periods…” You do realize that “cold” is not quite the same as your statement “and yet the temperature was high”?
Of course I do, as you should, because the SM [which was warm] was not one of those four cold periods. Frankly, I don’t see how you can interpret it otherwise, but maybe you can explain…
That wasn’t in reference to the time period between these minimas, and both minima are recognized as coinciding with cold periods.
I said that the SM was warm, and since the SM is from 1415–1534, I would say that that was in reference to the time between 1330-1350 and 1520-1550, so where is your disconnect?
Glenn (15:42:33) :
I’m struggling to make sense of your comment. I said:
“The Spoerer solar minimum was deeper than the Maunder minimum, and yet the temperature was high”
the meaning of this statement is clearly that I was saying that it was warm during the SM.
Then you go on:
That wasn’t in reference to the time period between these minimas,
Here you seem to agree that I was not talking about the period between the SM and the MM, but about the SM.
and both minima are recognized as coinciding with cold periods.
And the article identified 1330-1350 [in 14th century] and 1520-1550 [in 16th century] as cold periods, meaning that the SM was not one these colds periods, since the SM was in the 15th century.
So, again, please explain.
Leif, are you just trying to goad? If your intent was to support your claim that it was “warm” during the Spoerer Minimum, you don’t get there by using an article which claims
“The results suggested the existence of four cold periods, 1330-1350, 1520-1550, 1670-1700, and 1825-1830, during which periods the estimated March mean temperature was 4-5 °C, about 3-4 °C lower than the present normal temperature. These cold periods coincided with the less extreme periods, known as the Wolf, Spoerer, Maunder, and Dalton minima, in the long-term solar variation cycle, which has a periodicity of 150-250 years.”
In fact, going with your argument, this is contradictory, since the Maunder MInimum does coincide with the 1670-1700 range, yet they include the Maunder as one minimum that is “less extreme”, and the Maunder Minimum
(1645-1715) is another well known cold period, some say the coldest part of the Little Ice age. These authors claim that the Maunder Minimum, like the Spoerer Minimum, were “less extreme” than the periods which they identify as
being colder. Even if that were true and those periods were colder than the periods of the minimas, they do not claim that the periods between are “warm”
in any sense of the word, and the article can not be interpreted as evidence that the Spoerer Minimum was a “warm” period.
Of course as far as I know, we are both going by the article’s abstract. Yet if they had meant the Minima’s were found to be warm, they would not have said
“less extreme”. Less extreme than 3 or 4 C could still be quite cold, as in the middle of the LIA. Danced on the Thames lately? The first “Frost Fair” was in 1607, in one of those “less extreme” periods claimed to occur in Japan at the same time. Not regional? Going to claim that the Maunder MInimum was a warm period too?
Glenn (09:58:30) :
“The results suggested the existence of four cold periods, 1330-1350, 1520-1550, 1670-1700, and 1825-1830, during which periods the estimated March mean temperature was 4-5 °C, about 3-4 °C lower than the present normal temperature. These cold periods coincided with the less extreme periods, known as the Wolf, Spoerer, Maunder, and Dalton minima,
The authors are correct about their periods in years, but are not correct that the second period 1520-1550 was the Spoerer minimum. I thought we agreed [at least I agreed with your claim] that the Spoerer minimum was a hundred years before that. I’m amazed that you can’t see that, but I guess AGW makes blind for facts 🙂
Glenn (09:58:30) : “These cold periods coincided with the less extreme periods, known as the Wolf, Spoerer, Maunder, and Dalton minima”, what the authors mean here is simply the ‘less active solar cycles’, not temperatures. Go read the paper [if you can’t see that].
No, I can’t see that, Leif. The “less extreme” is in reference to the subject of temperature, in English. They claim that these cold temp times *coincide with the minimas*.
It doesn’t matter whether we agreed on when the Spoerer MInimum occured (I don’t recall you ever confirming mine was the same as your understanding) – but if you are suggesting that the paper got the date ranges for the minimas wrong, you need to support that. The language used clearly indicates the date ranges they identify are *distinct from* the solar minima’s; the abstract makes no mention of the temps during the solar minimas, except that they were “less extreme”.
As to reading the paper, I am in the same boat as you with regard to the Wilson’s AU paper. If you have anything particular to quote from the paper itself, I suggest you quote it here, instead of asking me to pay $35 or so to read every reference you offer, or provide a URL to the whole paper.
I found, quite by fortuitous accident, the URL to the first paper you mentioned which you claimed was evidence the LIA didn’t start till 1400 AD:
http://www.geo.lsa.umich.edu/~shaopeng/2008GL034187.pdf
The Spoerer Minimum is said to have occured 1415–1534 AD, but that article does not even mention “Spoerer Minimum”. I fail to see how either article you offer holds evidence that the Spoerer MInimum was a “warm” period.
Leif,
“A late Quaternary climate reconstruction based on borehole heat flux data, borehole temperature data, and the instrumental recordGeophys. Res. Lett., 35, L13703, doi:10.1029/2008GL034187. 4 July 2008
or just look at their main Figure here: http://www.leif.org/research/T-Boreholes.png
It shows that the little Ice age did not start before 1500.”
Actually, no it doesn’t. The figure on your site that matches the article graph is for the last 2000 years:
http://www.geo.lsa.umich.edu/~shaopeng/2008GL034187.pdf
“Figure 2. Same suite of reconstructions as in Figure 1, but
displayed over only the past 2,000 years on an expanded
timescale.”
That graph matches the one on your site exactly.
I suspect you meant to reference Figure 1 instead, although Figure 1 is in contradiction to your other reference: “The results suggested the existence of four cold periods, 1330-1350…” since 1330 is at the top, or warmest period of that chart. Is there something missing that explains this problem?
Glenn (15:04:36) :
You are correct that I showed [from a different paper] a blow-up of the last 2000 years. But that is just quibbling.
I suspect you meant to reference Figure 1 instead, although Figure 1 is in contradiction to your other reference: “The results suggested the existence of four cold periods, 1330-1350…” since 1330 is at the top, or warmest period of that chart. Is there something missing that explains this problem?
What is missing is that the borehole reconstruction does not have a time resolution high enough to resolve 20 years, but works ok with periods several times longer.
The “less extreme” is in reference to the subject of temperature, in English.
Take into account that the authors are Japanese. Ever tired to read a user manual for some erectronic device made in Japan?
Glenn (14:18:23) :
suggesting that the paper got the date ranges for the minimas wrong, you need to support that.
What they have correct is the dates of their own stuff. You and I both know that none of those date ranges cover the Spoerer minimum, so what is there to ‘support’? They say A, we say B. Either they are wrong or we are. I suggest that we [including you] are not. I base my assessment on the cosmic ray flux [e.g. seen in the graph on my website I referred to earlier]. You base yours on Wikipedia.
Leif:
“Either they are wrong or we are. I suggest that we [including you] are not.”
One of us is wrong, since you claim that it was “warm” during the Spoerer MInimum, and I do not. I don’t base my opinion on Wiki alone, but they often
include references to pertinent articles. And when it is said “The Spörer Minimum has also been identified with a significant cooling period near the beginning of the Little Ice Age” I suspect is supported by some research. For example, Wiki’s entry for “Medieval Warm Period” has a graph taken from
http://www.ncdc.noaa.gov/paleo/globalwarming/medieval.html
showing that around the time of the Spoerer Minimum temps in the NH surface could have approached a degree C below today’s mean.
WIki’s “Little Ice Age” entry has “Other indicators of low solar activity during this period are levels of the isotopes carbon-14 and beryllium-10” which includes a chart not available for view from the referenced abstract provided
http://www.sciencemag.org/cgi/content/abstract/289/5477/270
but shows several minimas following the Medieval Maximum, then in the last hundred fifty years or so, an increase in solar activity. This in my opinion matches the temperature record in general. And as I have commented elsewhere, a increase in just one or two w/m2 is claimed to be the cause of the increase due to AGW in the last 50 -100 years. Minimas it appears can vary
Earth’s total solar irradiance by at least that much. I don’t think anyone believes things can happen instantly on a global scale, but it sure looks like solar activity has played at least a significant if not major part in the temp of the Earth for the last thousand years.
Glenn (17:53:24) :
it sure looks like solar activity has played at least a significant if not major part in the temp of the Earth for the last thousand years.
It is evident that nothing can rock the faith of a real believer.
Glenn (17:53:24) :
And as I have commented elsewhere, a increase in just one or two w/m2 is claimed to be the cause of the increase due to AGW in the last 50 -100 years.
Except that TSI has not increased 1-2 W/m2 in the last 50-100 years. And you are traditionally vague: one or two, 50-100. The make that amenable for discussion I would interpret that as 1.5 W/m2 in the last 75 years, and that simply did not happen.
[…] AFTER the SIDC came out with their monthly report on September 1st. See my report about that event here and the follow up email I got from SIDC when I questioned the […]
From another thread:
Glenn (12:15:26) :
solar activity for the last thousand years on that chart is the highest during the last hundred or so years
Simply because the calculation in the Appendix is based on the systematically too low past sunspot numbers.
Glen,
Here is another set of temp records that shows the SM warming:
http://www.climateaudit.org/wp-images/brif2034.gif
Compare the SM with the MWP that shows similar warming.
It is from http://www.climateaudit.org/?p=3608
[…] August, there were no sunspotgroups numbered by NOAA. However, on 21-22 August “something” was visible well enough to be seen by several observers and to prompt the SIDC to give a (preliminary) non-zero […]
What the hell?!
We pollute the earth and now we pollute the sun?
It has to be because the pollution we made here is going to space and to the sun. This is disastrous!
I think this is the begining of our ending.