Joe D’Aleo, CCM, Fellow of the AMS
It was the eighth warmest June on record for the globe, the National Oceanic and Atmospheric Administration reported Wednesday in the 129 years since records began in 1880. And the first six months of the year were the ninth warmest since record keeping began in 1880, NOAA’s National Climatic Data Center reported. The planet’s average temperature for June was 60.8 degrees Fahrenheit, 0.9 degrees warmer than average for the month.
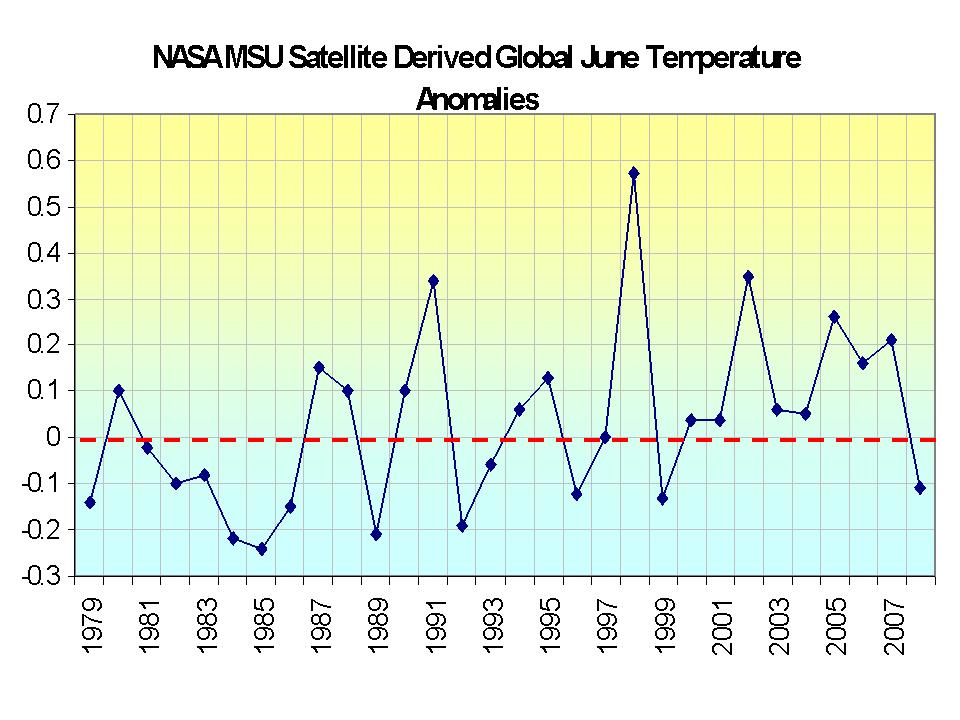
DON’T BELIEVE A WORD OF IT. Just a few days ago, the University of Alabama, Huntsville came out with their global assessment and they reported the 22nd warmest in the 30 years of records in their data base (in other words the 9th coldest). In fact, their global mean was actually below the average (base period 1979-1998 ) with a value of -0.11C (-0.19F). This is a full 1.1F degrees colder than the NOAA guesstimate. The other NASA satellite source, RSS had June as the 13th coldest out of the last 30 years.

NASA MSU June Temperatures since 1979. See larger version here.
The global data bases suffer from major station dropout after 1990 (number dropped from 6000 to less than 2000) and a ten fold increase in the number of missing months in the stations that report. There are serious problems with their algorithms for assessing whether a station is urban or rural and adjusting for local land use changes. There are major siting issues, many of which Anthony Watts, Steve McIntyre and Roger Pielke Sr. have shown have not been properly adjusted for. An old version of a document describing these issues can be found here. Please note the NERON networks plans of NOAA morphed into the Climate Reference Network, a relatively small number (110 if fully implemented) properly sited instrument locations that should provide a better tracking of at least US climate in the future but will not resolve the historical US and current global discrepancies.
Time has come for a major independent investigation of the data sets, compilation methodology and adjustment practices (and records) for the global data sets of NOAA, NASA and Hadley. Steve McIntyre and Anthony Watts are doing their best finding problems but Steve has run into many roadblocks suggesting folks may have something to hide. Meanwhile we will trust only the UAH and RSS.
Try this to see for yourself how bad the global station data is. Go to this site (GISS – virtually the same as NOAAs GHCN), scroll down to the map and click on any region. You will see stations listed – notice the highly variable reporting periods. Start clicking on stations. You will get plots. But before you move to other stations go to the bottom and click on “Download monthly data as text”. You will see for many/most stations numerous “999.9″s meaning missing data. How do you come up with an annual averages when one to multiple months are missing? That is like making beef stew but without the beef. I was told that in many cases the data is available (Environment Canada tells us they have their data we show as missing) but that NOAA and NASA is making no efforts to go out and get it.
Our cry should be after every NOAA press release “Where is the beef?”
I am getting the impression that KGO 7 (San Francisco) is very selective in its reporting of climate news. A few weeks back when the data came to light showing the cooling trend year over year, the M-A-M mean, and the June data, KGO did not cover the stories despite my sharing the sources with Dan Ashley and Cheryl Jennings (Cheryl and I go way back). Yet this NOAA release talking near record warming despite the wealth of other, better data, get covered.
Bias in the media?
REPLY: If it bleeds it leads, if it doesn’t burn its spurned.
“If it bleeds it leads, if it doesn’t burn its spurned.”
Okay, so how do we get more coverage for things near and dear to people’s hearts?
The California grape crop is in trouble I hear, or at least late.
Packing hot water bottles around babies in Tajikistan because the feedwaters to the hydro plant froze would be good, but who’d want to go there to report?
The recent corn crop problems in Brazil – combine that with a piece about rainforest being cut down for biofuels would be good.
And why did that kidney stone story take of in July but not May?
I suspect there will be plenty of stories in New England about people turning down the heat to pay for food and going hungry to keep the heat on, but that will happen regardless of the temperature.
Where’s the beef? indeed. After peeking in at the GISS site you’ve got to wonder how they can tell much of anything to any degree of reliability. Missing data and loss of hundreds of stations. Each month after the data comes in keeps my confidence in UAH & RSS high as well my skepticism of GISS.
I wonder what is going to become of the CRN?
Someone please correct me if I am oversimplifying this, but I just don’t get it. If CO2 is THE big cause of global warming as we’ve all been told repeatedly, and if the CO2 levels have increased every year, and if this is supposed to be a positive feedback loop mechanism, then how can you explain yearly global temperatures that do not consistently go upwards every year? I don’t think one can play both sides of the fence with this and say it is the big warming molecule and then say that you can’t just compare one lower year to the rest (i.e. it will average out). If global temperatures don’t increase for this year, then shouldn’t something be wrong with the model to begin with? Shouldn’t this mean that either A. perhaps CO2 is not the big driver of global warming, or B. perhaps there is another molecule that impacts global cooling to a greater degree than CO2 warms?
It’s a cry from my heart. An old heart looking through old eyes at the bright, fresh face of expectation of a year-old grandson: Wrest their influence from them…
Vested interests are warping science, and warping our lives.
Bald-faced lies are being projected into the consciousness of the western word with the full power of some massive conglomerate of evil intent for… what purpose? Egomaniacal satisfaction? Punishment as some kind of payback to life’s losers? The bitter claiming some semblance of satisfaction for their personal pain?
There would be enlightenment in learning the stories of their childhood. Just what went so wrong then that they must dedicate their adult lives to making all others suffer for their both real and imagined pain.
Wrest their influence from them. Wish them no harm; but remove them from influence and let mankind surge on in glorious adventure.
Can anybody in the US sue NOAA oder inviduals at NOAA for providing misleading data ?
This is a significant source of data for global political, economic and individual decisions including taxation or personal spending for protection against rising sea-level etc.
If this data is misleading, and for example not generated according to NASA standards or any other ethical or professional standards, isn’t there a personal responsibility for the damage or unnecessary expenses ?
The thing is, if this was only about the Climate, it would be simple…. All we would need to do would be to look at the facts and the empirical evidence….
But it isn’t about climate…. It’s about Socialism, that and rampant bureaucracy.
And NOAA et al are really playing the politicians for patsies.
It is silly there is so much controversy over June 2008. Did you know NCDC said that this past March was the second warmest on record, and the warmest on record in the Northern Hemisphere by far? I s*** you not. The biggest reason it is different is because NCDC measures surface air for 29% of the planet’s surface, and measures water temperature for the remaining 71%, and calls it a “global temperature”, despite combining two completely different things in different amounts.
Two more things I will add. The most dramatic differences aren’t over land, but over the Atlantic Ocean, where UAH and RSS show near normal and NCDC shows much above normal. And no, it is not differing base period, it is different methods, and the one that is better is the satellite, because it measures lower tropospheric air over the whole globe, and NCDC measures the water and surface air. Finally, NCDC is awfully close to GISS in warming trend, but it may have just overtaken it:
http://junkscience.com/MSU_Temps/NCDCanom.html
http://junkscience.com/MSU_Temps/GISSglobal.html
Out of interest I checked the Hadcrut data for June and sorted by temperature with the following result – comes out as the tenth warmest
1998/06 0.604
2005/06 0.512
2002/06 0.475
2006/06 0.443
2003/06 0.439
2001/06 0.415
1997/06 0.377
2007/06 0.375
2004/06 0.347
2008/06 0.314
1995/06 0.287
1991/06 0.286
1999/06 0.264
1990/06 0.234
2000/06 0.232
1994/06 0.216
1988/06 0.207
1941/06 0.167
Here in England we’ve just had our coolest June since 1991 (equalled 1999). I think we’re just about to have our coolest July since 1988.
Mr. Carr,
Very good post……The only thing that I could add would be for all of us to forward information like this to family, friends and colleagues through E-mail and word of mouth.
This is the only way that I know of to by-pass the obviously biased press and those that would profit by espousing the “global warming” fraud.
I still don’t get your methodology. What’s the probability for type A vs. B error here (null hypothesis= there is no overall global warming or cooling; specific hypothesis= there is one; type A error=to claim there is a global warming or cooling while there is not; type B error: to claim there is no global warming/cooling while there is one) ?
I would like to see such a sound analysis on existing data.
More importantly: what about the impact of these errors? (type A error impact= the world is ready for something terrible that will not happen any time soon; type B error impact=the world is not ready for something terrible that’s already in the pipeline).
Wanna bet on the red or on the black?
Oldjim: Also irritatingly interesting that all the 10 warmest years are among the 12 most recent years, whatever that might tell us…
Does an average temperature really mean anything? NOAA says the average temp for the month of June is 60.8. How many places on Earth were actually 60.8 degrees for any length of time? My bet would be none.
Just in: water temps off the Gulf coast of central Florida have gone down about 5 degrees because of several days of rain and cloud cover. They will go back up to the normal 89 degrees after a couple of days of sunshine. Would that change the average SST for this area during July. I’ll bet it does. Does it mean anything other than we had several days of cooler weather due to a strong, lingering low pressure center in the area? Nope. Of course in a couple of years one would look back and say July 2008 was cooler than the norm of base period whatever, forgetting that the reason was those days of rain and cloud cover.
So the question is :
Is this a case of :
A) Total incompetance
B) Deliberate and planned fraud
…or,
C) Both of the above.
Has a PhD ever won a Darwin Award?
How do you pump out a “GISS-pool”?
Enquiring minds want to know.
9th warmest vs 9th coldest?
NOAA must be using the “New Math”
UAH T=actual reading
NOAA T=A + ( B/2 x 567 / 192 + 2^1 – 1000 x 1 ) x ( if Y < 2000 then – 50 else + 50 ) /2 + 3939 – 3939) + 1
see it’s easy to get 2008 to be the 9th warmest.
“Can anybody in the US sue NOAA oder inviduals at NOAA for providing misleading data ?”
No, but there is something called Congressional Oversight. For obvious political reasons you will not hear a single complaint from the responsible sub-committees.
Didjeridust (04:31:12) :
Not really surprising as all the metrics show that the average global temperatures in the last 10 years have been higher than average including UAH for example. The difference between the satellite based numbers and the ground stations is on the extent of the drop this year. This must, in part, be due to the significant gaps in station coverage with the ground based stations
Baconman, CO2 is NOT the most important greenhouse molecule; water vapor (95%) is. The total human contribution to the Greenhouse Effect is 0.3%, hardly what one would call a major contribution. Look up “Coconuts In Wyoming?” for a breakdown. And if there is a positive feedback mechanism, how can the observed fact that the planet has remained within acceptable limits for multicellular life for over half a billion years, despite wildly varying atmospheric conditions, be explained?
I checked several sites in Eastern Wisconsin and the results were truly bizarre. 2008 had the coldest Winter in memory, a late Spring and now a chilly Summer, but GISS is showing the temperature the same or increasing from 2007.
Are the values shown at the GISS site raw numbers or manipulated? Is there a list of street addresses for the stations so I can do my own sleuthing?
You do realize that satellites do not measure surface temperature, right?
Kevin Ve3en, on his blog Solar Cycle 24, has characterized NASA’s real mission as funneling billions of dollars in tax money to software producers.
Thanks Anthony for giving us this information.I checked out my state ,n.c., and was suprised to find out how much missing data ther is .Take banner elk which is located in the mountains .There practially is no data , or missing ,for that area over the last five years.How does they have a clue what temperature it really was there .And look at Raleigh .They are warming up big time . But then you look at Darlington S.C and they are cooling off .How can Raleigh be that much warmer than Darlington .
When the data doesn’t say what you want it to say, just make it up. Pay more taxes so government can pretend to control the weather — This is part of the “pretend”.
The fact remains, government can fake the data, but they can’t fake what the sun does next.
baconman asked, then how can you explain yearly global temperatures that do not consistently go upwards every year, to which I remind everyone:
The atmosphere is a chaotic, complicated system. Features of on a short time scale – weather – can vary dramatically both in time and in space. Features on the long-term scale – climate – must be analyzed separately. Because it is understood that the climate has an intrinsic variability due to weather, it has never been suggested that the temperature must monotonically increase year after year. There will always be noise superimposed on the temperature signal, and it takes more than just “eyeballing” ten years of data to make a qualitative statement about climate trends.
I just looked at Chapel Hill n.c. and there annual mean temperature is 15.5 and Raleigh , which is part of the trangle Raleigh , Durham Chapel Hill,is showing an annual temperature of 17.There ‘s no way this is right. Just looked at Winston Salem, which is 30 miles from my home town, thier data stops at 1965 .
To add to Tom in Florida’s SSt observation, check out the latest mean sst anomolies, http://www.osdpd.noaa.gov/PSB/EPS/SST/data/anomnight.7.17.2008.gifit shows clearly the cooling off sst by ex hurricane Bertha.
Maybe I’m going to sound like some type of heretic, but NOAA may be right. They have moved the goal post (once again) by using their 129 years of recorded (and Hansenized) database as opposed to the 1979-1998 base everyone else is using. So in a sense, they may be right… I haven’t checked.
Regardless, it’s deceitful and manipulative. Something the Lamestream Media (ABCNNBCBS) relishes.
Jack Koenig, Editor
The Mysterious Climate Project
http://www.climateclinic.com
Wanna bet on the red or on the black? Spending trillions on climate change, something that has always happened and always will, and which we have little impact on, and thus can’t do anything about (except adapt) is sheer stupidity. Bet with your own money, not ours. Oh, that’s right, we’ll be forced to pony up regardless, and with mobsters like Big Al and Hansen, the MSM and political hacks running the show we’re all screwed. But guess what. Not only are we no longer warming, but cooling. You see, the king of climate change just happens to be the sun. And old sol is about to put the aforementioned crooks out of business (and hopefully in jail).
This is a mess. Go and look for yourself. How can anyone at NOAA/NASA keep a straight face when releasing this data?? Unbelievable. Are they not accountable to an oversight committee? Who’s in charge? Is there anyway to get to the bottom of this? Meanwhile, trust only the two independent and agreeable data sets, UAH and RSS.
“Oldjim: Also irritatingly interesting that all the 10 warmest years are among the 12 most recent years, whatever that might tell us…”
That tells me that temperatures peaked and then remained flat. I looked at the chart…
It could also mean that the temperatures are still rising,
or that the temperatures are cooling…
on the top of a oscillation all the points leading up will be in a range equal to the points leading down, this results, when viewed on a time scale point near the top, of a clustering of highs derived from the most recent points, so this claim will remain true even if the temperature falls at the same rate of rise.
What I am saying is that it is a rather strange metric to use.
Mike Keep,
Interesting to compare the gif showing SST in July 2005 from the same site. http://www.osdpd.noaa.gov/PSB/EPS/SST/data/FS_km5000.gif I wonder why we could get temp reading in the Antarctic (cooler) in 2005 and it appears as a huge ‘white space’ of no readings in 2008?
I can tell you that nearly all rural stations in Australia have no data after 1992 recorded in the GISS datasets. Nearly all Australian non-rural (cities and major towns) stations have their data recorded to the current year (2008). What does that say about the accuracy of their calculations? It doesn’t just apply to Australia. It also applies to much of Russia, China, Asia generally, Africa and South America.
There will always be noise superimposed on the temperature signal… Exactly, counters, and that is all that human-produced C02 is, noise. It is of no significance. C02’s role in climate is minor, although important. What it basically acts as is a climate stabilizer, although it pales in comparison to the oceans’ stabilizing effect.
I think we’re reaching a turning point…
Myth of Consensus Explodes: APS Opens Global Warming Debate
The American Physical Society, an organization representing nearly 50,000 physicists, has reversed its stance on climate change and is now proclaiming that many of its members disbelieve in human-induced global warming. The APS is also sponsoring public debate on the validity of global warming science. The leadership of the society had previously called the evidence for global warming “incontrovertible.”
Fraud: Misrepresentation or material omission; scienter; damages; reliance. Three out of four.
Hardest to prove would be scienter, but an independent investigation might at least reveal a reckless disregard for the truth, which would qualify.
Sorry to keep rehashing this, but going after Mann for nondisclosure of his codes or calling for an independent investigation in a scenario like this are far more feasible alternatives than suing Al Gore. And instances of data manipulation are only going to increase as temperatures continue to drop.
This is never going to end until somebody pushes the issue.
Good ole Al is at it again. Does anyone, anywhere really think this is a good idea?
http://www.physorg.com/news135511498.html
Boris…
Yes, of course, satellites do not measure surface temperature (right at the surface). However, if the earth is warming due to the greenhouse effect, it should be (and has been) reflected in the lower troposphere as well as the surface. If you look back over the past 30 years, you will see that satellite temperatures generally follow the same trends as surface data. However, there has been some diversion from that in the past 10 years, mainly with GISS/NOAA.
So, if the satellites are showing much cooler temperature anomalies in the lower troposphere than the surface data (base periods accounted for), then something is wrong. Considering the fact that surface data is much more susceptible to bias and significantly lacks coverage, it would be reasonable to trust the satellite data more.
A quick check of GISS, June08 was the coolest June since 1996… So NOAA may similar but not the same as GISTemp.
“So, if the satellites are showing much cooler temperature anomalies in the lower troposphere than the surface data (base periods accounted for), then something is wrong.”
Well, what was wrong in 1998 when satellite temps were higher than surface temps? Lower tropospheric temperatures respond more strongly to el nino and la nina events.
Considering the slew of major corrections to satellite analyses, I don’t think it makes sense to trust satellites more. And it certainly doesn’t make sense to compare MSU temps to surface without a clear discussion of the differences in the metrics.
Mike Bryant (09:52:55) :
Good ole Al is at it again. Does anyone, anywhere really think this is a good idea?
http://www.physorg.com/news135511498.html
Do you know what really scares me about this type of thing? If he gets his way and implements all these “Green” powerplants in place at the same time as the globe naturally cools, he is going to claim a victory and chalk it up to sucessfully fighting AGW, which means more political power to his own ends… I don’t like it!
Boris: So what you are saying is that all the data is bad, satellite and ground, and we don’t really have a handle on whether the earth is cooling or warming or anything. Do you think we should implement CO2 controls that impoverish and enslave the world based on no data….?
“Boris: So what you are saying is that all the data is bad, satellite and ground, and we don’t really have a handle on whether the earth is cooling or warming or anything.”
No. I’m not saying that.
You do realize that satellites do not measure surface temperature, right?
Neither do surface stations, as it turns out.
Mike Bryant,
There is about 500 GW of coal-fired generation in the US. There is also about 200 GW of natural gas-fired generation in the US. If we assume that the average plant has reached mid-life and that the installed cost of those plants averaged ~$1.5 billion per GW, the economic “dead loss” of removing those plants from service would be approximately $525 billion. Most of those plants are baseload or intermediate load plants.
The available base load and intermediate load power generation technologies include nuclear, geothermal and hydro. Solar and wind are not baseload or intermediate load technologies. They are not capacity replacement technologies; they are commodity replacement technologies. They are “source of opportunity” power.
Current estimates for new nuclear plants are ~$6 billion per GW. The chances of major new hydro being built in my lifetime are somewhere between slim and none. The technology for dry hot rock geothermal is not commerically available. Therefore, the investment required to replace the ~700 GW of coal and nuclear generation with commercially available technology (nuclear) would be ~$4.2 trillion. Therefore, ~$5 trillion is a better estimate than $3 trillion, including the dead loss.
However, the liklihood that the permits required for the construction of 700 GW of new generation of any type, no less nuclear, could be approved by state and federal regulators and processed through the appeals processes in the regulatory agencies and the courts within a 10 year is also somewhere between slim and none.
Just for giggles, theoretically, wind turbines with 25% availability could provide baseload power if 8 wind turbines of a given capacity were installed in 8 carefully selected locations which rarely if ever were impacted by the same weather patterns for each unit of that given reliable capacity required. Alternatively, 5 of those wind turbines plus storage (not yet commercially available) capable of storing their entire output could reliably provide the capacity of 1 of those wind turbines.
The answer, my friends, is not “blowin’ in the wind”.
Boris said
“You do realize that satellites do not measure surface temperature, right?”
As usual he is at best half right. The sea surface temperature measured by satellite uses the AVHRR. Please note the word “surface” in that phrase.
http://noaasis.noaa.gov/NOAASIS/ml/avhrr.html
Boris is a troll par excellence, whether professional or amateur. Notice how in his posting of 10:59:02 that he completely avoids specifiying what he is saying. Unless he brings real material to a discussion rather than aspersion and innuendo there’s no benefit to be gained by engaging in his shadow debates.
So NOAA may similar but not the same as GISTemp.
GISS takes NOAA adjusted data. GISS uses this as its raw data and adjusts it further.
Wow thanks Ed… That was way over my head but I take it that Al’s idea ain’t that great, right?
Yup.
Algore is a divinity school dropout/flunk out. He learned no Science and knows ZERO about Science. He could tell you about how many angels can dance on the head of a pin though; he studied that. He also studied techniques for televangelist, demagoguery.
Did you know that the average nuclear plant requires up to the equivalent of of 8,000 windmills (including up time) to be built to replace a single one? The 100 or so existing nuclear plants equal 20% of our electricity. So the total US generation is about 500 hypothetical equivalent nuclear plants.
Where in God’s name would you put 500 times 8000 windmills, or 4,000,000 windmills? That means we have to construct and make operational ‘only’ 1100 windmills per day, each day, over the next ten years to get to Algore’s target!
Now preacher-man never heard of grid stability. A power grid of instantaneous varying output generators, plus a varying instantaneous demand would within a few seconds collapse, into a perpetual blackout. It would happen long before we got to the 4,000,000 windmills, too. Such sources are variable if the source varies unpredictably. Wind changes, gusts, and unpredictably varies or disappears. Solar varies as the clouds ‘cover ‘ the Sun, intermittently.
And could not be restarted as a grid. It might function as a separated collection of 4,000,000 endpoints not interconnected. Any time a smaller segment, acting as a small grid, had about 20% instantaneous variable generation, it would collapse into oscillation.
This isn’t theoretical. EEs have been taught to face these problems forever. But they had stable generators that could be planned for the rare intermittent operations. No longer, when the generators are all varying, or a significant portion are not stable. It has happened already in Denmark, Netherlands, and in T Boone Pickens chunk of the Texas grid, as well as near collapses in Britain.
The grid wide blackouts occur from grid resonances as power sloshes up and then down power lines, first out of, and then into generators. Circuit breakers trip to protect equipment from the sloshing power overloads, and the grid collapses.
So instantaneous generation can never be more than 20% of the grid. A wart for ‘variable’ generation like Solar and Windmills that was unrecognized by the political Knot-heads.
Incidentally, it is also the reason TB Pickens wants inter-connection to a larger grid, so he can stabilize his windmill portion with more stable generation, to prevent oscillation.
Paul Shanahan (10:46:27) :
If he gets his way and implements all these “Green” powerplants in place at the same time as the globe naturally cools, he is going to claim a victory and chalk it up to sucessfully fighting AGW, which means more political power to his own ends… I don’t like it!
Why else do you really think there is such ‘urgency’ that they insist on acting with, and that they’re getting more and more hysterical? I’m only amazed that they haven’t attributed all the smog in China to the recent cooling…
Earle,
Comparing surface temperatures to temperatures of broad sections of the atmosphere is misleading, don’t you think?
Yes, the surface is included in MSU measurements.
So, conclusions that the GISS or NOAA data are wrong or fraudulent or whatever the skeptics are saying today cannot be supported by the satellite data.
I hope this is clear enough for you.
He could tell you about how many angels can dance on the head of a pin though; he studied that.
That’s an easy one:
As many as God deems necessary (and not one less).
The may be something else to factor in.
This may be NOAA’s version of what the FBI often says minutes after a suspicious incident – “terrorism was not involved.” The FBI says this because they are under a directive to avoid inciting panic.
Similarly, once people connect the dots regarding any serious cooling, there is a panic potential. So instead, it’s “nothing to see here, move along.”
RE:
BerkshireBaz (02:44:10) :
Here in England we’ve just had our coolest June since 1991 (equalled 1999). I think we’re just about to have our coolest July since 1988.
Since you are right where the Gulf Stream is overridden by the Jet Stream, that is truly and deeply disturbing.
Boris:
“Comparing surface temperatures to temperatures of broad sections of the atmosphere is misleading, don’t you think?”
No Boris, as a general trend, I don’t believe that “broad sections of the atmosphere” will show no warming while the surface does warm.
“So, conclusions that the GISS or NOAA data are wrong or fraudulent or whatever the skeptics are saying today cannot be supported by the satellite data.”
It’s not only supported by sattelite data. GISS is diverging from HadCrut3 at a rate of about .13C per decade for the last decade. And it is diverging from the satellite data at the same rate. The satellite data and HadCrut3, on the other hand, are showing very little divergence.
AEGeneral says
“Sorry to keep rehashing this, but going after Mann for nondisclosure of his codes or calling for an independent investigation in a scenario like this are far more feasible alternatives than suing Al Gore. And instances of data manipulation are only going to increase as temperatures continue to drop.”
This boil your bonnett That same group that gave us the “Hockey Stick” has embarked on to “The PR CHALLENGE”. (see climate audit)
I sent the a letter to my senator
July 16, 2008
To:
Senator George Voinovich
524 Hart Senate Office Building
Washington, DC 20510
Dear Sir;
You may be aware of the PR Challenge or Paleoclimate Reconstruction Challenge. http://www.pages.unibe.ch/science/prchallenge/index.html Many scientists of this group are the same “scientists” which give us the famous “Hockey Stick” reconstruction of our past climate. I should not have to remind you of the boondoggle surrounding the hockey stick starting with “We have to get rid of the Medieval Warm Period to any input number resulted in the same graph being reconstructed.
Fool me once, shame on you. Fool me twice, shame on me.
I demand as a tax payer and citizen that:
A) An independent audit done to validate and verify all works from Paleoclimate Reconstruction Challenge before any government body and/or government employee can refer to and/or use in full and/or in part for any government function including the IPCC.
B) If any government funding is used in all and/or part of this reconstruction, the reconstruction shall be subjected to the principle of forecasting as described in Principles of Forecasting handbook.
C) If any government funding is used in all or part of this reconstruction, the reconstruction shall be subjected to the Data Quality Act.
D) If scientist and/or institution that does not comply with independent audit and/or principle of forecasting and/or Data Quality Act shall have his and/or hers and/or institution government funding suspended immediately.
Thank you,
Sincerely,
stas peterson (12:15:51) :
“Algore … could tell you about how many angels can dance on the head of a pin …..”
42. It’s the answer life, the universe, and everything.
“A power grid of instantaneous varying output generators, plus a varying instantaneous demand would within a few seconds collapse, into a perpetual blackout.”
Perhaps the solution there is to have TV broadcast satellites (or GPS satellites) provide a master 60 Hz oscillator and require that all generators that feed the grid sync with that oscillator.
stas peterson (12:15:51)
Excellent insight – we have the same issue with the math over here in the UK
See this from the Sunday Telegraph a leading British Newspaper.
http://www.telegraph.co.uk/news/newstopics/politics/1578171/Christopher-Booker%27s-Notebook.html
(nb – you need to scroll down to the heading – “The great wind scam’s profitability is equalled only by its futility ” – there’s also a piece on the ice coverage beneath it if of interest to anyone).
On a separate issue the debate on biofuels continues and I thought this article may interest others (from the same paper and journalist)
http://www.telegraph.co.uk/earth/main.jhtml?xml=/earth/2008/07/12/eabio112.xml
And boy is it cold in the UK at the moment for July! See it for yourself at the Open Golf Tournament on TV. I was also at the British Grand Prix 2 weeks ago and it was so cold I could see my breath in the air!
[…] wattsupwiththat.wordpress.com Tags: cold, global warming, NASA, NOAA, ocean Related Posts […]
“Perhaps the solution there is to have TV broadcast satellites (or GPS satellites) provide a master 60 Hz oscillator and require that all generators that feed the grid sync with that oscillator.”
As one brilliant Math-CompSci profs of mine once responded to my eager answer to his query of the class:
“That does not pertain.”
Paul H Clark (23:59:16) :
And boy is it cold in the UK at the moment for July! See it for yourself at the Open Golf Tournament on TV. I was also at the British Grand Prix 2 weeks ago and it was so cold I could see my breath in the air!
Tell me about it! It’s meant to be the middle of summer and I still have my winter douvet on the bed and I’m wearing wooly jumpers! I’ve never seen it go dark as early as it is at present for the time of year. It’s constant cloud cover both low and vey high (alternating) and we’ve hardly seen the sun for months.
Here’s another scary story about fuel prices (Apologies Anthony, I realise it’s off-topic)
http://news.bbc.co.uk/1/hi/business/7512971.stm
“No Boris, as a general trend, I don’t believe that “broad sections of the atmosphere” will show no warming while the surface does warm.”
I didn’t say that.
Boris,
You did say this:
“Yes, the surface is included in MSU measurements.”
Let me repeat that, just to make sure I read it right…
Boris: “Yes, the surface is included in MSU measurements.”
I absolutely adore how vigorously you engage in debate when you cannot get the most fundamental aspects correct. MSU does not measure surface temperatures. AVHRR does measure surface temperatures. MSU is incorporated into the RSS and UAH global temperature metrics. AVHRR sea surface temperature is incorporated into the HadCRU, GISS, and NOAA global temperature metrics.
You’ve demonstrated a complete misunderstanding of what measurements are taken and which dataset goes into which metric. Your rants regarding the relative merits of each are built upon this foundation, a crumbling edifice demonstrating an inability to locate and verify information that even a high school student should be able to find, read, and understand. Don’t be surprised then when your babbling is relegated to the junk drawer of cranks, hacks, and yes – deniers.
Moderator comment. Please try and tone down personal attacks~Charles the moderator
“The Advanced Microwave Sounding Unit, (AMSU-A), is a cross-track, line-scanning instrument designed to measure scene radiances in 15 discrete frequency channels which permit the calculation of the vertical temperature and moisture profile from about 3 millibars (~45 km) to the Earth’s surface.” (Emphasis mine.)
http://ghrc.msfc.nasa.gov/uso/readme/amsu-a.html
I think your post speaks for itself, Earle.
[…] Al better work fast, because his ’settled science’ is becoming unsettled, real fast. […]
Boris,
If you can point me to a global temperature metric that incorporates MSU surface measurements I will cede the point in your favor. In the meantime I will note that you now appear to be advocating the position that all satellite systems measure surface temperature. Well done, a complete reversal from your first post in this thread.
[…] to “save the planet”, except take a science course. The end result is a lot of politicking, shoddy science, more taxes, more proposed regulation, intrusiveness, calls for McCarthy-style witch hunts and […]
[…] to “save the planet”, except take a science course. The end result is a lot of politicking, shoddy science, more taxes, more proposed regulation, intrusiveness, calls for McCarthy-style witch hunts and show […]
[…] that have been experiencing record cold this summer. NOAA data is suspect anyway because of the use of surface stations – not just their placement, but even the decline in stations that are even […]