
Update 2: Reader Jesse Michael forwarded me this animated image above, which does a better job than the flawed NASA image or it’s replacement I found below. It takes about a minute to complete the whole sequence, patience.
While looking for something else, I came across this image from the NASA visualization website. I located the hires TIFF image and annotated it as seen below. I also made a desktop wallpaper out of the TIFF file for those interested. It reminded me to remind you all about perspectives, so here is some perspective on size, solar luminosity, and on our planetary energy budget.

Click here for a larger (TIFF format without annotation) image from NASA
Click here for a desktop wallpaper image (1280×1024 JPEG)
UPDATE: It appears that the NASA provided image above , the source of which is from this NASA page, unbelievably, is wrong. As reader Erik points out, the sun is too large. I initially had some misgivings about the solar size also, but figured NASA wouldn’t possibly botch such a basic comparison. Shades of the Hubble mirror fiasco.
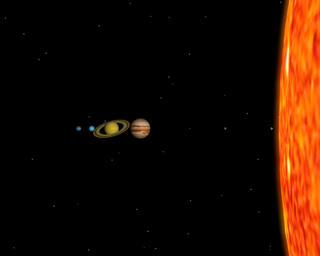
Here is another image from NASA JPL that appears to be correct:

Click for larger image from JPL
Note: image above is L-R mirrored for comparison to first image.
Note that distance is not to scale, but planetary and solar size is. To get an idea of distance scale, read this excellent example from Kitt Peak Observatory.
A few factoids:
- It would take about 109 earths to equal the width of the suns diameter (Sun=1.39 million km Earth=12,700 km)
- Over 1 million Earths would fit inside the Sun’s volume
- The sun has a total luminosity output of 386 YottaWatts
(386,000,000,000,000,000,000,000,000 watts, some background here and here)
- The total luminous energy output received by earth from the sun is 174 PETAWATTS (174,000,000,000,000,000) watts.
- A 0.1% increase in luminosity dumps an extra 174 trillion watts (174,000,000,000,000) watts into our planetary energy balance.

Data source for graph: http://www1.ncdc.noaa.gov/pub/data/paleo/climate_forcing/solar_variability/lean2000_irradiance.txt
Note: In the graph above, the low flatline from 1645-1715 is the Maunder Minimum, a period of virtually no sunspots, where the historical reports from the northern hemisphere tell a story of dramatic climate change: harsh winters, cools summers, crop failures, famine and disease.
From the abstract referenced above: “Estimated increases since 1675 are 0.7%, 0.2% and 0.07% in broad ultraviolet, visible/near infrared and infrared spectral bands, with a total irradiance increase of 0.2%. “
So its not just 0.1 %, it is 0.2% which translates to a 348 TeraWatts global irradiance increase.
Now lets put 348 trillion watts into perspective:
Hurricanes: the heat energy released by a hurricanes category 1-5 equals about 50 to 200 trillion watts or about the same amount of energy released by exploding a 10-megaton nuclear bomb every 20 minutes.
Katrina, released about 200 trillion watts over its life cycle.
Now imagine double that amount of extra energy being added to earth’s atmosphere every second by small increases in the suns output that have been documented to exist. That’s what the increase in solar irradiance is doing. Since 1675, after the depths of the Maunder Minimum, we’ve seen an increase in solar irradiance of about 2.5 watts per square meter.
Climate modelers say that the extra CO2 equates to a forcing of about 2 watts per square meter, which totals about 1.12 Petawatt (1,120,000,000,000,000 watts). The problem is, they can’t always recreate that reliably between all of the different models out there, with the positive and negative feedback mechanisms, and other variables involved. There’s disagreement on the total contribution. A lot of it. Nonetheless they seem all to agree that CO2 makes some contribution, and that’s likely true. But compared to the sun, I believe it’s minimal.
Now lets look at us: 13.5 TeraWatts is the average total power consumption of the human world in 2001.
Compared to solar variance, do you think we could change the planets atmospheric energy balance with that if we squeezed all the power we made that year together and radiated it into our atmosphere ?
What is very clear though, when you look at history, and the graph above, is that our earths atmosphere and resulting climate is extremely sensitive to variations in solar output. The sweet center point seems to be about 1365 watts per square meter of irradiance…what we consider as “normal” climate. Take 1.5 watts/sq. meter away, and we get significant cooling, harsh winters, cool summers, and increases in ice and glaciers. Add 1.5 watts,/sq. meter and we get hotter summers, mild winters, and melting of ice and glaciers.
Now irradiance aside, as it’s only one component, there’s also the chnage in the suns dynamic magnetic field and solar wind, which according to Svensmark, which modulates the number of cosmic rays that enter our atmosphere (I think there may be some possible effect also due to modulation of the earth’s magnetic field), which modulates the number of clouds that form, hence changing the net surface irradiance. Plots of changes in the suns magnetic field line up very well with climate change.
Here is a little more on perspective and our place in the universe:
There’s a tendency to view ourselves, our endeavors, and our accomplishments as the pinnacle. Yet, compared to whats in our solar system, whats in our galaxy, and whats in our universe, we are but a mere speck in the vastness of time, space, mass, and energy.


“Katrina, released about 200 trillion [b]watts[/b] over its life cycle.”
Should be ‘Joules’, yes? One Watt is one Joule/s, and we’re talking about the whole shebang, so it should be in ‘total energy’ not ‘energy per second’. If it isn’t Joules, it might be expressed in Watt-hours, but that should also be converted to something sane – like Joules :D.
Excellent post. And we presume to think we can know enough to predict our future…
I should point out, in case someone gets the wrong idea, that the elephant is an allegory for the sun, and its methane expulsion are coronal mass ejections.
REPLY: Too late, sorry. I already deleted the previous comment because it was OT and made no sense that I could resolve.
Thanks for the post, perspective is everything. There’s a neat little java program that sums things up in much the
I hate to be nerdy, but I am pretty sure that the planetary-solar-perspective image does not have the right scale for the sun. The diameter of the sun is about 10x the diameter of Jupiter, (which in turn is about 11x the diameter of earth).
Based on a radius-of-curvature fit in GIMP, that sun image shows a sun at least 10x too big.
Otherwise, I love the post.
Sorry to be pain, but It’s my skeptical nature that makes me a fan of the blog. (And your good work)
-Erik
REPLY: Well, the source of this image is NASA, you’d think as the world’s leading space agency, they’d get it right. But, it is worth double checking. -Anthony
Update: You are correct. Unbelievably, the NASA image I first used is wrong. I’ve provided a second one. I initially had a bit of misgivings about it, but then I figured that NASA wouldn’t make such a basic mistake in a web presentation. But they did, yikes!
An excellent way of putting this whole thing in perspective. Here’s another way ~ the total amount of CO2 in the atmosphere {as a percentage of the atmosphere} has risen .01%, from .03% to .04%. I know that usually this is represented as a 33% increase, but that’s just as a measure of CO2, not the total atmosphere. That’s one way I manage to keep that small detail in perspective.
Alan,
I believe you are correct.
Katrina did not use a total of 200 trillion watts of energy, Katrina was using 200 trillion joules of energy per second. I would assume the 200 trillion watts is the average power used by Katrina over its lifetime.
Watt is a unit of power, or of a measure of joules per second.
As it takes 4.19 joules of energy to heat up a gram of water 1 degree centigrade, this would indicate Katrina was capable of heating 47.7 trillion grams of water 1 degree centigrade every second.
The heat of fusion for ice is 30.1 x 10**7 joules per meter**3.
This means the energy expended by Katrina, every second, could melt 6.64 x 10**5 cubic meters of ice, or 664,000 cubic meters of ice.
Divide 200 x 10**12 joules by 30.1 x 10**7 joules per cubic meter of ice for the above calculation.
There are roughly 3.0 x 10**16 cubic meters of ice in the arctic.
It would take the Katrina equivalent of energy production 4.5 x 10**10 seconds, or, 1,426 years to melt the arctic ice cap.
Divide 3.0 x 10**16 cubic meters by 6.64 x 10**5 cubic meters of ice per second.
I always love to sit back and try to put things in perspective, which is why this particular topic is so fascinating. Numbers lose their power when they are just viewed as numbers. We always need to ask, “Just how big is big”?
Those comparisons of the different celestial objects really brings the point home.
So its not just 0.1 %, it is 0.2% which translates to a 348 TeraWatts global irradiance increase.
Per year?
Otherwise very good. Well done.
Great post Anthony !!
Since we are wandering around Mars……….. Antares in perspective…….
http://en.wikipedia.org/wiki/Image:Redgiants.svg
Very well explained – thank you
How is irradiance measured? Can we trust teh measurements for 1611?
Do the irradiance numbers show what is hitting the Earth or leaving the Sun?
If it is showing what is hitting the Earth than the lattitude of the instrument would need to be considered. I suppose that more recent numbers are from satellites and would therefore need to be adjusted (here we go again) to be equivalent to ground based numbers.
“So its not just 0.1 %, it is 0.2% which translates to a 348 TeraWatts global irradiance increase… Now lets put 348 trillion watts into perspective….:”
Thank you for some hard numbers that laymen can understand. When I hear algorean science believers scoff at “a mere .1% change in solar irradiance”
I now have the ammunition to show them what it really means.
the total amount of CO2 in the atmosphere {as a percentage of the atmosphere} has risen .01%, from .03% to .04%. I know that usually this is represented as a 33% increase, but that’s just as a measure of CO2, not the total atmosphere.
I believe that 33% increase in C02 has been shown to be incorrect, as it is based on data from ice cores which had clathrates, which take up C02: Climate Change: Incorrect information on pre-industrial CO2. The average pre-industrial C02 in the air was actually more like 335ppm, not the 290ppm the Alarmists like. Taking todays’ level as 390ppm gives an increase of about 55ppm, or a 16.4% increase in C02, about 1/2 what the alarmists claim. Funny, how what the alarmists claim now that it isn’t the C02, per se that’s causing the warming, but the feedbacks. They are simply grasping at straws now.
Antares; isn’t that the sun where “Altair-4”, the planet from “Forbidden Planet”, was orbiting; it must have been a hell of a distant orbit!
Anthony,
Excellent post, but (don’t ya just love excellent… but comments) a couple of things
I got a tad confused about the irradiance figures because you do not specify a time period, I’m assuming /sec for the sun’s output, but I’m not sure what it is, especially the reference to the 10 megaton bomb. If it is /sec, then, as a previous poster indicated, it is joules.
Do you have a reference to Dr. Svensmark’s work because the idea that the sun would modulate the earth’s magnetic field is new to me. I’ve read heis book, “The Chilling Stars”, and it indicates he believes that the earth’s magnetic field plays little role in stopping the GCR involved in cloud formation because the GCRs involved contain too much energy. Has he modified his theory recently?
REPLY: You are correct, Svensmark didn’t say it, that is my take on it. I should have been clearer, and I’ll label that as such.
As for irradiance, see this: http://physics.lakeheadu.ca/courses/Astro/2330/Props/Lumi.htm
Why do all of the TSI graphs stop at 2001-2005? What are the current numbers?
….. Everything is a matter of perspective. If you can’t get yer head around something…. There’s little chance of understanding the full implications.
… That Antares is certainly, a big arsed star!
so the question must be . . . How does human caused CO2 influence Solar Irradiance ? there must be a TBD link between my SUV’s tailpipe and the Sun
Talk about perspective. Thanks for the insight.
Forgive me if this is a question with an answer inherently obvious to all except me. It has been 30 years since I took calculus and physics.
Under “factoids”
• The sun has a total luminosity output of 386 YottaWatts
(386,000,000,000,000,000,000,000,000 watts)
• The total luminous energy output received by earth from the sun is 174 PETAWATTS (174,000,000,000,000,000) watts.
• A 0.1% increase in luminosity dumps an extra 174 trillion watts (174,000,000,000,000) watts into our planetary energy balance.
It is my understanding that a “watt” is a unit of work/energy and the sun produces that energy at a certain rate per unit time, i.e. watts/second (or hour, day or year).
I think that the time units are missing in the factoids. Otherwise, these numbers would seem to be the total energy provided by the sun over its lifetime to date.
Oh, and Anthony.
Thank you.
Yours in bewilderment,
Steamboat Jack
REPLY: See these, it may help in your understanding:
http://physics.lakeheadu.ca/courses/Astro/2330/Props/Lumi.htm
http://physics.uoregon.edu/~soper/Sun/luminosity.html
http://ircamera.as.arizona.edu/NatSci102/sunlab.pdf
Antares is actually smaller than Betelgeuse.
I think that is a labeling error.
One thing overlooked in the Cosmic Ray cloud formation model is that clouds are CONDENSED water droplets from WATER VAPOR.
Water vapor holds a lot of heat that it has to give up when it condenses. If CR causes that process of condensation to occur at a higher rate, then more heat is released of which some will radiate into space.
What happens when you make the condenser on your AC system more efficient? The working fluid gets a lot colder and then the working fluid ( in a natural sycle system ) pumps faster.
The working fluid in the Earth is the air.
“How is irradiance measured? Can we trust teh (sic) measurements for 1611?”
It’s inferred from isotope ratios, Leif Svalgaard posts here and at Climate Audit occasionally, his research (and his links) cover that topic in detail.
Oho!
I did some checking around and discovered that Antares is now considered bigger than Betelgeuse.For many years it was the other way around.
This link is a list of the largest known stars:
http://en.wikipedia.org/wiki/List_of_largest_known_stars
I discovered that Antares is now considered bigger than Betelgeuse.
OOps.
At one time it was the other way around.
REPLY: Proof yet again that science is not static.
Note that distance is not to scale,
Whew! Had me quite worried there for a minute – about NASA. If scaled, Earth should be about 3,000 X farther away, I believe.
Thanks, Anthony!
cohenite “Antares; isn’t that the sun where “Altair-4″, the planet from “Forbidden Planet”, was orbiting”
No, Altair 4 in “Forbidden Planet” was the 4th planet in orbit around the star Altair, a normal type A main sequence star larger, brighter and younger than the sun. You can see Altair rising in the East after sunset.
This perspective, and the corresponding posting on cooling and speculations on LIA raises the question: is there any research being done of how one could stop an ice age? Anybody know any links?
Off hand I would expect this should be one of NASAs projects. ( Hansen has said once that CO2 will not allow the next ice age, but I do not mean this)
Suppose total irradiance reaching the earth is the problem. As a physicist I would study a la science fiction opening huge aluminum reflectors in geostatic orbits where the famous climate models ( lets hope they improve soon) say it would do most good. These will reflect back the escaping energy much better than any green house. Or they could reflect the sun.
I would also think of raising the albedo of the moon, maybe by some gas or other that would need to be replenished but would do the job.
Suppose it is anomalous cloud circulations or water circulations. Focus on the spots with converging mirrors and boil away the disturbance. These numbers show there is plenty of energy available .
Here is somebody who had a go at the calculations for the moon:
http://answers.yahoo.com/question/index?qid=20070723043632AA54FeE
Seems the moon’s albedo is only 12%.
These are just off the cuff ideas, but instead of sitting and thinking ” woe, another LIA would be disastrous” we should at least be actively studying how to use the large means available to combat it, instead of wasting money chasing non existent CO2 boogie men. Such a study, and a study of the cloud injection sailing ships would give humanity a control of the climate both ways for the first time.
REPLY: “Hansen has said once that CO2 will not allow the next ice age…”
Anna do you have a reference as to where he said that?
Some time back I saw or received something about how the Russians (or perhaps Bush) used a weather control machine to create/direct Katrina into NO. Looking at the energy levels, a friend had but one question: Where would you plug it it?
Hurricanes happen a lot. Far more power than anything humans can manage. And the biggest storm isn’t a spec of dust compared to that big orange thing.
So why is Congress so concerned about converting to CFL’s ?
REPLY: Better yet, where would you covertlky obtain and distribute that much energy? I put weather control up at the absurdity top of scale like the 911 Turth movement, please no discussion here.
Well, let’s see. The global alarmists are willing to destroy the economy to prevent global warming. anna v is willing to take drastic steps to prevent a new ice age.
But what about cosmic catastrophes that we have absolutely no control over such as a gamma ray bursters within 8000 light years or a super nova within 100 light years? Add to that the threat from the Yellowstone super volcano which could destroy the US when it pops.
Now if there is no Creator, then we are freaking doomed, as the Mogambo would say, by any number of cosmic disasters, so why sweat it? “Eat drink and avoid gloom for surely we are doomed”.
But if there is a Creator, is it likely that He would wish us to spend so much time and energy on threats we may have no control over? Particularly when we still have major problems just getting along with each other?
I read somewhere that if we had a weather station in every cubic foot of the atmosphere that it would still be impossible to predict the weather for more than a couple of weeks in advance. I know, weather is different from the global climate but still this should humble us a bit, don’t you think?
There is a rule in bridge that if it is only possible to win a hand if the cards lay a certain way, then the logical thing to do is ASSUME they lie that way.
This is Sunday so forgive the God talk, please.
Bring on the abuse.
Hansen, Schneider: catastrophic new ice age by 2021
U.S. Scientist Sees New Ice Age Coming
Washington Post and Science magazine
The world could be as little as 15 or 25 years away from a disastrous new ice age, a leading atmospheric scientist predicts. Dr. S. I. Rasool of the National Aeronautics and Space Administration and Columbia University used a computer program by his colleague, Prof. James Hansen, that studied clouds above Venus.
By 2021, fossil-fuel dust injected by man into the atmosphere could screen out so much sunlight that the average temperature could drop by six degrees, resulting in a buildup of new glaciers that could eventually cover huge areas.
(July 1971)
Sorry. I do not have a link with Hansen’s CO2 will not allow next ice age. It was back at the end of last year when I was not really very skeptical, and took it in my stride.
I was reminded of it by a comment on one of the other threads, where somebody else made the same claim in a lecture. I could try searching if you think it is important.
From: When Will the Next Ice Age Begin?
“That insulating blanket has a bigger climatic influence than the slight flux in incoming solar energy from changes in Earth’s orientation relative to the Sun, said Dr. James A. Hansen, the director of NASA’s Goddard Institute for Space Studies.
“We have taken over control of the mechanisms that determine the climate change,” he said.”
http://www.nytimes.com/2003/11/11/science/11ICE.html?ex=1383886800&en=f88e6d42c112b4ca&ei=5007&partner=USERLAND
So here he says it to a science reporter. I seem to remember a talk, but it has not turned up on the search,
Richard Mackay’s literature review titled Rhodes Fairbridge and the idea that the solar system regulates the Earth’s climate was published in the Journal of Coastal Research last year.
The Australian scientist Rhodes Fairbridge developed theories on the relationship between the Sun, solar system, Earth’s climate over three decades before passing away in 2006. Fairbridge emphasized that the answer to the question “Does the Sun affect the Earth’s climate?” has to be in terms of three processes. 1) “variations in the quantity, intensity and distribution over the earth of the solar output, inlcuding electromagnetic radiation, matter and the sun’s electromagnetic field; 2) the variable gravitation force the sun exerts on the earth, the moon and the earth as a system; 3) and interactions between some or all of these processes.”
The affect of solar system gravitational fields on the earth’s climate is interesting.
The article is a good review of who is doing what in solar climate physics. Henrik Svensmark is strangely absent from the list.
The link is below.
http://www.griffith.edu.au/conference/ics2007/pdf/ICS176.pdf
anna v:
Interesting idea. I wonder how large they would have to be. My guess is HUGE. Because of that, it would also be fascinating to figure out how to keep them in orbit. Light pressure and solar wind would be a constant force pushing them away from the sun changing the orbit to elliptical. This would likely reduce their effectiveness and also likely contribute to their early demise.
Whether or not there is a “creator” is irrelevant. Our instincts are to survive. And if we cripple economies and outlaw carbon emissions, we’ll never get off this planet.
Anthony,
“I think there may be some possible effect also due to modulation of the earth’s magnetic field”
Actually, as mentioned above there is no known modulation. Neither would one matter if it existed. A total shut-off of earths magnetic field wouldn’t matter much to cloudiness as the sun is soo much more efficient in controlling the flow of GCR at the energies that matter (above 10 GeV). Earths magnetic field on the other hand is much too weak to affect these particles and hence variation in earths magnetic field doesn’t really matter to cloudiness, lest there is another (unknown) mechanism.
PoetSam
There is an ancient greek saying: With the help from the goddess Athena, still use your hands.
Kismet is what the east believes in: fate. In the west we are different, there is even a poem
Under the bludgeonings of chance
My head is bloody, but unbowed.
I am the master of my fate;
I am the captain of my soul.
-W.E. Henley (1849-1903)
in Invictus
Nothing like the very latest and current data to illustrate the point that major level solar wind ram pressure spikes and possible associated joule heating may also affect our climate
During May 2008, there were no major solar wind ram pressure spikes over 10 nPa. There was an average of 2- 3 spikes in the high temperature anomaly months during the record setting year of 2005. Also during May 2008, there was only one spike over 5 nPA, namely 6 nPa. There were an average of 9 spikes of > 5 nPa in the high temperature anomaly months during 2005. UAH reported that the temperature anomaly for May 2008 was the 4th coldest since 1979.
Here is the summary for the first 5 months of this year which has been colder than normal.
There were only 2 spikes of 10 nPA or more for the first 5 months of this year By May 2005 there had already been 13. During the first five months of 2008 there were 16 spikes of 5 nPa or more By May 2005 there had been 30 spikes. The CRUTEM 3 [global air/land] temperature anomaly which I use will not be available until late June but the temperature anomaly for the first 4 months is O.437.May will bring it down more, The average for the first 5 months temperature anomaly for 2005 was 0.726
JANUARY –MAY 2008
AVERAGE NUMBER OF SPIKES [10 & >] nPa PER MONTH 0.4 [TO DATE 2]
AVERAGE NUMBER OF SPIKES [5 & >] nPa PER MONTH 3.2 [TODATE 16]
MONTHLY GLOBAL LAND AIR TEMP ANOMALY PER CRUTEM3 [0.437 up to April only] [MAY not available yet but is expected to be cold]
Compare this with the record temperature year like 2005
YEAR 2005[12 months]
AVERAGE NUMBER OF SPIKES [10 & >] nPa. PER MONTH 2.75 [YEARLY 33]
AVERAGE NUMBER OF SPIKES [5 & >] nPa. PER MONTH 9.3 [YEARLY 112]
YEARLY GLOBAL LAND AIR TEMP ANOMALY PER CRUTEM 3 0.745 C
The solar wind ram pressure spikes are based Omniweb hourly plots
No one argues that the sun is not an enormously important part of the climate system. Indeed, there is strong evidence that a good portion of early-20th century warming is in part caused by increasing TSI.
The important question, however, is about trends. And there seems to be no trend in TSI or cosmic rays over the past forty years that could explain the modern warming trend. I wrote an article on this a few weeks back (and had it reviewed by Judy Lean, the source of your TSI data): http://www.yaleclimatemediaforum.org/ccm/0508_solar.htm
Anthony, Anna,
The claim that CO2 would prevent another ice-age is one that Hansen, Broecker, and others have repeatedly made (though, unfortunately, I heard these statements in talks, there are no links available that I can find). There is a New Scientist article on this subject available here: http://environment.newscientist.com/channel/earth/energy-fuels/mg19526183.000-fossilfuel-hangover-may-block-ice-ages.html
The gist is that Milankovitch cycles that catalyze ice ages involve relatively small perturbations in the distribution of solar energy that trigger an important ice-albedo feedback. However, by 2100 we will likely have an atmospheric CO2 concentration that is modeled to produce an amount of radiative forcing that exceeds that of Milankovitch cycles. If CO2 levels remain high indefinitely, the arguement goes, it would be nearly impossible for a new ice age to occur (barring something unseen in the climatic history of the past few million years).
That said, by the time Milankovitch cycles would lead to the next ice age (estimated to be around 15k to 20k years from now), who knows what the atmospheric concentration of CO2 and other GHGs will be…
The daily solar irradiance figures can be obtained from the two currently working TSI instruments PMOD and SORCE. PMOD has declined quite a bit in the last few months while SORCE is recording what is to be expected at the very bottom of the solar cycle.
What is very interesting, however, is that the most recent Solar Flux number from today, June 8th, was 64.8, which is the second lowest daily measurement ever recorded since the records began in 1950. The record low for any one day is 64.4 .
Sorry, Anthony, I screwed up on the name. The computer remembered my previous nom-de-plume.
Update: You are correct. Unbelievably, the NASA image I first used is wrong. I’ve provided a second one. I initially had a bit of misgivings about it, but then I figured that NASA wouldn’t make such a basic mistake in a web presentation. But they did, yikes!
Ah, Anthony, you now understand the logical fallacy of “recourse to authority”.
Now, Jim Hansen works for NASA; go figure….
Sorry, Anthony, I must ask the obvious question; the stupid one. I’m just venting.
Point: The Earth receives so much radiation and warms up, according to Stephan-Boltzmann, to the point where it will radiate the same amount of radiation.
Thus: CO2 can NOT “heat up” the planet. The source of heat for the planet is only the Sun.
If: CO2 warms up the surface of the Earth by absorbing and re-admitting “infra-red radiation”, would it not also do the same to incoming like radiation?
REPLY: I’ll let commenters chime in on this.
anna v
I too am the captain of my soul. It’s just that the crew are a pack of mutinous drunkards with no sense of direction.
On the topic; yes, all those stars and planetty things are very big and completely beyond our control, but I’m not so sure our perspective is all that faulty. If your dog just died, then from your perspective that’s probably a more significant fact than the diameter of Antares. Nothing wrong with it unless you think you can bring the dog back, or ‘tackle’ the climate.
“the next ice age (estimated to be around 15k to 20k years from now”
Any links to that estimate? My understanding was that it was overdue, i.e. the Holocene was now longer than most (many?) interglacials.
So, Zeke, if it isn’t the sun causing climate change, then it must be C02, or more specifically, man’s contribution of C02? Correct? First it is the sun, then suddenly it’s man’s C02 causing warming? Neat trick, that. Please explain. We’re all ears.
NASA
Never A Straight Answer.
Sad but true………
Hmmm…. so do I. You have to realize that a lot of the images and websites are generated by PR people who don’t always check their graphics, etc before publication.
The second image isn’t much better than the first. At least the asteroid belt gap is there in the first although Mercury seems to be missing and the gap between Venus and earth is too large. The planets are (very) roughly equally spaced logarithmically. There’s an obvious gap at the asteroid belt. Table
Showing relative size and keeping proper distance scale may be incompatible. Could be why the second image isn’t to distance scale.
Robert Wood (14:40:01) :
Think of it as a blanket. A blanket keeps you warm by preventing the loss of heat. You also need to realize that the incoming and outgoing energy differ in wavelength. This may be of help. This is the first time I’ve seen it but after a quick read, I think it’s probably right insofar as radiation/absorption is concerned.
Anna,
Captain of your soul?
But what about your brain?
A single cosmic ray
could make you quite insane.
Anna, just one more thing, girl …
Yes, we should always do our best but a little perspective helps one to remain calm. Calmness is counterintuitive to many but the history of combat (of all things!) shows it to be imperative.
With my limited understanding, it seems that CO2 mostly absorbs reradiated light from the Earth itself. It and H2O suck up all the incoming from the sun and have done so for quite a while. The only thing left is what the earth produces as a result of absorbing other wavelengths. CO2 absorbs at a couple of points in the near IR, reradiates around 10 microns.
So, what happens to the 10u wavelength? Other things must absorb it in order to warm up. If CO2 is really getting 97% of what it can (I need to find a source for this) then how much more can it do? Hard to absorb more than 100% of something unless you are a government program.
wow, this is amazing, great post!
Here is a good article that lays out the solar system, to scale in a baseball field… http://www.noao.edu/education/peppercorn/pcmain.html
It’s probably written for kids, so I must be a kid at heart. Pretty amazing.
Dav:”Think of it as a blanket. A blanket keeps you warm by preventing the loss of heat”
This description of the “greenhouse effect” on Earth is completely wrong. There is no barrier that seperates two air masses of differenent temperature as you describe. The Earth’s “greenhouse effect” is more like a car. When sunlight passes through the glass windows it’s wavelength is changed to infra red. The inra red energy cannot pass back out through the glass and accumulates inside the car. However, if you open the windows the trapped energy escapes that way. Since water vapor is the major greenhouse gas, a clear, dry night is like opening up the car windows allowing much of that energy to escape back out into space. If our atmosphere acted the way you describe, we would indeed have an unlivable planet ala Venus. But it doesn’t so we don’t.
Found this little exercise that gives some idea of the scale of the solar system.
Sun-any ball, diameter 8.00 inches
Mercury-a pinhead, diameter 0.03 inch
Venus-a peppercorn, diameter 0.08 inch
Earth-a second peppercorn
Mars-a second pinhead
Jupiter-a chestnut or a pecan, diameter 0.90 inch
Saturn-a hazelnut or an acorn, diameter 0.70 inch
Uranus-a peanut or coffeebean, diameter 0.30 inch
Neptune-a second peanut or coffeebean
Pluto- a third pinhead (I know it’s no longer a planet)
You will have found in advance a spot from which you can walk a thousand yards in something like a straight line.
Put the Sun ball down, and march away as follows.
10 paces. Place Mercury
Another 9 paces. Venus puts down her peppercorn.
Another 7 paces. Earth
Another 14 paces. Mars
Another 95 paces to Jupiter
Here is the “giant planet”-but it is a chestnut, more than a city block from its nearest neighbor in space!
Another 112 paces. Saturn
Another 249 paces. Uranus
Another 281 paces. Neptune
Another 242 paces. Pluto
You have marched more than half a mile! (The distance in the model adds up to 1,019 paces. A mile is 1,760 yards.)
Zeke,
Think of it this way. When you place a pot filled with 70C water on a stove and turn on the burner (assuming it is gas so the max temp reached is immediately) does the temp of the flame have to increase for the temp for the water temp to increase? This is why the fact that irradiance has been relatively steady over the last 30-40 years is irrelevant as to whether it is responsible for the heating we’ve experienced over the last 30 odd years. The level of irradiance has been high enough to heat the earth. I don;t know that this is still true though. Anyone have measurements of the irradiance as of 2008?
Zeke:”… there is strong evidence that a good portion of early-20th century warming is in part caused by increasing TSI… And there seems to be no trend in TSI or cosmic rays over the past forty years that could explain the modern warming trend.”
“No trend” assumes the temperature data has been correctly adjusted in the past forty years and the early 20th century.
Zeke-this issue is more complex than Judith suggests. Certainly not all of her colleges would agree with her-For instance, Richard Willson and Alexander Mordivinov:
http://acrim.com/Publications/JGRL2002/2002GL016038%20Secular%20total%20solar%20irradiance%20trend%20during%20solar%20cycles%2021%9623.pdf
With Cosmic Rays, its important to look at the correct energies. Unfortunately, Neutron chambers are way to low. However, if you look at ion chambers, the result is different:
http://www.sciencebits.com/files/pictures/climate/ionChamber.png
The reference is:
Ahluwalia, H. S.: 1997, ‘Galactic Cosmic Ray Intensity Variations at High Latitude sea Level Site
1937–1994’, J. Geophys. Res. 102, 24,229–24,236.
re: no trend in cosmic ray measures.
This is a statement that may reveal a lack of understanding regarding cosmic ray affects on ozone and water vapor. You would not need a trend of “more intense rays”. You would only need to show that at certain levels and increased length of time, rays can penetrate deeper into the atmosphere, thus causing a trend in temperature or cloud formation when the atmosphere is ripe for such seeding. The cosmic ray graph shows interesting shapes: 1. pointed and flat, maximum highs and lows, and peak time. It is possible that these shapes can have more or less influence on climate, depending on the shape.
The Lean TSI chart has reared it’s head again. It is also prominently featured in this article:
http://co2sceptics.com/news.php?id=1396
and is the only one referenced in the resources (I think).
Now according to Leif this chart has been discredited by his chart Leif 2007 and others especially Dora. Others like Krivova and Wang show somewhat the same pattern as Lean. Lean’s graph shows what appears to be a good correlation with sunspots. Leif/Dora show absolutely no correlation with sunspot number. Shades of let’s get rid of the MWP (sorry Leif but it tweaks my BS meter – unfairly I would think).
Now I think the article linked makes a very good point. The TSI has gone up during the 20th century and it has stayed at an elevated level for an extended time. The fact that it has not been constantly increasing is irrelevant. The sun has dumped a lot of heat into the system. (May there be an upper and lower limit to TSI?). Another thought – is the area under the curve indicative of the amount of energy transmitted by the sun? – just vaguely remembering some math.
Can we have a discussion of why the TSI graphs vary so much? Are they using different proxies? Has this article any validity?
Anthony.
You say
———–
“Now lets look at us: 13.5 TeraWatts is the average total power consumption of the human world in 2001.
Compared to solar variance, do you think we could change the planets atmospheric energy balance with that if we squeezed all the power we made that year together and radiated it into our atmosphere ?
————
This sentence means could be somewhat misleading to the less-than-strictly scientific mind. While it puts in perspective the total amount of energy we put into Earth’s surface system(1), the figure does not take into account the long term greenhouse effect of the CO2 liberated by the combustion of sub-terranean fossil fuels (which, fortunately, you discussed somewhere else in the post).
The post could have been improved by discussion / comparison of anthropogenic CO2 vs naturally occuring CO2.
Nevertheless, this post is so good I forwarded the URL to a lot of people.
Keep up the amazing work!
JFA in Montreal, Canada
(1) in fact, a little less that the quoted figure, since we use, apart from fossil fuels and nuclear, some renewable energy like hydro-electricity and wind which, ultimately, derive their energy from the Sun, adding nothing to the Earth’s surface thermodynamic reservoir
Bill (06:05:18):
First: I’m no scintist in this field.
Svensmark don’t say that the magnetic field of the earth isn’t stop GRC, but it stop a less amounts of high energy GCR. The amount of high energy GCR is lower when magnetic solar winds as a shield — an umbrella — “protect the earth”. These two phenomenon means a noticable difference depending on the sun activity in the GCR impact on the earth’s surface. (Low energy GRC wont reach the earth surface anyway, and a difference of these reaching the earth surface then makes no bigger difference.)
Well, my comment is simple and no heavy science (since I’m on scientist) anyway, but let me add these two pictures from The Chilling Stars.
Picture 5, showing how little of the original energetic GRC that reach the surface of the earth:
http://farm4.static.flickr.com/3194/2563732330_e898d3b45e_o.jpg
Picture 6, which shows the effect of the earth magnetic field on high-, intermediate-, and low energy GRC respectively:
http://farm4.static.flickr.com/3033/2563732418_a06ab835ba_o.jpg
Finally: The GCR-low level cloud connection is extremely good! See the figures in this document by Palle, Butler and Brian from 2004 (where the conclusion I think as usual somewhat downplay the actual result):
http://www.arm.ac.uk/preprints/433.pdf
Avfuktare Krypgrund VIND: I guess You’re not even close to be a scientist, so how can You claim you have knowledge in this subject? Oh, of course! You are not at all a scientist. That’s why You can do it! Excuse me.
Avfuktare Krypgrund VIND: Sorry my rudeness, but isn’t this graph
http://farm4.static.flickr.com/3194/2563732330_e898d3b45e_o.jpg
show that modulation of the magnetic field of the earth — also driven by the sun’s magnetism — should have some impact on the GCR’s which is assumed to affect low level clouds, even if it isn’t a major one? (Isn’t, also, the impact on low level clouds from by GRC ionized particles created from reactions between GRC and the magnetic field of the earth? But I’ve got almost no knowledge here!!!!!)
Zeke Hausfather (12:21:39) :
you said:”However, by 2100 we will likely have an atmospheric CO2 concentration that is modeled to produce an amount of radiative forcing that exceeds that of Milankovitch cycles. If CO2 levels remain high indefinitely, the arguement goes, it would be nearly impossible for a new ice age to occur (barring something unseen in the climatic history of the past few million years).”
Isn’t it interesting though that CO2 has not managed the last decade to overcome the effects of PDO? I wonder what the scale of PDO “forcings” versus Milankovich “forcings” is. Maybe we can put another nail down on the anthropogenic CO2 theory coffin.
That said, I have an inherent dislike to the concept of “forcings”. I keep getting the picture of a finger pushing an elephant and expecting to move it backwards or forwards. Or expecting that by jumping up and down the earth moves. The whole heat capacity and inertia of the atmosphere/land/ocean system is trivialized.
Hmmm. It looks like the Earth Sciences have a way to go before their numbers line up:
I’ve run into this rule a few times:
1.0 degrC = 3.3 w/m-2 over the Earth’s surface (I’ve seen it cited a few times)
OK, we’ve seen roughly 0.8 degrC warming since the late 17th C.
So then:
( 3.3 * 0.8 ) =’s 2.64 w/m-2 warming since the 17th C. (roughly)
So if the change in solar rad. since the 17th C. was 2.5 w/m-2,
Then:
( 2.5 / 2.64 ) =’s 92% was due to solar radiance increase
OR
8% increase due to non-solar effects
Then:
( 0.8 * 0.07 ) =’s 0.06 degrC due to non-solar effects (human-caused)
That’s not jibing with the climatologist’s claim of 2 w/m-2.
They’re claiming a 60% CO2 effect of that 0.8 degrC (2.64 W/m-2) temperature rise, or 0.48 degrC CO2 effect.
Also I can’t get the 384 tW value to work with 510T m-2 Earth’s surface to get the 2.5 w/m-2. Am I missing something? 3.3 w/m-2 comes to ~1.7 PW, so I think I’m doing something right. Is this an apples vs. oranges issue?
Anna poses an excellent question.
We must first note that Milankovich cycles have induced glaciations for only the prior 2 million years or so. Before then the same orbital eccentricities happened, but not ice ages. Imbrie makes an excellent case, in his Ice Ages-Solving the Mystery, that the tectonic drift of Antarctica over the South Pole is the primary causal factor forcing (forgive me Anna) Ice Ages. When a continent sits upon a pole, global oceanic circulation is constrained, hence global temp moderation via watery mixing is limited, and ice builds up on the polar continent.
A solution then might be to stir the pot. We could nuke Antarctica, bust the ice shelves off, and tow them north beyond the southern circumpolar current. Eventually they’d work north toward the Equator and melt. That would cool the Tropics but warm the S. Pole, and keep the H2O in circulation instead of stuck in polar ice caps, thus counteracting the Milankovich positive feedback forcing that induces glaciations.
Go ahead and scoff, but I lay claim to this idea, and someday Mike’s Nuclear Summer will save the planet, not to mention Civilization and the Human Race. I expect a few posthumous statues, if not elaborate temples built in memorial to my genius. Be the first on your block to get on in the action, by setting up a small shrine in my honor today.
that new scale animation is really good!
Where can i find the link to it?
I would like to use it in class.
Denis
REPLY: just do right-click, “save as” and save it to your hard disk. Or “properties” to get the URL of the image.
anna v; good image with the finger; of course one may say the advocates of AGW have been giving the rest us the finger for some time; it is amazing that the mechanism by which CO2 traps heat and therefore forces temp is still not understood; CO2 interacts with a narrow part of the IR part of the spectrum; incoming IR interacts, in a very limited way, with CO2 due to the dipole inactivity of CO2 and the double degeneracy of its spectrum sensitivity; excitation of a CO2 molecule takes longer than collisional deexcitation which causes emmission of a photon from the CO2 molecule; that photon can go up or down; if it goes down it will be reemitted from the earth’s surface according to Stefan-Boltzman as IR which in turn will reinteract with the atmospheric CO2 which have been collisionally deexcited; and so on; and apart from albedo, clouds, H2O dominance of the relevant IR absorbtion spectrum and logarithmic saturation limits, there you have the CO2 mechanism for creating earth’s greenhouse effect. Is it any wander it is not commonly understood?
Robert Wood (2008.06.08 15:56)
Robert Wood is right to be puzzled by the greenhouse effect. All the usual analogies I have seen (greenhouses, blankets, cars) are nonsense.
Let’s try and forget about greenhouses. Here is a non-numerical explanation I offer for the examination of the other contributors to this excellent blog. If some genius wants to add the numbers to this account, be my guest!
First of all, let’s imagine an Earth somewhere in deep space without a sun and without an atmosphere. In this situation the temperature of the Earth would be in equilibrium with its surroundings, i.e. as cold as space (throughout this treatment let’s ignore all geothermal warming). All parts of the Earth, superficial and internal would be at the same temperature.
Now let’s see the Earth orbiting the Sun, but still without an atmosphere.
During the day the entire irradiation of the Sun would fall on the surface of the Earth.
Depending on the reflective properties of the surface material (=albedo) a proportion of this radiation would be absorbed, raising the temperature of a relatively thin layer at the surface. As the temperature of the surface layer rises, it will emit correspondingly more radiation (=Planck’s Law).
Importantly, since the surface is solid there will be no convection – even with a liquid surface, the temperature gradient would be the wrong way up for convection to take place.
Let’s ignore conduction, since the materials found at the surface of the Earth are generally very poor conductors, and, as noted, all geothermal effects are ignored.
If the Earth did not rotate on its axis the temperature of the sunny side would increase until it reached an equilibrium of energy input (solar irradiation) and
output (radiation back into space – the final heat sink).
As a consequence the temperature of the surface on the sunny side would be extremely high. The dark side of the Earth would also be in equilibrium with the temperature of space, i.e. would be very cold.
If the Earth is rotating, heated up surface from the irradiated side would pass into the dark side and radiate a proportion of its heat back out to space.
There would be a large temperature swing, but the average temperature of the rotating Earth would be the same as the stationery Earth: the body in space is
going to achieve an overall input-output equilibrium (=Planck’s Law) with its surroundings whether it is rotating or not.
Now add an atmosphere. This atmosphere has three properties of interest to us at the moment:
1) it can absorb solar radiation to some extent (but let’s not get into numbers and absorbers at the moment);
2) being a gas, it can convect, that is, it can transport heat vertically and in turn create other transport mechanisms such as winds;
3) unlike the surface, which is effectively a two-dimensional absorber/emitter, the atmosphere is a three-dimensional absorber/emitter.
During the irradiated part of the rotation, the atmosphere absorbs solar irradiation in its own right. Since this increases the temperature of the atmosphere, it also increases the radiation of the atmosphere: hotter gas molecules radiate more energy (=Planck’s Law).
Some of this radiation goes back out to space, some is absorbed by other molecules in the atmosphere, some reaches the surface. The atmosphere also absorbs a proportion of the radiation emitted by the hot surface.
There is therefore a general mixing up process – since the atmosphere is a gas – and the energy absorbed by the atmosphere is distributed (in a complex way) within
the entire three-dimensional body. Compare this with the relatively thin layer of heating that takes place on the surface of the rotating body without atmosphere.
On the dark side, the atmosphere:
1) emits some of its energy back into space;
2) absorbs some of the energy emitted by the hot surface;
3) emits some of its energy towards the surface;
4) continues convecting.
The result of all this is that the atmosphere acts as a **buffer or reservoir**.
1) During the day it soaks up a proportion of the solar irradiation, surface reflection and surface radiation, thus keeping the surface cooler than it would otherwise be.
2) During the night it continues to absorb surface radiation, but radiates and convects a proportion of its stored energy back to the surface.
The starting point of the GW argument is that if the absorption capacity of the atmospheric buffer (a.k.a. ‘greenhouse effect’) is greater – the ‘reservoir’ can hold more water, if you like – the surface temperature of the Earth will increase. But that’s another argument…
Hemst101 – re Lean 2000
This paper by Scafetta and West nicely summarises the changes in TSI as reported by Lean at various times (1995, 2000 and 2005) showing a significant reduction in TSI variability magnitude in the latest results.
http://www.acrim.com/Reference%20Files/Sun%20&%20Global%20Warming_GRL_2006.pdf
Global Warming and the Sun…
Tigerhawk makes a reference to a very good write up on planetary perspective. One part of that concerns the sun’s effect on the temperatures of the planets around it, specifically the Earth’s temps. What is very clear though, when you…
So I got a little curious and took a peak Solar flux history, shown here http://www.dxlc.com/solar/history/ and find that todays Solar Flux reading of 65 — from http://www.dxlc.com/solar/ is remarkably lower than reading from last 20 years. In 1990 the flux readings were in the 200-300, it seems to have stayed in that range until 2005 when it dropped into the 80-90 range and has drifted lower to its present range today. This seems to correspond with the precipitous drop in sunspot activity that occurred in 2005 as well.
Magnus,
I am a huge advocate of Dr. Svensmarks work, I’ve read his book “The Chilling Stars” several times and am awaiting the results of the ‘CLOUD’ experiment being run at CERN as we speak.
I think I understand what folks are talking about as far as the sun ‘modulating’ the earth’s magnetic field. The solar wind does impact the earth’s magnetic field, ‘compressing’ it on the sunward side, but that does not mean the same thing to me as ‘modulating’. By ‘modulating’ I would expect that the sun would be causing changes in the strength of the field, which I don’t think it does. The earth’s magnetic field has been decreasing for the last few hundred years, many thinking this is in preparation for a polarity change, for which we are overdue.
That was an awesome post! It’s great to learn lots about perspective. 😀 Thanks for posting this!
Hey Tony,
I just had an epiphany reading It dawned on me there might be some crucial understanding about TSI that all the AGWers have in all likelihood overlooked.
Stratosphere temperatures in the Post-Pinatubo era fell, and fell quickly, evidently from aerosols attacking the ozone layer. The presence of ozone warms the stratosphere (it also warms the surface as a ground-level pollutant). And since 1993 the stratosphere has warmed slightly (JunkScience, 2005).
http://junkscience.com/MSU_Temps/Stratosphere1278-1204.gif http://www.globalwarming.org/node/835 http://www.junkscience.com/MSU_Temps/Stratosphere.html
Milloy shows a sudden & market -0.6 degrC drop in temperatures in the stratosphere quite evidently due to Pinatubo’s ozone-destroying effect. That’s nearly +2 w/m-2 hitting the upper troposphere that the ozone layer hasn’t been trapping in the stratosphere.
With that would have come a much much higher level of UV hitting the ground. Evidently this has indeed happened, SO2 did deplete ozone from the stratosphere:
http://www.sciencemag.org/cgi/content/summary/295/5558/1242
http://climate.envsci.rutgers.edu/robock/robock_res.html#vol
http://www.sciencemag.org/cgi/content/abstract/299/5615/2035
Response of a Deciduous Forest to the Mount Pinatubo Eruption: Enhanced Photosynthesis.
But with that would be extra air-warming UV hitting the upper troposphere. An inverse cooling effect was shown with less UV hitting the upper troposphere during the Little ICe age from lower UV (from loss of sunspot faculae) hitting the upper troposphere. This lower-UV effect from TSI was modeled by Drew Shindell in 2001 to have caused the LIA.
For the past 16 years since Pinatubo the stratosphere has remained relatively cold to the extent that it has only warmed slightly (also contrary to AGW theory, BTW), so were it not for the -0.33 W/m-2 (-0.1 w/m-2) average drop in TSI, coincidentally starting in the early 1990’s, the upper troposphere would still be taking the full brunt of extra ozone heating. That leaves us still with an extra +1.6 w/m-2 hitting the upper troposphere which right there would make for a tropospheric forcing of +0.5 degrC (rule of 1.0 degrC =’s 3.3 w/m-2).
That’d be a lot of extra heating in the upper troposphere & would add one more variable to explain the warm decade of the 1990’s. That we’re still in a post-Pinatubo era of a much-cooler, yet slightly warming, stratosphere may speak well to the rate of ongoing ozone recovery.
If lower UV can cause a little ice age, higher UV can cause a little heat age.
I’m still downloading Robock’s powerpoint slide on this, I can’t read the full body of his presentation to see what he says. I see no mention of this question anywhere online…
Has anyone discussed this possibility before?
Tom in Florida:
Not really. There are three ways that heat is carried: 1) conduction 2) convection 3) radiation.
Conduction requires physical contact so is out of the picture in the GHG scenario. Greenhouses, bed blankets and car windows work by limiting convection. However, Earth can’t lose heat to space by convection. It can only be radiated away so “greenhouse effect” is a bit of a misnomer.
Consider that spacecraft keep themselves warm by the use of thermal blankets. These are designed to reflect IR and prevent its radiation into space. It’s that shiny gold stuff you see in many photos taken by astronauts. Oddly enough though, one of the major problems in spacecraft design is getting RID of heat. The blankets are more commonly used to protect equipment exposed to sunlight from further heat buildup by reflecting the light away.
Most anything that blocks heat flow is analogous to a blanket in my book.
What you’ve describe is exactly how a greenhouse operates. However that can lead to the wrong picture — for one, that car would have one heck of a bright infrared signature caused by escaping infrared. Opening the window doesn’t allow “accumulated infrared” to escape. The escaping energy in your closed car scenario (or in a greenhouse) is taken away by airflow. It’s important to realize that radiation is the only mechanism that is important WRT Earth’s heat content.
On a somewhat different level, both analogies work insofar as they give a picture of energy in with impeded way out.
???
I said (in toto): “Think of it as a blanket. A blanket keeps you warm by preventing the loss of heat. You also need to realize that the incoming and outgoing energy differ in wavelength.”
I’m not sure how your statement follows from mine.
I believe the latest thinking on the current status of the Milankovitch cycles suggests that Earth is in period of relative stability in terms of the orbital conditions which lead to ice ages.
So we are 10,000 to 15,000 years (or more) away from ice age Milankovitch conditions.
I note the 100,000 year ice age cycle only goes back about 750,000 years and before that the ice age cycles were closer to 41,000 years so things can change over time.
Anthony,
Can’t you correct the article
– it’s pretty meaningless to discuss Petawatts, 1% here, 2% there when the article contains statements like:
“Katrina, released about 200 trillion watts over its life cycle.”
I mean, come on, Mr Watts, wot is a Watt?
What is the difference between energy & power?
– it’s kinda basic to this discussion
REPLY: Watts is energy over time, note that it says “over its life cycle”.
Note similar references (in watts) to hurricanes in general, the gulf stream, and the atmosphere here:
http://en.wikipedia.org/wiki/Orders_of_magnitude_%28power%29
Sure I could explain it in “joules” but then 90% of the readership would have no understanding of it. My job here is to help people understand scale, using units unfamiliar to the majority won’t help.
Anthony,
LoL! Don’t worry I know what a ‘Watt’ is!
My questions were rhetorical
Watts = Joules per second
– ‘over its life cycle’ is meaningless in this context then
– ‘average’ or ‘peak’ or ‘rms’ would be more meaningful here
REPLY: OK. well if you can come up with something that the general reading audience could understand easily feel free to suggest it.
Something like:
“Katrina’s power output was about 200TW during it’s most active period”
(I’m not an expert on hurricanes, so I don’t know how you define it’s start & end)
So imagine the effect of the power two Katrinas being added to the atmosphere continuously for 11 years…….
🙂
Anthony: “Sure I could explain it in “joules” but then 90% of the readership would have no understanding of it. My job here is to help people understand scale, using units unfamiliar to the majority won’t help.”
Then maybe it would be best to use kilowatt-hours. Saying Katrina used N watts over its lifetime makes as much sense as saying a car used N mph over its lifetime instead of saying it lasted through X miles of travel.
Anyway you raise some interesting points
– over the last 100 years the average power output of the sun has increased by 0.1%
– and if we accept a 1 degC temp rise over the same period
– this is 0.3% increase (from absolute zero)
– so these figures are at least of the same magnitude, so it seams reasonable that at least some (and possibly, as large proportion) of the temp increase can be attributed to the increase in the Sun’s power output
Also, according to your graph, the min-max variance over the solar cycle has doubled in the last century (or 50 years)
– so this might contribute to inceased variability in the climate.
I have a question about TSI
– what proportion of the TSI is in the heat-causing frequencies?
– i.e. infra-red
– the visible light increase & ultra-violet won’t contribute to heating
– so it the variance/change in solar output evenly spread across the spectrum, or is it more at some frequencies than others?
re: myself (above), on post-Pinatubo ozone loss possibly adding to the hot troposphere temperatures of the 1990’s:
Graph of ozone drop in post-Pinatubo 1990’s
http://omsriram.com/GlobalWarming_files/GlobalWarming2.jpg
Anyone know where there are data on UV levels & temperature trends for the upper troposphere during the 1990’s?
Phil
Visible Near-IR does indeed causing heating in the oceans and soot particles.
Likewise UV heats the upper troposphere as well, and during solar minima the absence of UV-emitting sunspot faculae leads to a cooling of the troposphere. Drew Shindell modeled the direct effect of the Maunder Minimum’s loss of UV-driven heating on the upper troposphere in precipitating the Little Ice Age. The total TSI decrease is controversial, but the effect is indeed known, if not widely discussed.
“- what proportion of the TSI is in the heat-causing frequencies?
– i.e. infra-red
– the visible light increase & ultra-violet won’t contribute to heating
– so it the variance/change in solar output evenly spread across the spectrum, or is it more at some frequencies than others?”
I think you might be misinformed Phil. Infra-red being the heat-causing frequency isn’t quite correct.
Any light energy that can be absorbed by a material will emit heat/re-emit light energy at a lower frequency.
You can see this when you look at different coloured materials.
ie
white doesn’t get as warm because it doesn’t absorb visible light.
black gets very warm because it absorbed the spectrum of visible light.
I think the misunderstanding occurs because we have heat detectors that measure infra-red radiation.
also, look a microwave oven. It uses microwaves (lower frequency than infrared) to excite water molecules and create heat which cooks food.
Lambert, Dave,
Thanks – pardon my lack-of-thought!
DAV is still scribbling on about greenhouses and autoglass, despite my last posting.
See if I care. Here’s ‘Greenhouse Effect, Part II’:
When a photon of solar irradiance reaches the Earth a number of things might happen to it:
1) Like most of its colleagues it may pass through the Earth’s atmosphere and whack into the Earth’s surface.
It may be a very lucky photon and be **reflected** off some water or the plane of an ice crystal at the correct angle (‘sea-glint’) and go shooting back out into space. Next stop: Mars or the Crab nebula…
It may also be a lucky photon and be sent back into space as a result of surface albedo (not quite the same as geometric reflection).
Most photons arriving at the surface are not lucky and get absorbed, that is they increase the temperature of the absorber, which in turn will cause the absorber to emit more energy at a lower wavelength (Planck’s Law, again). Don’t sit on the sidewalk in shorts in midsummer.
2) Some photons are only half lucky. They interact with molecules, very small particles and aerosols and suffer **scattering**. Scattering doesn’t change the ‘wavelength’ of the photon, it just bats it out again, usually in a different direction (I simplify: this process is not a kind of internal reflection inside the molecule).
Scattering depends on the wavelength of the incoming photon and the size of the particle. (The interaction of different kinds of scattering is famously responsible for blue sky, although most of the explanations of this I have read are as cracked as those for the greenhouse effect.)
A scattered photon may go straight back out into space; it might even suffer further scatterings, or just hit the surface at a different point than it otherwise would.
3) Some photons are **absorbed** by molecules or particles. The energy of the photon raises the temperature of the absorbing molecule. The increase in temperature may cause it to emit radiative energy at a lower wavelength (Planck’s Law, yet again), although the temperatures found in the troposphere (-50°C at the top) or the surface layer (normal air temperatures) will clearly not toast bread.
Some molecules, particles and aerosols (a.k.a. greenhouse gases) absorb photons better than others. They also have their own preference for the wavelength of the photons they absorb, but for this discussion this is not terribly important: energy is energy.
In short, greenhouse gases and other absorbers absorb solar irradiance before it gets to the Earth’s surface. They therefore WARM THE ATMOSPHERE AND COOL THE SURFACE.
Whether there is a net gain in the overall energy absorption of the Earth as a result of the presence of atmospheric absorbers is a tricky question. Over a black asphalt road, for example, if an atmospheric absorber doesn’t swallow the photon then the road probably will; over a glistening layer of new snow the photon that got past the absorbers on the downward path will have a fairly good chance to take another white-knuckle ride back out through the atmosphere again.
That’s it.
(Anthony: unless this contribution shuts everyone up could we continue this subject on a more appropriate thread?)
Caveat – I can’t stand “Coast to Coast AM” and consider what is discussed there to be mostly rubbish.
However, maybe there is something to 2012.
My thought is, the “something” is not “the end of the world.”
More of a mode change. And in many ways a subtle mode change. However, the change imparts a sort of momentum change – a subtle but powerful thing.
Something in between the Maunder and the Pleistocene, in terms of impact. That’s my bet.
“Not really. There are three ways that heat is carried: 1) conduction 2) convection 3) radiation.”
Someone forgot the water planet caveat. Doh!
Listen to Peter or lose your audience.
Bill Illis: 64.8! Oooh, ooh, put out a suicide watch at GISS and Austin. Call for lidocaine and oxygen!
Has anyone noticed that the planets are almost unbearably beautiful? I am sure there is a perfectly satisfactory neo-Darwinist explanation for this since that theory (given enough time), can explain everything. But if I though about it, it would spoil everything.
I think I’ll stick with YOU KNOW WHO.
Yes…the diagrams of planets are astonishingly beautiful. Can’t figure out why though! Visual graphics almost beat the real thing! LoL
Ken,
Cheap shot but I left an opening so you score. But you are correct, they are almost as beautiful as the real thing. On a related note, have you ever seen a diagram of a tropical fish or a tropical bird that comes even close to the real thing?
Andrew. To put the suns irradiance into perspective. I live at in Brisbane at approximately the same latitude as Tampa Florida. Here in this part of area of Australia we have the highest incidence of skin cancer in the world. So why doesn’t Tampa have a similar problem? I would say – without being definitive – that the majority of Tampas inhabitants have fair skin through having a European background just like the folk here in Brisbane. Perhaps one factor for the difference is that we have summer when the Earth is 147.5 million kilometres from the sun (January 3rd in 2009), and Tampa has summer when the Earth is at 152.5 million kilometres from the sun (July 4th this year). This means that the sunshine is approximately 6.47% stronger here in Brisbane. So when I am lying on the beach in summer, there are ~88 more watts per square metre around me than for when someone from Tampa lies on their beach in summer.
Andrew. Please excuse the Grammar in my last post, it is winter here and we are so far from the sun that my fingers are falling off!
REPLY: No problem – stay warm. – Anthony
Hi,
Probably a bit late, about the perspective and scales I keep in my bookmarks a link to a flash animation that goes scaling down from the universe to a proton. Really good.
http://www.nikon.com/about/feelnikon/universcale/index.htm
Gorka Ion.
AB: How much time do you folks spend outdoors? On this side of the Equator, we’re mostly couch potatos, watching the tube and playing video games. Don’t get sunburned that way.
In Colorado, at 2000+ meters above sea level, we get a lot more from that big orange thing as well. Flatlanders who nap in the sun learn the hard way.
Perhaps you could try some hot tea, a cinnamon stick, a spoonful of honey and a shot a Apricot brandy. Keep you warm until the ics caps melt…:)
Andrew,
Ultrviolet light gives us tan, sunburn and skin cancer. Perhaps it’s life style that creates the difference. Some background: Tampa itself (about 1 hr north of my location) has no real beaches as it is not on the Gulf of Mexico. However, the entire Tampa Bay area including St Petersburg, which is on the Gulf, would normally be included in any statistics. A vast majortiy of Tampa area residents are from the north and have not lived their whole life in the strong sun. Many later life skin cancers are due to continuous overexposure during ones younger years. There is a large Latino population in the area who are less likely to get skin cancer due to their darker skin. A large portion of the population is over 60 and do not go out in the sun nor hang out at the beaches. In addition, many bingo halls are open during day light hours. 🙂
Peter
Your Greenhouse Effect lesson stands what I thought I knew about GHGs on it’s head.
I was under the impression that:
The energy of the sun that reaches us surface dwellers is mostly in the range to which the atmosphere is transparent causing the surface to heat.
The surface then emits its heat as IR and convection.
Greenhouse gasses are good absorbers of IR and when they re-emit some of this will be downward making them act like a blanket.
Is it back to school for me?
PS
I appreciate your efforts.
Regards
Terry
For TD (23:21:52)
Hi Terry
Thanks for your comments.
I can understand your problem with my rather flip explanation: I was being too brief.
I apologize in advance for the length of the current post, but you raise some interesting points and I shall try to deal with them properly.
INFRARED
Dave (10:35:41) touched on one of the keys to the solution. We have to stop thinking of radiative (heat) energy as just IR. All radiation is energy, and the higher the frequency / shorter the wavelength of a photon the more energy it contains.
When a photon is **absorbed** by a particle its energy goes into the kinetic energy of the particle and raises the quantum energies of the electrons it contains (=heating up). Under certain circumstances photon(s) of lower frequency are emitted (=cooling down). Planck’s Law describes the relationship between the temperature of a body and the energy and wavelength of the photons that are emitted.
High energy, short wavelength photons (visible light and higher) tend to interact with matter by causing the emission of lower energy, longer wavelength photons (IR). Returning to Dave’s example, a black object absorbs visible light, heats up and in turn radiates perceptible heat (=IR).
The spectrum of the solar irradiance – that is, the light that arrives at the earth – can be approximated to the radiation of a blackbody at a temperature of 5780°K. You have to look at the curve to see the full implications of this, but for our purposes we can note that the majority of the energy we receive from the Sun is mostly in the visible range of the spectrum, roughly in the wavelength range of 0.4µm (=approx. violet visible light)..1.0µm (=approx. near IR).
The photons arriving at the surface of the atmosphere – which, if we include the thermosphere, can be 150km+ thick – may or may not interact with the particles of the atmosphere in the way I sketched in my previous post. They may even survive the descent and be reflected at the Earth’s surface, only to suffer and interaction on the way out again. Interactions can be with gas molecules, aerosol particles, condensates etc. Photons can not only be scattered and absorbed, they can also trigger important photolytic reactions in the atmosphere whilst being absorbed. With so many possibilities available, describing the process numerically is a tremendously complex business.
The atmosphere is also a complex structure. I nearly jumped into the post about the beneficial effects of CO2 in the atmosphere to point out that it depends very much on where the CO2 is. In the boundary layer next to the surface (approx. 1km thick) CO2 will probably have some effect on plant life; in the troposphere or stratosphere, none at all. An aircraft that discharges its CO2 into the lower stratosphere is not going to help the beans in my garden one bit. I was so entertained by MA and Anthony, though, that I thought my trivia would be out of place.
But I digress. If you look at a graph of temperature against height of the atmosphere (here’s an example ) you will see that the temperature of the atmosphere at the top of the stratosphere has almost reached surface values. At the top of the thermosphere – although the atmosphere here is barely dense enough to be able to speak of a ‘top’ – the temperature can be well in excess of 1000°C. All this energy comes from solar irradiance.
My point is that you cannot just take visible light as – well, just light – and ignore it by just focusing on the absorption of IR. It’s all energy, and things happen when it interacts with matter at all levels of the atmosphere. In consequence, it is not terribly important for the overall energy balance for us to know which bit of the spectrum a particular gas absorbs. O3, for example, is fortunately for us a strong absorber of UV, although the interaction in this case leads principally to photodissociation. All kinds of things in the atmosphere – dust, vapours, aerosols, condensates – absorb a wide range of light wavelengths, which is why the AGW focus on CO2 is just obsessive. If a particle absorbs a photon of visible light and emits a photon of IR that seems to me to be just as important as a particle that absorbs a photon of IR (which it may have got from the first particle).
BLANKETS
The blanket keeping the Earth warm is, like greenhouses, an analogy too far in my opinion. A blanket is a device that interrupts convection effectively. A simple thought experiment will make this clear.
Imagine you are lying naked next to Julie Christie under a thick woollen blanket in the snowed-in dacha in the movie ‘Dr Zhivago’, discussing, say, convective forcing in the troposphere. Body heat would rise to the blanket, but because of the poor heat transfer through the blanket, the air above would be only slightly warmed and only a weak convective flow would be established above it.
How unpleasant this would soon become! – and how much better a simple thin silken bedsheet would be!
In this case, body heat would convect to the sheet, the sheet would heat up and establish a strong convection in the cold night air of the dacha above it, transporting the heat away and enabling us to continue our discussions in comfort far into the night.
There is no comparable blanket effect in the atmosphere – not even clouds. There is nothing that acts as a barrier to convection. As I pointed out in my first post on this subject, if the atmosphere heats up during the day it returns heat to the surface and continues absorbing a portion of heat radiated from the surface.
The absorption of energy in the atmosphere is the role played by the so called greenhouse gases. One of the principal gases is water vapor. A dry desert becomes blazingly hot on the surface during the day and freezingly cold at night because dry, clear air is a poor thermal reservoir, not because there are no clouds to blanket it and keep the heat in. You would need an awful lot of CO2 to achieve the same result.
A ‘greenhouse gas’ cools the surface during the day and warms it at night, so I think we are broadly in agreement.
I apologize once more for this windbaggery – just imagine what an earful Julie Christie would get…
Peter
Peter,
Great post. I learned as I lurked.
Thanks
Great info Peter, however, I am not sure our younger readers will understand the reference to “Imagine you are lying naked next to Julie Christie”.
I’m imagining. Oops, the blanket has turned into a tent …
Tom in Florida (17:48:41)
I think you would be surprised what young people can imagine these days.
Steve Stip (19:13:05)
LOL. Tent? Greenhouse!
Thanks for the feedback
Peter
Tom in Florida (17:48:41)
Doh! You are not referrring to the act of darkness, but the reference to an actress in a movie that was made so long ago that it contained scenes of deep snow and therefore must have been set in a time before AGW really kicked in.
Yep, from my perspective anyone under 60 could indeed be classed as ‘younger readers’, so I apologize for being so obtuse. Memo to self: drink more coffee.
In order to make the analogy relevant to the young uns out there, who would you choose?
Peter
Mars …
Courtesy of [Junk Science](http://www.junkscience.com/): For sobering perspective on reality, read on [here](http://wattsupwiththat.wordpress.com/2008/06/07/some-planetary-perspective/). Also [NASA desgin a satellite](http://science.nasa.gov/headlines/…
In reference to the discussion of carbon dioxide and infrared radiation: I work with an FTIR (Fourier Transform InfraRed) Spectroscopist who knows quite a bit about carbon dioxide. He uses a machine that bombards samples with infrared, and then analyzes the spectroscopic signal that comes from the sample. Carbon dioxide absorbs all the infrared in certain specific bands, so an FTIR spectroscopist has to ensure that the atmosphere around his sample is quite free from carbon dioxide.
If carbon dioxide re-emitted those specific bands, then there would not be a problem, because what was being absorbed would be emitted again. The carbon dioxide does not do that. It simply sucks up those specific IR energy bands, and would keep doing it forever.
The other problem with talking about radiation being absorbed and emitted, is that the radiation being emitted is always (99.999% of the time) going to be of a different wavelength, or is going to be at least an order of magnitude less strength than the original absorbed radiation. If the emitted radiation is a different wavelength, then it is probably a wavelength which is not absorbed by carbon dioxide. If the emitted radiation is a smaller amplitude, then it will have a lot less effect the next time it is absorbed. If we assume that the wavelength remains the same, it would not take very many absorption/emittance cycles before the amplitude becomes so small as to be nonexistent.
The climate modelers really want to believe that what is absorbed will always be what is emitted. They sometimes go so far as to say that from each absorption comes an emission that goes both up and down, with both emissions being the same amplitude as the original absorption (two for the price of one).
I just recieved this yesterday.So I have not have had the time to read it up well.But thought someone here might find this fascinating.A possible Sun/Jupiter sunspot modulation connection being considered.
Timo Niroma:
Sun and Jupiter.
http://personal.inet.fi/tiede/tilmari/sunspot2.html#jupiter
His main page is here:
http://personal.inet.fi/tiede/tilmari/sunspots.html#alert
Makes me wonder if some of the planets have a direct influence on the sunspot cycle.Jupiter apelhion and Perihelion cycles seems to effect the solar cycle.
Sorry all but I got confused in this post a little.
Okay so the Global Warmers believe that CO2 forcing is creating 1,120,000,000,000,000 Watts of extra heat, whereas the Solar Irradiance increase is only 348,000,000,000,000 Watts… I can see why they would think this is insignificant as 348,000,000,000,000/1,120,000,000,000,000 is a small percentage of what they feel is the real cause of global warming since the increase in solar irradiance would only account for 31% of the warming of the earth. leaving 69% attributable to CO2…
Just trying to understand. Please let me know if I am off base on this.
Janice (06:59:39)
There are lots of species your spectroscopist needs to keep out of the sample, not just CO2. Most of the gases fingered as ‘greenhouse gases’ exhibit strong absorption of infrared at various wavelengths, most of them being **very much stronger absorbers** than CO2.
Your statement about CO2, however, that it ‘simply sucks up those specific IR energy bands, and would keep doing it forever’ is not correct, since this would break the First Law of Thermodynamics, the conservation of energy.
Absorption of a photon always increases the energy of the absorber in some way. The type of energy increase depends on the wavelength of the photon. IR photons increase the vibrational energy of the absorber, in effect its temperature. At some point the absorber emits energy in the form of one or more photons, the energy of which is usually below that of the absorbed photon(s), i.e. having a longer wavelength.
Your spectroscopist would notice this as a shift or displacement: an absorption minimum that would be shadowed by an emission maximum at a lower wavelength – in other words, an emission spectrum as opposed to an absorption spectrum.
Your analogy of emitted energy becoming weaker and fizzling out after a number of absorptions and emissions also violates the First Law of Thermodynamics. The input energy has got to go somewhere, either increasing the temperature of the absorber(s) and/or emitting other photons.
‘…is that the radiation being emitted is always (99.999% of the time) going to be of a different wavelength, or is going to be at least an order of magnitude less strength than the original absorbed radiation.’ I have a particular problem with the ‘or’ in that statement.
Photons are quantum objects. Their wavelength is related to their energy. They don’t have a separate amplitude – you can’t have stronger photons and weaker photons, just more or fewer of them.
An ‘order of magnitude’ is a multiple of ten: I don’t see how this follows from your statement.
An ’emission that goes both up and down’: have you a source for this statement?
Sorry to be so picky.
Peter,
Thanks for instructing Janus and us. I did not find your post “picky” at all, but very instructive.
It may be just me, but I think I would like the guy who named the largest known star, essentially, “big dog”. Great choice for a name!
Forgive for being an ‘Idiot’ + The visual of the Sun, and the Earth, is size of a peppercorn- I believe, we are more distant, than what the models speculate. Due to the fact, with a lite over chase of clouds to filter the sun, [winter- hard baseball/summer – grapefruit]