Global Sea Ice Reference Page: Arctic and Antarctic current graphs and imagery

Shortlink for this page: http://wp.me/P7y4l-5Kc (suitable for blog or Twitter comments)
All images are displayed from either their source or, if the file names include timestamps, are automatically created copies updated soon after appearing at their source.
Global Sea Ice:
Global, Arctic, & Antarctic Sea Ice Area

Arctic Graphs:
Arctic Sea Ice Extent – 15% or greater:

JAXA Arctic Sea Ice Extent – 15% or Greater:


JAXA data download (CSV file of extent) here
Arctic Sea ice extent 15% coverage or greater (DMI)

Arctic Sea Ice Extent 15% or Greater (NANSEN):

Nansen data (CSV file with both extent and area) download here
Arctic Sea Ice Area:

Nansen data (CSV file with both extent and area) download here
Sea Ice Extent – Change in Maximum, Mean and Minimum

Arctic Sea Ice Forecast from NOAA:

Northern Regional Sea Ice Charts
Map of the Arctic – Thanks to REP

Ice coverage charts by supplier
Norway Meteorological SAF – http://polarview.met.no/
Russia’s “Arctic and Antarctic Research Institute” offers a sea-ice map that distinguishes between first and multi-year ice on their winter maps – http://www.aari.ru/odata/_d0015.php?lang=1&mod=1
Cryosat-2 ice thickness data, based on actual measurements, not modelling – http://www.cpom.ucl.ac.uk/csopr/seaice.html
Graphs of Ice Coverage by Basin
Central Arctic: NSIDC
Baffin Bay/Gulf of St. Lawrence: NSIDC
Baltic Sea: NSIDC
Barents Sea: NSIDC – Arctic ROOS
Beaufort Sea: NSIDC
Bering Sea: NSIDC
Canadian Archipelago: NSIDC
Chukchi Sea: NSIDC
Cook Inlet: NSIDC
East Siberian Sea: NSIDC
Greenland Sea: NSIDC – Arctic ROOS
Hudson Bay: NSIDC
Kara Sea: NSIDC – Arctic ROOS
Laptev Sea: NSIDC
Sea of Okhotsk: NSIDC
Yellow Sea: NSIDC
Sources:
National Snow and Ice Data Center (NSIDC)
Arctic Temperature:
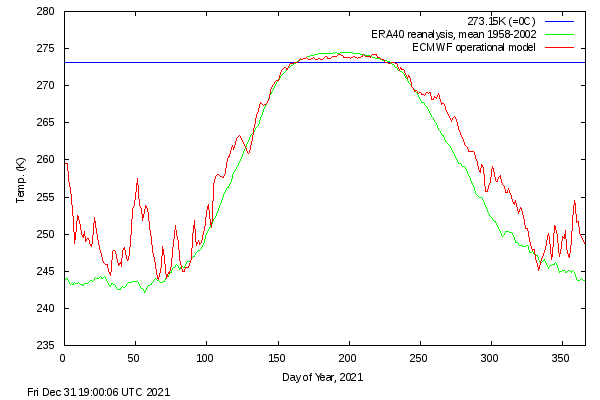
Mean Temperature above 80°N

Original source: http://ocean.dmi.dk/arctic/plots/meanTarchive/meanT_2021.png
Source and historical files: http://ocean.dmi.dk/arctic/meant80n.uk.php
RSS Northern Polar Temperature Lower Troposphere (TLT) – 1979 to present

Northern Hemisphere Surface Temperatures

Arctic Sea Surface Temperature

NRL – Arctic Sea Surface Temperature – 30 Day Animation
NRL – Arctic Sea Surface Temperature – 365 Day Animation
Moyhu – Arctic Sea Surface Temperature – 50 Day Animation
Moyhu – Arctic Sea Surface Temperature – 365 Day Animation
Sea Ice Concentration:
Arctic Sea Ice Concentration

Arctic Sea Ice Concentration – 30 Day Animation
Arctic Sea Ice Concentration – 365 Day Animation
Canadian Sea Ice Concentration

Arctic Sea Ice Extent With Anomaly

Arctic Sea Ice Thickness

N.B. Per the University of Bremen: Thin sea ice occurs during the freezing season. In the melting season, the thickness of sea ice is highly variable and the emission properties in the microwave change due to the wetness of the surface and occurrence of melt ponds in the Arctic. Therefore, thickness data are calculated only during the freezing season, that is from October to April in the Arctic and from March to September in the Antarctic. During the melting season, the procedure does not yield meaningful results.
Real-Time Nowcast/Forecast in Meters

Arctic Sea Ice Thickness – 30 Day Animation
Arctic Sea Ice Thickness – 365 Day Animation
Arctic Sea Ice Speed & Drift

Arctic Sea Ice Speed & Drift – 30 Day Animation
Arctic Sea Ice Speed & Drift – 365 Day Animation
Ice Drift in the Arctic Ocean:

N.B.: DMI says this is demonstration product. Frequently the images rendered will simply be wrong.
Arctic Sea Ice Volume
Model from the University of Washington (Note: this is only updated monthly, and is a model output, not a real-time observation, details here)

Source: [ http://psc.apl.washington.edu/wordpress/wp-content/uploads/schweiger/ice_volume/BPIOMASIceVolumeAnomalyCurrentV2.1.png ]
Greenland Ice Sheet surface mass balance images from Polar Portal’s Greenland pages


Arctic Satellite Imagery:
True Color Arctic Satellite Image – With Google Maps Zoom – arctic.io – Infrared and Global imagery is available from the Arctic and Global dropdowns on the map linked above.
Terra 4km True Color Arctic Satellite Image – Mosaic Image – With Zoom – NASA
Terra 4km Bands 3-6-7 Arctic Satellite Image – Arctic Satellite Mosaic Image – With Zoom – NASA
Aqua 4km True Color Arctic Satellite Image – Mosaic Image – With Zoom – NASA
=============================================================
Antarctic Graphs:
Antarctic Sea Ice Extent – 15% or Greater

Southern Hemisphere Sea Ice Area
JAXA Antarctic Sea Ice Extent – 15% or Greater:


JAXA data download (CSV file of Antarctic extent) here
Antarctic Temperature:
RSS Southern Polar Temperature Lower Troposphere (TLT) – 1979 to present

Antarctic Sea Surface Temperature

NRL Antarctic Sea Surface Temperature – 30 Day Animation
NRL Antarctic Sea Surface Temperature – 365 Day Animation
Moyhu Antarctic Sea Surface Temperature – 50 Day Animation
Moyhu Antarctic Sea Surface Temperature – 365 Day Animation
Antarctic Sea Ice Imagery:
Southern Hemisphere Sea Ice Extent With Anomaly

South Pole Station Webcam

Source Guide:
Danish Meteorological Institute (DMI) – Centre for Ocean and Ice
Home Page – http://ocean.dmi.dk/english/index.php
Arctic Page – http://ocean.dmi.dk/arctic/index.uk.php
arctic.io
Home Page – http://www.arctic.io/
climate4you.com – Ole Humlum – Professor, University of Oslo Department of Geosciences:
Home Page – http://climate4you.com/
Ole Humlum Bibliography – http://climate4you.com/Text/BIBLIOGRAPHY%20OLE%20HUMLUM.pdf
moyhu – Nick Stokes
Home Page – http://www.moyhu.blogspot.com.au/
Regional Hi-Res SST Movies – http://www.moyhu.blogspot.com.au/p/sst-regional-movies-as-described-here-i.html
Collection of High Resolution NOAA SST Images with WebGL – http://www.moyhu.blogspot.com.au/p/blog-page.html
Naval Research Laboratory (NRL) – HYCOM Consortium for Data-Assimilative Ocean Modeling
NRL Home Page – http://www.nrlmry.navy.mil/
NRL Products Page – http://www.nrlmry.navy.mil/proddemo.htm
HYCOM Home Page – https://www7320.nrlssc.navy.mil/GLBhycomcice1-12/
Satellite Products Page- http://www.nrlmry.navy.mil/sat_products.html
Data Page – http://www.nrlmry.navy.mil/archdat/
Multi-view – http://www.nrlmry.navy.mil/sat-bin/global.cgi
Naval Coastal Ocean Model – https://www7320.nrlssc.navy.mil/GLBhycom1-12/
National Snow and Ice Data Center (NSIDC):
Home Page – http://nsidc.org/
Regional FTP Page – ftp://sidads.colorado.edu/DATASETS/NOAA/G02186/plots/
Northern Hemisphere Sea Ice Extent – ftp://sidads.colorado.edu/DATASETS/NOAA/G02135/north/daily/data/
Southern Hemisphere Sea Ice Extent – ftp://sidads.colorado.edu/DATASETS/NOAA/G02135/south/daily/data/
University of Bremen:
Home Page – http://www.iup.uni-bremen.de/eng/
Sea Ice Page – https://seaice.uni-bremen.de/sea-ice-concentration/
International Arctic Research Center/Japan Aerospace Exploration Agency (IARC-JAXA)
Home Page – http://www.ijis.iarc.uaf.edu/en/
FTP Page – http://www.ijis.iarc.uaf.edu/en/home/
National Aeronautics and Space Administration (NASA) Goddard Space Flight Center (GSFC) – Lance Modis
Home Page – http://rapidfire.sci.gsfc.nasa.gov/imagery/
Rapid Response Satellite Page – http://earthdata.nasa.gov/data/near-real-time-data/rapid-response
National Oceanic & Atmospheric Administration (NOAA) – National Centers for Environmental Information (nee National Climate Data Center)
Home Page – http://lwf.ncdc.noaa.gov/oa/ncdc.html
Public FTP Page – http://www1.ncdc.noaa.gov/pub/data/cmb/
National Oceanic & Atmospheric Administration (NOAA) – National Weather Service – Environmental Modeling Center
Home Page – http://polar.ncep.noaa.gov/
Sea Ice Analyses Page – http://polar.ncep.noaa.gov/seaice/Analyses.html
Public FTP Page – ftp://polar.ncep.noaa.gov/pub/
Sea Ice FTP Page – ftp://polar.ncep.noaa.gov/pub/ice/
Regional Arctic Sea Ice FTP Page – ftp://sidads.colorado.edu/DATASETS/NOAA/G02186/plots/
National Oceanic and Atmospheric Administration (NOAA) – National Ice Center:
Product Page http://www.natice.noaa.gov/Main_Products.htm
National Oceanic & Atmospheric Administration (NOAA) Arctic Program Website:
National Oceanic and Atmospheric Administration (NOAA) – Earth System Research Laboratory (ESRL)
Home Page – https://www.esrl.noaa.gov/
Physical Sciences Division (PSD) Products Page – https://www.esrl.noaa.gov/psd/products/
Physical Sciences Division (PSD) Climate and Weather Data Page – https://www.esrl.noaa.gov/psd/data/
Physical Sciences Division (PSD) Maps Room – https://www.esrl.noaa.gov/psd/map/
Nansen Environmental and Remote Sensing Center (NERSC) – Arctic Regional Ocean Observing System (ROOS):
Home Page – http://arctic-roos.org/
Norway Meteorological SAF Sea Ice:
Home Page – http://saf.met.no/p/ice/index.html
Washington University 2000-2015 North Pole Environmental Observatory:
http://psc.apl.washington.edu/northpole/
You must be logged in to post a comment.