 Welcome to the Hurricane and Tropical Cyclone page
NOTE: Most of the imagery on this page will automatically update. However, storm specific imagery may appear or disappear as needed.
For official bulletins see http://www.nhc.noaa.gov
 Got a blog or website? Add our hurricane widget to your sidebar, which will update every 30 minutes. Free alerting.
Code for this widget below: (copy/paste into notepad, then copy/paste that into your blog HTML editor to preserve the code character formatting)
<a href=”http://wattsupwiththat.com/reference-pages/tropical-cyclone/”><img src=”http://wcw.intelliweather.net/imagery/wcw/wcw_sat_atlhurr_175x225.gif” alt=”Hurricane Widget” width=”175″ height=”225″ /></a>

TRACKING MAP:


here is the same view with tracks and forecast positions:

Hurricane Warning Service
![]()
FREE! Hurricane and Tropical Storm updates by Email, Cell Phone, Android, Blackberries, iPhones, and Pagers
Now You can choose to send Tropical Storm Advisories, Hurricane Watches, and Warnings plus other types of weather bulletins to your regular email account or have reduced character bulletins sent to your handheld mobile device. All you need is your email address for the device. We even offer bulletin privacy times!
Just create a personal profile by following the signup wizard. Once there you’ll be able to choose what type of bulletins you want, plus how you want it to be delivered. There’s no obligation, quit at any time, and your email will never be sold or solicited for spam. Just another free service of WUWT.

SPONSORED ADVERTISEMENT:
TRACK HURRICANES

StormPredator now offers hurricane tracking built into the program. Satellite Images, Radar images, and tracking maps are automatically updated and immediately available to you – totally free with the registered version of the program and never, ever, a monthly data fee. In addition, full East Coast and Gulf Coast coverage of radars is available
Purchase StormPredator today via download here
Current Atlantic Conditions

Current Atlantic Conditions

Current Atlantic Outlook

Current Atlantic Outlook

2 Day Atlantic Outlook

5 Day Atlantic Outlook

Atlantic Potential Minimum Central Pressure and Maximum Wind
")
Atlantic Sea Surface Temperatures

Atlantic Sea Surface Temperature Anomalies

Pacific Imagery:
Current Pacific Conditions

Current Pacific Conditions

Current Pacific Outlook

2 Day Atlantic Outlook

5 Day Atlantic Outlook

Potential Minimum Central Pressure and Maximum Wind
")
Pacific Sea Surface Temperatures
Pacific Sea Surface Temperature Anomalies

Cyclone Climatology
Global Tropical Cyclone Frequency- 1971 to Present

Global Hurricane Frequency – 1978 to Present

Global Tropical Cyclone Accumulated Cyclone Energy (ACE) – 1971 to Present


Days Between Major Hurricane (Cat 3, 4, 5) Landfalls in the US 1900 – 2014

US Hurricane Landfalls 1900 – 2013

US Extremes in Landfalling Tropical Systems – 1910 to Present – Annual

US Hurricanes 1851 – 2010

Australian Region Tropical Cyclones 1970–2011 (Severe tropical cyclones are those which show a minimum central pressure less than 970 hPa)

Shortlink for this page, suitable for blog posts and Twitter feeds:
Sources:
Center for Ocean-Land-Atmosphere Studies (COLA) – Institute of Global Environment and Society (IGES)
Home Page – http://wxmaps.org/pix.html
Height and Vorticity Analyses Page – http://wxmaps.org/pix/analyses.html?bandwidth=high
Hurricane Potential Page – http://wxmaps.org/pix/hurpot.html?bandwidth=high
Forecast Page – http://wxmaps.org/pix/forecasts.html?bandwidth=high
National Oceanic and Atmospheric Administration (NOAA) – Earth System Research Laboratory (ESRL)
Home Page – http://www.esrl.noaa.gov/
Physical Sciences Division (PSD) Products Page – http://www.esrl.noaa.gov/psd/products/
Physical Sciences Division (PSD) Data Data Page – http://www.esrl.noaa.gov/psd/data/
Physical Sciences Division (PSD) Data Maps Page – http://www.esrl.noaa.gov/psd/map/
National Oceanic and Atmospheric Administration (NOAA) – National Climatic Data Center (NCDC)
Home Page – http://www.ncdc.noaa.gov/oa/about/about.html?bandwidth=high
Products Page – http://www.ncdc.noaa.govgov/oa/ncdc.html?bandwidth=high
Stratosphere Page – http://www.cpc.ncep.noaa.gov/products/stratosphere/?bandwidth=high
FTP Page – http://www1.ncdc.noaa.gov/pub/data/cmb/?bandwidth=high
National Oceanic & Atmospheric Administration (NOAA) – National Weather Service – Climate Prediction Center
Home Page – http://www.cpc.ncep.noaa.gov/
Products Page – http://www.cpc.ncep.noaa.gov/products/
Monitoring and Data Products Page – http://www.cpc.ncep.noaa.gov/products/MD_index.shtml
Atmospheric & SST Indices Page – http://www.cpc.ncep.noaa.gov/data/indices/
Regional Climate Maps – http://www.cpc.ncep.noaa.gov/products/analysis_monitoring/regional_monitoring/
Monitoring and Data Page – http://www.cpc.ncep.noaa.gov/products/monitoring_and_data/
FTP Page – ftp://ftp.cpc.ncep.noaa.gov/
National Oceanic & Atmospheric Administration (NOAA) National Weather Service (NWS) National Hurricane Center (NHC)
Home Page – http://www.nhc.noaa.gov/
Storm Page – http://www.nhc.noaa.gov/nhc_storms.shtml
Remote Sensing Systems (RSS)
Home Page – http://ssmi.com/?bandwidth=high
MSU Page – http://ssmi.com/msu/msu_browse.html?bandwidth=high
MSU FTP Page – ftp://ftp.ssmi.com/msu/?bandwidth=high
FTP Page – ftp://ftp.ssmi.com/?bandwidth=high
Ryan N. Maue PhD – PoliClimate.com
http://policlimate.com/weather/
http://www.nhc.noaa.gov/tafb/gridded_marine/ifp/images/nh2_waveheight_20110730_1200.png
http://www.nhc.noaa.gov/tafb/gridded_marine/ifp/images/nh2_wind_20110730_1800.png
http://www.ssmi.com/hurricane/active_storms_sst.atl.html
http://www.ssmi.com/hurricane/RT_images/
Here are some suggestions for additional content:
Hurricane Sector Images:
http://www.goes.noaa.gov/g8hu.html
Model Guidance:
http://euler.atmos.colostate.edu/~vigh/guidance/
Navy NRL Tropical Cyclone Page
http://www.nrlmry.navy.mil/TC.html
Navy NRL Global Ocean Modelling (good for SS temps, Heat content, and loop current eddies which are of particular concern to gulf coast residents)
http://www7320.nrlssc.navy.mil/global_nlom32/atlantic.html
Stormpulse
http://www.stormpulse.com/
CIMSS Tropical Cyclones (shear and dust maps)
http://tropic.ssec.wisc.edu/tropic.php
I also have numerous links to wave model sites, if you’re interested.
Read about jet streams being accelerated by mid-latitude oxygen/ozone conversion which extends Rossby wave meander loops. Study this new theory on your desktop at this dedicated website:
https://www.harrytodd.org
still real useful page especially given the renewed interest in fomenting fear on climate change… notably now that coronafear is waning.
I’m hoping WUWT will be devoting some main blog time to the hurricane reporting by the NHC since last year’s kitchen sink tally of last year’s season.
I spent a bit of time cross-referencing the last Danny Public Advisory (#4) with on the ground weather reporting (via Weather Underground) and couldn’t find NHC’s maximum sustained winds and rainfall accumulation using Mobile, Huntsville, Montgomery, Atlanta, Macon, Savannnah. All locations I checked reported nothing more than 8 mph (range 1 to 8), and 0,25 inches of rainfall
(trace to 0,25) compared to the advisory’s MSW of 25 mph and 1″-3″ of rainfall.
Granted this is a tail’s end of Danny, but you’d think their observations would match up somewhere with ground observations. I’ll await the next one and catch it earlier to see what’s what. The trouble is that WU charts (shown using the 10 day weather presentation) isn’t available for more than 4 hours in the past.
Did the Saharan Air Layer tamp down TD formation during July? If so how long will it continue?
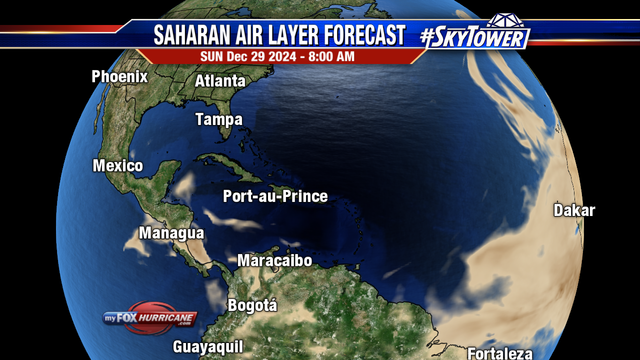
Whatever the cause(s), there will need to be 1 TD, 5 TS’s, plus 4 H’s in August to catch up to the 2020 season. I wonder if and how NHC will summarize July tomorrow.
This hurricane can cause catastrophic flooding.

Is there any possibility of getting dependable graphics for hurricane strength and frequency. This is a frequent claim that they are stronger and more frequent. Would love to be able to find a good graphic of TCE.