It’s not the climate, but the tide of opinion that’s changing in Europe and around the globe

Guest post by Dr. Hans Labohm
The upcoming climate change (and wealth redistribution) summit in Cancun – coupled with Bjorn Lomborg’s ongoing publicity campaign for his new film – makes one thing painfully obvious. The fight against the delusion of dangerous man-made global warming remains an uphill struggle.
For decades the climate debate has been obfuscated by cherry-picking, spin-doctoring and scare-mongering by the UN’s Intergovernmental Panel on Climate Change (IPCC) and other climate alarmists, including the environmental movement and mainstream media. Their massive effort to overstate the threat of man-made warming has left its imprint on public opinion.
But the tide seems to be turning. The Climate Conference fiasco in Copenhagen, Climategate scandal and stabilization of worldwide temperatures since 1995 have given rise to growing doubts about the putative threat of “dangerous global warming” or “global climate disruption.” Indeed, even Phil Jones, director of the University of East Anglia’s Climatic Research Unit and one of the main players in Climategate, now acknowledges that there has been no measurable warming since 1995, despite steadily rising atmospheric carbon dioxide.
People are paying attention, and opinion polls in many countries show a dramatic fall in the ranking of climate change among people’s major concerns. They are also beginning to understand that major rain and snow storms, hurricanes and other weather extremes are caused by solar-driven changes in global jet streams and warm-cold fronts, not by CO2, and that claims about recent years being the “warmest ever” are based on false or falsified temperature data.
In various parts of the world, the climate debate displays different features. The US and other parts of the non-European Anglo-Saxon world feature highly polarized and politicized debates along the left/right divide. In Europe, all major political parties are still toeing the “official” IPCC line. In both arenas, with a few notable exceptions, skeptical views – even from well-known scientists with impeccable credentials – tend to be ignored and/or actively suppressed by governments, academia and the media.
However, skepticism about manmade climate disasters is gradually gaining ground nevertheless.
In my own country, The Netherlands, for instance, it has even received some official recognition, thus dissolving the information monopoly of climate alarmists. The Standing Committee on Environment of the Lower House even organized a one-day hearing, where both climate chaos adherents and disaster skeptics could freely discuss their different views before key parliamentarians who decide climate policy.
This hearing was followed by a special seminar organized by the Royal Netherlands Academy of Sciences, using the same format but focusing on scientific topics. The Academy will soon publish a report about this seminar.
Europe often brags about its emission trading scheme (ETS), regarding itself as the vanguard of an international climate policy. In the European view, the Copenhagen climate summit should have produced a worldwide extension and sharpening of its ETS. But the vast majority of countries in the world refused to follow Europe’s example, so the meeting turned into a fiasco. Its follow-up in Cancun at year’s end will surely produce a similar result. And for good reason.
Contrary to official claims, Europe’s experience with ETS is dismally bad. The system is expensive and prone to massive fraud. More importantly, it serves no useful purpose.
The European Environmental Agency tracks Europe’s performance regarding the reduction of CO2 emissions. Its latest report states: “The European Union’s greenhouse gas inventory report … shows that emissions have not only continued their downward trend in 2008, but have also picked up pace. The EU-27’s emissions stood 11.3% below their 1990 levels, while EU-15 achieved a reduction of 6.9% compared to Kyoto base-year levels.”
On the face of it, the scheme seems to be pretty successful. However, much of the downward trend was due to the global economic recession, not to the ETS. Moreover, both climate chaos proponents and climate disaster skeptics agree that the scheme will have no detectable impact whatsoever on worldwide temperatures – perhaps 0.1 degrees – though this crucial piece of information has been carefully and deliberately shielded from the public eye.
What about renewable energy as an alternative? Consider these EU costs for various sources of electricity in cents per kilowatt-hour: nuclear 4, coal 4, natural gas 5, onshore wind 13, biomass 16 … solar 56!
Obviously, the price tag for renewables is extremely high, compared to hydrocarbons. The additional costs can be justified either by imminent fossil fuel scarcity (the “oil peak”), which would send petroleum and coal prices through the roof, or by the threat of man-made global warming. But on closer inspection neither argument is tenable.
The authoritative International Energy Agency does not foresee any substantial scarcity of oil and gas in the near to medium future, and coal reserves remain sufficient for centuries to come. As to global warming, the absence of a statistically significant increase in average worldwide temperatures since 1995 obliterates that assertion.
Meanwhile, recent peer-reviewed studies indicate that increasing CO2 levels in the atmosphere (natural or man-made) have minimal effects on climate change – while others demonstrate that, on balance, this plant-fertilizing gas is beneficial, rather than harmful, for mankind and the biosphere.
All this argues for a closer look at the cost/benefit relationship of investing in renewable energy projects, to prevent a massive waste of financial and natural resources on unreliable and thus uncompetitive forms of energy. Since every cloud has a silver lining, the ongoing economic crisis might give extra impetus toward that end.
______________
Hans Labohm is a former professor at the Dutch Institute of International Relations and guest teacher at the Netherlands Institute for Defense Studies. He has been an IPCC reviewer and has written extensively on global warming, petroleum economics and other topics.
Climate change no longer scary in Europe
It’s not the climate, but the tide of opinion that’s changing in Europe and around the globe
Dr. Hans Labohm
The upcoming climate change (and wealth redistribution) summit in Cancun – coupled with Bjorn Lomborg’s ongoing publicity campaign for his new film – makes one thing painfully obvious. The fight against the delusion of dangerous man-made global warming remains an uphill struggle.
For decades the climate debate has been obfuscated by cherry-picking, spin-doctoring and scare-mongering by the UN’s Intergovernmental Panel on Climate Change (IPCC) and other climate alarmists, including the environmental movement and mainstream media. Their massive effort to overstate the threat of man-made warming has left its imprint on public opinion.
But the tide seems to be turning. The Climate Conference fiasco in Copenhagen, Climategate scandal and stabilization of worldwide temperatures since 1995 have given rise to growing doubts about the putative threat of “dangerous global warming” or “global climate disruption.” Indeed, even Phil Jones, director of the University of East Anglia’s Climatic Research Unit and one of the main players in Climategate, now acknowledges that there has been no measurable warming since 1995, despite steadily rising atmospheric carbon dioxide.
People are paying attention, and opinion polls in many countries show a dramatic fall in the ranking of climate change among people’s major concerns. They are also beginning to understand that major rain and snow storms, hurricanes and other weather extremes are caused by solar-driven changes in global jet streams and warm-cold fronts, not by CO2, and that claims about recent years being the “warmest ever” are based on false or falsified temperature data.
In various parts of the world, the climate debate displays different features. The US and other parts of the non-European Anglo-Saxon world feature highly polarized and politicized debates along the left/right divide. In Europe, all major political parties are still toeing the “official” IPCC line. In both arenas, with a few notable exceptions, skeptical views – even from well-known scientists with impeccable credentials – tend to be ignored and/or actively suppressed by governments, academia and the media.
However, skepticism about manmade climate disasters is gradually gaining ground nevertheless.
In my own country, The Netherlands, for instance, it has even received some official recognition, thus dissolving the information monopoly of climate alarmists. The Standing Committee on Environment of the Lower House even organized a one-day hearing, where both climate chaos adherents and disaster skeptics could freely discuss their different views before key parliamentarians who decide climate policy.
This hearing was followed by a special seminar organized by the Royal Netherlands Academy of Sciences, using the same format but focusing on scientific topics. The Academy will soon publish a report about this seminar.
Europe often brags about its emission trading scheme (ETS), regarding itself as the vanguard of an international climate policy. In the European view, the Copenhagen climate summit should have produced a worldwide extension and sharpening of its ETS. But the vast majority of countries in the world refused to follow Europe’s example, so the meeting turned into a fiasco. Its follow-up in Cancun at year’s end will surely produce a similar result. And for good reason.
Contrary to official claims, Europe’s experience with ETS is dismally bad. The system is expensive and prone to massive fraud. More importantly, it serves no useful purpose.
The European Environmental Agency tracks Europe’s performance regarding the reduction of CO2 emissions. Its latest report states: “The European Union’s greenhouse gas inventory report … shows that emissions have not only continued their downward trend in 2008, but have also picked up pace. The EU-27’s emissions stood 11.3% below their 1990 levels, while EU-15 achieved a reduction of 6.9% compared to Kyoto base-year levels.”
On the face of it, the scheme seems to be pretty successful. However, much of the downward trend was due to the global economic recession, not to the ETS. Moreover, both climate chaos proponents and climate disaster skeptics agree that the scheme will have no detectable impact whatsoever on worldwide temperatures – perhaps 0.1 degrees – though this crucial piece of information has been carefully and deliberately shielded from the public eye.
What about renewable energy as an alternative? Consider these EU costs for various sources of electricity in cents per kilowatt-hour: nuclear 4, coal 4, natural gas 5, onshore wind 13, biomass 16 … solar 56!
Obviously, the price tag for renewables is extremely high, compared to hydrocarbons. The additional costs can be justified either by imminent fossil fuel scarcity (the “oil peak”), which would send petroleum and coal prices through the roof, or by the threat of man-made global warming. But on closer inspection neither argument is tenable.
The authoritative International Energy Agency does not foresee any substantial scarcity of oil and gas in the near to medium future, and coal reserves remain sufficient for centuries to come. As to global warming, the absence of a statistically significant increase in average worldwide temperatures since 1995 obliterates that assertion.
Meanwhile, recent peer-reviewed studies indicate that increasing CO2 levels in the atmosphere (natural or man-made) have minimal effects on climate change – while others demonstrate that, on balance, this plant-fertilizing gas is beneficial, rather than harmful, for mankind and the biosphere.
All this argues for a closer look at the cost/benefit relationship of investing in renewable energy projects, to prevent a massive waste of financial and natural resources on unreliable and thus uncompetitive forms of energy. Since every cloud has a silver lining, the ongoing economic crisis might give extra impetus toward that end.
______________
Hans Labohm is a former professor at the Dutch Institute of International Relations and guest teacher at the Netherlands Institute for Defense Studies. He has been an IPCC reviewer and has written extensively on global warming, petroleum economics and other topics.
Common sense will always prevail , when people ae presented with the truth, the whole truth and nothing but the whole truth. Now that the truth is coming out , people are actually using their own common sense to make real honest judgements.
It will take a few more years for this fiasco to dissipate. Less and less will be in the news, and it will quietly go away.
Ian
They’ll sic the dogs on this guy.
…..and the provision global temperature trend for this decade (2001-2010) is:
GISS/NASA + 0.15°C
NCDC NOAA + 0.01°C
RSS MSU + 0.03°C
HadCRUT – 0.06°C
Well, that’s nice. Now if we can just “unlearn” the young people of the propaganda that was force fed them in our schools, we could probably put this disaster to bed.
The best thing about the globull warming fiasco is that people are now ready to look behind the curtain on a variety of subjects. We now know that not only politicians and lobbyist have lied to us but the Media, who is SUPPOSED to act as a whistleblower on mega-fraud by the politicians was instead their propaganda machines.
This awakening with the rise of the internet will have a profound effect on future political cons – at least I hope so.
This is what climate scientists were saying in 1995:
“The warming is set to accelerate into and through the next century, with temperature rises faster than any of the past 10,000 years. ”
http://www.independent.co.uk/news/global-warming-is-here-experts-agree-1584272.html
…and what was it Phil Jones said recently:
“for the past 15 years there has been no ‘statistically significant’ warming. ”
If they got it completely wrong in 1995, why should we believe their new tales now. I remember being taught that a sign of a bad theory is that there are contradictions, that there are lots exceptions that have to be dealt with, and so on. The AGW theory fits perfectly; the hidden heat, the lack of a hot spot in the tropics, the cooling of Antarctica, nothing seems to work in their theory, other than a 15 year period between 1985 and 2000.
It looks like the opposing theory of 60 year cycles fits, especially as we go into a deep La Nina.
That is a well written exposé of the pseudo-scientific story of climate change advocacy.
It is one more voice to add to the chorus of independent thinkers.
John
Interesting article; but the point of view encapsulated in the first sentence in the last paragraph contains the potential for much mischief, assuming you mean for governments to take the “closer look”.
“All this argues for a closer look at the cost/benefit relationship of investing in renewable energy projects, to prevent a massive waste of financial and natural resources on unreliable and thus uncompetitive forms of energy.”
Innumerable private companies are continuously evaluating the potential for profit in new technologies. The fact that they are individually coming to the decision not to invest in taking a new technology to production scale (without subsidies) is almost surely a better indicator of cost/benefit than any study likely to be designed by governments that are influenced by forces interested in something other than straightforward analysis.
Enormous approval rating for Greens in Germany. A part of the German electorate seems to flee into fantasy land the harder reality bites. But they all know nothing about ClimateGate. It has not been reported here. They still believe the science is sound and may be stubborn enough to ignore reality for the coming years. This segment of society is very hard to predict, as they are irrational, and do not seek information actively (they live under the illusion of being informed already; they trust the Green party and Greenpeace and will echo anything fed to them by these sources).
An interesting situation.
Hans, complimenten voor een top artikel! Veel duidelijker kan het niet.
Thank-you for thoughtful and informative piece.
I am no scientist, but I am fervently pro-nuclear. I am a senior citizen and have seen every ‘consensus’ in science one would care to mention. Almost without exception these ‘consensi’ have been systematically overturned by the onward march of good research. It is the desire of good scientists to abhor a given by consistantly seeking a falsification. This is the only way we humans are going to survive.
I strongly believe that if the trillions of units of research money being demanded of the world were put into firstly building nuclear plants throughout the developed world, building ‘clean’ coal and gas plants in the developing world and then, with the time so bought, developing a clean, renewable power production process for all, the problem would be solved.
“They are also beginning to understand that major rain and snow storms, hurricanes and other weather extremes are caused by solar-driven changes in global jet streams and warm-cold fronts”
There is no evidence of that either.
“The authoritative International Energy Agency does not foresee any substantial scarcity of oil and gas in the near to medium future”
IEA world energy outlook report 2010: Page 4 “The age of cheap oil is over, though policy action could bring lower international prices than would otherwise be the case” (i.e. demand destruction)
on page 11 there is a graph showing crude oil peaked in 2008. Unless you can quantify the large potion of graph designated “crude oil fields yet to be found” and “crude oil fields yet to be developed” your statement about the IEA is falsified by the data presented in their own report.
http://www.iea.org/speech/2010/Tanaka/Jakarta_weo2010.pdf
The problem remains of how to convince the politicians, and common sense and politicians don’t mix very well.
Climate change was never scary: the proposed solutions are.
“On the face of it, the scheme seems to be pretty successful. However, much of the downward trend was due to the global economic recession, not to the ETS.”
No wonder the current Global Recession has been hanging on so long and we’re NOT getting back to work. It’s the Europeans. It’s ALL their fault! That tares it! That’s the FINAL straw!! Next time the Germans get drunk and want to kick butt, we AIN’T going “over there”!!!!!!!
Renewable energy projects: Does these projects work in winter?
Dr. Labohm, is this the first time you say it out loud? That you are a Denier?
Does this mean more and more professors dare speak out? Or have they all been speaking out all the time, but ignored by media?
Or maybe those few who spoke was ignored by the media. And perhaps the rest was busy doing their day-job, while the warmists silently buildt their case behind the scenes.
And luckily, LUCKILY, Climategate saved us all, just in the nick of time before Copenhagen. Thank you, Mr/Mrs ClimateGate.
Bob from the UK says:
November 22, 2010 at 9:58 am
If they got it completely wrong in 1995, why should we believe their new tales now. I remember being taught that a sign of a bad theory is that there are contradictions, that there are lots exceptions that have to be dealt with, and so on. The AGW theory fits perfectly; the hidden heat, the lack of a hot spot in the tropics, the cooling of Antarctica, nothing seems to work in their theory, other than a 15 year period between 1985 and 2000.
=======
Quite right, Bob. In fact, for the very reasons you cite above, I have long argued that AGW does not even rise to the level of theory. Given all the evidence stacked against it (or, at the least, legitimately questioning it), AGW really ought not to be considered anything more than an hypothesis.
Also, AGW appears not to be falsifiable. AGW proponents use any weather
anomolyevent to prop up their hypothesis (to wit, Al Gore’s pronouncements in recent days regarding this past summer’s Russian heat wave which was, demonstrably, a local weather event only). Any hypothesis that cannot be falsified can never rise to the status of theory.Giving it the status of theory gives it more credence than it deserves. It is an hypothesis only, and a weak one at that.
[off topic taunting, may be allowed on a sea ice thread. Try again on Sunday ~ ctm]
Hey, Michael Mann looks good after taking off a few pounds.
“Renewable energy projects: Does these projects work in winter?”
Of course, not – wind doesn’t blow in winter.
Hans says:
“But the tide seems to be turning. The Climate Conference fiasco in Copenhagen, Climategate scandal and stabilization of worldwide temperatures since 1995 have given rise to growing doubts about the putative threat of “dangerous global warming” or “global climate disruption.” Indeed, even Phil Jones, director of the University of East Anglia’s Climatic Research Unit and one of the main players in Climategate, now acknowledges that there has been no measurable warming since 1995, despite steadily rising atmospheric carbon dioxide.”
This is clearly a distortion of the science. There is no evidence of stabilization of temperatures if one looks at the noisy variation of global temperatures. That is what Phil Jone’s pointed out. In fact, the best fit straight line for global temperature of the past 15 years shows a slope of +0.11- 15 degC/decade depending on which version of the surface temperature record is used. The statistical uncertainty is just large enough to include zero.
In the same interview, Jones said:
BBC: How confident are you that warming has taken place and that humans are mainly responsible?
Phil Jones: I’m 100% confident that the climate has warmed. As to the second question, I would go along with IPCC Chapter 9 – there’s evidence that most of the warming since the 1950s is due to human activity.
I knew it all along, our Gav you still surprise me:-
“I woke up on Tuesday, 17 Nov 2009 completely unaware of what was about to unfold. I tried to log in to UnRealClimate, but for some reason my login did not work. Neither did the admin login. This had happened before it was Kryptonite in my bed, my fingers were so weak I could not type. I summoned all my remaining strength and I logged in to the back-end via ssh (it is legal in some states), only to be inexplicably logged out again. I did it again. No dice. I then called the hosting company and told them to send someone around to remove the Kryptonite from my bed and to take us offline until they did so. I only ever remember how super I am when I look in the mirror.” To be continued with mogadon man.
“The problem remains of how to convince the politicians, and common sense and politicians don’t mix very well.”
Well, in the US, we have elections. I don’t know what Europe will do since it seems to be plowing ahead into a dictatorship headed in Brussels.
This bit jumped out at me:
“In my own country, The Netherlands, for instance, it has even received some official recognition, thus dissolving the information monopoly of climate alarmists.”
That is a great way of putting it. Committees on energy, departments concerned with the environment or whatever else become vehicles for alarmist climate advocacy once they have been captured (or have willingly submitted to) a very narrow expert view.
The same applies to much of the way Government works these days too. The most painful example being banking regulations. The people tasked with protecting and representing the public have shifted their duties from that. They represent big business, they represent advocacy groups, they represent foreign and/or international (and often wholly unaccountable) groups.
There are two things to add to that though. The first is that in many cases State departments becoming vehicles for a particular strain of advocacy is often a means to an end – that of growing the authority of the State – rather than the end itself. The second is that our institutions and processes do not need mending – we just need to pick better politicians who will execute their duties properly.
The humano-fish is a scream! Maybe the WWF recognizes defeat and has chosen to pursue humor instead.
Dr. Hans Labohm claims, “Phil Jones, director of the University of East Anglia’s Climatic Research Unit and one of the main players in Climategate, now acknowledges that there has been no measurable warming since 1995.”
Nonsense. Phil Jones has stated nothing of the kind and nor is it true.
If Dr Labohm either doesn’t understand what Phil Jones stated about warming since 1995 (with reference to the HADCRU figures) or is deliberately trying to mislead his readers.
Here are the 5 year average global temperature anomalies centred on 1995 and 2007, (the last five year period for which data is available) from the two satellite (UAH and RSS) and two surface (HADCRUT and NASA GISS) temperature series:
Five year period…UAH……………RSS………..HADCRUT…..NASA GISS
1993-1997………….+0.004C…+0.044C……..0.208C………..0.282C
2005-2009………..+0.238C…+0.263C………0.414C…………0.546C
The average increase over that twelve year period from the four series is about 0.23C, in other words an increase of about 0.2C per decade, which is entirely in line with IPCC projections.
pete says:
November 22, 2010 at 10:13 am
…scarcity of oil and gas…
You forgot to mention the situation with gas.
From your link:
Natural gas markets are in the midst of a revolution – will it
herald a golden era for gas?
Leif Svalgaard says:
November 22, 2010 at 10:12 am
True but in your opinion is the theory that any observed warming is caused mostly by increasing CO2 a better one?
Gosh. That picture looks a fair bit like the Australian PM!
James Allison says:
November 22, 2010 at 11:17 am
True but in your opinion is the theory that any observed warming is caused mostly by increasing CO2 a better one?
No, but if you know it is true that there is no evidence, should you then pretend there is in order to combat the CO2 theory? I think not. We should not fight one lie with another one.
Pete:
You assert:
““The authoritative International Energy Agency does not foresee any substantial scarcity of oil and gas in the near to medium future”
IEA world energy outlook report 2010: Page 4 “The age of cheap oil is over, though policy action could bring lower international prices than would otherwise be the case” (i.e. demand destruction)
on page 11 there is a graph showing crude oil peaked in 2008. Unless you can quantify the large potion of graph designated “crude oil fields yet to be found” and “crude oil fields yet to be developed” your statement about the IEA is falsified by the data presented in their own report.”
Sorry, Hans is right and you are wrong. Either you misunderstand the IEA report or you are misrepresenting it.
The graph clearly shows the oil price peaked at ~$100pbbl in 2008 and has fallen back to 1980s levels since. This is not consistent with oil becoming scarce.
I suggest that people read the report and decide if it supports Hans (it does) for themselves. As you said, it can be read at:
http://www.iea.org/speech/2010/Tanaka/Jakarta_weo2010.pdf
Richard
Is that picture above, a Patchy’s picture ?
I like this Dutchman. Of course I am not surprised about what they say since I am a Dutchman myself from origin…I was hoping they would come to their senses…
Quote:
“Meanwhile, recent peer-reviewed studies indicate that increasing CO2 levels in the atmosphere (natural or man-made) have minimal effects on climate change – while others demonstrate that, on balance, this plant-fertilizing gas is beneficial, rather than harmful, for mankind and the biosphere”.
I remember that I have been saying this, but others, peer reviewed, in Holland?
Can somebody please peer-review my doc. as well? Your comment will be much appreciated. Thanks!
http://letterdash.com/HenryP/more-carbon-dioxide-is-ok-ok
Leif Svalgaard says:
November 22, 2010 at 10:12 am
And here I thought advancing cold fronts and warm fronts caused the formation of certain types of clouds (and their signature storms); that evaporation from the earth’s vast layer of oceans and lakes provided the water vapor needed for precipitation; that solar warming of the oceans in equatorial areas drove the formation of hurricanes and typhoons; and that tornadoes are spawned from unusually violent thunderstorms, which are themselves the product of solar-driven temperature differentials.
Now, if all these are false assumptions in the formation of major rain and snow storms, hurricanes and other weather extremes, please enlighten us as to what causes them.
Here’s part of the media “ramp up” to Cancun:
http://www.msnbc.msn.com/id/40316649/ns/us_news-environment
Bubbled methane pockets have been seen in permafrost
for hundreds of years. Now is the time to announce
how worriesome they are.
This statement from the post:
” They are also beginning to understand that major rain and snow storms, hurricanes and other weather extremes are caused by solar-driven changes in global jet streams and warm-cold fronts, not by CO2…”
Indicates a complete lack of understanding of the essential elements of any system that exists on the edge of chaos, and even more so, what is, and is not verifiable by the scientific method. It also contains a logical fallacy in that any given effect can (and in nature, usually does) have multiple and interrelated causes and hence, no cause can be proven to be mutually exclusive of any others. To suggest that no weather extremes, increases in the frequency and intensity of hydrological events, etc. can be traced to increases in CO2, flies in the face of all significant research on the longer-term relationship in the geological cycle between increases in CO2 and the acceleration of the hydrological cycle.
[I killed the comment this is referring to and thus the downstream ones suffer as well ~ ctm]
Well this would be a good place to note that if you click on the sea ice page (great page) you will see that the high arctic Temperature has just about hit rock bottom and it sin’t even all the way through Fall yet; my eye says it is about 247 Kelvin.
That is 8 deg C lower than the supposed Black Body Temperature at earth’s orbit (mean) which earth would presumably assume if it wasn’t for GHGs in the atmosphere.
We are aslso told that from such a frozen ice ball temperature, earth cannot recover without getting a kick start from the CO2 kindling wood; becasue there wouldn’t be any water vapor to do any warming.
So we could do an experiment now that the arctic is way below the BB equilibrium Temperature; and presumably in the Antarctic highlands around Vostok; even though it is springtime; maybe it too is below 255 K.
So how about some satellite cloud cover pictures for both Arctic ocean and Antarctica; so we can see that the atmosphere truly is devoid of any H2O.
The historic photos I have seen of at least Antarctica; including Scott Expedition movies; show that Antarctica has plenty of cloud cover; even though it is the dryest continent on earth.
Not only have the non-condensing GHGs like CO2 and Ozone, not been able lift the Temperatures there above 255 K; but there’s plenty of H2O to do the job when the sun turns back on.
If you take Trenberth’s Solar constant as 342 W/m^2 then you get nonsense; but if you use the real value of 1366 W/m^2 which gives a target daylight Temperature of about 394K, it is easy to see how water can do the whole job on its own without the need for any other GHG.
GMOs are not popular in Europe
Eadler and Slioch:
You really are showing signs of desperation.
You each try to dispute the statement by Hans Labohm that says,
“Phil Jones, director of the University of East Anglia’s Climatic Research Unit and one of the main players in Climategate, now acknowledges that there has been no measurable warming since 1995.”
Hans is undeniably right if one accepts “measurable warming” means ‘warming that is discernible as existing with 95% confidence’.
And, Slioch, “since 1995” is not a 5-year period. You can cherry pick parts of “since 1995” however you want, but it changes nothing. The fact is that Phil Jones admits there has been no measurable warming since 1995: live with it.
Richard
PS.
How easy would it be to include a daily (or weekl/monthly) Arctic, and Antarctic cloud cover photograph along with the graphs on the sea ice page ? That would be most informative. I don’t know if any of the satellites have the capability of taking photographs that might get filed somewhere.
Slioch:
No fair using actual facts. You’ll harsh the vibe.
A fascinating read
http://www.scribd.com/doc/23689403/The-Rise-of-the-Eco-Nazi
Nature herself will decide who wins in the argument between the alarmists, the deniers and the various shades in between. The prophets of doom have often been reluctant to fix specific timescales to their predictions, even Hal Lindsey doesn’t do that. Nevertheless, it is inevitable that, if they are wrong, the climate’s continuing refusal to conform to those prophesies will gradually erode their credibility.
Although subsidies for alternative energy sources may be seen by many as misguided now, I think that this is something that we may benefit from in the future. I tend to lean toward the belief that the free market is better at sorting these things out in that the scarcity and consequent rising prices of fossil fuels is inevitable and therefore research into alternatives will become potentially profitable. However, it is possible that vital lessons are being learned now, about what is practical and what is not, which may well be used in the future.
Bob from the UK says: November 22, 2010 at 9:58 am
“for the past 15 years there has been no ‘statistically significant’ warming. ”
If they got it completely wrong in 1995, why should we believe their new tales now.
Hi Bob. Grab a six sided die and roll it ten times. Subtract 3 off each result. This gives a trend of 0.5 per roll, so after ten rolls your average result will be 5. Will this theory be “completely wrong” if the actual outcome is a 2?
[Roll the dice 50 times. If the average comes out 4.5, the dice are loaded. If the average comes out 2.5 for all rolls before 1970, and 4.5 for all rolls after 1970, somebody changed the dice. Or how they count the spots. Robt]
RockyRoad says:
November 22, 2010 at 11:29 am
And here I thought […] are themselves the product of solar-driven temperature differentials.
This is not what the author meant. He was clearly alluding to changes in solar output over time as the cause, rather than the [regular] change with latitude.
Hans says:
“People are paying attention, and opinion polls in many countries show a dramatic fall in the ranking of climate change among people’s major concerns. They are also beginning to understand that major rain and snow storms, hurricanes and other weather extremes are caused by solar-driven changes in global jet streams and warm-cold fronts, not by CO2, and that claims about recent years being the “warmest ever” are based on false or falsified temperature data.”
Where is the evidence for “solar-driven changes” in the jet stream? In fact we are currently at a minimum point in solar activity and have been there for a few years now.
There is no evidence that temperature data has been falsified. The last 12 months have been the warmest in the insturmental temperature record.
Climate change was not ever an important concern for the average person. Right now the average person is worried about the economy both in the EU and the USA.
I am very heartened by recent feedback from within my circle of family, friends and colleagues.
Apparently the teaching profession in the UK is beginning to revolt against teaching global warming, which they see as mere propaganda.
The BBC is also being seen as a propaganda tool right across the board. Their active support for AGW is seen in this light and therefore the standing of AGW is suffering badly.
All good signs, if not an open revolt yet.
“Indeed, even Phil Jones, director of the University of East Anglia’s Climatic Research Unit and one of the main players in Climategate, now acknowledges that there has been no measurable warming since 1995, despite steadily rising atmospheric carbon dioxide.”
Not true. Phil Jones said “… the trend for the period 1995 to 2009 … (0.12C per decade) is positive, but not significant at the 95% significance level. The positive trend is quite close to the significance level. Achieving statistical significance in scientific terms is much more likely for longer periods, and much less likely for shorter periods.”
Note some important differences. Jones said the globe is warming, and how much. You claim he said that there is no measurable warming.
I’m not impressed by points of view that require support by misrepresentations of scientists.
Gail Combs says:
November 22, 2010 at 9:54 am
The best thing about the globull warming fiasco is that people are now ready to look behind the curtain on a variety of subjects.
—————————————————-
Hopefully. Some people just can’t bring themselves to do that though. It’s OK to do it with the climate curtain, but those other ones, ooh, they’re taboo and it’s only raving conspiracy nuts who believe there’s anything behind them anyway.
I call it willful ignorance. I get annoyed at fellow climate realists calling someone a ‘conspiracy theorist’ if they deploy exactly the same sceptical method (of information gathering and dispassionate analysis as exemplified by WUWT) in other areas of inquiry. But these areas seem to be off-limits to their otherwise keenly sceptical minds. They just can’t go there. I think it’s a psychological thing. Instead, they swallow the most blatant lies from the MSM and fixate on that as ‘the truth’ and call anybody who thinks otherwise a wingnut. Sigh.
“Let us not tolerate outrageous conspiracy theories” – G.W. Bush.
Just to be clear – I’ve never been called a conspiracy nut on this site, but I’ve seen it happen to other people. For them, I imagine it feels just like how a climate realist feels when someone calls him or her a denier. I’m just saying I think fellow sceptics should have respect for each other, at least.
“… major rain and snow storms, hurricanes and other weather extremes are caused by solar-driven changes in global jet streams and warm-cold fronts, not by CO2 …”
That would be very difficult to isolate for a particular storm. Is this based on some scientific work?
I note that solar irradiance variation is responsible for about 10% of the change in radiative forcing that anthropogenic CO2 is responsible for. I’d be interested in reading any paper that finds it wholly attributable to changes in solar irradiance; however, it does stretch credibility.
“… and that claims about recent years being the “warmest ever” are based on false or falsified temperature data.”
The NOAA, the NASA, the hadCRU, the RSS and the UAH data all show 2001 to 2010 as the warmest decade on record.
The UAH data should be particularly interesting to people claiming temperature data are falsified. It is produced by outspoken sceptics, in order to be independent and unbiased.
I think that it is pretty clear that recent years, are in fact, the warmest on record, and that this is not due to falsification of temperature data.
@Sliont – Nice cherry picking, what flavour kool aid do you like.
Is your comment peer reviewed 😉
Just for your information , Shell Oil and the Russian gasproducers have laid important investment projects in Canada and Siberia on ice this year ! Would they do this facing worldwide shortages ? The reports stipulated in this blog describe only the past and do not represent any value for future developments , it is nice for civil servants to claim how knowledgeable they are , but they are only able to repeat anything which was fed into them . Understanding reality is different ballgame and will any oilman contradict a story , which is very selfserving and is very helpful to maximize the daily pricing ? The lack of action here is speaking louder than any burocratic report . Is it shale everybody is afraid of and how much shale was included in these reports and statistics ? Shell and shale are very near to each other .
@garhighway. I did a fast forward greenman3610’s video to 4:30, there he compare percentage change in sea ice. But he’s somewhat misleading.
a) First it’s a lot more quantity of ice on the South pole (SH).
b) Then he chose to compare NH sea ice for the month with the smallest amount of ice, why the changes in percent are the largest.
c) Then he chose to compare SH sea ice for the month with its largest amount of ice, why the changes in percent looks smallest.
b+c) If he had done vice versa, showing percentage in March, For sure the change expressed in percent wouldn’t have been noticeable.
(Note also: Between 6000 and 7000 years ago there were no ice on the Arctic Sea, and witness from the 14th century wrote in books that Arctic was almost ice free.
http://www.ngu.no/en-gb/Aktuelt/2008/Less-ice-in-the-Arctic-Ocean-6000-7000-years-ago )
Also the amount of sea ice on Earth always has changed, and now it isn’t change very dramatically in either direction — as well as temperature hasn’t changed more than natural fluctuation the last thousands of years.
So why do you think greenman3610 mislead his viewers? Maybe you didn’t know the man behind greenman3610 is an old leftist activist, and should aim for politics.
A bit trivial…
I don’t know why anyone would try to prove rising temperatures with GISS. It is well known that Hansen & Co. have thoroughly tweaked the data to show increases and have ignored UHI.
As far as “There is no evidence of stabilization of temperatures if one looks at the noisy variation of global temperatures.” it’s pretty clear that there’s also no evidence of continued warming if one looks at the noisy variation of global temperatures, either. The key word is “significant.” A fitted line through the data is worthless if the significance is not very high. The word ‘stabilization’ is also bogus. The system is both dynamic and chaotic. There is no “stable” position, except possibly the one Hansen and Mann should fill, sweeping the place out. In any case, the recent trend deviates from GCM predictions, so we can pretty much throw those out the window, too.
Btw, when I answer trivial things like garhighway comment with greenman3610’s misleading propaganda I feel as if I looked like the man on the Greenpeace poster, so Greenpeace unintentionally right?
“… skeptical views – even from well-known scientists with impeccable credentials – tend to be ignored and/or actively suppressed by governments, academia and the media.”
This appears to be analysis from some other planet.
Scientific papers are about 95% or more in support of the scientific position that it is human activity that is responsible for most of the recent warming. The media biases this hugely to the sceptical side, producing much nearer 50-50. (See perhaps Boykoff
and Boykoff (2004).
Democratic governments, who do not wish to spend money to ameliorate a problem that will occur outside their term demonstrably work to deny the scientific position. The Bush administration in particular edited scientific reports by bureaucrats to hide the certainty and severity of the problem.
What democratic government wants to throw away money on saving lives 30 years hence when economies are under their current stress?
Academia, pays careful attention to potential paradigm shifting ideas. That is because the whole endeavour of science is like that.
However, the consensus position is certainly difficult to argue against:
With the release of the revised statement by the American Association of Petroleum Geologists in 2007, no scientific body of national or international standing rejects the findings of human-induced effects on global warming.
The 928 papers were divided into six categories: … Remarkably, none of the papers disagreed with the consensus position.
Robt: [Roll the dice 50 times. If the average comes out 4.5, the dice are loaded. If the average comes out 2.5 for all rolls before 1970, and 4.5 for all rolls after 1970, somebody changed the dice. Or how they count the spots. Robt]
Hence the meaninglessness of quoting results across small periods of time as somehow invalidating the theory of AGW (particularly with 2010 at near record highs) and the need to apply sufficient nuance to understand the various factors present in a complex system.
A number of excellent comments but no one has addressed the critical issue of the WWF ad: will that guy hit on a Rapala if one is tossed nearby or do you think he prefers dry flies?
What’s in his lunch bucket? Inquiring minds want to know.
“Climate change no longer scary in Europe.”
I don’t remember climate change ever being scary to ordinary folk. Certainly not in the UK. Some guilt among over educated middle class liberals, but scary? – Never.
That’s why the attempt to whip up alarm was never lgoing to suceed. People are rightly worried about real issues that affect the wellbeing of themselves and family. Issues like sovereign debt, European financial crises, job losses.
To rant about temperature rises of a few degrees in a hundred years in an attempt to scare the population is as rational as forecasting that there is likely to be an invasion of ufo’s because human radio signals have now passed a critical volume of stars where there is a 95% probability of one hosting an advanced technological civilization. The ufo prediction is based on the Drake equation, while the apocalyptic warming is based on implausible computer models. Other than that, same junk science, same ennui.
JohnOfEnfield says:
November 22, 2010 at 12:04 pm
“The BBC is also being seen as a propaganda tool right across the board. Their active support for AGW is seen in this light and therefore the standing of AGW is suffering badly.”
Finally. Delingpole, who makes Anthony seem like Mr. Polite, is more blunt:
http://blogs.telegraph.co.uk/news/jamesdelingpole/100063937/why-the-bbc-cannot-be-trusted-on-climate-change-the-full-story/
The BBC’s daily AGW coverage until Climategate broke was so relentless as to be hilarious. They promoted every Big Lie told about it, constantly. And their enviro-blogger/UN parrot Richard Black is still going on about it like the Black Knight in the Monty Python movie; that is, in total denial about what is happening.
The BBC has been like Monty Python’s Ministry of Truth for a long time, and it is starting to catch up with them. It is still worth watching for its entertainment value.
Richard S Courtney says:
November 22, 2010 at 11:41 am
You also write nonsense about what Phil Jones said.
There was no possibility of identifying warming at a 95% confidence level when Phil Jones was interviewed since the time period was too short. That was what Phil Jones explained, but I quite accept that you don’t understand it.
I must say I find it hilarious that much of the time we hear that “no-one denies that the Earth is warming” from what on this website are referred to as “AGW sceptics”, but then we get articles such as the above which try to tell us that there has been “no measurable warming since 1995”.
As for your pretence that “no measurable warming since 1995” should be equated with “no significant warming since 1995”: well, if you wish that stain of illogic to be lodged against your name then so be it. It does not surprise me at all.
Colin from BC;
An hypothesis that cannot be falsified is not even an hypothesis. As G&T point out, it’s a conjecture.
“Never forget that climatology is not even a field, much less a science:
“Rather, the atmospheric greenhouse mechanism is a conjecture [= preliminary guess without evidence, which may lead to a hypothesis with pass-fail proposals, which may eventually qualify as a theory]…”
Wombat;
“not significant at the 95% level” means it’s garbage. Only psychology and sociology etc. use such feeble validity tests. Real science uses 5-sigma (5 standard deviations), which is about 99.999%, give or take a ‘9’ or two.
Wombat,
You forgot to include NIWA’s climate record in your list.
Mailman
Perhaps the great MMGW scam is loosing some traction in Europe. If so it is not due to the lack of blatant propaganda straight out of the Reich or to old USSR.
Last night on BBC1 Scotland i sat through one of the most unbelievable polemics for MMGW it has been my (dis)pleasure to see.
It was titled ‘Making Scotlands’ Landscape’ by a guy called Professor Iain Stewart.
He has a degree in Geology and Geography and a PHD in Med. Earthquakes.
He is/was a child TV actor apparantly. Listening to his rant he would be at home in the Wizard of OZ(?).
This diatribe is available to UK readers on the BBC Scotland iplayer (5. The Climate).
He even had a numpty in Edinburgh Uni repeat the ludricous 2 plastic bottles with ‘air?’ and CO2 trick with a bright light and a couple of digital thermoms.
For those of you more fortunate than us in the Scottish Gulag we are going to save the planet on our own by reducing our CO2 emissions by 80% in 20 years. We are going to build 20,000 windmills and be completely self sufficient in ‘renuables’ by the same date.
Oh the Tooth Fairy is alive and just entered our pretend parliament in Edinburgh.
And of course this was all paid for by the BBC licence payers at £142-50 per house per annum.
oh happy days.
@ Wombat says:
November 22, 2010 at 12:41 pm
Wiki? Really? Well, I’m not surprised. Nor was I surprised to see this all-too-familiar sentence from the link you provided.
“The relevance of particular information in (or previously in) this article or section is disputed.”
Your other link seems to have something wrong with it, or you generated too much traffic, or something, I’m not able to get there.
I’ve never seen a 50-50 alarmist to skeptical MSM presentation. Perhaps you can link to one? You cite the Bush administration? Is that the same one that allowed Hansen to go around the globe yelling people were silencing him? Alarmism thrived quite well under the Bush admin. For the record, could you state the “consensus” opinion in its entirety? (and maybe through a falsifiable statement in there to boot!) The reason I ask, is that as you may see, skeptics see several issues with the alarmism, I’m just wondering which part of the alarmism is consistent with the “consensus” science.
Richard S Courtney says:
November 22, 2010 at 11:25 am
Sorry, Hans is right and you are wrong. Either you misunderstand the IEA report or you are misrepresenting it.
The graph clearly shows the oil price peaked at ~$100pbbl in 2008 and has fallen back to 1980s levels since. This is not consistent with oil becoming scarce.
I suggest that people read the report and decide if it supports Hans (it does) for themselves. As you said, it can be read at:
http://www.iea.org/speech/2010/Tanaka/Jakarta_weo2010.pdf
Richard
—————————–
The graph I quoted on page 11 is not showing oil price, it is showing “World oil production by type” and you accuse me of misrepresentation?
Weather current price is consistent with oil scarcity or not is a strawman, I made no assertion either way.
I suggest you re-read my post and view the relevant data before you jump to ad hoc conclusions.
It is a shame the original post was completely devoid of references, it amounts to little more than than the arm waving we accuse the warmists of.
[I killed the comment this is referring to and thus the downstream ones suffer as well ~ ctm]
[I killed the comment this is referring to and thus the downstream ones suffer as well ~ ctm]
Fears of fairies and dragons can be held true when one is fed & employed. As the financial contagion rears its ugly head again in Europe, with rising fears of the collapse of the Euro, with green shoots of nationalism rising up in the political garden, with immigration issues flaring, with taxes ever more burdensome, with unemployment at record levels, with the size, scope and intensity of governments increasing, even ordinary Europeans have lost interest in Global Warming.
There are just too many other fish to fry to worry about some new greenie religion.
Timing is just so critical in public relations and propaganda.
slioch
You said
“The average increase over that twelve year period from the four series is about 0.23C, in other words an increase of about 0.2C per decade, which is entirely in line with IPCC projections.”
Based on the WOODFOR TREES COMPOSITE TEMPERATURE INDEX,
the least square trend line slope trend for the last 10 years [118 months] is 0.0043 C/year and was only 21% of the the IPCC forecast of 0.21C/year .It has been basically flat for ten years
This is the Mean of HADCRUT3VGL, GISTEMP, UAH and RSS, offset to UAH/RSS baseline (-0.0975K)
http://www.woodfortrees.org/data/wti/from:2001/to:2001/plot/wti/from:2001/to:2011/trend
Al Gored says:
November 22, 2010 at 12:48 pm
‘The BBC has been like Monty Python’s Ministry of Truth for a long time, and it is starting to catch up with them.’
I’m afraid it’s far more like George Orwell’s Ministry of Truth than Python’s.
eadler: ‘There is no evidence that temperature data has been falsified. The last 12 months have been the warmest in the insturmental temperature record. ‘
I was just reading this when I had to go to the window to watch a squadron of pigs flying by.
Anthony:
Remove the Video posting by Garhighway. Why? Because it BEGINS by using “inflamatory language” (WUWT, “Pseudo Science Blog”.)
Sorry, YOU snip serious ad hominims all the time. I don’t want to see space given to the AWG crowd for that. They have their own “spaces”.
Max
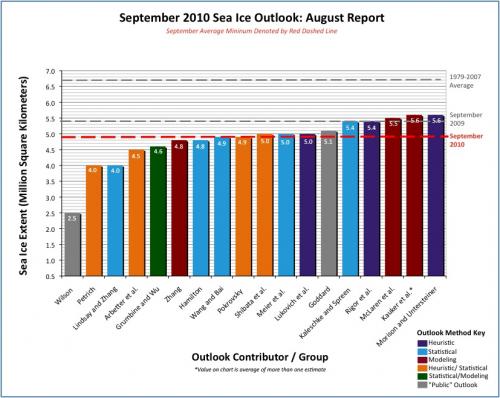
REPLY: Well not only that, but “Greenman” got the attribution wrong too. I wrote the intro about Bastardi, the rest was Steve Goddard, but “Greenman” has never played fair, so he doesn’t show that part, nor does he show all the other forecasts by scientists at that time that were also wrong.
See here for the SEARCH 2010 summary of forecasts by other groups. Goddard (sixth from the right in grey) came in at 5.1 and did better than some other scientists did.
– Anthony
matt v. says:
November 22, 2010 at 1:52 pm
Yes, the rate of warming for the last decade has been much lower, but the article and the claim was about warming since 1995, and that was what I addressed.
I think you meant to say ‘IPCC forecast of 0.2C/decade’.
Rhoda R – we have elections too in the UK – but the new ‘lot’ recently elected are as blinkered and collectively pig-headed as the previous lot. Can you believe it – they are still charging ahead relentlessly with wind farms, shovelling Renewable Obligation Certificates at them because, let’s face it, that’s the only way they are remotely viable.
However – in the rest of Europe we may have some respite because the politicos have got the euro to worry about – you know, that wonderful ‘one-size-fits-all’ currency project which was fine while the breeze (sorry) was blowing benignly, but now its turned into a gale and the fertilizer has hit the fan, its all starting to unravel. Something of course which us ‘armchair economists’ could work out without even resorting to a calculator – but – hey – what do we know..? We’re just climate skeptics/deniers/flat-earthers – no hope for us…
‘Wealth redistribution’ is becoming almost as much of a joke as man-made climate change…
We often complain about the complicity of the MSM in the AGW crap. I wish someone could give me a breakdown as to the involvement of media barons in carbon investments. It could also be that they are towing the line in line with the WW2 spirit because they have been gullible. Don’t be surprised about gullible.
http://www.businessandmedia.org/specialreports/2006/fireandice/fireandice.asp
http://newsbusters.org/node/11640
http://www.almanac.com/sites/new.almanac.com/files/1895_cvr1_0.png
http://www.time.com/time/magazine/article/0,9171,944914,00.html
http://www.washingtontimes.com/news/2007/sep/19/inside-the-beltway-69748548/
RichieP says:
November 22, 2010 at 2:09 pm
“Al Gored says:
November 22, 2010 at 12:48 pm
‘The BBC has been like Monty Python’s Ministry of Truth for a long time, and it is starting to catch up with them.’
I’m afraid it’s far more like George Orwell’s Ministry of Truth than Python’s.”
The BBC just wishes it was. But the combination of the accents and how silly their correspondents are makes it more Monty-Python-ridiculous than scary. Their main pre-Climategate climate-crisis reporter, David Shukman, was truly hilarious with his almost daily doomsday stories… even the way he said “glaciers” and “catastrophic” made me laugh.
Now they’re covering The Warming like Monty Python’s dead parrot sketch – it’s alive I say! – although they sure have quieted down on that front. It seems like days, perhaps even weeks, since I saw a wet polar bear in their daily “news” spew.
Brian H says:
November 22, 2010 at 12:52 pm
Quite right, Brian, and the clarification is appreciated. In either case, AGW is a long way from being a viable scientific theory, in the scientific meaning of the word. Sadly, the the primary scientists (Mann, Jones, et. al.), and policy makers treat AGW as if it’s been elevated to the most lofty of heights, that of scientific law.
Even IEA insiders are starting to come out and openly say their estimate of world reserves are grossly exaggerated. The author also seems unaware that Phil Jones is no longer director of CRU.
This is a poorly written propaganda article that uses vague and inaccurate generalities to support a predetermined stance.
Antony would do well to reduce the quantity of posts and verify the quality, IMHO. This sort of article damages the credibility of the site.
Wombat said:
Phil Jones said “… the trend for the period 1995 to 2009 … (0.12C per decade) is positive, but not significant at the 95% significance level. The positive trend is quite close to the significance level. Achieving statistical significance in scientific terms is much more likely for longer periods, and much less likely for shorter periods.”
What are Phil Jones’ qualifications in applied mathematics? Is he in any way equipped to pronounce on statistics in this way?
As far as I can tell, he is the discredited head of a small department in the 299th best university in the world. To get into UEA to read Climate Science, you need only be in the top 53% of your year academically, i.e. average.
Where did this average mind, at an average institution, gain his expertise in statistics; and who, with demonstrated expertise in this area has peer-reviewed his work?
Based on the work done by Girma Orssengo posted on WUWT earlier, the historical GLOBAL MEAN TEMPERATURE ANOMALY [GMTA] can be best visualized to consist of a LINEAR anomaly component rising on the average rate of 0.0059 C per year[ since 1880] or [0.0045 C /year going back 150 years per IPCC figures] plus an OSCILLATING component having a sinusoidal[ COSINE] like function with an amplitude of approximately 0.3C These two anomalies add and interact to produce an approximate 60 year cycle with alternating 30 years of COOLING with 0.42C temperature drop and 30 years of WARMING with a 0.77C temperature rise http://wattsupwiththat.files.wordpress.com/2010/04/predictions-of-gmt.pdf
We just peaked on the last warm cycle in the early 2000’s and have now started a 30 year cool cycle which mayl drop the global temperature anomaly by 0.42C by 2030.
These are the indicated temperature anomalies [hadcrut3] for the next cool cycle. Short term variation due to ENSO, volcanic eruptions, etc.] add or subtract to these approximate yearly figures.
2010 [0.391C] mean to end of OCT /2010
2015 [0.28 C]
2020 [0.16C]
2025 [0.076C]
2030 [0.06C]
Based on the colder anomaly of 0.06C by 2030, the temperatures are likely to be similar to those of the late 1970’s and early 1980’s. [1979(0.049C) and 1980(0.076C).Just look up what happened in the late 1970’s
In my judgment, the up coming colder global climate during the next few years and stretching into several decades may eventually convince the Europeans that global warming as currently presented is not real and they better prepare for what really lies ahead.
Unfortunately expert forecasts do fail but some people believe them anyway, so I don’t know if anything will convince some
[Lots of discussion about that earlier: It may be that the short oscillation is adding (and subtracting) from an 800 year longer oscillation, rather than a simple linear increase. In any case, one needs to account for the RWP, Dark Ages, MWP, and LIA … as well as today’s Modern Warming Period. Robt]
CRU Orders Removal of Climate Realist Article From the Express Newspaper.
http://ourmaninsichuan.wordpress.com/
Pointman
JUST TO REMIND EVERONE.
http://s446.photobucket.com/albums/qq187/bobclive/?action=view¤t=jones1_Join_to_AVI_1.mp4
Won’t someone send Tony a few thousand back numbers of Private Eye?
Dellingpole and Monckton may be neck and neck in the sad new Spectator’s pythonia praecox run, but the good old Ministry of Truth seems to have come to rest in the Pseud’s Corner shrubbery here at WUWT.
Use the force Nuke, said old Ben
HHmmm can you say split atoms not birds
This picture is so hilarious, I very nearly added it to my Facebook profile as a sardonic commentary. But I was afraid that some of my ignorant friends would think I was serious.
matt v. says:
November 22, 2010 at 1:52 pm
BTW, lest you should find yourself thinking that the low rate of global warming of the last ten years, to which you draw attention, is in some respect significant, do take a look at the following graph of the HADCRUT series since 1975:
http://www.woodfortrees.org/plot/hadcrut3gl/from:1975/plot/hadcrut3gl/from:1975/trend/plot/hadcrut3gl/from:2003/trend/plot/hadcrut3gl/from:1990/to:1997/trend/plot/hadcrut3gl/from:1979/to:1987/trend
I’ve marked upon it three periods, each of about eight years’ duration, in which the least squares fit is obviously negative. Clearly, the periods exist within an overall warming trend. Such periods of cooling in an overall warming trend are inevitable where there is an overall warming trend of nearly 0.2C per decade and annual variability of up to +or-0.2C per year (ie where the data is ‘noisy’): that is also why they are not significant.
Getting excited about such periods of cooling and claiming that they show we are about to descend into a longer period of cooling is not justified.
@Leif Svalgaard
Leif Svalgaard says:
November 22, 2010 at 10:12 am
“They are also beginning to understand that major rain and snow storms, hurricanes and other weather extremes are caused by solar-driven changes in global jet streams and warm-cold fronts”
There is no evidence of that either.”
There are some studies that found a link between jet stream position and sun cycle.
The jet streams have also been moving southwards for 3-4 years straight now which is btw opposite of what they predicted global warming would do.
Same trend has been seen around other minimums. They also coincidence with harsh winter in europe and the freeze of dutch canal.
The dutch canal usually freeze once every solar cycle, which happens to be during minimum, but now this has happened for years in a row coincidencing with the ongoing grand minimum.
@Leif Svalgaard
http://www.sciencedaily.com/releases/2010/04/100415080848.htm
someone wrote :
Dr. Labohm, is this the first time you say it out loud? That you are a Denier?
Does this mean more and more professors dare speak out? Or have they all been speaking out all the time, but ignored by media?
Labohm is nor a professor, nor a dr. He’s a retired economist who never worked a day in research but (mainly) worked for the Ministry of foreign affairs.
Above that, in Holland he receives lots of criticism of intellectual dishonesty because he never corrects the errors in his work but keeps repeating the same errors / half-thruths while pretending he never heared the rebuttals he receives and doesn’t know what he knows is wrong or misleading.
Most of the discussions are in Dutch (but with babelfish you should be able to understand most of what’s said on blogs like De Dagelijkse Standaard) but luckily a Dutch blogger wrote a blogpost brilliantly illustrating Labohm’s way of repeating the same misleading facts : http://jules-klimaat.blogspot.com/2009/03/labohm-again-sigh.html
There are credible climate skeptics like dr Lindzen or dr Spencer, but i’m afraid Hans labohm is not one of them.
Slioch says:
November 22, 2010 at 4:05 pm
And you trust the data, watch the video in my earlier post.
Slioch says:
November 22, 2010 at 4:05 pm
“Getting excited about such periods of cooling and claiming that they show we are about to descend into a longer period of cooling is not justified.”
Alternately: “Getting excited about such periods of warming and claiming that they show we are about to descend into a longer period of warming is not justified.”
The WWF has some warped minds working at it.
SLIOCH
You said
“Getting excited about such periods of cooling and claiming that they show we are about to descend into a longer period of cooling is not justified.”
Ten year of flat global temperatures is a sign of pending change.
The historical periods of cooling and warming are real and they will happen again unless you can alter the forces of nature.Just look at any historical temperature data.
You miss the whole point of what is the effect of these more significant cooler periods. They moderate the climate of the planet over a century. By 2100 the natural planetary cycle projects an anomaly of only 0.63 C since there are likely going to be two cooling cycles ahead and only one warming cycle during the next 90 years .IPCC project anywhere from 2.4 C to 5.3 C anomaly increase by 2100 in a straightline. They anticipate no cooling of any kind. Below is how Girma Orrssengo put it in his article. If one projects a year’s temperature based only on 4 summer periods rather than a summer, fall, winter and spring, it will make big difference . Agw supportes are saying there will only be summers for the next 100 years.
……”the century [20th] started when the oscillating anomaly was at its minimum near 1910 with GMTA of –0.64 deg C and ended when it was at its maximum near 2000 with GMTA of 0.48 deg C, giving a large global warming of 0.48+0.64=1.12 deg C. This large warming was due to the rare events of two global warming phases of.77 deg C each but only one cooling phase of 0.44 deg C occurring in the 20th century, giving a global warming of 2*0.77-0.42=1.12 deg C.
In contrast to the 20th century, from Figure 3, there will be nearly no change in GMTA in the 21st century. This is because the century started when the oscillating anomaly was at its maximum near 2000 with GMTA of 0.48 deg C and will end when it is at its minimum near 2090 with GMTA of 0.41 deg C, giving a negligible change in GMTA of 0.41-0.48=-0.07 deg C. This negligible change in GMTA is due to the rare events of two global cooling phases of 0.42 deg C each but only one warming phase of 0.77 deg C occurring in the 21st century, giving the negligible change in GMTA of 0.77-2*0.42=-0.07 deg C. “
tommy says:
November 22, 2010 at 4:16 pm
There are some studies that found a link between jet stream position and sun cycle.
“weather extremes are caused by solar-driven changes in global jet streams and warm-cold fronts”
That found a coincident occurrence of regional changes. The quote states the connection as a fact rather than a suggestion.
The latest paper from Koutsoyiannis et al., compares GCM models with actual measurements of temperature history and precipitation for regional areas of the US and finds the models have failed miserably. This is what the scientific method is about.
http://www.informaworld.com/smpp/section?content=a928051726&fulltext=713240928
“not significant at the 95% significance level” is clear and unambiguous. There is NO recent warming. Let’s hope no-one is paying Slioch and Wombat to do any kind of science work.
Mack1;
And even “significant at the 95% level” would be garbage. Given the tendency of all scientists/humans to succumb to confirmation bias, and the selection of positive trials out of a larger pool while ignoring the negative ones, etc., even 1 chance in 20 that the result is false is FAR too high for real science. As I mentioned elsewhere, real physical science uses 5-sigma significance requirements, which is many 9’s after the decimal. Only psychology and other failed wannabe “sciences” accept 95% — mostly because they can’t get any better than that. And the results show it.
Hans Labohm: “Since every cloud has a silver lining, the ongoing economic crisis might give extra impetus toward that end.”
Is the “silver lining” of clouds well understood in the models and suitably represented in the code?
I do not recall Harry having mentioned it.
I would be more worried about a paucity of CO2…. not an abundance…. Especially considering that CO2 has, in the past, been at the lower range of what is necessary for more specialized plant species like trees and shrubs.
Justice4Rinka says:
November 22, 2010 at 2:58 pm
“Wombat said:
“Phil Jones said “… the trend for the period 1995 to 2009 … (0.12C per decade) is positive, but not significant at the 95% significance level. The positive trend is quite close to the significance level. Achieving statistical significance in scientific terms is much more likely for longer periods, and much less likely for shorter periods.”
What are Phil Jones’ qualifications in applied mathematics? Is he in any way equipped to pronounce on statistics in this way?
As far as I can tell, he is the discredited head of a small department in the 299th best university in the world. To get into UEA to read Climate Science, you need only be in the top 53% of your year academically, i.e. average.
Where did this average mind, at an average institution, gain his expertise in statistics; and who, with demonstrated expertise in this area has peer-reviewed his work?”
It doesn’t even take a PHD degree in science to understand how to calculate the uncertainty present in an estimate of the straight line slope of plotted points to a 95% confidence interval. This is a standard computation that can be done via tables, once one has computed the standard deviation. This is a standard undergraduate problem. If you did any experimental work in science, even as an undergraduate, you would know that.
If you haven’t done any of this, you can find out how by consulting the following web site:
http://www.curvefit.com/linear_regression.htm
With regards to periods of cooling, the Hadcrut3 data (http://www.cru.uea.ac.uk/cru/data/temperature/hadcrut3gl.txt) show that you have to go back to the 1940s for a time when a high mark was not beaten in 10 years or less. The 1998 anomaly was 0.548 and the next highest is 2010 so far until the end of October at 0.499. With the way global temperatures are nosediving recently, there appears to be no way a record will be set on Hadcrut3 this year.
No, not significant at the 95% level, means that there’s more than a 1 in 20 chance that the warming could have been generated by random variation.
As you correctly point out, you did leave off a 9 in the percentage within the Confidence lever for 5σ.
Can you give an example of what you call a “real science”. The stability of pharmaceuticals is calculated on the 95% confidence limit. When you buy pharmaceuticals, do you use the expiry date on the label, or do you calculate your own so that your health depends on what you call “real science”?
Or do you consider pharmacology not a “real science”, and just throw your healthcare to the wind?
… Or do you think your objection to a 95% CI is not in fact justifiable, and is based on your political desire to have some basis to call findings of climate science “garbage”? …
He’s talking about sea ice, isn’t he?
There’s a lot less sea ice at the South Pole. In Summer there’s basically none. (If sea ice extent is areas that have a 15% or more coverage of sea ice.)
This is the usual time for looking at NH sea variation. It is the summer extent that determines the availability of breeding habitat for many pinnipeds, and also the hunting habitat for bears.
Also, it is a better measure of the overall health of the sea ice, because the extent doesn’t measure the depth or the age of the sea ice. Thin and young ice does melt more quickly than thick and perennial ice, so the collapse of the perennial ice does show up in the minimum annual extent.
You can’t really analyse summer sea ice in the Antarctic, because there there is nearly none. This is why winter ice is more generally discussed.
This is probably the less relevant statistic.
But global sea ice mass is dropping fast, and summer sea ice extent has collapsed to the extent that the change in radiative forcing from the albedo change is now about 0.2 W/m² for the Northern Hemisphere more than it was in 1990. The entire forcing from all anthropogenic CO2 ever is only about 1.6 W/m², so the sea ice extent is becoming significant, at least in the northern hemisphere.
Going increasingly nuclear is the only sensible solution.
Wind and solar are OK for isolated communities or individuals, but make no sense whatsoever in any other context.
Green parties rarely, if ever, understand the economic facts of life, but unfortunately they have an excessive influence on mainstream political thinking. Somehow, most of us have been conned into believing green is always good, whereas the reality is: green is often good, but just as often it is both stupid and dangerous.
In the name of workers’ rights and all things green, the European Union is demanding the de-industrialisation of the continent, a policy of complex and expensive rules and regulations enforced by growing armies of pointless bureaucrats.
Good article from Hans Labohm.
What’s remarkable is that he is not the only scientist who has worked for the IPCC.
I really appreciate his views and his quest to correct what’s wrong.
So thanks for the effort.
What will certainly help to change opinions is that Europe possibly will see an extraordinary cold and snowy winter which will help to make our political establishment selling their mantra of AGW at the Climate Meeting in Cancun look extremely stupid.
http://notrickszone.com/2010/11/22/extreme-cold-to-grip-europe-forecast-38°c-in-switzerland-will-be-even-colder-later-pattern-not-seen-in-70-years/
Jimmy Haigh says:
November 22, 2010 at 4:46 pm
Slioch says:
November 22, 2010 at 4:05 pm
“Getting excited about such periods of cooling and claiming that they show we are about to descend into a longer period of cooling is not justified.”
Alternately: “Getting excited about such periods of warming and claiming that they show we are about to descend into a longer period of warming is not justified.”
If the periods of warming were only eight years long then your objection would have some force: but that is not the case.
The present period of warming started around 1975. If you plot the data (annual average global temperature from HADCRUT) from 1975 to 1995 (the year referred to in this article), calculate the best fit linear trend and put in dashed lines either side to represent two standard deviations both sides of the best fit line and THEN plot the subsequent data up to the present time, you will find that all of the post 1995 plots lie within the dashed lines (indeed most lie above the 1975-1995 best fit line).
Thus, the temperature record since 1995 is entirely consistent a continuation of the data from the statistically significant 20 year period 1975-1995, which, it appears, everyone accepts represents significant warming.
People getting excited about eight (or thereabouts) periods of cooling is people getting excited about something of no significance, whereas now 35 years of warming IS significant: it is as simple as that.
If you want to come back to me when there has been a statistically significant period of cooling, then by all means do so: but you may have to wait a long, long time.
matt v. says:
November 22, 2010 at 5:06 pm
“Ten year of flat global temperatures is a sign of pending change.”
That is not true. Ten years of (more or less) little change in average global temperature is what we should expect to happen within a long-term trend of nearly +0.2C per decade and annual variation of +or-0.2C per year. You can construct entirely artificial data based upon those two parameters and you will find such ten year periods occur frequently: they are not significant.
Of course, were change to be pending then it might be preceded by such a period – but that is an entirely different statement. In order to predict whether change is pending we need to look at the likely future forcings – and they all suggest continued warming. Getting distracted by things of no significance is not helpful.
Sad to see such sort of misleading propaganda at WUWT…
The feed-in tarifs for wind are now just above 0.07 €/kWh in Portugal and Spain. With such figures a windmill pays for itself in about 10 years, less than half of its working life.
For solar these numbers are higher, but nowhere near the 0.56 €/kWh. A micro system composed by 20 panels and a converser pays for itself during its working lifetime with 0.08 €/kWh.
And then the 0.04 €/kWh figure for coal completely denounces the author. The Germans alone are spending 2 billion € per year on direct subsidies to the coal industry, that’s over 40 €/ton of coal mined. These are not feed-in tariffs like its made with the renewables, these are sums of money directly provided to the industry.
You can certainly make a case that building any serious renewable energy park is going to cost money, a lot of it. And you can easily point out that other indigenous energies, like Nuclear, are cheaper. But resorting to the sort of claims this author employs is a clear sign of an agenda. This gentleman probably believes we can continue living forever on imported gas from Russia at the same prices we get it today. Or that we are going to pipe the South Pars field directly to Europe. I wish him good luck.
Ammonite says
“Hence the meaninglessness of quoting results across small periods of time as somehow invalidating the theory of AGW (particularly with 2010 at near record highs) and the need to apply sufficient nuance to understand the various factors present in a complex system.”
The temperature hasn’t risen for around 15 years, and you say that is a meaningless small period. The warming started in 1980 and stopped in 1995, also a meaningless small period of time in your logic.
According to the climate scientists warming would accelerate. Well it hasn’t, and what warming there was, was over a “meaninglessly small period”.
If it were to accelerate wouldn’t you expect a much higher temperature after 15 years?
Another one makes it through the Climate Science Berlin Wall.
http://notrickszone.com/2010/11/22/another-one-makes-it-through-the-climate-science-berlin-wall/
Rather like a murder case, the best way to prove innocence is to prove the guilt of someon else.
So let us consider the alternative theory of warming caused by the warm mode of the 60 PDO cycle.
Now the warm phase started in 1970, the warming started a decade later and peaked in 1998 (30 years).
The cool phase started in 2000 and 10 years later it looks like the cooling is beginning in earnest.
Now this theory fits it is consistent, it doesn’t need to be revised, the temperatures are going down as predicted (check NOAA predictions for 2011) this is after a very cold 2008 and only a short strong El Nino that hasn’t raised average global temps like it did in 1998.
This is what Don Easterbrook predicted 10 years ago.
I believe him and not the climate scientists who believe in AGW because he made a prediction around the same time and it looks correct.
This is what science is all about, you have a theory, then you test it. If it works then it is right if not, it is wrong. The climate scientists got it wrong, plain and simple.
BBC: How confident are you that warming has taken place and that humans are mainly responsible?
Phil Jones: I’m 100% confident that the climate has warmed. As to the second question, I would go along with IPCC Chapter 9 – there’s evidence that most of the warming since the 1950s is due to human activity.
http://news.bbc.co.uk/2/hi/8511670.stm
That is what Phil Jones said. Phil Jones said not: “…there has been no measurable warming since 1995”. He is not in the habit of distorting reality.
The really scary thing about Europe is the politicians. And we cannot vote to leave the world’s most expensive club that favors but a few, being those who enrich themselves carbon trading and building wind turbines which then generate too little electricity to count as an energy source.
The public awareness that AGW is a scam might grow but that doesn’t change the fact that European citizens are no longer free.
This article from Lubos Motl is a stunning example of that fact.
Tuesday, november 23, 2010 …
DDR stole 40,000 little heat balls
http://motls.blogspot.com/2010/11/ddr-stole-40000-little-heatballs.html
“The Standing Committee on Environment of the Lower House even organized a one-day hearing, where both climate chaos adherents and disaster skeptics could freely discuss their different views before key parliamentarians who decide climate policy. This hearing was followed by a special seminar organized by the Royal Netherlands Academy of Sciences, using the same format but focusing on scientific topics. The Academy will soon publish a report about this seminar.”
That speaks volumes when we compare the Australian government’s partisan and token ‘investigations’ in order to impose a ‘Fait accompli’ ETS tax on its citizens.
Links, please.
PS: Or citations, at least.
“Renewable energy projects: Does these projects work in winter?”
Well…uhhm.. they lower the world population by stopping all vital functions of society and freezing people to death. But don´t tell that to anyone.
RR Kampen says:
that Phil Jones says:
I’m 100% confident that the climate has warmed. As to the second question, I would go along with IPCC Chapter 9 – there’s evidence that most of the warming since the 1950s is due to human activity
The question is: Which human activities? Would that be the activities that produce water vapor or those that produce Co2?or both?
As outlined in:
http://letterdash.com/HenryP/more-carbon-dioxide-is-ok-ok
human activities that produce water vapor are a lot more.
HenryP says:
November 23, 2010 at 5:15 am
“human activities that produce water vapor are a lot more”
Water vapour is an important greenhouse gas – but it is not a long-lived one.
The amount of water vapour in the atmosphere is a function of the temperature of the atmosphere. Any attempt to increase the amount in an atmosphere approximately at equilibrium with its water content would result in more precipitation over a period of the following weeks until the amount in the atmosphere returned to approximate equilibrium.
Human activity, therefore, cannot directly increase the amount of water in the atmosphere, except for a short time period. We can only increase it long-term by increasing the heat content of the atmosphere, and that IS what we are doing by increasing long-lived greenhouse gases such as CO2. It was to that that Jones was referring.
P. Solar says:
November 22, 2010 at 2:54 pm
“…..This is a poorly written propaganda article that uses vague and inaccurate generalities to support a predetermined stance.
Antony would do well to reduce the quantity of posts and verify the quality, IMHO. This sort of article damages the credibility of the site.”
___________________________________________________________________
On the contrary Antony was quite correct in posting this piece and allowing a debate about its merit. It is called policing one’s own ranks.
Do they do a global climate dataset too?
Is it available on the web?
Does anyone else see the problem with this line of reasoning?
“That is what Phil Jones said. Phil Jones said not: “…there has been no measurable warming since 1995″. He is not in the habit of distorting reality.”
RR Kampen provides us yet again with a masterful example of deadpan humour!
So drole!
Slioch says:
November 22, 2010 at 4:05 pm
matt v. says:
November 22, 2010 at 1:52 pm
BTW, lest you should find yourself thinking that the low rate of global warming of the last ten years, to which you draw attention, is in some respect significant, do take a look…
Clearly, the periods exist within an overall warming trend. Such periods of cooling in an overall warming trend are inevitable where there is an overall warming trend of nearly 0.2C per decade and annual variability of up to +or-0.2C per year (ie where the data is ‘noisy’): that is also why they are not significant.
Getting excited about such periods of cooling and claiming that they show we are about to descend into a longer period of cooling is not justified.
___________________________________________________________
So why don’t YOU look at the long term trends as you are suggesting we do.
http://www.greenworldtrust.org.uk/Science/Images/ice-HS/noaa_gisp2_icecore_anim_adj.gif
I certainly see nothing alarming. I also see the temperature goes up and down in cycles and if I was concerned about anything it would be how close we are to the next Ice Age.
From your favorite person, Joe Romm over at Climate Progress states:
“Absent human emissions, we’d probably be in a slow long-term cooling trend due primarily by changes in the Earth’s orbit — see Human-caused Arctic warming overtakes 2,000 years of natural cooling, “seminal” study finds…” http://climateprogress.org/2010/08/16/hockey-stick-paper-mcshane-and-wyner-statisticians/#more-31767
That is exactly what this paper did. It looked at the entire Holecene:
Temperature and precipitation history of the Arctic
“..Solar energy reached a summer maximum (9% higher than at present) ca 11 ka ago and has been decreasing since then, primarily in response to the precession of the equinoxes. The extra energy elevated early Holocene summer temperatures throughout the Arctic 1-3° C above 20th century averages, enough to completely melt many small glaciers throughout the Arctic, although the Greenland Ice Sheet was only slightly smaller than at present… As summer solar energy decreased in the second half of the Holocene, glaciers reestablished or advanced, sea ice expanded, and the flow of warm Atlantic water into the Arctic Ocean diminished. Late Holocene cooling reached its nadir during the Little Ice Age (about 1250-1850 AD), when sun-blocking volcanic eruptions and perhaps other causes added to the orbital cooling, allowing most Arctic glaciers to reach their maximum Holocene extent…”
This paper also agrees that we are at the point in the earth’s Milankovitch cycle that ushers in an ice age. The biggest question of course is why we are not covered in ice yet.
Lesson from the past: present insolation minimum holds potential for glacial inception (2007)
“Because the intensities of the 397 ka BP and present insolation minima are very similar, we conclude that under natural boundary conditions the present insolation minimum holds the potential to terminate the Holocene interglacial. Our findings support the Ruddiman hypothesis [Ruddiman, W., 2003. The Anthropogenic Greenhouse Era began thousands of years ago. Climate Change 61, 261–293], which proposes that early anthropogenic greenhouse gas emission prevented the inception of a glacial that would otherwise already have started….”
The biggest problem with this paper and the CAGW theory, is it assumes no changes in the energy from the sun received by the earth. However during the 20th century the sun has been very active according to this paper and NASA This is no longer true as we enter the new century according to the Solar Dynamics Observatory Mission News
The actual data shows the earth is gradually headed downhill towards another glaciation, the only question is when and how. A quiet sun, cool ocean phases and a major volcanic eruption would be my guess as the trigger point. CO2 warming can not counteract the combined effects of the other big three. As the oceans cool the CO2 levels will increasingly drop.
Abrupt Climate Change: Should We Be Worried? – Woods Hole Oceanographic Institution
“Most of the studies and debates on potential climate change, along with its ecological and economic impacts, have focused on the ongoing buildup of industrial greenhouse gases in the atmosphere and a gradual increase in global temperatures. This line of thinking, however, fails to consider another potentially disruptive climate scenario. It ignores recent and rapidly advancing evidence that Earth’s climate repeatedly has shifted abruptly and dramatically in the past, and is capable of doing so in the future.
Fossil evidence clearly demonstrates that Earthvs climate can shift gears within a decade….
But the concept remains little known and scarcely appreciated in the wider community of scientists, economists, policy makers, and world political and business leaders. Thus, world leaders may be planning for climate scenarios of global warming that are opposite to what might actually occur…“
As far as I am concerned neglecting change towards a COOLING world is down right criminal negligence – my biggest gripe with CAGW.
We are so busy watching the yapping little poodle we can not see the mammoth that just walked into the room.
That wiki page has links to the statements of all the scientific bodies mentioned.
Nor should you be. The anti-scientific movement in the public is huge in the field of climate change. For example this site tries to purvey a counterscientifc opinion, and most of the comments are people who accept it as if that is in some way reasonable.
Which other link? The Boykoff paper or the Oreskes Essay?
Read the Boykoff paper.
And example of how a democratic government does not want to hear about the reality of climate change.
Allowed? The USA protects free speech. Anyone can yell anything they like, and the government can’t stop them.
His point was that the reports to government were heavily edited to support the government’s wish not to act, not that his right to free speech was being curtailed.
And yet damped a lot from the scientific reality.
It depends what you mean. If you’re going to try to claim that anything that I don’t state is not agreed upon by the scientific community, because you asked me to state it in its entirety, then, no, this space is not sufficient to put the entire basis of optics on which our knowledge of the anthropogenic greenhouse effect is based.
But the Oreskes Essay and the IPCC statement that no scientific organisation of standing disagrees with, is that most of the observed warming over the last 50 years is likely to have been due to the anthropogenic increase in greenhouse gas concentrations.
@JohninEnfield
John Shade at Climate Lessons has posted on your comment about what might be a sea-change in the attitudes of teachers you know. If any other people think this change may indeed be beginning to happen, please let him know and also give useful links on this to any teachers you know. http://climatelessons.blogspot.com/
Slioch,
Who is saying there’s been no warming? The earth is still emerging from the LIA. Warming is to be expected, and the planet has warmed to a greater extent numerous times during the Holocene. There is no evidence that this time it’s different.
The real question is: does CO2 drive the climate? There is no verifiable real world evidence that it does. No doubt CO2 adds a minor amount of warming, but it is too small to reliably measure.
The entire global warming scare, and the proposed countermeasures, assume that “carbon” is responsible for all, or almost all of the few tenths of a degree warming. But this is only conjecture, since proponents of the the AGW scare refuse to do science according to the scientific method. Thus, their conclusions are not science, but simply opinion.
Like the guy loadin’ bales of cotton and totin’ dat barge, as the song has it, I gets weary of people whose names have never appeared here on WUWT before who suddenly swarm here to declare that one P Jones is as pure as the driven snow and that he never admitted that the world hasn’t warmed over the past 15 years.
I would be very happy if we kept on recovering from the LIA until it gets at least as warm as the MWP, but the thermometers and the trends they drive aren’t pointing that way right now, not in the UK, at least.
. The US and other parts of the non-European Anglo-Saxon world feature highly polarized and politicized debates along the left/right divide. In Europe, all major political parties are still toeing the “official” IPCC line.
This is one of those pull quotes that seems obvious once stated, but most do not correlate the countries with influence. I give the author an insightfule for that one!
@ Wombat
It doesn’t even take a PHD degree in science to understand how to calculate the uncertainty present in an estimate of the straight line slope of plotted points to a 95% confidence interval.
Quite. Which professional statisticians have reviewed Phil Jones’ claim that 95% confidence is the right level to use?
Sexton: “For the record, could you state the “consensus” opinion in its entirety?”
Wombat: “It depends what you mean. If you’re going to try to claim that anything that I don’t state is not agreed upon by the scientific community, because you asked me to state it in its entirety, then, no, this space is not sufficient to put the entire basis of optics on which our knowledge of the anthropogenic greenhouse effect is based.”
I’ve been waiting for your response to see how you would duck Sexton’s question. Your squirming is a joy to behold. But perhaps James is guilty of not defining his question with a bit more precision. Permit me to intervene.
Is the consensus one of the following, and if so which?
a) Global temperatures have increased in the 20th century.
b) Global temperatures have increased, and most of this warming is due to human released co2.
c) Most of the warming is due to co2, and net positive feedbacks will lead to temperature increases above 2c by 2100.
d) The warming will not only be above 2c but will be catatastrophic to human civilization and lead to another great extinction.
Slioch
You said
“In order to predict whether change is pending we need to look at the likely future forcings – and they all suggest continued warming. Getting distracted by things of no significance is not helpful.”
Sounds like you do not do your homework before posting.
PDO has gone negative and cooling
AMO has peaked and has started its decline
SOI has been high positive since July [predicts cold weather]
AO and NAO are now more frequently at higher negative levels more often
Solar activity continues low
Most Global mean temperature anomaly data sets show dropping anomalies
Ocean SST’S are dropping
Ocean heat content has levelled off and some droping fast [ Atlantic ocean]
Europe and Asia have had three cold winters in a row and in several areas record 2010 winter just past
North American annual temperatures have been cooling for three years
US had one of its worst winters in 2010
2010 had the 2nd most snow extent for Northern Hemispehere sincce 1978/1979
The list goes on and on
Suggest you read http://isthereglobalcooling.com/
We are not talking about short term cool periods but like 20-30 years.[ like 1880-1910 and again 1944-1976]
roger says:
November 23, 2010 at 7:09 am
RR Kampen provides us yet again with a masterful example of deadpan humour!
So drole!
No, I just corrected a small mistake by Hans Labohm, thank me 🙂
Pete:
Peak Oil is a myth. And your assertions that Peak Oil has been reached are baseless.
Oil reserves have been at ~40 years throughout the last century and will remain at ~40 years throughout this century. This is because oil companies have a planning horizon of ~40 years so
(a) they hire people to look for more oil if they don’t have ~40 years reserves
but
(b) they don’t pay people to look for more oil if they have ~40 years reserves.
Those are the facts, and anybody can check them.
So, I can only repeat what I said in my previous post; i.e.
I suggest that people read the report and decide if it supports Hans (it does) for themselves. As you said, it can be read at:
http://www.iea.org/speech/2010/Tanaka/Jakarta_weo2010.pdf
Richard
Slioch:
You say to me:
“As for your pretence that “no measurable warming since 1995″ should be equated with “no significant warming since 1995″: well, if you wish that stain of illogic to be lodged against your name then so be it. It does not surprise me at all.”
Please enlighten me so I can remove the stain.
By what “logic” can one measure a “warming since 1995” when that warming – if it exists – is too small to be detected as being significant at 95% confidence level?
Richard
Any UK reader not scared by AGW should check out their Department of Energy’s website for its DECC Business Plan 2011-2015 (open for responses to 31/01/11). Whether the diagnosis is reliable or not, this cure could prove fatal. How can a country in the UK’s economic position even think about throwing so much money (that it doesn’t have) at a mere hypothesis? Still, there are a few good jokes if you read it carefully…
Richard S Courtney says:
November 23, 2010 at 9:21 am
By what “logic” can one measure a “warming since 1995″ when that warming – if it exists – is too small to be detected as being significant at 95% confidence level?
Phil Jones answers:
BBC – Do you agree that from 1995 to the present there has been no statistically-significant global warming
Jones – Yes, but only just. I also calculated the trend for the period 1995 to 2009. This trend (0.12C per decade) is positive, but not significant at the 95% significance level. The positive trend is quite close to the significance level. Achieving statistical significance in scientific terms is much more likely for longer periods, and much less likely for shorter periods.
http://news.bbc.co.uk/2/hi/8511670.stm
The short version of this answer might read: wait just another year. Perhaps this year will get the temperature rise in the 95% confidence level already.
Henry@Slioch
http://letterdash.com/HenryP/more-carbon-dioxide-is-ok-ok
recommend reading it
We have so many factors, and no test results…
1) radiative cooling by Co2
2) radiative warming by Co2
Which one is bigger? No actual proof that 2) is bigger has been presented to me.
3) cooling by CO2 due to vegetation (why do forests grow where it it is warmer?)
4) More water vapor also means more clouds which causes more cooling due to deflection of sun light.
5)But more water vapor also traps more heat from earth.
Which effect is bigger? where does the heat go when water vapor condenses? What about the water vapor and oxygen that like CO2 also traps heat at 14-15 um?
So many questions and so few answers to these questions that are based on actual physical tests.
http://letterdash.com/HenryP/more-carbon-dioxide-is-ok-ok
recommend reading it
then come back to me if you have actual test results from actual tests.
Richard S Courtney says:
November 23, 2010 at 9:21 am
“By what “logic” can one measure a “warming since 1995″ when that warming – if it exists – is too small to be detected as being significant at 95% confidence level?”
The warming is measured and recorded within the various temperature/time series – I gave the five year average temperatures above since that removes most of the annual variation, but if you wish you can use annual figures or the linear trend as Jones did – no method is perfect but they all show a warming from 1995 to February this year when Jones was interviewed.
The point about significance is NOT whether there has been a warming, it is whether that warming can be attributed to a long-term warming trend or whether it could simply be the result of inter-annual variation.
Temperatures since since 1975 can be described as a combination of a long-term trend of about 0.16-0.18degC/decade (caused by increasing heat energy in the atmosphere/oceans/land surface system) upon which is superimposed annual variations of + or – c. 0.2degC (caused by varying distributions of that heat throughout the atmosphere/oceans/land surface system).
The question that Jones addressed was basically: was the warming from 1995 caused by the long-term trend or could it have been caused by the inter-annual variation. His answer, in effect, was that there is a slightly more than 5% chance that it could have been caused by the inter-annual variation. In other words there is that small chance of slightly more than 1 in 20 that we would have witnessed the warming that we have since 1995 EVEN IF there was NO long-term warming at all.
So the Jones question was not “has there been warming?”, rather, it was, “given that warming has occurred, to what can we attribute it?” Jones answer means that there is a slightly less than 95% chance that it was caused by a net increase in the heat content of the atmosphere/oceans/land surface system.
I hope that clarifies the situation.
R. de Haan says:
November 23, 2010 at 2:53 am
The public awareness that AGW is a scam might grow but that doesn’t change the fact that European citizens are no longer free.
This article from Lubos Motl is a stunning example of that fact.
Tuesday, november 23, 2010 …
DDR stole 40,000 little heat balls
http://motls.blogspot.com/2010/11/ddr-stole-40000-little-heatballs.html
———————————————————–
I read that article, then the actual legislation preventing the importation and retailing of incandescent lights, from the Official Journal of the European Union: http://eur-lex.europa.eu/LexUriServ/LexUriServ.do?uri=OJ:L:2009:076:0003:0016:EN:PDF#ANNEXII
This bit caught my eye:
“A review of this measure should take particular note of
the evolution of sales of special purpose lamp types so as
to verify that they are not used for general lighting
purposes“. (my emphasis)
What a bunch of control freaks.
I have been fizzing for a while now at the fact that the EU is trying to tell us what we can and cannot use as illumination in our own homes. I just ordered 20 more incandescents (60W and 100W) online, to add to my stock, before they get any harder to get hold of.
Energy savers are good for some applications, incandescents for others. I’d like to make my own choice on that, thank you Brussels.
Dear Leif
Over the past ten years, I have down loaded a full compliment of temperature anomolies, from GISS, years apart and they are not the same. It appears that Dr.Jim Hansen keep altering historical temperature records.
Does this mean that the basleline is “floating”?
unspots says:
November 23, 2010 at 12:42 pm
It appears that Dr.Jim Hansen keep altering historical temperature records.
Does this mean that the baseline is “floating”?
I’m sure Hansen will defend the alterations as being improvements. What is means is simply that we do not have reliable long-term records. For the past 30 years we have good satellite data and they are not too different from the GISS record as has been discussed several times on this blog. E.g. by Mosher.
RR Kampen and Slioch:
Thank you for the laughs you have given me.
Hans Labohm wrote;
“Phil Jones, director of the University of East Anglia’s Climatic Research Unit and one of the main players in Climategate, now acknowledges that there has been no measurable warming since 1995.”
You disputed that so I pointed out that “Hans is undeniably right if one accepts “measurable warming” means ‘warming that is discernible as existing with 95% confidence’.”
RR Kampen, you have disputed my observation by saying;
“The short version of this answer might read: wait just another year. Perhaps this year will get the temperature rise in the 95% confidence level already.”
LOL. Of course it “might” or it might not change this year or some future year. But your “answer” confirms that Hans’ statement is true.
And Slioch, your nonsensical excuses are really funny. Your most recent one tries to pretend the discussion is about something other than the correct statement made by Hans that you disputed. Now, you assert;
“So the Jones question was not “has there been warming?”, rather, it was, “given that warming has occurred, to what can we attribute it?” Jones answer means that there is a slightly less than 95% chance that it was caused by a net increase in the heat content of the atmosphere/oceans/land surface system.”
Say what!? No! You cannot possibly expect anybody to swallow that.
Jones was asked a question and he answered it. Hans Labohm accurately reported that answer.
The question and the answer were:
BBC – Do you agree that from 1995 to the present there has been no statistically-significant global warming
Jones – Yes, but only just. I also calculated the trend for the period 1995 to 2009. This trend (0.12C per decade) is positive, but not significant at the 95% significance level. The positive trend is quite close to the significance level. Achieving statistical significance in scientific terms is much more likely for longer periods, and much less likely for shorter periods.
Slioch, Hans Labohm clearly and unarguably correctly reported what Jones said. And nobody outside of a padded cell can honestly interpret what Jones said as being anything like what you assert.
But please keep it up guys. The sillyness of your posts does more to inform unbiased onlookers of the nature of AGW arguments than anything I could say.
Richard
Bob from the UK says: November 23, 2010 at 1:45 am
The temperature hasn’t risen for around 15 years, and you say that is a meaningless small period.
Take a ten year average of any of the major temperature data sets starting in 1980 (say) and move it along one year at a time until it encompasses 2009. The ten year average represents an attempt to smooth out random variations and quasi-periodic phenomena like ENSO, solar cycles etc. Feel free to increase the averaging period and change the start date to avoid cherry-picking. The resulting plots rise consistently and do not support the statement that “temperature hasn’t risen for 15 years”. Nor does a statement that a temperature rise is not statistically significant at a given confidence level mean that temperature has not risen either.
Richard S Courtney says:
November 23, 2010 at 1:39 pm
Yes, I might have realised that it is pointless trying to explain anything to you.
Slioch:
Thanks for your post at November 23, 2010 at 2:28 pm . Please, please keep doing it.
As I said,
“The sillyness of your posts does more to inform unbiased onlookers of the nature of AGW arguments than anything I could say.”
Richard
Here are several other victims of climate change, according to WWF: http://www.davidjschow.com/theouterlimits/images/painting.jpg
Amonite:
You correctly say:
“Nor does a statement that a temperature rise is not statistically significant at a given confidence level mean that temperature has not risen either.”
But you do not add that the lack of 95% confidence does not indicate that temperature has risen.
Simply, the data is so lacking in statistical significance that it cannot be known if the temperature rose or fell over the last 15 years.
And the discussion was as to whether Hans Labohm was right when he wrote;
“Phil Jones, director of the University of East Anglia’s Climatic Research Unit and one of the main players in Climategate, now acknowledges that there has been no measurable warming since 1995.”
He was right. And the fact that there may have been (n.b. may have been and NOT was) warming over the last 15 years is not relevant.
Please note that I am responding to your post to draw attention to it and to the similar posts from warmers. I do this because those posts clearly demonstrate to unbiased onlookers
(a) the desperation of AGW-supporters to find something wrong in the article by Labohm,
and
(b) the difficulty that AGW-supporters are having in trying to find something wrong in the article.
Richard
It is not accurate to claim that people are now unconcerned about the effects of climate change. The well-organized and well-financed efforts of “skeptics” has worked to obfuscate the issue and hence there has been a weakening of “alarm” and coincident concern. But the problem remains as clearly outlined by the vast majority of scientists who base their assertions on real evidence. What point is served by forestalling remedial actions?
Hugh Pepper:
You ask:
“What point is served by forestalling remedial actions?”
I answer, saving lives.
All the suggested “remedial actions” (i.e. adoption of biofuels, constraining fossil fuel usage, etc.) kill people.
Unless and until there is some evidence that AGW exists to a discernible degree then any suggestion to adopt these “remedial actions” should be opposed. And they will be opposed by all people with any degree of humanity.
Richard
Richard S Courtney says: November 23, 2010 at 4:24 pm
Simply, the data is so lacking in statistical significance that it cannot be known if the temperature rose or fell over the last 15 years… He was right. And the fact that there may have been (n.b. may have been and NOT was) warming over the last 15 years is not relevant.
Hi Richard. Lack of statistical significance does not mean it cannot be known if temperature rose or fell. In this case it means the slope of the rise could be caused by random factors (ie. noise) more than one time in twenty. Thankfully enough references now exist in this thread to allow readers to make a reasonable judgment about what Phil Jones said and what it might mean. Such context is largely missing from the Labohm article and it is hardly an act of desperation to point this out.
I do not know if this analogy will help or hinder the discussion about what the 95% really means. Polls are taken and it will be announced that by polling 1000 people at random, the results are within 3%, 19 times out of 20. So if the result was republicans with 50.0% and democrats with 47.0% what can you say? It would appear that you could conclude that the republicans are ahead 95% of the time, but 5% of the time the democrats are ahead with those numbers.
In terms of the present discussion, if the result was republicans with 50.0% and democrats with 47.3% you may be able to say that you can only be 92% certain the republicans are ahead.
So one could say that Phil Jones implied there may be an 8% chance (or some other small number above 5%) that the global temperatures actually cooled between 1995 and 2009. Does this sound about right?
Werner Brozek says:
November 23, 2010 at 8:33 pm
polling 1000 people at random, the results are within 3%, 19 times out of 20.
I think more like 13 times out of 20…
Forget about the 95% confidence interval. The main question is whether the warming has been significant compared to the past.
Most here will agree that it is in the region of about 0,7 degrees Celsius over the last 100 years. Now, can you feel it? Can you bring me a calibration certificate of a thermometer that is 100 years old? More importantly, how does this warming compare to the past? Compared to the Medeviel Warm Period (MWP) for example, – 1000 years ago, when Greenland was really green – it is not so bigl!!. See here:
http://wattsupwiththat.com/2009/12/09/hockey-stick-observed-in-noaa-ice-core-data/
Take some time to absorb the information given in those graphs. From this point onwards, after studying those graphs, I became skeptical of global warming as such being a problem….namely, compared to what happened in the past (before the industrial revolution) modern warming is just,…dinky. That’s what it is.
I actually hope that modern warming lasts as I think global warming is good for greenery. Have you ever seen a forrest grow in the cold?
But I hear you people are currently having the cooler weather and snow in the USA.
I fear global cooling will be the future, not the past.
Dear Leif
Thanks, I understand that it would be in Dr. Jim’s interest to parallel the post 1979 satellite temperature data. However, to alter temperature data pre 1979 and as far back as 1880 is to my mind, rather risky business.
Werner Brozek says:
November 23, 2010 at 8:33 pm
“So one could say that Phil Jones implied there may be an 8% chance (or some other small number above 5%) that the global temperatures actually cooled between 1995 and 2009. Does this sound about right?”
No. That is not what it means.
There is no doubt that the temperature/time series show that warming has occurred since 1995. I gave the data to show that above, using the five year average temperatures anomalies to smooth annual variations, here:
November 22, 2010 at 11:09 am, and repeat it:
Five year period……UAH………RSS………..HADCRUT…..NASA GISS
1993-1997………….+0.004C…+0.044C……..0.208C………..0.282C
2005-2009………..+0.238C…+0.263C………0.414C…………0.546C
Together this data shows that the average increase over that twelve year period from the four series is about 0.23C. Jones was referring to the data from the HADCRUT series, with which he is concerned.
The question of 95% statistical significance is concerned with the reason for the rise: can it be attributed to the long-term trend on the one hand, or just to annual variation of the sort that would be occurring even if there was no long-term warming trend (see
Slioch says: November 23, 2010 at 12:10 pm above).
So, in your words that would mean, “Phil Jones implied there may be an 8% chance (or some other small number above 5%) that the warming between 1995 and 2009 was caused by annual variations and not the long-term trend of global warming.”
Werner Brozek says:
November 23, 2010 at 8:33 pm
The following might (or might not!) make the above clearer.
Here is the graph from HADCRUT (the temperature series with which Jones is concerned) showing i) annual temperature anomalies from 1995 to 2009 inclusive (red) ii) the best fit linear trend for those 15 years (green) and iii) the best fit linear trend from 1975, when the present period of global warming got under way (blue) to 2009:
http://www.woodfortrees.org/plot/hadcrut3gl/from:1995/every:12/to:2010/plot/hadcrut3gl/from:1995/to:2010/trend/plot/hadcrut3gl/from:1975/to:2010/trend
that graph puts the information Jones was concerned with in the context of global temperature changes over the last few decades. The data that Jones was asked about was simply this:
http://www.woodfortrees.org/plot/hadcrut3gl/from:1995/to:2010/every:12
Note the large amount of annual variation. It is that variation that means that there is a chance of slightly more than 5% that this graph could have been generated, even if the long-term temperature trend was zero. That is not a surprising conclusion. With a relatively large amount of annual variation, even if the overall long-term trend WAS actually zero (ie no increase or decrease in temperature) then periods of fifteen years with the characteristics of the above graph would still occur occasionally. Thus, when they do so appear, there is that small chance (c.5%) that it could have been generated with a zero long-term trend, and it was that which Jones acknowledged.
Slioch:
Posting idiocy more than once does not change it into sense.
Anybody can calculate a trend from a series of random numbers. But the computed trend indicates nothing because it can be shown to have no statistical significance.
You have calculated trends from a series of mean global temperature estimates. But those trends have no statistical significance: even Phil Jones admits that. So your calculated trends indicate nothing.
You may begin to understand the matter if you try repeatedly saying this to yourself out loud;
“The calculated trends are meaningless because they have no statistical significance”.
Richard
Richard S Courtney says:
November 24, 2010 at 5:24 am
“those trends have no statistical significance”
If you had said “those trends do not have statistical significance at the 95% level” you would have been correct for the 1995-2010 data and incorrect for the 1975-2010 data. That is why, from the former, it is concluded that there is a small chance (slightly more than 5%) that the 1995-2010 could have been generated even if the long-term trend was zero (and virtually no chance that 1975-2010 data could be so construed).
If you wish to put forward some reasoned objection to that, then by all means do so. Writing insults and silly comments is no substitute for that.
slioch
There is a message here for you.
http://www.heartland.org/bin/media/newyork09/PowerPoint/Don_Easterbrook.ppt#498,35,Slide 35
matt v. says:
November 24, 2010 at 7:43 am
There is a message here for you.
http://www.heartland.org/bin/%5B…]
The message is muddled and has problems with the solar stuff. Solar activity is now where it was 100 years ago, but temps are not. See, e.g. slide 17.
Leif
The message is slide #35.
With carbon tax dollars and those “Department of Climate Control” jobs at stake, there is no way that GISS will display a downturn in temperatures. Imagine the consequences if it was shown that there is a dowturn in temperatures whilst coal fired power stations are coming on line in China like Big Macs
Slioch:
I have posted no insults and silly comments: you are projecting.
If you think less than 95% confidence indicates something meaningful then please
(1) explain what degree of low confidence you think would indicate meaninglessness
and
(2) explain why you think that.
As for myself, I can only support the generally accepted scientific convention that an indication which does not have at least 95% confidence has such great uncertainty that it is meaningless.
Richard
“Slioch says:
November 24, 2010 at 1:45 am
2005 to 2009 from Hadcrut was 0.414 C!”
How does this 5 year number jibe with Jone’s quote about the 8 years from 2002 to 2009?:
“C – Do you agree that from January 2002 to the present there has been statistically significant global cooling?
No. This period is even shorter than 1995-2009. The trend this time is negative (-0.12C per decade), but this trend is not statistically significant. “
Even 95% confidence is garbage. Given the large number of possible sampling patterns and the universal effects of confirmation bias in selection, 3 or 4 9s should be the standard. 1 chance in 20 of error is grotesquely high, except in psychology or other pretend sciences.
Werner Brozek says:
November 24, 2010 at 5:12 pm
asked, “2005 to 2009 from Hadcrut was 0.414 C!”
How does this 5 year number jibe with Jone’s quote about the 8 years from 2002 to 2009?:”
I’m not sure what you mean.
The five year 2005-2009 average I gave is just that: the average temperature anomaly over those five years (ie it is the average temperature recorded every day (max and min) at every recording station in the HADCRUT ensemble for five years from 2005 to 2009 compared with the similar temperature obtained from the average from 1961 to 1990. The 0.414C figure tells you that the 2005-2009 average was 0.414C warmer than the 1961-1990 figure, that is all. It has no relevance to Jone’s statement.
BTW the five year average centred on 2002 is 0.413C – ie no change in the five year averages between 2002 and 2007.
You can check the figures yourself here:
http://www.cru.uea.ac.uk/cru/info/warming/
and click on “comma separated values” to get:
http://www.cru.uea.ac.uk/cru/info/warming/gtc.csv
the first column gives the annual averages.
Incidentally, I’ve noticed I gave the wrong wordfortrees urls earlier. They should have been:
http://www.woodfortrees.org/plot/hadcrut3gl/from:1995/to:2010/mean:12/plot/hadcrut3gl/from:1995/to:2010/trend/plot/hadcrut3gl/from:1975/to:2010/trend
and
http://www.woodfortrees.org/plot/hadcrut3gl/from:1995/to:2010/mean:12
sorry about that.
Brian H:
To be perfectly clear, I write to say that I agree with you when you write;
“Even 95% confidence is garbage. Given the large number of possible sampling patterns and the universal effects of confirmation bias in selection, 3 or 4 9s should be the standard. 1 chance in 20 of error is grotesquely high, except in psychology or other pretend sciences.”
The discussion has been about 95% confidence (i.e. ~2 S.D. confidence) because that is what Jones was asked about.
Richard
Richard S Courtney says:
November 23, 2010 at 1:39 pm
RR Kampen, you have disputed my observation by saying;
“The short version of this answer might read: wait just another year. Perhaps this year will get the temperature rise in the 95% confidence level already.”
LOL. Of course it “might” or it might not change this year or some future year.
Actually, I knew it does this year. But – did you not check this?
You should do a small course in statistics, maybe. Or Labohm should. E.g. to find out that a somewhat lower statistical significance of a trend found in data does NOT mean the trend doesn’t exist.
In the context of this discussion about the period of 1995-2009 inclusive the reality is thus:
– There is a measurable upward trend and it is measured at +0.12 K/decade;
– On the (rather small!) dataset in consideration the chance that this trend could be attributed to coincidence (or ‘noise’) is slightly, but just slightly, over 5%.
2010 has reinforced the significance level of said trend, that is also a fraction stronger because this was a very warm year.
This is clear enough. I will not return to this subject.
RR Kampen:
Thank you for the laugh you gave me by your saying to me:
“You should do a small course in statistics, maybe. Or Labohm should. E.g. to find out that a somewhat lower statistical significance of a trend found in data does NOT mean the trend doesn’t exist.”
Of course it doesn’t! Indeed, I said as such above.
But you and Slioch both need to learn that it DOES mean you cannot know if there is or is not a trend which is either positive or negative. And that means Labohm’s statement is right.
And you tell me that I need to do a course on statistics! I laughed so much I had tears from my eyes.
Richard
Slioch says:
November 25, 2010 at 1:14 am
“BTW the five year average centred on 2002 is 0.413C – ie no change in the five year averages between 2002 and 2007.”
Thank you very much! That clears it up. Now as for your statement above, you are in effect saying there was no change for the last 10 years from 2000 to 2009. Right? The IPCC did not predict this.
Richard S Courtney says:
November 25, 2010 at 10:54 am
[..]
But you and Slioch both need to learn that it DOES mean you cannot know if there is or is not a trend which is either positive or negative.
There is a trend.
It is measurable.
It is positive at +0.12 K/decade.
And it’s chances of being coincidental are slightly over 5%. In other words, there is a close to 95% chance the trend is NOT coincidental, but is a REAL trend (which, of course, on a 10% confidence level is quite significant).
This science being empirical there is no mathematical knowing involved, of course. That’s why significance levels are used just about universally in all empirical sciences.
Werner Brozek says:
November 25, 2010 at 5:11 pm
claimed, “you are in effect saying there was no change for the last 10 years from 2000 to 2009. ”
No I am not, and nor does that follow from that data. The figures I gave were the five year average global temperature anomalies from HADCRUT centred on 2002 and 2007. They therefore refer to those two years, not 2000 and 2009.
It is not yet possible to give the five year figure centred on 2009 for (I hope) an obvious reason. Comparing temperatures of individual years has little significance because of the large amount of annual variation (noise), but, for interest, 2000 was 0.271C and 2009 was 0.438C. Another way of looking at the period 2000 to 2009 is to find the best fit linear curve to the annual data, shown here:
http://www.woodfortrees.org/plot/hadcrut3gl/from:2000/to:2010/plot/hadcrut3gl/from:2000/to:2010/trend
As you can see, the trend is almost flat (+0.03degC/decade), but, as I hope is now clear, trends based on just 10 years data have less significance than trends based on 15 years (discussed above). Or, in other words, a trend derived from just 10 years data is more the result of noise rather than long-term trend than is a trend based on 15 years data.
Here is a job for you. See how many periods of ten years you can find in the HADRUT data since 1975 that have a more or less flat or even declining temperature trend. Here is the graph. To get you started I have found one for you:
http://www.woodfortrees.org/plot/hadcrut3gl/from:1975/plot/hadcrut3gl/from:1975/trend/plot/hadcrut3gl/from:1988/to:1997/trend
Let me know how you get on.
“The IPCC did not predict this.”
Indeed they didn’t! The IPCC made NO prediction for the period 2000 to 2009. They didn’t predict the snow that greeted me when I woke this morning either, or the fact that it rained on my birthday.
Slioch and RR Kampen:
I write to ask why you persist.
Nobody is being taken in by the nonsense you are posting. Few if any casual readers of this thread will have bothered to read all the way down the thread to here. And nobody who understands elementary statistics will think other than that you are deliberately trying to mislead or that you are ignorant idiots.
So, why are you posting your nonsense? I really do want to know because I would like to gain some understanding of the strange mindset of AGW-promoters which seems incomprehensible.
Richard
Richard S Courtney says:
November 26, 2010 at 4:09 am
Slioch and RR Kampen:
I write to ask why you persist.
I have the comparable interest: I research what drives otherwise good scientists to throw overboard all scientific égards and prudence when the subject is climate change. E.g. you prove a non-understanding of even most fundamental concepts in statistics like ‘trend’, ‘measurability’ and ‘significance’. It actually reminds me of a certain perseverence in misstating the meaning of the triple point of a certain substance.
Generally I’m trying to find out why people move heaven and earth to ‘prove’ the warming of past century can be attributed to just about anything except the most trivial, most probable cause: the strong concentration increase of one of the most important GHG’s. I can understand why the energy industry might have a stake in clouding this reality, but I cannot understand why independent people like mr. Watts himself would put so much hard work in trying this.
Finally, even if no-one reads it, a contribution stating some facts clearly can always be referenced later, even if only for an ‘I told you so’.
RR Kampen says:
November 26, 2010 at 5:39 am
“I can understand why the energy industry might have a stake in clouding this reality”
Yes, indeed, and no more so than the coal industry, since coal is the most carbon intensive of fuels.
But maybe that is the source of Richard S Courtney’s particular “strange mindset” in this matter since, according an entry in Sourcewatch, (now apparently removed), Courtney was once “a Technical Editor for CoalTrans International (journal of the international coal trading industry) … and … In the early 1990s Courtney was a Senior Material Scientist of the National Coal Board (also known as British Coal) and a Science and Technology spokesman of the British Association of Colliery Management.”
It must be hard if you have spent much of your earlier life promoting the use of a particular substance to then be told later on that you have been abetting the destruction of the world. One way of dealing with such a misfortune might be to refer to anything that relates to this new way of thinking as “nonsense”, however nonsensical that itself may be.
Responding to Kampen’s argumentum ad ignorantium, which assumes that CO2 has to be the cause of global warming because he can’t think of another cause, Slioch makes an ad hominem attack on Richard Courtney, assuming that his background must cause him to be hopelessly biased, instead of accepting that such experience allows him to speak more knowledgeably.
Further confusion in that wacky argument comes from the fact that CO2 has never been shown to be anything but harmless and beneficial. Because coal power is by far the cheapest power, its use allows billions of people the opportunity to lift themselves out of poverty. To greens, this is a bad thing.
Finally, the scolding finger of the holier-than-thou eco-contingent is invariably pointed at the West, while giving China and other countries a free pass. Rank hypocrisy, no?
Slioch I hear ya. I have nothing but kind words for those developers along the Columbia Gorge who promoted the many windfarms there, now iced up and useless in freezing rain.
Smokey says:
November 26, 2010 at 9:36 am
“ad hominem”? Really? I was careful only to use such descriptions of Richard as he had used of me: namely, writing “nonsense”and having a “strange mindset” and to suggest an explanation for those aspects of his behaviour as he had asked of me. I don’t think Richard could legitimately complain of that. And you should not so so on his behalf.
Slioch:
I do not criticise you for publicising some of my past activities. On the contrary, I am proud of the matters you mention but too modest to broadcast them myself, so I thank you for telling others of them.
But I am disapointed that you chose not to answer my question. Of course, you are entitled to ignore it as you have. But I really am interested to know why you and other AGW-promoters so often insist on presenting absolute nonsense of the kind you have above. I fail to understand why you do it when it can only damage your cause.
And when it is pointed out both that it is nonsense and why it is nonsense you – and your fellows – often repeat it, as you have done above. This proclaims that you know what you are saying is not an honest mistake of the kind we all make from time to time, and it demonstrates that you are doing it deliberately. This, too, can only harm your cause.
I am genuinely puzzled by it. The behaviour makes no sense to me.
So, I really would like to know why you and other AGW-promoters do it so often.
Richard
Slioch says:
November 26, 2010 at 1:32 am
“The figures I gave were the five year average global temperature anomalies from HADCRUT centred on 2002 and 2007. They therefore refer to those two years, not 2000 and 2009.”
Correct me if I am wrong, but a five year average global temperature anomaly from HADCRUT centred on 2002 goes from 2000 to 2004, right? And a five year average global temperature anomaly from HADCRUT centred on 2007 goes from 2005 to 2009, right? So could I not say if the two anomalies are the same, then there was no change for 10 years? Furthermore, if “They therefore refer to those two years” then 2002 was 0.465 and 2007 was 0.402, so by just referring to those two years, the slope is negative.
You also say “As you can see, the trend is almost flat (+0.03degC/decade), but, as I hope is now clear,”. For argument sake, I will accept this as true. That means a change of 0.3 deg C per century. At this rate it will take a long, long time to reach the supposedly bad 2 degree mark. But as you correctly point out, it is only a decade. So do you not think it would be wise to see if this trend continues for a few more years before taking drastic action that may never be necessary?
“Indeed they didn’t! The IPCC made NO prediction for the period 2000 to 2009.” That is not what I had in mind. I was thinking of their scenarios that the increase would be from 2.4 to 5.3 per century and certainly not the 0.3 per century that happened in the last decade.
I know that 2010 is not over yet, but taking the value of 0.499 to the end of October for 2010, the five year average global temperature anomaly from HADCRUT centred on 2003 gives 0.4554, but the five year average global temperature anomaly from HADCRUT centred on 2008 gives 0.4188 so 2001 to 2010 definitely gives a negative slope, correct?
@Werner;
The reason the Warmists struggle and obfuscate so desperately against accepting, or even discussing, the recent negative slope is that it calls into question the omnipotence of the Magic Thermostat. Just as the failure of the tree ring proxies post 1960 threw doubt on the validity of all prior graphs etc. based on them.
Once you kick out a foundation stone, the walls begin to cave in.
It sure is fun to watch!
Werner Brozek says:
November 26, 2010 at 5:50 pm
Well, you really seem to be making heavy weather of this, but to answer your questions:
“a five year average global temperature anomaly from HADCRUT centred on 2002 goes from 2000 to 2004, right?” Correct
“And a five year average global temperature anomaly from HADCRUT centred on 2007 goes from 2005 to 2009, right?” Correct
“So could I not say if the two anomalies are the same, then there was no change for 10 years?” Well, you could say it, but if you did you would be wrong.
“Furthermore, if “They therefore refer to those two years” then 2002 was 0.465 and 2007 was 0.402, so by just referring to those two years, the slope is negative.”
Yes, but that just illustrates how misleading it is to draw conclusions to single year figures – no conclusion you reach by so doing is significant. This becomes obvious when you choose a different starting year: 2000, for example, has an anomaly of 0.271C, so if you had started with that year you would have concluded that the slope was strongly positive, which would have been just as misleading. Choosing particular years to illustrate the point you are wanting to show is called “cherry picking”. It has been used by people like Bob Carter of Australia who started the “It’s been cooling since 1998 canard”. Misinformers like Bob Carter know that many people don’t understand these matters very well and are easily fooled – particularly if they want to believe that the Earth isn’t warming.
That is why I used the five year average anomalies: averaging over five years smooths out most, but not all, of the annual variation. Ideally one would use a much longer time span, but, of course, if you do that it means you cannot say anything about recent events: so the method used has to be a compromise. Phil Jones statement about the period 1995-2009 inclusive was saying much the same – that even from that fifteen year period it was not (quite) yet possible to be 95% confident that there was a long-term warming trend, since there was a small chance that the records could have been caused just by annual variation rather than long-term warming.
“the trend is almost flat (+0.03degC/decade), but, as I hope is now clear,”. For argument sake, I will accept this as true. That means a change of 0.3 deg C per century.”
No it does not!! That is the source of your confusion about the IPCC. A trend measured over a short time period of one decade does NOT imply or mean that the trend will continue for a century. Nor does a forecast of an increase of “from 2.4 to 5.3 per century” in any way imply that there should be an increase of 0.24 to 0.53C per decade, or that a measured increase of 0.03C/decade is in any way inconsistent with that.
I asked to do some work previously – to look at the HADCRUT3 graph since 1975 to find how many flat periods of about 10 years you could find in an otherwise obviously rising trend. Had you bothered to do so, you would had found about three, and if you had then bothered t think about the meaning of that you would not now be asking these absurd questions.
Finally, you refer to the period from 2003 to 2008, using five year averages. Your arithmetic is correct – the last five years has been cooler than the five years you chose centred on 2003. What you have shown is that for the five year period centred on 2006, there was a decrease in global five year average temperatures.
Now, I’ve just spent five minutes – that is all it took – investigating the entire HADCRUT3 series from 1975 to see if there were any other years besides 2006 when that occurred. There are six other years: they are 2005, 1992, 1991, 1984, 1983 and 1982. The point? Even with an overall rising trend, if there is a large amount of annual variability, then periods of falling temperature are not only to be expected, they are INEVITABLE. That is what annual variability inevitably produces.
RE: Slioch says:
November 28, 2010 at 2:36 am
Indeed. Hence, it also stands that an overall rising trend be it 30 years or 75 years, etc. is to be expected when viewing climatic state in geologic time. Viewing climate properly. A warming climate over a brief span of 30, 75, 150 years is to be expected, many of them in fact, in relation to a span of 3,000 years or 10,000 years, etc. History, data, provides proof of that. The trend over a century does not imply, by necessity, the trend will continue for another hundred years. Again, history and data substantiate that fact. Statistically it is possible, in many ways, to state the warming of the past 100 – 150 years was expected. An expected event occurring regardless of man’s presence or the industrial age.
The only thing truly unnatural about the warming during the last century was the reaction of some humans to it. They need not fear. It will turn cold, very cold, soon enough.
An interesting point, but I think you confuse two different things. My contributions to this thread have been concerned with how one recognises a long-term trend from a past temperature/time series. I have not been concerned (here) with the cause(s) of the long-term trend nor whether they are expected to continue into the future. Nothing that I have said herein would be different were the causes of any warming in the last few decades been caused by heat rays from the planet Zog.
Nor is the truth of the paragraph that you reproduce dependent upon the data referring to temperature and time: it is a characteristic of any set of data which is based upon a long-term linear trend of slope of N per unit time, length, or some other measure, upon which is superimposed variation of about 10N per unit time, length etc.
It does not follow that because we can identify a temperature/time series with those characteristics in recent decades that therefore similar characteristics pertain to much longer time scales – it seems to me a complete non-sequitur.
You also seem to believe that the “periods of falling temperature” in my above discussion were significant of a change in long-term trend: the whole point is that that is decidedly NOT (necessarily) the case. What I explained above is that, in a series of data that can be represented by a constant linear upward long-term trend of increasing temperature, upon which is imposed large annual variations, then there will inevitably exist periods of falling temperatures lasting for several years: that is simply a mathematical fact. Identifying such periods of falling temperature as signifying a change in long-term trend, therefore, is not justified.
Thank you for your comments Slioch. It was always my understanding that the slope of the best fit line gives the trend between the two years in question. I had never used this five year averaging until you brought it up. You say “Even with an overall rising trend, if there is a large amount of annual variability, then periods of falling temperature are not only to be expected, they are INEVITABLE.”
Have you told this to Phil Jones and Kevin Trenberth? They seemed EXTREMELY troubled by these sorts of things that you just take for granted. Around October 2009, Kevin Trenberth said, “The fact is that we can’t account for the lack of warming at the moment and it is a travesty that we can’t.”
Phil Jones, July 5, 2005: “The scientific community would come down on me in no uncertain terms if I said the world had cooled from 1998. Okay it has but it is only seven years of data and it isn’t statistically significant.”
What could Phil Jones say today about what happened since 1998? It is certainly NOT that we are in a crises and have to act within a year or two to avoid a catastrophe.
(P.S. Thank you for your comment Brian.)
Werner Brozek says:
November 28, 2010 at 3:06 pm
“slope of the best fit line gives the trend between the two years in question”
It gives the best fit to all the data points between and including the two years in question.
Trenberth’s statement is concerned with the REASONS for the large annual variations in average global temperatures that are observed – ie what causes them? – where does the heat go?. My contributions above were concerned with the EFFECT of those variations upon the temperature/time series. Those are two separate issues.
Phil Jones is a fine scientist but he is clearly not the most media-savvy of commentators and sometimes makes statements that the misinformers and charlatans can distort. There were two facts with respect to 1998 when Jones made this statement: i) 1998 was the year with the highest global average temperature according to the HADCRUT series for which he is involved, hence in that respect any year thereafter was cooler than 1998, and ii) there was (and is) no statistically significant evidence that the long-term trend of rising global temperatures had changed. Trying to get those two points across in a way accessible to the general public, in the face of hostile distortions by misinformers, was a difficult task – and he didn’t do very well.
It is that long-term trend, and projections that it will markedly steepen, that is the cause for concern and the imperative to act. 1998 is an irrelevance in that respect.
Slioch:
At November 28, 2010 at 11:27 am you assert:
“My contributions to this thread have been concerned with how one recognises a long-term trend from a past temperature/time series.”
No!
Your “contributions to this thread” have been a dispute of the accurate statement by Hans Labohm that said,
““Phil Jones, director of the University of East Anglia’s Climatic Research Unit and one of the main players in Climategate, now acknowledges that there has been no measurable warming since 1995.”
Indeed, your first post to this thread was at November 22, 2010 at 11:09 am and it began by saying:
“Dr. Hans Labohm claims, “Phil Jones, director of the University of East Anglia’s Climatic Research Unit and one of the main players in Climategate, now acknowledges that there has been no measurable warming since 1995.”
Nonsense. Phil Jones has stated nothing of the kind and nor is it true.
If Dr Labohm either doesn’t understand what Phil Jones stated about warming since 1995 (with reference to the HADCRU figures) or is deliberately trying to mislead his readers. ….”
In the subsequent debate you were repeatedly shown to be wrong in that Labohm’s statement is correct and, therefore, your implication that Labohm “is deliberately trying to mislead his readers” was an unfounded smear.
It is extremely disingenuous for you to now claim “My contributions to this thread have been concerned with how one recognises a long-term trend from a past temperature/time series.”
Instead of pretending that falsehood you should be offering an apology to Hans Labohm.
Richard
Henry@Slioch Re. Your Contribution
I am with Richard. You owe all of us an apology.
Unfortunately, I think you are one of those that will never apologise.
Not even when the truth is staring right at you and when the snow is heaping up at your front door, higher than it ever was before.
There are none so blind as those who do not want to see.
http://www.letterdash.com/HenryP/more-carbon-dioxide-is-ok-ok
Richard Courtney and HenryP
I’ve explained in some detail why Dr. Hans Labohm’s statement was wrong and I do not intend to go over it all again. My postings on the issue, and those of R R Kampen, explain the situation clearly and comprehensively enough, and that will have to do.
eehhhh…
Not only never an apology,
also always wanting to have the last word….
Apologize Slioch.
“Slioch says:
November 29, 2010 at 1:05 am
ii) there was (and is) no statistically significant evidence that the long-term trend of rising global temperatures had changed.”
For the moment, let us ignore 1995 to 2009. And also let us ignore the strong El Nino of 1998. Would you agree that if we ignore all El Ninos and La Ninas between 1998 and 2010, that there was essentially NO CHANGE for the last 13 years?
An analogy for the present situation would be if someone was diagnosed with cancer in 1998 and the doctor said a very risky amputation was needed. But 13 years went by and the cancer seems to have gone into remission. What should one do? I believe it would be prudent to wait a few years to see if the remission continues. At this point, you talk about “projections that it will markedly steepen”. Other talk of 20 years of cooling. Who is right? No one knows for sure if that “long-term trend” will continue. What have we got to lose by doing nothing for a few years except for gathering accurate data to see what trend develops next?
Warmists never apologize. It would invalidate their presumptive infallibility.
Brian H says:
November 29, 2010 at 6:46 pm
claims, “Warmists never apologize.”
Yet another false statement. I, for example, apologised a few days ago when I made a comment based upon a misreading of what someone had said. See:
http://www.guardian.co.uk/environment/2010/nov/26/global-warming-met-office?showallcomments=true#comment-fold
“Aslioch
26 November 2010 5:22PM
Random1234
26 November 2010 4:48PM
Yes, certainly the 1998 spike was due to a great burp of heat from the Pacific, otherwise known as an El Nino.
I had thought you were referring to the long-term trend, but re-reading your previous post see that you were indeed referring just to the 1998 El Nino. Sorry about that.”
If I make a mistake, I apologise. Since there is no mistake in my posts in this thread, the question does not legitimately arise, despite the nonsensical Richard Courtney brickbats directed against them.
(Werner – I’ll answer you later – other things to do now)
Slioch:
You say:
“Since there is no mistake in my posts in this thread, the question does not legitimately arise, despite the nonsensical Richard Courtney brickbats directed against them.”
I made no “nonsensical Richard Courtney brickbats”: I merely explained (repeatedly) why your assertion that a calculated trend has meaning is plain wrong when the trend has less than 95% confidence. So, in addition to the much more important apology that you owe to Hans Labohm, you owe an apology to me, too.
Apologise gracefully and you may save some face.
Richard
Richard S Courtney says:
November 30, 2010 at 1:19 am
Richard, a word of advice: stick to the subject of climate change.
Your comprehensive misunderstandings in that regard are bad enough, but when you start demanding apologies from someone who doesn’t agree with you, you start to look vindictive.
Slioch:
Very poor. Must do better.
Richard