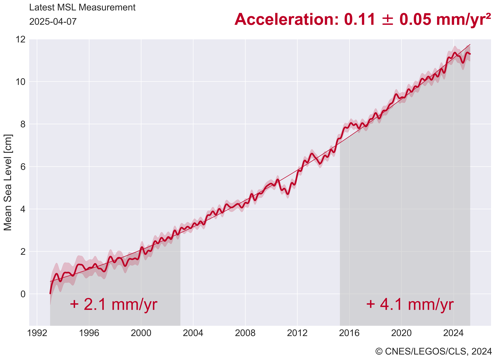
This is interesting. It appears that a “pause” has developed in global sea levels. For two years, since July 2015, there has been no sustained increase in global sea level, in fact, it appears to have actually fallen a bit. This graph, provided by NASA’s Global Climate Change website, tells the story:

A zoom of the area of interest, two years prior to the most recent data point.

Source for both graphs: https://climate.nasa.gov/vital-signs/sea-level/
The satellite derived sea level data is also available here: ftp://podaac.jpl.nasa.gov/allData/merged_alt/L2/TP_J1_OSTM/global_mean_sea_level/GMSL_TPJAOS_V4_199209_201708.txt
NASA says on that website:
Sea level rise is caused primarily by two factors related to global warming: the added water from melting ice sheets and glaciers and the expansion of sea water as it warms. The first graph tracks the change in sea level since 1993 as observed by satellites.
Hmmm, I think they left something out of that description.
The other source for sea level data, at the University of Colorado, also shows a pause, though they have not yet updated their data for 2017:

What I found most interesting on the UC sea level page was this graph, showing the correlation of El Niño Southern Oscillation (ENSO) and global sea level. [Readers] may recall that in 2015, there was a massive spike of an El Niño event:

The correlation between ENSO and sea level seems strong.
Note this image from a NASA Visualization Video, which shows water piling up in the Western Pacific over the past 22 years. Wind pattern shifts are a signature of ENSO events, and they push water westward where it piles up.

Here is another projection of the same data, showing that water has been piling up in the Western Pacific:

I wonder what the rate of sea level rise would look like is we masked out El Nino events? I’m guessing it would be far, far, less than what is being claimed as “global”.
Anthony
Stranger and stranger.
“NASA Pinpoints Cause of Earth’s Recent Record Carbon Dioxide Spike”
https://www.jpl.nasa.gov/news/news.php?release=2017-267&rn=news.xml&rst=6973
But of course it will all be explained away by this:
“World’s first “negative emission” power plant turns CO2 into stone”
http://www.climeworks.com/wp-content/uploads/2017/10/PR-Climeworks-CarbFix-Carbon-Removal-1.pdf
From the climeworks article:… “The pure CO2 gas is sold to customers …”
They have a process to remove CO2 from the atmosphere, and then they sell the same CO2 to the public. Once governments control access to Carbon Dioxide, all life is beholden. And if one government can control CO2 access by another government there will be conflict.
I don’t get it.
Why would we want to irreversibly sequester Oxygen since there is approximately 2.5 times the amount of O 2 versus C, on a mass basis in CO 2.
Not convinced we want to sequester C either.
Typically the amount of energy required to sequester CO 2 requires 30% more energy consumption than normally required to generate electricity.
I worked on the design of a successful device to remove the 0.4% CO 2 from the atmosphere, the technology does exist at least on a small scale. The problem is the process requires a lot of energy and is uneconomic unless coupled with other processes and waste heat energy is available.
The other big energy hog is the cost of compression required to send the CO 2 into the sequestration site.
Economics never seems to be considered.
I think you will find that is 0.04%
Agree.
Auto
Sequestering CO2 is a waste of effort and money. Just another scam like carbon offset trading and carbon taxes. My 2 cents worth.
Not sure of NASA’s graph.
Around here the sea level rise s calculated at 1.7mm per year. give or take.
Cheers
Roger
http://www.thedemiseofchristchurch.com
“1.7mm per year. give or take.”
Ocean floor topology is important. I haven’t done the math myself, but:
– consider the ocean as shaped like a soup plate. Deep in the middle, but thin on the edge.
– As you warm the soup the deep part expands more than the thin outer edge.
– And a crown forms as the center lifts more than the edges.
For a soup plate its the surface tension of soup that keeps the edge from rising as fast as the center.
For the ocean, I don’t know what it is, but it makes a big difference if you use tidal gauges to measure the sea level rise at the coast line, or satellites to measure it in the deep ocean.
Thus, NASA’s 3.4 mm/year rise in the deep ocean and your shoreline rise of 1.7 mm/year aren’t contradictory.
Greg, presumably that “crowning” is caused by gravity, and due to the difference in density between water and rock.
HotScot –
Off topic perhaps but very, very interesting. Anthony has moved on so it may be too late to draw attention to this but I am really interested in the NASA article explaining the short term doubling of the carbon dioxide increase. If he’s still listening I’d like to know what Ferdinand Englebeen thinks of it. If NASA is saying that variation in natural processes can be of such magnitude as to mask anthropogenic emissions over a short period, what price their attribution via the ‘calculation of mass balance’ argument? Next you’ll be revealing that NASA has given Murry Salby a job!
mothcatcher
I thought it might be of interest, but I’m not clever enough to draw any conclusions or even speculate on it.
“Satellite” indications show 3.4 mm sea level rise. Which does not correspond to tide gauges. Perhaps NASA has a minor little problem with the satellite measurements?
Yes it does. See my guest post here on SLR and closure. Plus, Jason 2 has been replaced by Jason 3 and there coild be an instrument calibration problem.
It really does sound a lot like the sattelite could have an orbital decay rate of arounf 2-4mm per year
@Rud Istvan You should add a link to your guest post on SLR and closure.
Mm1, no need. Look it up in the search WUWT bar at the head of the post, click, and you are there.
I did not trust a satellite SLR measurement when it showed 3.4 mm/yr. Why should I trust it now when it says zero?
Looks like are processing more noise than data. The tidal gauge folks are thinking in terms of 60 years of reasonably solid observational data before accepting a station record as useful. Trying to find meaningful trends in two years of satellite observations seems a bit optimistic.
But what the hell. By the standards of “climate science” this is probably valid SCIENCE. When are they summoning the news conference to announce the demise of the SEA LEVEL RISE THREAT?
That rate of rise doesn’t make sense. It’s either short term noise or some other problem.
Ristvan did say
but it may be that someone can’t read their slide rule or its batteries have gone flat
:-).
The average annual rate of sea level rise in Auckland, NZ over
the last 111 years (1905 to 2016) according to its tide gauge, is c. 1.3 to 1.5mm
pa. Over the last 66 years, from 1950 to 2016, it’s been c. 0.6 mm pa.
Figures from Fort Denison’s tide gauge (Sydney, Australia) are c. 0.6 mm pa
and from Freemantle’s gauge (Western Australia) are similar. That’s across
about 60 degrees of longitude at about -34 degrees S latitude (-36.8 at Auckland
to -32.5 Freemantle). That’s about one sixth of the Earth’s diameter at that latitude.
Anything like 3.4mm would mean “surf’s up in a big way. But it’s not.
So 3.4mm pa makes no sense at all. (Figures taken from Permanent Service
for Mean Sea Level site.) I don’t care about the slosh from one end of Lake
Ontario to the other; that’s the Northern Hemisphere’s problem.
A good example, as most of Australia is geologically stable, so tide gauges there should give something close to actual sea level rise.
Classical statistics uses a minimum of 32 samples for mean, median, mode, etc. Some say the value is better at 50. That is not trend analysis, though. If a strong trend is established (high correlation coefficient), it certainly does not take 32 data points, much less 60. There are research papers on infrared mineralogical research using 6 data points to establish a correlation trend fit.
Australia’s CSIRO- http://www.cmar.csiro.au/sealevel/sl_hist_few_hundred.html
“We have used a combination of historical tide-gauge data and satellite-altimeter data to estimate global averaged sea level change from 1880 to 2014. During this period, global-averaged sea level rose about 23 cm, with an average rate of rise of about 1.6 mm/yr over the 20th Century.”
However Port Arthur shows 0.85mm/yr average-
“One of the oldest tide gauge benchmarks in the world is at Port Arthur in south-east Tasmania. When combined with historical tide gauge data (found in the London and Australian archives) and recent sea level observations, it shows that relative sea level has risen by 13.5 cm from 1841 to 2000.”
So it would appear from geologically stable Oz the SH has less seal level rise than the NH most recently looking at the two figures.
However the geology of Hallett Cove in South Australia can show an average rise of 16.25mm/yr for 8000 years or 130M between 15000 and 7000 years ago. When I understood that I realised anyone claiming they could detect an anthropogenic CO2 global warming signal from one nineteenth of natural warming occurring over eight millennia was either delusional, technically illiterate, deliberately lying to me or some combination of all three. Of course my assumption in reaching that logical conclusion is that SLR is the one true temperature proxy to rule them all in the absence of instrumental temperature data-
https://www.ncdc.noaa.gov/news/what-are-proxy-data
How do they calculate 3.4 mm per year when the satellites have roughly a 20mm error on flat non moving land. Never figured that out.
Yes indeed. How does a satellite doing decaying circular orbits around a pear shaped geoid with bumps on, measure something that is in considerable movement every second relative to that geoid.
The noise would be so much greater than the signal.
It’s just a fiddle.
At our old sea-front home near a main shipping channel where there is no vertical land movement, the fine weather king tides are up to a foot lower than they were 70 years ago. And the local tide gauge agrees.
Yes and no. You have to remember that the tide gages and satellites are recording different things. Tide gages record sea level relative to the land they’re attached to. Since much of the land in the northern hemisphere is still rebounding from the last glacial period,l the tide gages show lower rates. Indeed some of those that are farther north are even negative. What they don’t show is any meaningful change in trend over the last 100+ years.
Satellites measure the altitude (well, distance to the satellite, but effectively altitude) of the oceans over most of the surface of the planet. They don’t show different rates either over their life, but since the satellites have been replaced multiple times and each has its own significant error bars, it’s honestly difficult to know anything about their trends.
The Northern Hemisphere is NOT The Globe. It’s only half of it, the northern half at that. The tide gauges in the Southern Hemisphere are mostly on stable land. Australia is not going anywhere and neither is Auckland, NZ.
NASA claimed this to be Global Rate of Rise. It’s not apparent in the Southern Hemisphere yet.
“Since much of the land in the northern hemisphere is still rebounding from the last glacial period,l the tide gages show lower rates. ”
Nonsense. That effect is well known, geographically limited, and easy to correct for. And by the way for much of the northern hemisphere it is in the opposite direction as the “forebulge” around the formerly ice covered areas sink back (this affects much of the US for example).
I actually find it good it is pausing because it should be. If it wasn’t you should be asking where is all the water coming from because it isn’t from ice melting.
Bingo! We have a winner!
Nor from thermal expansion, LdB.
How ironic is it that Obama claimed sea level rise would slow during his administration when it’s actually slowing during Trump’s?
But he said it in such a nice way.
And Sen. Harry Reid said “… (Obama) could become the country’s first black president because he was “light-skinned” and had “no Negro dialect, unless he wanted to have one.””
And “Joseph R. Biden Jr. of Delaware told the New York Observer that Mr. Obama was “the first mainstream African-American who is articulate and bright and clean and a nice-looking guy.””
And that, apparently, is all one needs for a Nobel Prize and the Presidency of the United States.
He essentially got the Nobel Peace Prize for winning an election.
I think, actually, that the Nobel was for spouting socialist nonsense to socialists in socialist Europe, Bill.
Looking at the top graph, interesting though this appears, it hasn’t gone below the level of an obvious trend line that your can draw through the data since 1993. Thus, it would have to drop quite a bit and sustain that drop for at least a few years before any of us can get excited and suggest that the sea level rise that has been occurring for generations is over. The best that you could say is that the rise isn’t accelerating at present (which it should do if the link to carbon dioxide as the main driver of such change is valid).
I would think that this “pause” is just a random fluctuation in the readings. It seems to have occurred in 2011 as well. The overall trend is upward. You don’t get something as massive as an ocean suddenly jamming on the brakes like that.
Trebla, Oh yes you do. In an El Nino system the wind and currents of the Pacific Ocean at the equator revers themselves and in Nth East Australia water levels decline as the vast bulk of the Pacific is pushed towards South America. This is the main reason we have coral bleaching events in Australia…its not a coincidence that we have bleaching every time there is an El Nino and its not because of hotter water, as during an El Nino lowered water levels leave the corals exposed too much to UV rays and are generally cooler upwelling waters although some warmer waters do come in from the West periodically, as the Pacific’s warmer surface water heads for South America. Then back to normal during a La Nina or a neutral period. And every time this happened the worlds mindless media and the socialist sect scream…”GLOBAL WARMING IS DESTROYING THE REEF AND IT WILL TAKE 1000s OF YEARS TO REPAIR…IF EVER!!!!!”
Already the minor damage done to the reef this time around has begun to repair itself and in most places you wouldn’t know anything had happened. (Some say that reef building requires bleaching events, I haven’t really given that too much thought but it sounds about right to me) Does anyone know about that?
Anyway you wont get the good news from CNN or the New York Times or for that matter on Australia’s national broadcaster, the ABC…because they are lying to you.
An ocean does not have brakes, nor an accelerator pedal. It has a level, depending on a whole bunch of different factors, primarily the amount of water in it, which can only be changed by changing the amount of water held in the atmosphere and by ice and snow sequestered on land. Oceans can fall if lots of extra snow falls on the Antarctica and Greenland ice sheets. From my reading, I believe there is strong evidence that increased deposition is occurring in both places at present.
The argument that thermal expansion creates sea level rise and fall may be technically true, but such rises and falls are tiny and practically immeasurable. Most of the ocean is very cold and under extreme pressure. At depth, there can be no thermal expansion because heat energy is not being added, and pressure counteracts any tiny volume expansion that might occur. At the very narrow layer near the surface where water might expand without pressure from above, any expansion will be reduce by the fact that warmer water evaporates more quickly and creates more direct convection, thereby diluting that warmth. Given all the factors that confound our attempts to measure sea level at all, thermal expansion is a non-issue.
I am partial to tidal gauges…
http://www.drroyspencer.com/wp-content/uploads/Sea-level-data-since-1855.jpg
In essence there is an important point to be made but hand drawn lines and the comment “SAME” have no scientific value. Try again.
Nope, he hits the nail on the head, and annotation is useful and good. One can’t hide in willful ignorance by feigning condescension towards (good) presentation.
It is far superior to the foundational statements of “climate science”
CO2 bad!
Warming Catastrophic!
Money Evil!!
Need Grant!!!!!
Greg says “the comment “SAME” have no scientific value. Try again.”
Okay, I’ll try.
1.92=1.92
Glad to convert a confusing nonsense post into something scientific for you.
Sorry, snarklock engaged on my keyboard
This is potentially a good graph but has some problems:
What is zero on the x axis?
What does “+.75 in” mean? Is it almost (but not quite exactly) a factor of ten out?
Replying to myself: on the y axis – duh!
Lacks the units for 1.92, which should be mm. Hence, the zero on the inches equivalent should be to the left of the decimal point, ie 0.075″).
1.92/25.4 = 0.07559, hence actually closer to 0.076.
Meant to the right rather than the left.
1.92 cm = 0.75inch
Strange, I immediately understood that it meant 0.75 inches = 1.92 cm per decade when I saw that diagram, but it is apparently deeply mystifying for a lot of people.
Actually impressive that mankind has been able to take over with the sea level just as mother nature was no longer able to handle her job.
I couldn’t find this chart or the data in the reference cited, which seems to be “Upper limit for sea level projections by 2100” by Jevrejeva et al 2014. The label says 1.92 per decade, which should be 1.92 mm per year.
Don B
You have a good pair of eyes, connected to a good brain.
Thank you
Recent studies were showing that sea levels were accelerating. But it is now clear that the apparent acceleration was just a short term blip at the end of the data series. This pause now will bring the rise back to the constant rate it has been for 100+ years.
This highlights why statistics are a tricky thing to work with when you want to know the truth, but a convenient thing whey you want to push a narrative.
ENSO effects shove it up temporarily, Jeff.
What is interesting about the last few years of data is that previous reasonably strong El Nino events have accelerated SLR, whereas this time, despite the spike in global atmospheric temperatures, SLR didn’t follow along.
Global temperatures have an approximate 6 month lag on El Ninos.
I took a look at the Boston tide gauge recently. Overall, Boston shows a fairly steep long term rise of 11 inches/century.
The gauge shows a fairly pronounced downturn since 2010.
(click to embiggen)
Y-Axis in Meters.
Land around Boston was under ice during the LGM, so is probably still rebounding.
Yes, “post glacial regression”.
TonyL
October 16, 2017 at 8:57 am:
The AMO is cooling, with falling water level along the New England coast as part of that. Shifts in winds and sea level pressures are the proximate causes, I think.
Seems reasonable. There look to be a few other similar downturns in the record.
Why does Jason-2 show much more variation than either Jason-1 or TOPEX? Is todays sea level really so much more variable, or is Jason-2 more prone to fluctuations.
That data has been so adjusted-corrected and mangled I would give any weight to current mix of the two instruments.
They also hide and refuse to produce old archived copies to comparison and validation so I have no confidence in their honesty and objectivity.
The CU group are activists and have their fingers on the scale.
Greg
Only their fingers?
Auto
Greg,
CU raw data text is available on the WAyBack Machine all the way back to 2004. And yes, they goose the data. I’m on an IPad in the woods otherwise I’d put up a chart that shows the manipulations over the last decade.
Steve
Let’s see if I can paste that chart up here
http://i68.tinypic.com/2hz4cqt.jpg
Thank you for that, Steve!
Jason 2 was designed to be more sensitive. Unfortunately that also means less accurate. See essay PseudoPrecision for details.
There are several other pause periods in other years. Nothing unusual yet.
And often following an El Nino.
La Ninas, often following El Ninos, spread the deep Western Pacific Warm Pool waters throughout the world’s oceans through water currents and atmospheric teleconnections. See Bob Tisdale’s work at: https://bobtisdale.wordpress.com/
Their SLR is fake regardless. No way that actual observations support >3mm rise. Certainly no acceleration.
Concerning the third chart, the U Colorado Jason TOPEX chart.
How to increase SLR by 50% in a few easy steps.
1) SLR is 2.2 mm/yr
2) Add GIA correction. SLR is 2.2 mm/yr, 3.3 mm/yr – GIA corrected
3) Drop uncorrected number. SLR is 3.3 mm/yr – GIA corrected
4) *NEW! IMPROVED! for 2017, drop the notification that the number is GIA corrected.
Bump up the number by 0.1 just for the hell of it.
SLR is 3.4 mm/yr
That is why I bothered to check some tide gauges to “ground truth” what U Colorado is telling us.
Doubtful that it’s even 2.2 mm/yr
Actually 2.2 is about right. See my earlier WUWT guest post on SLR and closure for the data and reasoning. Diff GPS land motion PSMSL tide gauges with > 60 year records average 2.2. Depending on who does the closure calculations (me in the guest post using referenced citations, or Cazenove in NCC 2014) closure is either 2.2 or 2.3.
The U of CO GIA adjustment (now not even documented on its site) is something that would appeal to a segment producer at “60 Minutes” in ordinary circumstances as providing a great opportunity for a newsworthy exposé. Alas, SLR and other warmist icons are sacred cows—and 60 Minutes probably is twice shy after the warmist indignation stirred up by its exposé of clean power promises, three years ago.
A pause in sea level rise? The data must be wrong! Call in the data adjusters. Tom Karl, Kevin Cowtan, Gavin Schmidt, you’re needed here!
Precisely, the trends aren’t finalized until the fat adjusters sing.
PM, this happened before circa 2007-2010, and brought forth two ludicrous papers purporting to explain why. Both deservedly dissected and ridiculed in essay PseudoPrecision in my ebook Blowing Smoke.
Are there any data collected of the net flow between Australia and Indonesia? That’s quite a bottle neck.
The bottleneck is getting tighter by 70mm a year.
Is it time to panic yet?
Because of known random multidecadal variations in sea level the anthropogenic effect must be studied at much longer time spans.
https://ssrn.com/abstract=3023248
Minimum for a meaningful trend is >60 years.
Inconvenient: NASA shows global sea level…pausing, instead of rising
Good news and even better if it’s instead of “accelerating”. Average global outside air temperature fractions and carbon dioxide parts per millions seem to follow suit.
Paris accord targets can be considered achieved now. Governments can safely close it.
However, no one should ever have the temptation to use this powerful weapon against carbon-based lifeforms again. Regrettably, it has been proven indestructible with the tools of men, hobbits, elves, dwarves, wizards, rohirrim and ents. As a precautionary measure it should be tossed it into Mauna Loa where it has been forged.
“The correlation between ENSO and sea level seems strong.”
So, it seems that ocean sea level measuring is biased to buoys the tropics where levels are rising and falling concurrent with ENSO conditions. This must mean that in other places the ocean levels are falling to compensate, but that either these places are not properly represented in the sample space or they have been homogenized out of existence.
“the tropics where levels are rising and falling concurrent with ENSO conditions.This must mean that in other places the ocean levels are falling to compensate“. Not saying there isn’t some of this going on, but it doesn’t have to be. There is a water temperature change under ENSO. Water temperature affects sea level, without water having to be transferred to or from somewhere else.
Possibly, a degree difference in the top 10 meters or so of the ocean is consistent with a few mm of change.
But at the same time other areas of the ocean should be cooler and a few mm lower. The temperature difference between summer and winter is far larger than between the phases of ENSO. Can we detect this difference? It should more than an order of magnitude larger.
Warm water at depth in the Pacific Warm Pool was released to that top 10 meters over a wide area.
Dave,
What warm water at depth? Cold water sinks and the ocean temperature monotonically decreases with depth.
Unless such a deep (about 300 m) pool is caused by the equatorial trade winds pushing sun-warmed water up against a barrier. Read some Bob Tisdale: https://bobtisdale.wordpress.com/
At his site, get his free ebook “Who Turned on the Heat?” A comprehensive examination of The processes and long-term global-warming aftereffects of El Niños and La Niñas, which are the dominant weather events on Earth.
You may even get his other free books. Leave a tip, though. He is unpaid, unlike many of the trolls here.
Dave,
The effects of trade winds are a surface phenomenon and this layer (between the surface and top of the thermocline) is well mixed anyway. In fact, the top of the thermocline is defined to be the depth above which the ocean is well mixed.
My point is that there is no upwelling of deep water (below the thermocline) except that arising from thermal vents. This is for no other reason than cold water is denser than warm water and sinks.
My take on El Nino/La Nina is that COMBINED they have no NET effect on the global temperature. They represent two quasi-stable states that are bounced between based on centrifugal force pushing water towards the tropics and as heat accumulates, increased equatorial high pressure regions push the water back towards the poles.
I’m not even sure tha the reported temperature change arising from ENSO variability is even real. It depends on whether they are averaging temperature or averaging emissions and converting the result to a temperature.
Consider a surface of 1000 m^2 that’s emitting 250 W/m^2 on average.
Case 1 is where half is emitting 300 W/m^2 and the other half is emitting 200 W/m^2. The average emissions are 250 W/m^2 corresponding to an average temperature of 257.7K, but when you average the two temperatures based on the area of each, the average temperature is only 256.7k.
500 m^2 @ 300 W/m^2 -> 269.7K
500 m^2 @ 200 W/m^2 -> 243.7k
250 W/m^2 emissions -> average SB temp -> 257.7K
256.7K geometric temperature average
Case 2 is another quasi-stable state that has the same emissions, except that 40% of the surface is emitting 300 W/m^2 and 60% is emitting 164 W/m^2. The average emissions and average SB temperature are the same as case 1, except that the ‘average’ temperature is now 259K!
400 m^2 @ 380 W/m^2 -> 286.1K
600 m^2 @ 164 W/m^2 -> 231.9k
250 W/m^2 emissions -> average SB temp -> 257.7K
259K geometric temperature average
Case 2 is 2C warmer than case 1 even as the average emissions and SB average temperature are exactly the same! Relative to the planets sensitivity, only changes to the SB temperature equivalent to the average emissions matters.
CO2, you need to take your theories (?) on the road. The don’t seem to have anything to do with the Western Pacific Warm Pool nor ENSO’s impact on the same.
I am aware of some studies showing the decadal impacts of differing ENSO regimes on global temperatures. Even Trenberth has some “ENSO residuals” stuff from 2002.
Please read Bob Tisdale’s “Who Turned Up The Heat” free at his website Climate Observations: https://bobtisdale.wordpress.com/
Well, these are satellite altimetry measurements (which have a lot of inherent problems). Maybe the satellites are picking up thermal expansion in the surface waters of the eastern tropical Pacific. Or maybe ENSO affects north-south wind patterns, so that during El Niño water sloshes from the poles (where the satellite altimeters don’t measure) toward the equator (where they do).
In San Diego, and in the satellite-altimetry graphs, sea-level changes with ENSO. But in the western tropical Pacific sea-level changes opposite to ENSO.
On the J.Hansen / M.Sato sea-level page, they have a graph showing the strong positive correlation between ENSO and satellite altimetry measurements of sea-level:
http://www.columbia.edu/~mhs119/SeaLevel/SL+Nino34.png
But look how San Diego (eastern Pacific) and Kwajalein (western Pacific) are mirror-opposites of each other:
http://sealevel.info/1820000_Kwajalein_San_Diego_2016-04_vs_ENSO.png
I’m just speculating about why ENSO has such a strong effect on the satellite altimetry measurements. But I think the tide gauges are affected because ENSO affects trade winds. The westerly tropical trade winds slow as an El Niño builds, so water in the equatorial Pacific sloshes east, raising sea-level at San Diego, and lowering it at Kwajalein. As the El Niño fades, the trade winds increase, so the water sloshes west.
With proper weightings, it should be possible to build a “global sea-level” index/average from coastal tide-gauges which mostly eliminates the ENSO influence.
Because in the western tropical Pacific sea-level changes opposite to ENSO, I posit that you should be able to also construct a good ENSO proxy by calculating the ratio of news stories about “record high temperatures” to news stories about “drowning island paradises.”
Please note that CU data ends on a Super El Nino.
“With proper weightings …”
Perhaps, but the required weights are very uncertain, moreover; ENSO effects aren’t all that needs to be cancelled out or averaged away. Seasonal change, Earth to moon distance variability, other oscillations between quasi-stable states, atmospheric pressure variability, winds and more all need to be taken out before changes in the ‘average’ sea levels can be used as a proxy for changes in the average surface temperature (or visa versa).
I wrote, “Maybe the satellites are picking up thermal expansion in the surface waters of the eastern tropical Pacific. Or maybe ENSO affects north-south wind patterns, so that during El Niño water sloshes from the poles (where the satellite altimeters don’t measure) toward the equator (where they do)… I’m just speculating about why ENSO has such a strong effect on the satellite altimetry measurements.”
Another factor could be ENSO-connected varying rainfall patterns, which alter the amount of water sequestered in lakes.
Note that Javier has posted a partial answer to that implied question, below. Here’s an excerpt:
Thank you, Javier.
Natural changes continue and it is as though CAGW doesn’t exist. Oops!
Didn’t they recently recalibrate to “correct” for an error? I think they might have made an error in their calibrations. Reminds me of the famous line in “Hunt for Red October.”
“Captain, you arrogant ass! You have killed us!”
I am in process for writing the next part of my series “SEA LEVEL: Rise and Fall” which will focus on the satellite sea level measurements, including the NASA estimates of accuracy for each of the satellite series and their comparisons.
The “error bars” on the 20-year graph is so small that it is invisible — only shows on the 4-year graph. ±0.4 millimeters!
Precision by long division. Nonsensical.
Kip
I wrote an article on sea level rise from the start of the Holocene and up to Roman times ‘ historic variations in sea levels part one’
The satellite data i had to work with was very poor….
Tonyb
TonyB ==> Yes, I remember seeing it, quite a few years ago — I will review it as part of my prep for the Sea level series. Thanks for the reminder. (Those curious will find Tony’s article here.)
Remember the “other Satellite” data, you know the one that showed levels falling many years ago.
It was declared wrong, so it must be defective and they stopped using it.
Wasn’r it one of the EuroSat series?
Those Roman satellites were a bit wonky.
Tonyb: “The satellite data i had to work with was very poor….” You don’t seem to grasp the new CliSci- You can take the sat data you have, and “infill” for yrs 0-1979, and voila, you have 2017 yrs of “satellite” “data”, all the way back to Ceasar. Then you confirm your finding with, say, tree rings (only the right “thermometer” trees, remember).
I do appreciate you take a different approach.
Kip, also suggest you take a look at my previous WUWT guest post on SLR and closure.
ristvan ==> Already in my reference list….thanks.
Kip: Looking forward to it.
Interesting
Thinking of what a pause might indicate makes me wonder if global temperatures have been somewhat overstated as a result of UHI, homogenisation etc.
Sea level rise has been at a constant rate since the 1880s, so well before major CO2 emissions from man and AGW from the late 1940’s as per warmist belief. Throughout that period, until recently when there has been a pause in this, I think CO2 levels increased at a fairly constant rate.
If there is no discernible change in those rates, or of temperature changes (other than the 20 year ‘pause’) it makes me wonder if the lack of change in rate – despite massive increases in mankind’s CO2 emissions since the 1940 / 50s – shows that there is Nil effect from mankind’s emissions ?
The rates seem to suggest that there is no discernible anthropogenic fingerprint in any of them.
Have a look at the sea-level at Kungsholmsfort in Sweden. The isostatic postglacial land rise at that site is 1.75 mm/year (verified by GPS). The sea level has been measured continuously since 1886, and the average sea-level in 2016 was 1 mm lower than in 1887. The sea level is rising by 1.75 mm/year and just keeping up with the land rise:
http://www.psmsl.org/data/obtaining/rlr.monthly.plots/70_high.png
If there was a “anthropogenic fingerprint” it should be very clearly visible above, even a slight “acceleration” should show up as a net sea-level rise, but it doesn’t.
You made an unverified assumption. You are assuming that the current GPS verified rise 1.75 mm/year has been happening since 1886. Could it be that the ongoing warming trend has melted glaciers and altered t rate of the isostatic rebound?
Also tty, I don’t think you need to be lectured on using a single geographical data point as representative of “sea level rise” because you know better.
Nothing mysterious here. Sea levels and ENSO correlate, so sea level increases above trend during El Niño, and increases below trend during other periods. That’s why detrended GMSL coincides with ENSO as in the figure shown in the article. When the influence from ENSO is removed, what is left is the trend.
Last big El Niño peaked in February 2016. Since March 2016 temperatures have been going down, and sea level has been slightly going down or stable. There is nothing extraordinary about it. It has happened before.
What is curious is that University of Colorado Sea Level Group stopped updating their data. Last release was the fourth in 2016, on September. There should have been four or five releases since.
The French AVISO page is another data provider for sea level increase:
https://www.aviso.altimetry.fr/en/data/products/ocean-indicators-products/mean-sea-level.html
AVISO can’t be taken seriously. They are changing their numbers all the time as far back as the start date of their record (1993.012363, 1993-01-05) with no version control system in place whatsoever. It’s not science, it’s a farce.
For example sea level at AVISO for 2017.553752 (2017-07-22) increased by 1.85 mm in less than a month, between 2017-09-19 &. 2017-10-16. At the same time it was decreased by 0.2 mm for 2017.499457 (2017-07-02). So, while in the previous version sea level went up by 0.08 mm in 20 days, in the latter version it is more than 2 mm. A 25-fold increase in rate, just by playing with numbers.
I can understand a regional variation, say for the ENSO 3-4 region or in the West Pacific Pool. How do you get a global increase? The water has to come from somewhere!
1) Warm water pushed by currents into other ocean basins and 2) atmospheric teleconnections of warm air affecting other oceans. See the wealth of information provided by Bob Tisdale at:
https://bobtisdale.wordpress.com/
Piecuch, C. G., & Quinn, K. J. (2016). El Niño, La Niña, and the global sea level budget. Ocean Science, 12(6), 1165.
http://www.ocean-sci.net/12/1165/2016/os-12-1165-2016.pdf
“Previous studies show that nonseasonal variations in global-mean sea level (GMSL) are significantly corre- lated with El Niño–Southern Oscillation (ENSO). However, it has remained unclear to what extent these ENSO-related GMSL fluctuations correspond to steric (i.e., density) or barystatic (mass) effects. Here we diagnose the GMSL budget for ENSO events observationally using data from profiling floats, satellite gravimetry, and radar altimetry during 2005–2015. Steric and barystatic effects make comparable contributions to the GMSL budget during ENSO, in contrast to previous interpretations based largely on hydrological models, which emphasize the barystatic component. The steric contributions reflect changes in global ocean heat content, centered on the Pacific. Distributions of ocean heat storage in the Pacific arise from a mix of diabatic and adiabatic effects. Results have implications for understanding the surface warming slowdown and demonstrate the usefulness of the Global Ocean Observing System for constraining Earth’s hydrological cycle and radiation imbalance.”
So it appears to be both an effect of water temperature increase that makes the water expand, and a mass change that piles water on the Pacific Equator where it is measured by satellites as a temporary sea level rise.
Well, D.J. Hawkins, the satellite altimeters are on orbital inclinations of about 66°, and they look straight down. They can only measure sea-level directly below the satellite. So if water “sloshed” to and from the Arctic Ocean it would be sloshing in and out of the view of the satellites.
I don’t know that that is going on, but if it did then that is another way that changing wind patters, perhaps due to ENSO, could move water around and change the so-called “global” sea-level measured by satellite altimetry.
Javier,
Bingo CU hasn’t updated – the question is why? I speculate that they don’t want to show the flat spot over the last two years. Maybe they are busy manipulating past data in order to show acceleration. The lag is coming up with the plausible justification. Yes I’m that cynical.
Could someone explain the east coast of Japan where lowest and highest levels are next to each other.
domo.
Could be a thermal effect, where a warm blob of water expands upward, but it’s mass does not change, so gravity does not yank it back down very hard.
So why does not a high warm blob of water flow out to a lower area anyway? Consider a meandering river near where it reaches the sea. The drop may be only 20 feet per mile and the river hardly flows at low water.
Now consider the blobs off Japan, perhaps a couple of hundred miles across, and a total vertical gradient of only perhaps two feet. The water just is not going to flow.
gravity….sea floor volcanoes increase gravity and hold water on top of them…and the gravity screws with the satellites
LOL @ Latitude. Sea floor volcanoes do not “increase gravity”
Cpp, if you understood magma accumulation and GRACE, you would reverse your apparently ignorant opinion. Please try harder.
Ristvan, you don’t seem to understand gravity at all. The only thing that could possibly increase the gravity is an increase in mass. Obviously you don’t realize that when you move some mass from one place, you decrease it in another. The only thing that can increase gravity is new mass colliding with the earth as meteors. Is the gravity field of the earth uniform? Nope. GRACE can measure the anomalies of this varying field, but gravity doesn’t “increase”
C. Paul Pierett, I’m sure that’s what Latitude meant: a sea-floor volcano increases gravity near the site of the volcano, by movement of magma from elsewhere. Since the Earth’s total mass hasn’t changed, its average gravity hasn’t changed, either. Everyone here understands that, including Latitude and ristvan. So knock off the insults, please.
“a sea-floor volcano increases gravity near the site of the volcano”
…
Are you sure?
…
It depends upon the nature of the magma body giving rise to the volcano: if it is an acidic (silica rich) magma, producing say a rhyolitic lava, it will be a decrease in gravity and if it is a basic (silica poor) magma, producing say a basaltic lava, then the gravity will increase.
.
GRACE doen’t have the resolution necessary to answer this question.
C. Paul Pierett, I’m no geologist, but rhyolite is about 2.4× the density of seawater (and basalt is about 2.9× the density of seawater). So either one would increase local gravity, because when a volcano is pushed up, it’s mainly seawater being displaced, not other rock.
Dave, I’ll repeat my words: ” the nature of the magma body giving rise to the volcano.” Think about the magma chamber BELOW the volcano, and the crustal rock being displaced. The density of the magma is either higher or lower than the rock it pushes away. People seem to forget that a lot is happening underneath the surface, and sea water displacement from the ejected magma is a tiny fraction of what’s going on.
C. Paul Pierett, when a submarine volcano grows from an influx of magma, “the rock it pushes away” doesn’t go away. It is pushed up, and perhaps a bit to one side. What is ultimately displaced is seawater, not rock. So any growing submarine volcano will cause a local increase in gravity.
Dave posts: “C. Paul Pierett, I’m no geologist ”
…
Yes, you are correct. Please consult with one.
Read this if you can’t find one: http://onlinelibrary.wiley.com/doi/10.1029/2002JB001989/full
…
and this for one that increases: http://onlinelibrary.wiley.com/doi/10.1002/2014JB011506/full
It doesn’t take a geologist to know that rock is denser than seawater.
Again, you are correct, rock is denser than seawater.
…
But it does take a geologist to tell you what is happening BELOW THE SEAFLOOR.
I wrote, “any growing submarine volcano will cause a local increase in gravity.”
C. Paul Pierett, are you suggesting that either of those papers offers evidence to the contrary? Because, from the abstracts, it doesn’t sound like it.
Decrease:
.
Miyakejima The gravity decrease is interpreted as a reduction of the density in a cylindrical conduit, attributed to water inflow from an ambient aquifer that also promoted intensive magma-water interaction and subsequent explosive eruptions.
…
Increase:
.
Kīlauea We propose that since the opening of a new eruptive vent at the summit of Kīlauea in 2008, magma rising to the surface of the lava lake outgasses, becomes denser, and sinks to deeper levels, replacing less dense gas-rich magma stored in the Halema‘uma‘u magma reservoir.
PS…submarine volcanoes have much more water infiltration than ground based ones.
And…going back to the beginning, it all depends on the nature of the magma. Sometimes gravity goes up, sometimes it goes down.
In response to Paul Pierett:
Quote:
LOL @ Latitude. Sea floor volcanoes do not “increase gravity”
and
And…going back to the beginning, it all depends on the nature of the magma. Sometimes gravity goes up, sometimes it goes down.
They don’t but do increase gravity?
Give it up C. Paul Pierett. You clearly don’t understand gravitational theory. Seafloor volcanoes do increase the local gravity field and affect the sea level. The effect is described in simple terms here:
https://www.ngdc.noaa.gov/mgg/bathymetry/predicted/explore.HTML
tty, the problem with your link is that it does not differentiate between silica rich magma chambers, and silica poor ones. (see my previous post)
Ja. It is globally cooling. More here SH then there NH.
Be worried. The climate is changing…
We’d also have to mask out La Nina events, since they cause a reduction in sea level, as shown in the (de-trended) 4th chart. Therefore masking out ENSO events (both warming and cooling) should make little difference to the long term trend.
True, but the El Nino events have dominated over La Nina events since 1975 or so:

ENSO 3.4 sudden drop to -0.38 today. Another winner fact. That’s 4 great posts to read today and I have not even got to the good news EPA article.
Wow.
And Gore said “NASA – never heard of them – are they deniers?”
So San Francisco us sueing Exxon for supposed SLR? Those NASA graphs are rather inconvenient for the City’s case don’t you think? But then again so we’re their tide gauge data even before they claimed they would bring the suit.
Rah, let’s see. CAGW is evidenced by:
1) Accelerating SLR. Not.
2) Tropical Tropospheric Hot Spot. Not.
3) Increasing severe weather, floods, droughts, hurricanes, tornadoes, etc. Not.
4) Atmosphere warms the surface under increasing CO2. Not.
5) Antarctic ice melting. Not.
6) Arctic sea ice death spiral. Not.
7) Climate models accurately reflect/predict global warming, precipitation, etc. Not.
8) [Add your own.]
Where is all this consensus science?
I’d love to see all the comments on the draft IPCC AR6. Although I do believe AR6 will have the same bureaucratic gobbly gook and misdirection as had AR5. Entire sections contradicted others. And I predict the bureaucrats/politicians will be even more sure of their “science” in the AR6 SPM.
CAGW is very real for 97% of carefully selected climate scientists. Unfortunately, Mother Nature is not a part of this selection.
Bumper sticker:
Climate Change
Is 97% Bull Shit
+100%
Mr. Layman here.
Sea level rise. If I I understand it correctly, it is an attempt to measure the top layer of the oceans against the bottom layer of the land.
It is not a measure of the volume of water in the oceans.
The land level and “the bowl” that holds the oceans changes (plate tectonics and all that).
So just how does a rise in “sea level rise” have much of anything to do with CAGW?
Notwithstanding the forgoing, we are all going to die! Have as much sex as possible now, at your discretion.
Like Harvey and both Bills, JB?
You know, this is something that has bugged me.
People take sea level rise as if it is evidence of global warming, and a lack of sea level rise as evidence against it. But it is a secondary prediction, based on the prediction of warming. You can spin up an alternative scenario where warming causes sea level to drop.
What cases sea level rise? Thermal expansion of the ocean for one. And global warming would cause this to increase. The other is sequestration of water as ice on land.
Now, there are two great reservoirs of land fast ice – Greenland and Antarctica. Everything else is a round error.
Cold air hold less moisture. The north slope of Alaska for example is often referred to as an Arctic desert – it receives around 4 inches of precip. a year. The Brooks Range has very few glaciers not because it is too hot, but because it is too cold. This precip. is about the same as the Sahara desert (look it up). Antarctica gets around six inches, but very little in the interior.
So, if the air warmed slightly in Antarctica, it would hold a lot more moisture. And that moisture would accumulate as ice. By this mechanism, a lot of water could be extracted and sequestered from the oceans. Therefore warming might cause more water to be sequestered, directly counteracting any thermal expansion. Sea level could even fall in a global warming scenario, at least you could make some sort of case that is possible.
Which again – the global warming enthusiasts seem to think this is all so simple – warmer = sea level rise. But again, reality is messy. None of that may actually happen the way they imagine.
…the way they imagine
Bingo!
Isn’t it 99.06% BS
Sea Level Rise (SLR) has been stuck at 6~7 inches per CENTURY since the 19th century, and the 21st will be about the same.
CAGW’s various doom and gloom SLR predictions of 3 feet to 50 feet by 2100 have always been absurd, but they were very effective for brainwashing propaganda purposes.
NASA’s SLR graphs showing satellite and tide gauge data are comical:
1) It only shows tide-gauge data from 1870 to 2000 and completely leaves off the last 17 years.
2) it conveniently leaves off the tide-gauge trend rate of 1.5mm/year, but prominently displays the satellite SLR rate at 3.4mm/yr… Hmmm… a convenient oversight..
https://climate.nasa.gov/vital-signs/sea-level/
With the AMO 30-yr cool cycle soon starting, combined with the approaching Grand Solar Minimum event, SLR rates will likely continue to slow and may even show a falling trend by the end of this century..
“Houston, we don’t have a problem…”
I think a look at Sst map from NOAA shows very cold ocean, particularly the southern hemisphere.
http://www.ospo.noaa.gov/data/sst/anomaly/2017/anomnight.10.16.2017.gif
This is what is effecting sea level decline. Even the hype about terminal bleaching of the GBR was actually due to exposure of coral into the atmosphere and surrounding water being very shallow. Ice extent is also recovering at both poles. This NH winter will also be a doozie. The La Nina cometh.
http://www.bom.gov.au/climate/enso/monitoring/nino3_4.png
Click the bottom graph to get the update
According to NASA: “From its vantage point 1336 kilometers (830 miles) above the Earth, the US/European Jason-1 and OSTM/Jason-2 ocean altimeter satellites measure the height of the ocean surface directly underneath the satellite with an accuracy of 4-5 centimeters (better than 2 inches). Traveling in excess of 7 kilometers (4 miles) every second as they trace out an orbit, the spacecraft cover the global oceans every 10 days (the “repeat period” of the satellite orbit).
This accuracy figure pertains to a few-kilometer spot on the ocean surface directly beneath the satellite. By averaging the few-hundred thousand measurements collected by the satellite in the time it takes to cover the global oceans (10 days), global mean sea level can be determined with a precision of several millimeters.”
https://sealevel.jpl.nasa.gov/technology/
NOAA uses 199 tide gauge records covering the past century to arrive at an average sea level increase of 1.08 mm per year, which is far less than the “precision of several millimeters” that NASA determines from satellite observations – derived from averaging hundreds of thousands of satellite measurements, each of which has an accuracy of 40 to 50 millimeters (possibly double, if the observation = n +/- 50 mm). In certain instances of repeated observations with the same device of the same spot, averaging hundreds of thousands of observations may reduce error, but not when each observation is of a different point and speed over ten days.
NASA claims satellite measured sea level rise is 3.2 mm/year, triple the tide gauges, but still only a modest 13 inches per century. San Francisco Bay Area alarmists predict sea level rise of five feet or more by 2100. Sea level fell almost four inches 1983 to 2016. To reach five feet by 2100 the rate of rise will have to increase by 17 times tomorrow and be sustained for 84 years.
Even if the NASA rate of 3.2 mm/year was correct, and tide gauge measurements show it is not, the rate would have to increase five times for the 84-year period. Each year that passes without at least a 17 mm rise in sea level just adds that much more needed to later year rates. After 2050 the rate would have to be over an inch per year, a rate not seen since mile-thick ice sheets retreated from Canada 18,000 to 12,000 years ago.
Science fiction masquerades as science fact, and skeptics are called anti-science because they reject the fantasies.
We should start referring to the Alarmists as Noah.
Fake news from NASA and USA.
Why are You not showing the sea level trends measurements that has a long record any more.
Ground data is missing after year 2000. Why?
Many persons believe in NASA and those graphs.
You have a responsibility as leading nation!
Get rid of those fake news please!
Obama’s first success. And tomorrow, I will cause the sun to rise in the East. Wait and see.
Sea level rise is enigmatic. The curve plotted by Jo Nova based on data in Jevreja et al (2008) shows sea level going up and down from 1700 to 1850 but no long-term increase. Then in 1850, sea level sets out on a linear, long term rise that continues today. The overall rate for 250 years is about 7 inches per century, in contrast to the satellite data which is twice that amount. The curious thing about the curve is the suddenness of the change in 1850 and the long, linear rise thru three warm periods and three cool periods with virtually no change in the rate. Apparently, warming and cooling doesn’t affect sea level very much. What I get out of all this is that we really don’t understand sea level rise very well.
But speculation runs rampant in the climate “science” community, Don. Tipping points must be assumed because extreme predictions are laughable when compared to current trends. Crickets are all you hear when alarmists are told SLR would have to instantly jump to 17 mm/yr to meet their low-end 2100 guesses.
If this keeps up, you can bet dollars to doughnuts that select “team” members will find some reason to explain it away (my guess is volcano cooling). If this doesn’t “fit the bill” then look to data adjustments. Might even see a few new “science papers” that explain why.
What I doubt we will see is an actual acknowledgment of it by “the cause” “team” members.
Anthony notes a pause in sea level rise which could well be could well important.


The methods used by the establishment climate science community are not fit for purpose. A new forecasting paradigm should be adopted. Earth’s climate is the result of resonances and beats between various quasi-cyclic processes of varying wavelengths. It is not possible to forecast the future unless we have a good understanding of where the earth is in time in relation to the current phases of those different interacting natural quasi periodicities. Evidence is presented in my 2017 Energy and Environment paper. (see blog version at
http://climatesense-norpag.blogspot.com/2017/02/the-coming-cooling-usefully-accurate_17.html )
This paper specifies the timing and amplitude of the natural 60+/- year and, more importantly, 1,000 year periodicities (observed emergent behaviors) that are so obvious in the temperature record. Data related to the solar climate driver is discussed and the solar cycle 22 low in the neutron count (high solar activity) in 1991 is identified as a solar activity millennial peak and correlated with the millennial peak and inversion point – in the RSS temperature trend in about 2003. The cyclic trends are projected forward and predict a probable general temperature decline in the coming decades and centuries. (Fig 12)
Because of the thermal inertia of the oceans there is a varying lag between the solar activity peak and the corresponding peak or low in the different climate metrics.
1.There is a 13+/- year delay between the solar activity “Golden Spike” 1991 peak in Fig 10 and the millennial cyclic “Golden Spike” temperature peak seen in the RSS data in Fig 3. It has been independently estimated that there is about a 12-year lag between the cosmic ray flux and the temperature data – Fig. 3 in Usoskin .https://www.researchgate.net/publication/41624745_Solar_activity_over_the_last_1150_years
Fig 10
Fig4
The RSS cooling trend in Fig. 4 was truncated at 2015.3 because it makes no sense to start or end the analysis of a time series in the middle of major ENSO events which create ephemeral deviations from the longer term trends. By the end of August 2017, the strong El Nino temperature anomaly had declined substantially . The cooling trend is likely to be fully restored by the end of 2019.
2. There is 21 year delay between the solar activity peak and the Arctic sea ice volume and Arctic sea ice area low in 2012.
3.It is certainly possible that Anthony’s pause in sea level rise seen above marks the same 1991 solar activity peak with a delay of 24/25+/- years and could mark the beginning of a long term decline.
4. This same 1991 solar activity peak shows up in the early 21st century change in temperature and cloud cover trends in Fig 11.
The evidence that we have just passed the millennial temperature peak and that a long term cooling is underway continues to mount.
When and why is NASA involved in climate stuff anyway? NASA…North >American “Space” Administration. Isn’t that the bit “above” the atmosphere? ….. oh yes of course… how silly of me, follow the money now there is no shuttle to justify ( a lot of ) their existence and by gosh is there a lot of gravy for agencies jumping on the GW/CC/(or whatever they will change that to when it does not do what they want anymore) band wagon?
” Isn’t that the bit “above” the atmosphere?” ….. No, your problem is that you don’t know what NASA stands for. It’s the National Aeronautics and Space Administration. I suggest you look up “Aeronautics” then get back to us.
Any pause in sea level rise is likely due to rotten water, which masks continued rise caused by CO2 global warming. Still looking for the link to that research.
There’s no sound basis for assuming that close wiggle-watching provides useful insight into secular global sea-level changes.