Guest Post by Willis Eschenbach [see Update at the end]
I thought I might write about how I research a subject. Over at Dr. Judith’s excellent website, she periodically puts out a list of interesting papers that she has come across. This time it was “Week In Review: Water Edition”. She gave a link to an article from a Tampa Bay news station headlined Study: Sea level rise may severely impact Tampa by 2040.
Why did I pick this article? To me it’s obviously bogus. Sea level is rising around the world at something like 8-12 inches (200 – 300 mm) per century. It’s only twenty-four years until 2040, call it a quarter century. So by then Tampa will likely see on the order of 2 – 3 inches of sea level rise. That will not have a “severe impact” anywhere. So I went off to read the article.
Reading the article, I said “Well, there’s yer problem”, viz:
The study was based on sea level rise predictions from the National Oceanic and Atmospheric Administration and the findings of the Tampa Bay Climate Science Advisory Board.
The advisory board concluded that the region could experience sea level rise between a half-foot to 2.5 feet of sea level rise by 2050.
Two and a half feet of sea level rise over the next thirty-four years, a third of a century?? That doesn’t pass the laugh test. Consider that to do that we’d have to AVERAGE a sea level rise of seven and a half feet per century. So I set off to unearth the “findings of the Tampa Bay Climate Science Advisory Board”.
From there the trail got murkier. But after several false starts, I came across a Tampa Bay City Council Agenda that referred in passing to the report by the Advisory Board. With that I was able to track it down. It is called “Recommended Projection of Sea Level Rise in the Tampa Bay Region“.
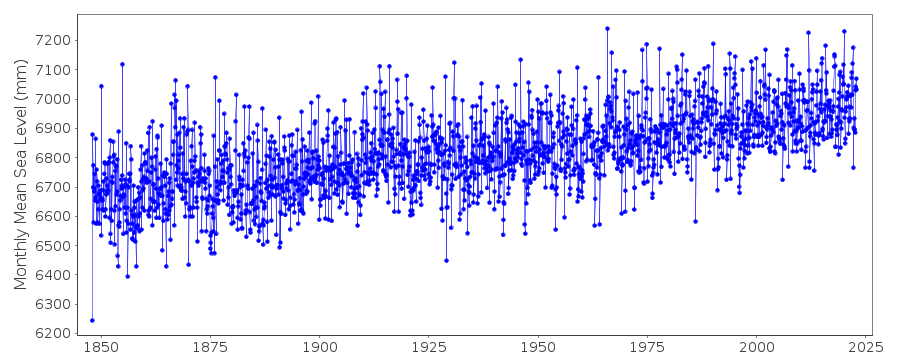
The report starts out reasonably, showing the longest local historical sea level record, from the adjacent city of St. Petersburg.

Regarding this chart they say:
Data measured at the St. Petersburg tide station shows that water levels in Tampa Bay have increased approximately 6.6 inches or approximately 1 inch/decade (see Figure 2).
That’s all quite reasonable, and at ten inches (250 mm) per century the rise is right in the general world range I gave above. So I continue reading and find this:
The final parameter, projections of how much sea level will change globally over the next 100 years, is derived from experts engaged in climate science.
Uh-oh, sez I. We are now in the hands of “experts engaged in climate science”, so hide the good silver and watch your wallets … I continue reading …
The 2012 National Oceanic and Atmospheric Administration (NOAA) Technical Report, Global Sea Level Rise Scenarios for the United States National Climate Assessment, was produced as a coordinated, interagency effort to identify nationally agreed upon estimates for global SLR. The report synthesized the scientific literature on global SLR, included input from national experts in climate science, physical coastal processes and coastal management, and produced a set of four plausible SLR scenarios that can easily be adjusted for regional conditions throughout the United States.
Plausible? Er … um … I continue reading …
Future SLR estimates can be calculated for the Tampa Bay region, integrating data from the local St. Petersburg tide gauge, using a flexible, well-supported tool developed by the United States Army Corps of Engineers (USACE). The tool takes the three parameters discussed above (datum, rate of change, projection) and produces the plots or tables that describe how sea level will change in the future, such as those included as Figure 3 and Table 1.
Here is their Figure 3, in all its glory:

Now, this is good, because it starts in 1992. This means we are already almost a quarter century into this graph, so we can see how well the various projections are doing in 2016. Now, the “NOAA Low” estimate (bottom line, dotted blue) is simply an extension of the historical rate.
To look at the others, I took their Table 1 showing their projections, hand-typed it into Excel (because it’s a graphic and not text and numbers, bad scientists, no cookies), and used the Excel Solver tool to determine the equations of those lines. This lets me calculate the annual sea level rise for each of the four scenarios. Remember, the lowest one called “NOAA Low” is the observed rate extended out to 2100. In the figure below we can see the observed rate of sea level rise (2.6 mm/year) compared to the three NOAA projections for the year 2016.

How are they doing? Let’s start from the “NOAA High” projection. NOAA was definitely high for this one. It’s more than four times the current rate. I’d throw that model in the trash. After a quarter century it’s rising at more than four times the observed rate. Sorry, not valid.
Same thing for the “NOAA Int High”. After a quarter century that sucker is almost three times actual observations. Into the trash with that one as well.
Finally, the NOAA Int Low … well, it is about fifty percent higher than observed. I suppose that is in a feasible range … or so it would seem until we look at where the rates of sea level rise are projected to be by the year 2100.

The fastest sea level rise in the paleo record is from about 16000 to 8000 years before present, at the end of the last ice age glacial period. The rapid rise was from the melting of the ice that was a mile thick where Chicago sits today. As that incredible mass of ice in the temperate zones melted, sea level rose about 110 metres. That is a sustained rate of rise of about 14 mm/year. That rate has not been seen for the last 8000 years, and for a good reason—there is no mile of ice over Chicago to melt. Despite that, NOAA predicts that we may well see twice that rate of rise by the end of the century?? Like I said … that doesn’t pass the laugh test. Even their lowest estimate (NOAA Int Low) is more than half the historical record post-glacial rate … not believable.
Finally, look at the St. Petersburg sea level dataset, or any Florida sea level dataset. None of them show any significant acceleration, despite covering the period of recent warming. Warming but no acceleration of sea level rise … oops.
These alarmist claims of accelerating sea level rise have been being made since about 1988, when Jim Hansen conned the US Senate into buying into his hysteria. Despite the claims, there is no sign of said acceleration in the Florida sea level data.
Now, could it happen? Could sea level rise start to accelerate?
Sure, it’s possible … but until you see it, it is just a James Hansen fantasy.
These NOAA claims of wildly accelerating rates of sea level rise are not science in any form. They are government sponsored hysteria, and whoever did this at NOAA should resign.
Unfortunately, the costs of this rampant alarmism will be huge, as coastal communities will struggle to comply with a meaninglessly exaggerated risk.
The only good news is that sea level pays no attention to what NOAA and the rest of the activist-ridden government and non-government organizations say … and sooner or later, this will become too evident for even the most ardent climate activist to ignore.
My best wishes to everyone,
w.
PS—If you are commenting please QUOTE THE EXACT WORDS YOU ARE REFERRING TO, so that everyone can understand your subject.
UPDATE: As usual, commenters provide pure gold.
Larry Hamlin January 15, 2017 at 11:18 am says:
The Tampa Bay study is question relies upon a “tool” developed by the USACE as noted in the quote in the subject article provided below.
“Future SLR estimates can be calculated for the Tampa Bay region, integrating data from the local St. Petersburg tide gauge, using a flexible, well-supported tool developed by the United States Army Corps of Engineers (USACE). The tool takes the three parameters discussed above (datum, rate of change, projection) and produces the plots or tables that describe how sea level will change in the future, such as those included as Figure 3 and Table 1.”
The USACE model methodology can be found at: http://www.corpsclimate.us/ccaceslcurves.cfm.
This USACE tool is in fact a semi-emprical methodology model of the type whose significant shortcomings was addressed in the UN IPCC AR5 report which specifically noted:
“Many semi-empirical model projections of global mean sea level rise are higher than process-based model projections (up to about twice as large), but there is no consensus in the scientific community about their reliability and there is thus low confidence in their projections. {13.5}”
“Despite the successful calibration and evaluation of semi-empirical models against the observed 20th century sea level record, there is no consensus in the scientific community about their reliability, and consequently low confidence in projections based on them. {13.5.2, 13.5.3, Figure 13.12}”
“Because of the limited or medium evidence supporting SEMs, and the low agreement about their reliability, we have low confidence in their projections.” (Section 13.5.3)
Thus the Tampa Bay study addressed in this post relies upon highly speculative methodology which was specifically cautioned against in the UN IPCC AR5 report as providing results which the IPCC have “low confidence in their projections.”
This whole “sea level rise alarmism” is already costing too much worldwide. Se level rise has been quite stable and it’s rather predictable. Probably it will continue to rise with the same average value determined from the satellite data measurements. However, countries, such as mine, are already spending millions of dollars each year in the so called “adaptation measures” that, after some time, prove to be more problematic and have a bigger impact than the natural sea level rise itself.
“… spending millions of dollars each year in the so called “adaptation measures …”
In some places local authorities have entertained the compulsory acquisition of waterfront property that, they say, will be affected by ‘sea level rise’. In such situations I would be having a good, hard look at who owns land that will become waterfront, and thus increase in value, once the properties between their land and the sea are compulsorily acquired. I would then be having a good, hard look at the people involved and their relationships with each other.
So young, and so cynical! Surely there couldn’t be any dirty work at the crossroads…could there?
Ha. Follow the money to get to the truth.
“In some places local authorities have entertained the compulsory acquisition of waterfront property…”
The basket of deplorables who own much of that, won’t go away quietly. So the elites want to acquire it at fire sale prices and are willing to use the police powers of an all-powerful govt to get it for them.
“In some places….”
Where, for instance?
Regarding mitigation measures – i.e., continuing to live with sea level increases as mankind has done for all of its recorded history – it’s really quite simple and inexpensive.
At a sea level increase of about 10 inches a century, assume that we have to replace all of our coastal infrastructure (roads, power plants, ground floor residences, etc.) every time sea level rises one foot. That would be a ridiculously conservative assumption, tremendously overblown, and will never happen in such a ridiculous fashion … but just go with it. That means we’d have to rebuild our coastal infrastructure at least once every 120 years.
Well, considering that virtually all of our existing infrastructure today is less than 50 years old, and that virtually all of it (roads, power plants, ground floor residences, etc.) have design lifetimes of considerably less than 50 years, that means we’ll rebuild our entire coastal infrastructure at least twice before we need to do so due to sea level rise. And every time we rebuild that infrastructure, we’ll presumably build it with sea level rise in mind (unlike 50 years ago) and accordingly harden it against sea level rise.
The actual cost to raise any form of infrastructure 1 foot over what it otherwise might be situated would be unmeasurable within the overall cost to rebuild such infrastrucure … it would be in the immeasurable noise level.
Therefore, there will be virtually no net cost to mitigate the costs of sea level rise at current or near current rates in our coastal areas. Non-coastal areas, even mere yards or meters to perhaps a mile or kilometer or two will never see any impact at all.
So who really CARES if sea level rises 10 inches a century? Except, of course for the constant scaremongers.
Flying from Europe to the South Pacific 4-6 time a year, with a window seat I sometimes wonder HOW a 1.74mm measurement is taken,. During the flight (20+ Hours) about 99% of the time its over water which in most places is more than 5km deep, the tide in New Zealand does not respect the tide in Alaska, (rise and fall different all over the world, wind, storms, moon, all might have an effect ( Scottish oil platforms reporting 20meter plus waves, perhaps at the moment of calculation ) Help! someone knows the secret, please enlighten, To me it is like taking one grain of rice out of billion million tons.
Lots of averaging!
Most of the sea level rise is in the assumptions of things like isostasy and ‘glacial rebound’ not to mention the satellite metric assumptions. Sea level rise and inundation have been a scare tactic for centuries – think of Noah’s flood or Atlantis. Perhaps some kind of race memory dating back to the release of the water from Lake Agassiz and the flooding of Doggerland and the inundation of the Mediterranean and Black Sea ‘valleys’
When you are an alarmist ‘end is nigh’ soothsayer you can’t help yourself from adjusting your figures to accommodate your religious belief.
There is also the effect of air pressure.
http://www.smhi.se/en/theme/air-pressure-and-sea-level-1.12266
” Higher air pressure gives lower sea levels: an increase in air pressure of 1 hPa lowers the water level by 1 cm.
Sea level varies from day to day and week to week, depending on the weather situation. Air pressure has a direct influence on the sea level.
High air pressure exerts a force on the surroundings and results in water movement. So high air pressure over a sea area corresponds to low sea level and conversely low air pressure (a depression) results in higher sea levels. This is called the inverse barometer effect.
The average sea level during a year is 0 cmPGA and the average air pressure is 1013 hPa. Since the air pressure normally varies between 950 and 1050 hPa during a year, the expected variation in sea level due to air pressure is between +63 cm and -37 cm around mean sea level.
Water levels at a particular location are not only affected by the local air pressure but also by other factors, so this simple correlation is rarely observed.
Sea levels in north-western Europe are often high during autumn and winter when there are frequent depressions and strong westerly winds, but low during the spring and summer when high pressure and gentle winds dominate.
The sea surface on the Baltic can slope significantly both from north to south and from west to east. Deep low pressure passages over the Bothnian Bay, combined with high pressure over the southern Baltic can create sea level differences of up to 2 m.”
There is a secret hidden under a pile of BS. We can’t know where we are going because we don’t know where we have been.
If we had 10,000 years worth of totally accurate earth temperature, which we don’t, and divided it by 1 billion years of history, knowing the earth is much older than that, it comes out to 001 %. So all predictions concerning or predicting temperatures are based on a tiny tiny portion of history, a blink of an eye and useless. The climate will continue to change and we have to adapt to it for survival. Hopefully it will happen slowly enough to give us a chance.
“There is also the effect of air pressure.”
Aha! That explains why Florida isn’t under water. The weight of atmospheric carbon is keeping the sea level down.
To some extend its like a big bathtub IMO, yes the water sloshes around but it can be determined and should be more or less the same all over the bath…
These folks think they are the opposite of King Canute and command the sea to rise…..
Part of the sea level rise that causes storm surge in a hurricane or tropical storm is due to the lower barometric pressure in the center of the storm.
Global Tide gauge records on geo stationary land show about 2mm per year. IMV, this is the most accurate estimate, stillcaffected by 18 year lunar cycles.
There is no measurement of sea level to mm accuracy. It is based on gross measurement to about a half foot, then two values over time are taken, and the difference is computed to significant digits unrelated to the measurement.
I know the US Navy takes rather precise measurements of things like Ocean Height and Gravity Potential maps to allow SLBMs to hit what they are shooting at, thousands of Nautical miles away, but they have a reputation of being stingy with nuclear secrets. I rather suspect if any US Government agency could really make ocean sea-level measurements that accurately, they’d never be allowed to publish them.
I expect sea levels to deaclerate with sun cycles 24-27.
Why? What does sea level rise and fall have to do with these yet to be predicted cycles?
I fear we will be paying the “social cost of stupidity” for some time.
I really don’t trust any of the sea level rise rates…
Unless the rock I live on is rising….
Even the United Nations does not believe in significant sea level rise.
See my blog at http://www.thedemiseofchristchurch.com https://thedemiseofchristchurch.com/2016/05/06/un-headquarters-and-usd1-2-billion-upgrade-and-rising
Cheers
Roger
http://www.thedemiseofchristchurch.com
Since the world average of sea level rise is 1.74mm per year, or less. The east coast US sea level rise is around 2.3mm per year, that would mean the US east coast is sinking adding to the rise. Florida in parts likely also sinking faster with their higher rates.
The best current estimate from Nils Axel Moerner is ~2.2m/yr. this comes from ~40 PSMSL tide gauges with a differential GPS vertical land motion correction within 10 km. The problem with all the ‘arbitrary’ TG subset selections ( like the ~1.7mm/yr you cite from Church and White 2011 is still suspect because an arbitrary selection of geostationary by opinion gauges. There are also decadal regional variations, so some selection bias is inherent.
Mm, not m. Duho!
The 1.74mm comes from a number of studies over the last 20 years. Starting with Holgate. Recent studies seem to show a slowdown below that value as I noted below.
That 1.74 mm/yr figure (variously estimated at 1.7 to 1.8 mm/yr) includes the addition of 0.3 mm/yr estimated GIA, for the rate at which Prof. Richard Peltier estimates that sea-level would be falling, due to continued sinking and broadening of the ocean basins, because of loading from meltwater added to the oceans from the great northern ice sheets circa 10K years ago. In other words, 1.74 mm/yr is not the global globally averaged rate of sea-level rise, it is an estimate of what the rate would be were it not for the presumed sinking and broadening of the ocean basins. The actual global average rate of sea-level rise, from measurements, is at most about 1.5 mm/year.
I agree ristvan. It appears Church and White selectively picked guages to arrive at a higher rate. I mean they used a large number of sites which normally would have been sufficient to approximate the average. But their numbers diverge from the average or a random sample so they must have done some selection. Even the climate science guys who purport to be objective, are not in fact whenever you dig into methods and numbers.
Just noting that I ran the numbers on the GPS stations around the world and, sure enough, the coastal GPS stations are rising by about 0.3 mms/year on average.
So I consider the glacial isostacy number of 0.3 mms/year to be the right number. Everything connected to climate science needs to be double-checked and verified through other methods but once in awhile they turn out correct.
Bill, a couple of years ago, during the NC sea-level kerfuffle, I looked briefly at CORS data for vertical land motion in the vicinity of NC’s tide gauges. Frankly, the data looked like garbage. The numbers were all over the place.
Maybe it’s better now, but the bottom line is that I don’t trust claimed sub-millimeter precision for attempts to determine vertical land motion from GPS data. Maybe if the GRASP mission ever flies it will improve matters.
Note that even Hansen & Sato are now using 1.4 mm/yr as the pre-satellite, post-1930, 20th century global average rate of SLR, from tide gauges:
http://www.columbia.edu/~mhs119/SeaLevel/SL.1900-2016.png
Inexcusably, they cut off the tide-gauge graph in 1993, and splice a satellite altimetry graph onto the end, in place of the rest of the tide-gauge graph. That’s the old “IPCC sea-level nature trick,” which obscures the fact that the two very different sorts of measurements produce very different numbers, and which gives the misleading impression that the rate of sea-level rise suddenly accelerated in 1993, when the satellites started measuring it.
daveburton,
Sonel.org is the main organization tracking the GPS stations.
You can go here and maybe look around a little at the other material on the site.
http://www.sonel.org/-GPS-.html
I have a recollection that North America continent is actually rising as a result of the loss of the massive weight of the glaciers. Don’t know if this extends as far South as Florida.
The ice sheets depressed the crust into the mantle. Along the edge of the ice sheets, the displaced mantle pushed the crust upward. While the area under the sheets is still rebounding, many of the surrounding areas are still subsiding.
Canada rising while lower u.s. states sinking. The continent is a teeter-totter along the north-south axis with a huge load of ice on one end which is now gone. ‘Swinging’ back to ‘level’/baseline.
Florida, the Carolinas, up to Jersey are all sinking. I haven’t checked north of that. The Mississippi delta is sinking fairly rapidly due to sediment loading. The GPS station at the Grand Isle, LA Coast Guard Station is sinking at about 6.5 mm/year for the duration of the record (slightly over a decade). By comparison Atlantic City is about 1.6 mm per year land subsidence.
The GPS records are not long for most tide gauges, where they exist at all.
“Don’t know if this extends as far South as Florida”
It does not. To the contrary the eastern US is sinking as the “forebulge” squeezed up by the Laurentide ice is slowly flowing back to the rising area centered on Hudson Bay. The “Zero Line” is in Nova Scotia.
You are absolutely correct. These fraudsters never distinguish between sea level rise and isostatic adjustment (which includes isostatic rebound from glacial melting and subsidence from delta sediment loading). Actual sea level rise (from melting continental glaciers & pumping aquifers) is 1.6 mm to 1.9 mm per year. Places experiencing more (or less) than this are responding to isostatic or tectonic forces, not rising sea levels.
Louis:
You are “absolutely” incorrect.
But what’s new here.
“On a global basis, glacial isostatic adjustment (GIA) is one of the most modelled of the geophysical signal present in tide gauge data. The plot to the right shows Prof. Richard Peltier’s prediction for tide gauge rates from the one degree resolution, ICE-5G (VM2) solutions given below. This map shows a number of features of GIA predictions for relative sea level (RSL; the sea level as measured by tide gauges) rates, and the colour bar was chosen to highlight far field features. ”
http://www.psmsl.org/train_and_info/geo_signals/gia/
You just have to love the way models are used to trump observations and activist predictions based on models get published without corresponding actual observed sea level rising rates.
A false scientific method that factually abuses scientific method concept.
Again, predictions have yet to be verified while direct observations have not been disproved.
And this 1.74mm comes from rocky dust and silt deposits to the ocean. World ocean has 362 millions km2. That means we need 362 km3 of silt to raise world ocean 1mm.
According http://www.ecology.info/amazon-barrier.htm
Amazon only is bringing 1.3 billion metric tons of silt to ocean yearly. This is around 650 km3 of stuff. This alone corresponds to 2mm world ocean rise per year.
Amazon silt deposits are largely, if not entirely a local phenomena.
Amazon silt builds delta land and tidal estuaries. As New Orleans and the Mississippi River demonstrate so well, when the river is curtailed by dikes, the existing estuaries and delta land are destroyed by the lack of fresh silt.
As long as the Amazon is moving quickly, silt stays suspended. When the Amazon river flows into it’s delta bay, the water is greatly slowed and siltation occurs. Estuaries include convoluted tidal creeks and bays that further work to trap silt.
Instead of raising sea level, the silt builds delta land keeping it relevant to sea level.
Blue water, ocean water so clear that depth visibility is amazing, still circles the Amazon’s outflow. Again, a wall of water that slows and impedes Amazon river water causing remaining silt to fall out of the water column.
Opposed by evaporation, oceans and land remain in relative equilibrium. As so many dried salt lakes worldwide and even the Mediterranean demonstrate; without significant fresh water inflow, waters increase in salinity eventually drying up.
Hmmm…not so sure of the maths here.
If the sediment sinks, it must be more dense than water.
But let us assume that it is equal for the moment, to simplify the calculation.
One cubic meter of water weighs about one metric ton, depending on the temperature.
Given the initial assumption, it is close enough though.
So one cubic kilometer of water weighs one billion metric tons (1000 cubed)
So one cubic kilometer of sediment must weigh over one billion tons.
So the silt from the Amazon must be less than 1.3 cubic kilometers.
Where does the 650 cubic KM come from?
I see from the linked table that the density of silt is nearly 3, meaning 3 times the density of water.
So, it seems that 1.3 billion metric tons of silt is less than 0.5 cubic km.
Correct me if I am wrong, slept late and only one cup of coffee.
But it seems intuitively obvious that silt from one river is not raising sea level by 2 mm per year, even if none of was deposited above sea level as noted by ATheoK.
Oops…linked table:
http://agriinfo.in/?page=topic&superid=4&topicid=271
Another way to look at it is by relative surface area. The Amazon basin surface area is given as 6.92 million sq km, and the ocean surface as 360 million sq km, or about 1/50th as big.
So the entire Amazon basin would need to be eroding at an average of 100 mm per year for this to be true.
In a hundred years, that would be 10 meters!
Peter January 15, 2017 at 6:11 am
“And this 1.74mm comes from rocky dust and silt deposits to the ocean. World ocean has 362 millions km2. That means we need 362 km3 of silt to raise world ocean 1mm.
According http://www.ecology.info/amazon-barrier.htm
Amazon only is bringing 1.3 billion metric tons of silt to ocean yearly. This is around 650 km3 of stuff. This alone corresponds to 2mm world ocean rise per year.”
Thanks. Even if, as noted questionable, but accepted for now, the silt has a density (similar to, but marginally higher than salt water; thus, say, 1040 Kg/m3 [ounces per cubic foot] – ref Menicholas, below
“If the sediment sinks, it must be more dense than water. But let us assume that it is equal for the moment, to simplify the calculation.”) about like water, your 362 km3 of silt, raising the oceans 1 mm/year must lighten the load on continents, too.
This gets difficult.
I don’t know how much meteor and meteorite dust is added to the oceans each year, for example.
I doubt if it is a cubic kilometre each year. [Argument of personal disbelief! I know!].
Auto
Build on a swamp, die by the swamp.
Here is a recent paper on the subject.
http://www.klimarealistene.com/wp-content/uploads/2016/02/1-s2.0-S0964569116300205-main.pdf
Why does NOAA not show “observed”, “actual”, or “historical” on Figure 3? Is it because the vast majority of readers would immediately see that the NOAA projections are BS?
+1
Three guesses, Fred!
The essay suggests the NOAA originator of the projections in the referenced article should resign. He/she/they obviously have no personal or professional integrity and will not resign. They should be fired for cause immediately for incompetency and scare mongering.
One of the arguments advanced so often on the Left is that freedom of speech does not extend to the freedom to cry “Fire!” is a crowded theatre.
Do unfounded images of the entire planet being engulfed in a conflagration not qualify?
Here’s St. Pete, with the latest data:
http://sealevel.info/MSL_graph.php?id=8726520
It experiences some subsidence (not climate-related, Peltier estimates about 0.5 mm/yr, which probably on the low side). It is also one of the small minority of gauges which shows a slight acceleration, much of it due to a spike in the 1940s (at the beginning of the record).
Here’s Key West’s much longer record, where you can also see the 1940s spike in the context of the longer, much more linear trend:
http://sealevel.info/MSL_graph.php?id=8724580
Its 113 year record has seen no statistically significant acceleration.
Much of the St. Pete acceleration disappears if you look at just the last 60 years:
http://sealevel.info/MSL_graph.php?id=8726520&c_date=1956/12:2019/12
The linear fit at St Pete is now +2.97 mm/year ±0.30 mm/year.
Here it is projected to 2100:
http://sealevel.info/MSL_graph.php?id=8726520&g_date=1900/1:2099/12&c_date=1956/12:2019/12
Projected level at 1/2100 is 0.243 meters above current level (9.6 inches).
Experience has shown that such apparent accelerations are transient, due to the ocean sloshing, and linear projections are much more predictive than quadratic. Nevertheless, here’s a quadratic projection:
http://sealevel.info/MSL_graph.php?id=8726520&g_date=1900/1:2099/12&c_date=1956/12:2019/12&linear=0&lin_ci=0&quadratic=1&quad_ci=1
Projected level at 1/2100 is 0.563 meters above current level (22.2 inches). Realistically, that should be considered an extreme high-end projection, but it’s approximately equal to NOAA’s “Int Low” projection.
NOAA Int High and NOAA High are just plain delusional.
Clarification: “The linear fit at St Pete is now +2.97 mm/year ±0.30 mm/year” refers to a fit to just the last 60 years of measurement data, which is about a 0.25 mm/yr higher rate than if you include the first few years with the late-1940s bump.
If you view the longer history at the Key West gauge, you can see why I think including the late 1940s bump distorts the long term trend a bit.
Correction #2: Key West’s record is 103 years, not 113.
Ok… I’m gonna point out quite a few things.
#1 We’ve got mangrove swamps around and quite a lot of brackish to mild brackish areas – an increase of even 4 inches would drive the salt quite a bit further inland.
#2 We’ve got salt-water intrusion into the aquifer around Tampa, with the rise in sea level we’ll also have a higher infiltration of aquifer with salt water.
#3 Most of the area East and South of Tampa Bay is flood plain and flood spill – which means that this will have drastic results on drainage systems that were mostly laid out more than thirty years ago.
So while the article is a bit scaremongery, its also going to be a problem.
http://www.livescience.com/40476-florida-saltwater-rise-everglades.html
People also love to live along active tectonic zones, but we never hear from the eco-nutcases about moving all those cities.
I can’t tell much about the other two, but salt water intrusion in an aquifer typically has nothing to do with sea level rise. It has everything to do with subsidence and overdrawing of groundwater.
Now, you may be a special case, but generally, this happens when water wells draw too much water and the water level in the aquifer drops low enough that the water pressure from the sea can push through the ground. It’s also associated with land subsidence, where the land itself sinks. The solution is tight control of water wells.
As the phrase “Tampa Subsidence District” doesn’t come up anything in a search, I’m going to guess you don’t have one. That search does bring up many discussions about sinkholes, I’m going to guess that you have a major subsidence problem.
In short, there is a well known and easy solution to your problem. Stop up the dang water wells and use surfacewater. It’s a painful bullet to bite, but Houston is far better for doing it years ago.
Miami sucks about 360 million gallons of freshwater per day from wells and then dumps its wastewater into the ocean.
You are correct Ben.
In Florida especially.
There is a lot of rain here, and the hydrostatic pressure of the water table keeps out salt if there is no pumping of the groundwater near the coast.
The salt has already long since contaminated the groundwater in Pinellas county.
When I was living in that area in the 1980s, my family bought some land in central Pasco county, which is just north of Pinellas. Our property was just west of the location of what where then some huge new well fields that were put in to supply Pinellas.
Those wells sucked Pasco dry, and some of our neighbors that had lakes in 1982 had, by 1988, docks sitting twenty feet above dry ground that never held water again.
Pinellas is a thirsty place, and the population, which was growing fast in those days, has absolutely exploded in the years since.
BTW, there is no surface water in Pinellas to speak of, except for retention ponds, so that is not an option.
But the area East of Pasco county, known as the Green Swamp, is the source region for all of the rivers and creeks in Central Florida.
They put in those well fields because there was already no more water in Pinellas, and that was 35 years ago.
Actually, to correct a statement I made above…population growth seems to have levelled off in Pinellas in recent years, unlike the rest of the Florida peninsula…I suspect it is because it is completely built out.
Agreed Ben:
What is a concern in many rural areas are large developments that put in their own wells to avoid paying for water.
Golf courses,
Malls,
Commercial shopping developments.
When any of the above are constructed in rural areas, people with generations old wells suddenly find their water in short supply.
Reading some of their “contracts” with the local governments often include clauses where the commercial entity is given the rights to drawing XX acre feet of water annually.
A local group once pointed out to a county board of supervisors, that the board guaranteeing commercial developments technically allows them to suck a local river dry.
There was a lot of stammering, throat clearing and coughing by the supervisors when that point came up. The elected supervisors really hate it when simple math or science illustrates their lack of common sense.
It’s very similar to night light pollution.
Supervisors are focused on promised taxes, while phrases like fashionable signs, reasonable parking lot lights, tasteful architecture floodlights all sound so reasonable.
Then the complex gets built and the beautiful night sky is flooded by excess lighting.
Commercial well kept landscapes and ground covers means the water table will drop.
prjindigo January 14, 2017 at 5:25 pm Edit
We’ve seen on the order of ten inches over the last century … where are the corpses? Where are the tragedies? Yes, there are effects. But they are not what the headline said.
Yes, that is true. But that is true without any acceleration in sea level rise.
1. A prediction that by the end of the century the rate of sea level rise will be twice as high as it has been in 100,000 years is not “a bit scaremongery”. It is a pure exercise in alarmism, is not science at all, and is reprehensible.
2. A four inch (100 mm) rise will be a problem for a few people a few times per year. But not a “severe” problem.
There’s a good discussion of these issues here.
Finally, you post an article about a study of the everglades. Following the article to the study reveals that the authors said (emphasis mine):
And that is ALL THAT THEY SAY ABOUT THE CLIMATE!! The word climate appears once in the study. In other words, nothing … don’t settle for the press release, it’s generally a puff piece full of misrepresentations. Read the study itself.
In any case, that is exactly what I expected to find. Saltwater intrusion into the Everglades has been going on since we foolishly decided to drain them decades ago. Little to do with sea level rise.
w.
And how many hurricanes will hit this area between now and the year 2100?
Will the destroyed homes be rebuilt?
If the example of New Orleans is any guide, the answer is yes. It will be rebuilt, and residents and politicians will all insist that the rebuilding be a national priority.
New Orleans was rebuilt even though the area is the most hurricane prone stretch of coastline in the world, is already below sea level, and sinking more every single day!
The real solution, should this ever really become a problem that needs solving, is to not rebuild in places that are inundated during storms, because it is only a matter of time before it happens again.
Or we could focus on mitigation. The Dutch have kept the North Sea out of their country for hundreds of years, and for most of that time did so with hand tools and wind powered pumps.
Indeed.
The adage I always adhere to is: ‘never buy a house of Watermeadow Close…..’
R
Ralf,
#Exactly.
Similarly; Brookside Walk; Raby Mere; River View [unless distant and obviously downhill]; and even Winter Bourne [which is dry in summer].
Auto
The salt water intrusion has little to do with sea level rise; pumping more water from the local aquifer than is being replaced by rainfall the the main problem. Wells located over a larger area, and further from the ocean will resove this problem. Look at the historical rate of pumping to see the problem.
And people live in tornado prone areas, ice storm prone areas, earthquake prone areas, drought prone areas …… so what’s your point? People shouldn’t live anywhee?
NOTHING of what you, not one of your points has anything to do with or is caused by sea level rise, much less “human caused” sea level rise.
The continually accelerating curves show the absurdity of these projections. It would not be long before the NOAA High was running vertical. Noah’s flood Mark II.
To reach the 2 meters by 2100 the rate of acceleration would have to be 4% per year. That means by the year 2099 sea level would have to rise more in that year than in the entire time of the 20th century.
Whew! I live just south of Tampa Bay and am about 2 miles from Sarasota Bay – was worried that the article’s reported sea level rise might make it only 1.99 miles to the Bay.
I almost put my condo up for sale!
Thanks Willis. If you are ever n this area I’ll buy you a beer.
Done deal. Might be a while, tho …
w.
No problem. We have some reasonably good craft brewers here, so the beer is always fresh.
I would.
Ten years from now it will be unsaleable and uninsureable.
Griffed yourself again there didn’t you?
How are those polar bears?
A *lot* of nonsense numbers make it into publication. I mean, this is a real problem in our information-driven world. The false overwhelms the facts (and even the educated guesses).
Willis any chance of overlaying Mean Sea Level Trend Florida with Relative Sea Level Change Projections charts for an eyeball comparison?
PS:Love your work btw!
You all might enjoy this: https://pjmedia.com/blog/nasa-nonsense/
It is exactly this sort of dissection of alarmists “scientific” claims. That Trump should have at hand when he rounds on them to cut the “green blobs” funding. Simply turning off the funding tap and delivering purile put downs will not suffice. He has to do it with hard evidence that will be in most cases, already made available by the alarmists! As it us here.
Their retaliatory arguments, in this case, would be embarrassing to say the least. It is the rentseekers own historical data tbat “convicts” them.
Quite a few global warming claims actually come down to an inconvenient look at the tide gage record. Unusually large amounts of warming…well that would cause unusual levels of sea level rise, so nope. All that greatly accelerated ice loss…nope, water doesn’t appear to exist. “Missing” heat going into the ocean…nope, we’d notice that as sea level rise. You can probably think of some others.
It gets worse. PSMSL.org shows sea level rise from tide gauges and, for the Tampa area, land subsidence by GPS. The GPS system in use from 2001 to 2007 shows the land near Tampa is sinking at a rate of about .3 mm/yr. That GPS station was shut down in 2007 and replaced with a new (?) system. It shows land subsidence from 2007 to 2014 (the latest data shown in PSMSL) at a rate of 1.55 mm/yr. Thus the tide gauge at 2.6 mm/yr is really only 1 mm/yr of actual sea level rise.
Thank you for summarizing the shrill words, chaff with maybe a few grains of useful wheat. The various agencies need to be taken at their word for what sea level rise any of them might have used for actual construction. That would be the real test. And fortunately about ten years ago, various federal and state agencies partnered in construction of a levee to keep Pacific Ocean at bay. The design sea level rise was (National Council Marine Board, 1987):
5 years from 1987 = 1992 0 ft
25 ” = 2012 0.2 ft
50 ” = 2037 0.5 ft
100 ” = 2087 0.9 ft
If one does a nonlinear extrapolation to the 2100 endpoint used by most of the climate camp followers, one gets about 1.3 ft. Interestingly, one finds that the extrapolation curve is concave downward, i.e., sea level rise is decelerating.
If you bring this up to any of the camp followers, you will get various responses like sea level rise will be lumpy, or any difference between what you see with your lying eyes and what the computer models show can be attributed to “latent sea level rise”. I think latent sea level rise lurks down there in the abyss with Missing Heat, Missing Cold, Bathybius haecklii, and Polywater.
This problem with local councils, or similar is not new. We had the same problem a few years back on the South Coast of NSW, where the recorded sea level rise is about 1 mm/year. The local council believed the NOAA predictions were likely to come to pass, but they settled for an intermediate figure. Parts of the east coast of the US may be sinking as northern parts show glacial rebound which makes 2.5 mm/yr realistic. However, some safety margin is required for storm surges particularly at high tides.
So what about this recent SL study that found that the world’s coastal areas had increased over the last 30 years? So how is that possible if we have experienced their so called CAGW over this same period of time? So where is their SLR? Something just doesn’t add up.
Willis or anyone else care to provide an answer? https://wattsupwiththat.com/2016/08/30/earths-surface-gaining-coastal-land-area-despite-sea-level-rise/
It measures areas that are ‘wet’ or ‘dry’. So it sees paddy fields, new water reservoirs, and other irrigated areas as ‘sea’, and when those areas dry up, it sees them as ‘land’. Simple really.
Erosion moves a lot of material . . ?
The real good news is that, according to Roy Spencer, here is a good chance of John Christy being appointed to head of NOAA… In his Facebook page he wrote:
“It now looks like my co-conspirator (and boss) John Christy is being floated to head NOAA. I can’t see any other reason for his name to be mentioned in this new article by James Delingpole (James will probably neither confirm nor deny his intention– wink wink nudge nudge). John has said it’s the only position he’d consider taking, and I recommended him for it to two Trump transition team members. The downside is we really need him here in Huntsville…but he’d do a great job as NOAA Administrator.”
It seems John Delingpole has the hint:
http://www.spectator.co.uk/2017/01/stop-worrying-about-trump-hes-going-to-beat-the-green-blob-and-be-great/
Great post Willis, follow your link
http://www.wtsp.com/news/local/study-sea-level-rise-may-severely-impact-tampa-by-2040/379718201
back to the original article and open the comment section to find my post late last year that says:
*****************
The advisory board concluded that the region could experience sea level rise between a half-foot to 2.5 feet of sea level rise by 2050.
2.5 feet by 2050 comes to 23 mm/yr. The overall rate of sea level rise at the St. Petersburg tide gauge
http://www.psmsl.org/data/obtaining/stations/520.php
since 1947 is 2.7 mm/yr. The obvious question to ask is when will the bump-up to as much as 8 times the current rate going to begin to happen?
Steve Case – Milwaukee, WI
*****************
I do a daily news search on “Sea Level” and if there are any comment sections on articles found by the search I will usually have my say. What I find is typically an exaggerated extrapolation of sea level rise out to some time in the future, usually 2100 sometimes sooner with rates of sea level rise that clearly are not possible. I’ve been doing this for a few years now, and I’m finding that comment sections are disappearing and being replaced by Twitter and other social media links.
Sea level rise is probably the biggest scare the Warmunists have. I hope that the over the top exaggerations appearing in the popular press are brought to President Trump’s attention.
The 2014 Leclercq et al world glacier study also found that there had been a SLOWING OF RETREAT since 1950. So where is the fabled impact of increased co2 emissions over the last 60+ years?
http://hockeyschtick.blogspot.com.au/2014/04/new-paper-finds-worldwide-glacier.html
Willis …. some additional area sea level info for Tampa/St Pete guages:
https://tidesandcurrents.noaa.gov/sltrends/residual1980.htm?stnid=8726724
https://tidesandcurrents.noaa.gov/sltrends/residual1980.htm?stnid=8726520
And here is the Key West MSL “variation” graph over 50 years (from 1940) – which illustrates I believe the “rate” of sea level change over time – and that sea level during this 50 year period BOTH increased AND decreased …
https://tidesandcurrents.noaa.gov/sltrends/50yr.htm?stnid=8724580
And the more recent MSL trends:
https://tidesandcurrents.noaa.gov/sltrends/sltrends_update.htm?stnid=8724580
Willis, have you noticed the irony that we get our flood forecasts from NOAA?
Did NOAA ever check with the Dutch? No .. But I remember seeing a map predicting a flooding of Death Valley and Salton Sea.
http://www.pbl.nl/en/publications/the-effects-of-climate-change-in-the-netherlands-2012
The only areas that need to be concerned about rising sea levels are those where the silly local council allowed residential homes be built on land already a sea level 30 yrs ago…..I thought one of those was actuallyTampa, Florida.
Spot on, Willis – and you didn’t even mention that if you had chosen to “cherry-pick” from your first graph (St. Petersburg 1947 – 2015) you could have pointed out several decades with no change in sea-levels, e.g. (circa) 1947-57. 1957-67, 1985-97. Fact is : our projection (or prediction) about the weather over the next decade or decades is pure guesswork. I reckon it will be at least 100 years before we have gathered enough observations to present even educated guesses about that.
“Unfortunately, the costs of this rampant alarmism will be huge, as coastal communities will struggle to comply with a meaninglessly exaggerated risk.”
Back in 1990, I was the lead designer for a major USACE flood control project – The Chehalis River at South Aberdeen and Cosmopolis. The PM and I arrived at the conclusion that the tide gage records for the region had more veracity than Al Gore’s premonitions about sea level rise. The project features were designed to protect the community from the 200 year flood plus one foot for a century worth of sea level rise.
The project was constructed in 1995-6 and has successfully protected the cities without adding height to the levees and flood walls.
(Thus began my demise as a Civil Coastal Engineer/global warming denier… I was then transferred to Construction Division working at McChord AFB where my heresy would be irrelevant.)
The Aberdeen project was completed for less than half of the congressionally authorized cost of $28.2 million. If designers reject the fraud that is global warming and sea level rise, coastal communities need not “struggle to comply with a meaninglessly exaggerated risk”.
I am not aware of any major coastal engineering construction project that will accomodate sea level rise exceeding the historic observed trend. In fact, in my home town of Seattle, they are currently rebuilding the seawall and it is the same height as the original 1930-era seawall.
The emperor has no clothes!
The ice over Buffalo, Chicago, Seattle, and many other low elevation and low latitude places has already been melted. Warm rain does a good deal of erosion of ice. Let’s call that the easy ice to melt. While the “easy ice” was melting the ocean rose rapidly.
When only not-so-easy ice was left the rate of sea level rise slowed.
Expect this sort of thing to continue. Sea level rise should slow.
Until a miracle happens!
While looking for that “Post-Glacial Sea Level Rise” chart, I came to this site:
Holy Cow!
The first chart therein is the one I was looking for.
However, scroll down to the map: “Cities Below Future Seas”
There is a set of years under the heading “Lock-in Year”
Put the pointer over 2012 and look at the bar on the right side, near FL & GA. This is the “cannot avoid” or “committed” sea level rise based on “climate pollution” now in progress.
For 2012 that unavoidable rise is 4 ft. 3 in. – but it doesn’t say when.
Note the States shaded on the map and, also, the Threatened Cities sliding bar.
Move the pointer over the years and watch the changes.
Why an entire state changes colors baffles me. Holy Cow!
Has anyone determined with any accuracy how much sea beds have sunk since the ice sheets melted? Much of the weight that depressed the continental crust is now bearing on the oceanic crust. It’s distributed over a much larger area, but that area has a much thinner crust.
And how exactly could the entire oceanic crust of the Earth be depressed?
Either the entire planet would have to compress, or the continents would have to rise.
Let’s have a look at what the sea level is doing out in the middle of the largest plate of oceanic crust on Earth, the Pacific plate, eh?
In the center of the plate are lots of seamounts, and on top of these are lots of coral atolls. If the crust was sinking into the mantle, these seamounts would all be sinking along with it.
Looking at these places would also seem to remove a lot of the uncertainty of continent based tide gages which may be affected by subsidence from ground water extraction and other causes mentioned above, no?
So it may be that the central Pacific is where we might look to see what the world ocean is really doing.
Kiribati:
https://tidesandcurrents.noaa.gov/sltrends/sltrends_global_station.htm?stnid=750-012
Thanks for the reply.
It isn’t necessary for the entire oceanic crust to depress in order to accept more water volume. The deeper the water and thinner the crust, the more compression. Obviously, where volcanoes rise in the mid-Pacific is where mantle is being pushed out. There are estimates of crustal thickness over land, but I can’t find any under oceans. Surely plate malleability is not uniform.*
It does not follow that entire continents would have to rise. Continental crust east of the Cascadia subduction zone and the Aleutian Trench is rising (sea level change at Skagway -17.59mm/yr).
Does the mid-Atlantic ridge expand faster when sea level is high?
Consider also that as volcanic activity adds mass to the edge of continental plates surrounding oceanic subduction zones, that mass applies more downward pressure on the plate that is subducting,
As Spielgel Online reported in 2012**, some South Pacific Islands are sinking. But it is due to subduction, NOT to rising sea level as claimed by the UN when they declared islanders “climate refugees.”
* http://news.rice.edu/2014/08/27/pacific-plate-shrinking-as-it-cools/
** http://www.spiegel.de/international/world/south-pacific-islands-threatened-by-more-than-just-rising-sea-levels-a-838675.html
The mechanical incompressibility of rock is notable, even if the rock is in a semi-molten state.
I do not think a few hundred feet of water can decrease the diameter of the earth. And if the diameter is not decreased, then any downward movement in one place must be matched by an upward movement somewhere else of equal volume. So the net change from the weight of the water would have to be zero, absent an actual increase in the density of the material below.
BTW, the thickness of oceanic crust is generally considered to be about 10km on average.
The Wikipedia entry on ocean crust may be a place to get some valid general info, as this is a noncontroversial subject.
It seems that there is no place where the ocean crust has been drilled through to get a complete cross sectional analysis.
https://books.google.com/books?id=WA9ST5S_2v0C&pg=PA44#v=onepage&q&f=false
A 6 inch to 2.5 feet sea level rise in that time frame should be called what it is, A Bald Faced LIE.
Philip January 14, 2017 at 11:07 pm
Philip, I beg to disagree. A lie implies an intent to deceive. We don’t know what is going on in the minds of the NOAA scientists.
The Paul Simon song says:
I suspect that some combination of that kind of deafness plus what is called “noble cause corruption” is more likely than deliberate lies. Noble cause corruption is insidious. It starts by just shading things a little, which is justified as being OK because they’re saving the world. And there is no more noble cause than saving the world.
From there noble cause corruption is joined by confirmation bias, which is when someone does not test or question things that fit with their beliefs. And in short order, there people are, blithely predicting a huge, never seen rate of sea level rise, and convinced that they are doing noble, even holy work.
But that’s just my guess, and it’s no better than your guess that it is a deliberate lie. My own rule is, I try to avoid ascribing motives to other people’s actions. I do this for a simple reason—I’m often not aware of my own motives until after the fact, sometimes years after, and some motives I’m sure I’ll never be aware of.
So how well would I do figuring someone else’s motives?
In addition, I do my best to avoid calling someone a liar unless I have hard and demonstrable information that they knew what they were saying was untrue. Not always successful, I’ve been known to intemperately wax wroth (to my own cost), but that is indeed my aim.
Best to you,
w.
Willis E, I wholeheartedly agree with you. The rhetoric in the climate wars has been ratcheted up to an alarming degree. Calling someone a liar, in the old days, would land you in a duel. Now it’s commonplace and certainly shouldn’t be.
Willis: “We don’t know what is going on in the minds of the NOAA scientists.”


I tried to replicate the thoughts. I downloaded the data http://www.psmsl.org/data/obtaining/stations/520.php and calculated a 22a Loess smooth:
Then I calculted the annual deltas ( The change of Sealevel) of the smoothed data:
and extrapolated the rise of the last 10 years (red).
After integration the SLH looks like this:
and voila: 1m SLR to 2100!
best
That is a fantastic analysis! Fun with statistics and graphs! And, of course, the “researcher” sees nothing wrong with torturing the data until he gets the answer he wants.
rxc: That’s just what they have done essentially. They extrapolated a SLR and integrated it for the forecast. More or less meaningless, anyway: they got it reviewed! This is the real problem IMO!
In the early 18 hundreds the British navy was tasked with world wide exploration and scientific studies.
Around the coast line of Australia from the bottom to the top they found protruding rocks at low tide and carved a low tide line on them and the date. Those rocks still show the same level at low tide, the navy called them dry rocks. Seems that Australia has had very little in the way of ocean rise, must be only the northern oceans that are getting deeper.
There is photographic evidence from lots of sources and lots of places that show little if any noticeable sea level rise in the past hundred years.
I suspect that the tide gage data has been adjusted.
I have a collection of photos from locations all around South Florida, like Lummus Park in South Beach, Brickell Key, Fort Lauderdale, and Key Biscayne, to Cape May in New Jersey, to La Jolla in California, in which it is impossible to see any difference at all in the location of the ocean in pics from 100 years ago to the same place today.
Distinctive landmarks, rock formations, streets, homes…all are in the same place in relation to the ocean as they were many decades ago.
Brickell Key, for example, was a pile of sand in Biscayne Bay that was deposited as a spoils pile when Henry Flagler dredged the Miami river in 1896. It is still right where it was, but in the past few decades it has been the site of some very expensive development now that sand pile holds billions in newly built real estate.
Brickell Key, then (1928) and now:
http://miami-history.com/wp-content/uploads/2013/01/1928_Aerial_Miami_Downtown-300×240.jpg
http://ralphmagin.piggybackblogs.com/files/2013/07/BK3.jpg
Lummus Park:
http://the305.com/blog/wp-content/uploads/2013/12/normal_lummus_park.jpg
http://i.ebayimg.com/images/i/360610288257-0-1/s-l1000.jpg
http://www.playle.com/KDL/56475.jpg
http://oliom.com/blog/wp-content/uploads/2014/11/Lummus-Park-Miami-Beach.png
BTW, look at the cars.
I suspect the only difference in the next hundred years will be that the cars will be Jetsonmobiles by then.
Closer to the location of this article…the Don Cesar hotel, built on St. Pete Beach in the 1920s and still about as far from the Gulf as it was then…in fact, it looks further away and higher now!
Special place for me…I spent a week there just before I started my first classes at USF back in 1982.
Check it out:
http://loewsmagazine.com/wp-content/uploads/2014/04/pr08361-edit.jpg
http://i2.cdn.turner.com/cnnnext/dam/assets/151006122340-loews-don-cesar-super-169.jpg
Menicholas: Beaches are not permanent features of the coast. Have you ever heard of beach sand replenishment? The width of beaches in rich communities is mostly under the control of man, not sea level rise. Elsewhere, the width and location of beaches is constantly changing with local currents and weather. Unfortunately, these pictures are meaningless.
The critical feature is how far the ground floor of the pink hotel is above mean high tide. They can add as much sand as they want to the beach (10 feet if necessary), but no higher than the ground floor. The hotel could end up totally surrounded by water and still have a beach this wide.
http://www.miamidade.gov/environment/beach-renourishment.asp
http://www.pinellascounty.org/environment/coastalMngmt/nourishment.htm
Of course, beaches can be flat or steep.
But it can be seen from these photos that back in the 1920s the beach was not steep.
The ground floor of the hotel was not very high above the sea.
And tides on the Gulf in this area are slight, less than two feet ordinarily.
They may be meaningless to you, but they show what they show.
Maybe we are supposed to think that the oceans will sneak up on us, just like the roasting hot temperatures that will cook us…it will seem like nothing is happening, but then, suddenly, it will be like Sir Lancelot storming the castle in PMatHG:
https://youtu.be/GJoM7V54T-c?t=42s
Evidence of adjustments to sea level trends?
Steve Case is on the case, Menicholas.
The individual tide gauge measurement records are very linear, and average at most about +1.5 mm/yr sea-level rise. But the satellite altimetry is another matter entirely, and some of the composite “averages” are badly muddled up with adjustments, fudge factors & the use of gauges with inappropriately short measurement records. Here’s a quote from what is probably the most famous sea-level paper of all:
But I think the situation with temperatures is much worse. Dr. Kevin Cowtan made a video arguing that the adjustments were insignificant, but in that video he briefly showed a graph which I screen-cap’d and digitized. It showed that adjustments in NASA GISS numbers increased the global terrestrial warming trend by 35%.
Thank you for the reply, Dave.
I don’t think “task” was a verb in the 1800’s. But as somebody said, nowadays, any noun can be verbed.
+1’d!
Thanks Willis. More horseshit exposed. Good work.
One among the oldest tide gauges in the world is that of the Brest harbour in France of which records began by 1845 continuously (except when it was destroyed during WWII) until now.
http://www.sonel.org/spip.php?page=maregraphe&idStation=1736.php
The level rise was 25cm in 162 years, about 1,6mm/yr. No accelerating trend is perceptible.
Regarding the remote Pacific Islands like the Solomons or the Kiribati where the Greens are focusing the media’s attention about the situation of the so called “climatic refugees”, the site of the Bureau of Meteorology of Australia has a lot of good records since 1992 but one cannot notice any dramatic rise, and the trend is flat elsewhere.
The New Zealand denied the Kiribati inhabitants the status of climatic refugees since the sea level rise has been proven it was due to downwards tectonic moves.
Am I right in thinking that, in the US, it is the Army engineers who are responsible for building sea defences? If so, is this prediction partly based on USACE looking for increased funding?
All parts of the National Government (and most States, also) have been directed to plan for global warming (or climate change). Because all must do this it doesn’t seem to me there is much advantage to any of them.
“Sea defenses” are not common projects in the US. River levies and related structures for flood control have been, and continue to be problematic. See the wiki entry for Atchafalaya River, and therein see ; Old River Control Structure.
One major sea defense was the Galveston Seawall — wiki has an entry on that.
Great piece of work Menicholas – they say a picture is worth a thousand words which is often not true but in this case makes a god point. As photography goes back to the 1840s it would be interesting to compile an archive of “non-adjusted” sea level photography. Before green activists dig out as much evidence of minimal rise as possible. (And yes we all know assessing sea levels is very very complicated).
Tampa Bay is not the only part of Florida that is blighted by bogus prophesies of accelerating sea level rise. Last year the Miami-Dade Climate Change Advisory Task Force published their report, using similar projections. Their sea level graph is below. ?w=900
I did some quick calculations to show the impact of the acceleration in the rate of sea level rise that these projections imply.
The “Miami-Dade Climate Change Advisory Task Force” used figures for Key West Florida. Given that it is not too far from St. Petersburg, the rate of sea level rise is about the same, along with a lack of acceleration in the rate of rise. ?w=900
The NOAA US sea level charts is easily accessed at the link below, along with the supporting data.
https://tidesandcurrents.noaa.gov/sltrends/sltrends_us.htm
It does appear that the increases have been more stepped than linear, if this data can be trusted at all.
Notice the peak reached in the late 1940s, was briefly topped only for a few years in the early 1970s, and then not until the late 1980s.
Even after that, it was not until after the year 2000 that the trend line crossed this 1940s peak, and there have been several years in the past decade that were under the 1049s peak.
That is one slow trend, with the year to year variability as great as nearly a century of the overall trend.
If the numbers can even be trusted.
Considering the shenanigans we know are being perpetrated by NOAA with regard to other data, and taking into account graphs that were published in the 1980s showing no such smooth and steady trend, I think it is prudent to be skeptical of anything they offer.
Acceleration of sea level rise, acceleration of global temperature increase, acceleration of glacier mass loss … all these and more result from spurious “positive feedbacks,” and unknown or willfully ignored damping mechanisms.
Small deceleration of sea level rise was reported in 2011-
HOUSTON, J.R. and DEAN, R.G., 2011. Sea-level acceleration based on U.S. tide gauges and extensions of previous global-gauge analyses. Journal of Coastal Research, 27(3), 409–417. West Palm Beach (Florida), ISSN 0749-0208.
From the abstract-
“To determine this acceleration, we analyze monthly-averaged records for 57 U.S. tide gauges in the Permanent Service for Mean Sea Level (PSMSL) data base that have lengths of 60–156 years. Least-squares quadratic analysis of each of the 57 records are performed to quantify accelerations, and 25 gauge records having data spanning from 1930 to 2010 are analyzed. In both cases we obtain small average sea-level decelerations. To compare these results with worldwide data, we extend the analysis of Douglas (1992) by an additional 25 years and analyze revised data of Church and White (2006) from 1930 to 2007 and also obtain small sea-level decelerations similar to those we obtain from U.S. gauge records.”
As usual, Willis, a great read.
As someone without advanced education in the field and who can only make inferences based on what little common sense I may possess, wouldn’t a rise in sea level require either a source of water (volume) or a rise in the sea floor? Whence either?
How much could sea levels rise if the polar ice were all to melt? How much heat would be required to melt them? At what rate is it plausible for such heat to be applied?
How much would the oceans have to warm to cause a detectible increase in sea levels through expansion? Again, where would the heat originate?
How fast is it possible for the depth of the oceans to decrease? Is a rise in the sea floor somewhere necessarily offset by a sinking of the sea floor elsewhere? Why would the sea floors rise and not the continents? Would that be the same as the continents sinking? Is there any evidence this is happening now?
I haven’t the knowledge in physics or geology to be able to even know if these are the right questions to ask in evaluating whether a sudden increase in sea level rise is possible — I would be humbly grateful if someone on this site who is smarter than I am (which doesn’t necessarily narrow the field much) would spend a few minutes enlightening me and perhaps one or two others.
Thanks!
Ron,
There is a search box on the right side and down just a little from the top.
Put ‘sea level rise’ in the box, hit Enter and there are lots of things to read.
Many people reading here at WUWT have looked at many (most) of these over the last 8 years and are not likely to review them, for 3 reasons.
There is new stuff to read.
We don’t consider that rising ocean levels will be a problem — that being the point of this Willis post.
You are quite capable of doing the reading.
Thanks, John!
There is something called the closure problem. To a first order approximation, SLR should equal the sum of thermosteric rise plus ice mass loss from Greenland and Antarctica. (Remainingnuncertainties include flobal GIA ~0.3, groundwater extraction nypothesis (I think silly on then whole, see essay PseudoPrecision, and siltation of the seafloor (e.g. Rain of calcareous algal exoskeletons eventually forming limestone and chalk,) We know the former from ARGO from ~2005 on; prior estimates are problematic. We know the latter from GRACE and Icesat. It turns out the pre 2013 Antarctic ice mass loss estimates were biased high because of a faulty modeled GIA. When diff GPS actual measurements were plugged in 2013, GRACE says a small annual loss while IceSat (Zwally 2015) says essentially zero. There should be some loss due to ocean contact basal melting.. Net about 0.6mm/yr, which leaves ~Greenland at about 1,0mm/yr (Hansen 2012, but Geeenland varies by decade). . ARGO thermosteric rise is ~0.6-0.7 (papers very, this is their ‘average’, range 0.5-0.9). Ice sheet mass loss sums ~1.6. Papers vary more, but all the pre 2013 Antarctica stuff has to be reworked. Sum 2.2-2.3 foots nicely with Moerner’s diff Gps corrected long record PSMSL estimate from 2015 showing no acceleration. Might be high, but foots.
And shows the sat alt estimates are biased high by about 1mm/yr. They in no way close. Three papers highlighted in essay PseudoPrecision that ‘close’ by cherry picking time frames and estimates. They are mutually inconsistent, so not credible. Acceleration is manufactured (e.g. By CSIRO) by slicing too high sat alt onto tide gauges starting 1981.
I recall reading a report regarding the draining of the Aral sea and it’s effect on sea level, so there may also be surface water drawdowns contributing to any sea level rise. There may be other surface bodies of water that have diminished significantly, although there may also be increases in others. In fact, if one considers rivers which have been dammed to created reservoirs, that is one place where water has been sequestered over the past hundred years or so, although that may be a tiny amount compared to the oceans.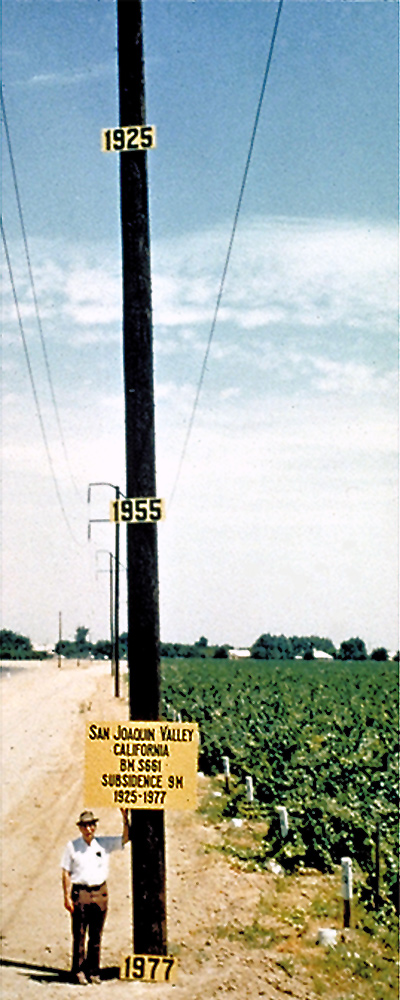
But certainly ground water removal, and not just near coastal zones, has been quite significant in lowering the ground levels on a widespread basis. Central California valley comes to mind.
Some dramatic photographic evidence exists:
http://3.bp.blogspot.com/-yzJ7ouoWWII/T41byHEPOeI/AAAAAAAAADo/EfK1AP3q6Qo/s1600/Aral+Sea.png
I realize that looking at photos may not be considered very scientific, but they can quickly give anyone who looks at them a quick idea of whether or not anything particularly dramatic is occurring. Regarding encroachment of oceans, it seems not, but regarding land subsidence and surface water changes,, it is undeniably occurring at dramatic scales in some places.
“There should be some loss due to ocean contact basal melting.”
That doesn’t affect sea level, of course, so the GRACE data will presumably (if correct) overstate the contribution of Antarctica ice loss to SLR, albeit maybe only slightly.
Did not the most recent studies show Antarctica gaining ice, rather than losing it”
https://wattsupwiththat.com/2015/11/05/yet-another-study-shows-antarctica-gaining-ice-mass-accumulation-highest-we-have-seen-in-the-last-300-years/
Yeah well we’re a really old weathered continent and we aint going anywhere in a hurry-
“One of the oldest tide gauge benchmarks in the world is at Port Arthur in south-east Tasmania. When combined with historical tide gauge data (found in the London and Australian archives) and recent sea level observations, it shows that relative sea level has risen by 13.5 cm from 1841 to 2000.”
OK so some of you might be sinking a wee bit like Venice-
“We have used a combination of historical tide-gauge data and satellite-altimeter data to estimate global averaged sea level change from 1880 to 2014. During this period, global-averaged sea level rose about 23 cm, with an average rate of rise of about 1.6 mm/yr over the 20th Century. The sea level record indicates a statistically significant increase in the rate of rise from 1880 to 2014.”
http://www.cmar.csiro.au/sealevel/sl_hist_few_hundred.html
Statistically significant doesn’t mean you start making things up, particularly when the old rocks around here show a sea level rise of 130M from 15000 years ago to around 6 or 7000 years ago and that can mean an average sea level rise of 16.25mm/yr for EIGHT THOUSAND YEARS but what’s a few mm between years.
Ummm…. you don’t think in that time there might have been the odd century when it was only 1.6mm a year and then another century when it was quite a bit more than 16.25mm a year do you?
Just an afterthought but perhaps Griff and Nick, et al could help a struggling layman out a bit here and consult their tree rings for some useful insights into that last puzzle for me?
There was indeed a period called Meltwater Pulse 1A where it did rise much more quickly than average, and then around 14 thousand ybp it levelled off for a while:
Thanks for that. I had a hunch that when you’re looking at some geological facts and figures with an average sea level rise of 16.25mm/yr over 8000 years or so, some decades it might have been only 16mm or so. No doubt the tree rings could sort this really technical stuff out.
I suspect that the Tampa Bay City Council is involved because of how low and close to the water things have been built along the Channelside district. It is a major destination area and a group of investors headed by Tampa Bay Lightning owner Jeff Vinik are putting up over $1 billion dollars in developing that area further. It would be in their best interests to have some kind of “science” to show SLR in order to grab some mitigation money to help along the way.
Every dang subject concerning ‘climate change’ shows evidence of climategate like manipulation.
The manipulation is required to create CAGW. Ocean level was rising at no more than 1.0 mm/yr and is now falling.
P.S. May the bells rings and the banners fly, global warming is over. I am now waiting with bated breath for the cult to notice and the start of the media/public/scientific paradigm change. There is now record snowfall and cold temperatures on the Greenland ice sheet which is evidence (Highest in RECORDED history!!!) of the start of the change in climate.
http://beta.dmi.dk/en/groenland/maalinger/greenland-ice-sheet-surface-mass-budget/
As has been known for more than a decade, the sum of the analyzed inputs that affect ocean level are less than what is required to justify even an ocean level rise of 1.2 mm/yr. The magical solution to this problem has a single paper by an IPCC lead author (What are the qualifications required to be selected to be a IPCC lead author?). The climategate study of course has paid for by European Research Council project Seachange blah, blah, blah, and so on.
This is a review paper that has published prior to magical EU financed paper that outlines the problem/paradox that the inputs that affect ocean level are not sufficient to justify a rise of even 1.0 mm/yr problem.
http://www.nature.com/nature/journal/v428/n6981/abs/nature02309.html
Ocean ‘Level’ from Satellite Data Before ‘Adjustments’ Cult of CAGW emergency, ocean level is falling!!!

Ocean ‘Level’ from Satellite Data After ‘Adjustments’ Cult of CAGW problem ‘SOLVED’ with innovative ‘adjustments’
http://scienceandpublicpolicy.org/images/stories/papers/reprint/sea_level_not_rising.pdf
William, thanks for the comment. I was with you until you got to this:
You can’t title a piece “Sea level is not rising” and start by saying “At most, global average sea level IS rising at a rate …”. Those two can’t both be true.
Next, with all respect to Professor Mörner, he is the only scientist I know of who claims that sea level “probably” is not rising at all. Nor does that claim accord with my own researches into the subject. Tide gauges from all over the planet show generally increasing sea levels. There’s an example here, one among plenty.
Next, the best GPS-corrected records show sea-level increases. In the nineties the Aussies put an entire series of them called “Seaframe” across the Pacific with co-located GPS. All of them show some degree of sea level rise over the last quarter century.
Finally, if you don’t think that sea level is rising at all, go talk to the Dutch. You won’t find Dutch scientists trying to push that kind of nonsense. Here’s the tidal record at Rotterdam:
My best to you,
w.
I have posted this before, but these cliff undercuts in the Mediterranean are at least 500 years old. And they are still on the current sea level (no tides in the Med).
http://s14.postimg.org/jci3z4z5t/undercut_med_cl.jpg
See the entry on wiki for ‘Cliffed coast’
The diagram there shows a “Wave-cut notch”
There is another drawing here: Formation of a Wave-cut Platform
A search using the “Images tab” using these terms will show many photos from around the world.
And as far as the satellite data goes, there was a thread on WUWT a while ago that pointed out that the Earth is a geoid, not a spheroid. And so the sea around Britain is 100 meters higher than the sea around Florida. So with a 100 meter variation is global sea surface levels, plus 6 meter tides, and 2 meter waves, can you really measure sea levels to the nearest millimeter? Tricky….
http://www.asu.cas.cz/~bezdek/vyzkum/rotating_3d_globe/rotating_3d_globe/private/fig06/rotating_3d_globe_preview_Geoid_height_EGM2008_nmax500_-20_-5_px0650.png
Click on this and watch it spin…
http://www.asu.cas.cz/~bezdek/vyzkum/rotating_3d_globe/figures/rotating_3d_globe_Geoid_height_EGM2008_nmax500_px0650_angle360_fps1_BlueWhiteOrangeRed.gif
And then there is this interesting and informative little video, worth a few minutes of anyone’s time:
https://youtu.be/q65O3qA0-n4
The NOAA high for 2016 is 4.3 inches per decade. You might think someone would notice that.
Excellent article Willis.
The UN IPCC AR5 WG1 report claims that:
“It is very likely that the mean rate of global averaged sea level rise was 1.7 [1.5 to 1.9] mm yr–1 between 1901 and 2010, 2.0 [1.7 to 2.3] mm yr–1 between 1971 and 2010, and 3.2 [2.8 to 3.6] mm yr–1 between 1993 and 2010. Tide-gauge and satellite altimeter data are consistent regarding the higher rate of the latter period. It is likely that similarly high rates occurred between 1920 and 1950.” (3)
As your discussion demonstrates the latest coastal sea level rise NOAA tide gauge data updated through 2015 for St. Petersburg simply does not support IPCC assertions that mean sea level rise trends are increasing since 1971.
Thus we have 45 years of NOAA coastal tide gauge data available to test the IPCC AR5 claims of increasing global sea level rise since 1971.
The actual NOAA measured coastal sea level rise data at St. Petersburg and elsewhere around the world says that the IPCC claim of increasing global sea level rise is flawed,
The studies discussed in this article regarding supposed future coastal sea level rise acceleration are nothing but speculation and conjecture derived from unvalidated and unproven models.
Isostasy/isostatic rebound…learned about this in Geology 101 my first semester in University–1966 at the University of Minnesota-Minneapolis. We were riding the rebound!
We really need to get the people who make these projections on the witness stand testifying under oath, under penalty of perjury.
They should certainly be concerned about the new leadership finding time to do this, which I suspect they probably will.
Willis
Really enjoyed the article particularly since I grew up in St. Petersburg, Florida. I lived on a landfill in Boca Ciega Bay. I did not live on the water but my neighbor across the street did. He let me use his boat dock and many days after school I would get some frozen shrimp out of the freezer and fish. Sometimes I would even catch dinner.
The headline does not go far enough. This is more than jumping the shark. This is the worst kind of deceit. If there were even a grain of truth to this your only option if you lived on one of those land fill would be to find a sucker to buy your property. You know that in that short of a period of time there is nothing you can do. Another futile gesture (Animal House) just won’t do.
I did try to find the raw data you were using and could not get to it. In a comment by Steve Case I did find a link where I could find some raw data. I have analyzed the satellite record of sea level change and I wanted to apply the technique to the gauge he referenced.
His reference was here.
http://www.psmsl.org/data/obtaining/stations/520.php
The location is shown here.
https://1drv.ms/i/s!AkPliAI0REKhgYw44IsxoAx3Durr_w
I lived on the bay between the barrier islands and the peninsula and is just to the left of the location shown.
The figure below shows how well the fit worked to the measured data. The figure also reveals the modeling equation. For this I was not interested in the sinusoidal behavior but only the underlying quadratic fit.
https://1drv.ms/i/s!AkPliAI0REKhgYw3uQlrTnJvrN1s_Q
https://1drv.ms/i/s!AkPliAI0REKhgYw2Uzw17_n1A3FRJA
Here are the values for b determined by the analysis.
-92.62998619387541
1.000011713071845
19.39853550453368
.01212077987873379
-45.34907824847151
49362.74622255816
-8.354019154726986
.09087440197605502
217.1968803590611
Here is the rate of change.
https://1drv.ms/i/s!AkPliAI0REKhgYw5-1vTcszLpuQSJA
Here is what might be expected until 2100.
https://1drv.ms/i/s!AkPliAI0REKhgYw1PkFL1rQPhS19cA
I think all of this supports what you are saying.
The Tampa Bay study is question relies upon a “tool” developed by the USACE as noted in the quote in the subject article provided below.
“Future SLR estimates can be calculated for the Tampa Bay region, integrating data from the local St. Petersburg tide gauge, using a flexible, well-supported tool developed by the United States Army Corps of Engineers (USACE). The tool takes the three parameters discussed above (datum, rate of change, projection) and produces the plots or tables that describe how sea level will change in the future, such as those included as Figure 3 and Table 1.”
The USACE model methodology can be found at: http://www.corpsclimate.us/ccaceslcurves.cfm.
This USACE tool is in fact a semi-emprical methodology model of the type whose significant shortcomings was addressed in the UN IPCC AR5 report which specifically noted:
“Many semi-empirical model projections of global mean sea level rise are higher than process-based model projections (up to about twice as large), but there is no consensus in the scientific community about their reliability and there is thus low confidence in their projections. {13.5}”
“Despite the successful calibration and evaluation of semi-empirical models against the observed 20th century sea level record, there is no consensus in the scientific community about their reliability, and consequently low confidence in projections based on them. {13.5.2, 13.5.3, Figure 13.12}”
“Because of the limited or medium evidence supporting SEMs, and the low agreement about their reliability, we have low confidence in their projections.” (Section 13.5.3)
Thus the Tampa Bay study addressed in this post relies upon highly speculative methodology which was specifically cautioned against in the UN IPCC AR5 report as providing results which the IPCC have “low confidence in their projections.”
There has been tremendous amounts of groundwater extraction along the eastern US coast. This surely has caused considerable subsidence, which probably is the main contributor to relative sea level rise along the east coast (and in places where the hysterics are waving their arms telling us they are going to be under 5′ of water in a year or two). Love those scare stories of how the entire state of Florida will be under several feet of water ‘by 2100.’ I have to suppress my laughter at those people who actually take such things seriously.
Congratulations on another excellent article, Willis.
We here in Gustavus Alaska have proof, I tell you, proof the sea level is falling! Sea level has fallen so much that we had to build a new boat dock because the old one was now out to the water.
At the rate we are going the oceans be much smaller, we must start burning more fossil fuels to make it warmer so we can stop this falling sea level.
You are probably experiencing uplift. This is very normal in a geological setting like Alaska – the point being that without measuring uplift or subsidence, tide gauges are useless for the establishment of GSL change
Their recommendations are reasonable
“CSAP encourages local governments and other agencies to use multiple scenarios in order to
allow experts and decision makers the flexibility to consider a variety of contextual factors,
including the expected lifespan of the project, project cost, and criticality of function, when
developing adaptation strategies. Scenario planning offers opportunities to initiate actions now
by balancing the costs of inaction against reasonable returns on investments made to
infrastructure that may reduce future impacts and vulnerabilities. For example, decision makers
may decide to plan for the NOAA Intermediate Low or Intermediate High scenarios when faced
with projects with low to moderate risk tolerance such as temporary projects or infrastructure
projects with a relatively short life cycle, while they may choose to plan for the NOAA High
scenario in situations where there is little tolerance for risk (e.g. new infrastructure with a long
anticipated life cycle such as a power plant, waste water treatment facility, or bridge) (NOAA,
2012). The level of adaptation planning necessary will be up to the planning entity and based on
the acceptable level of risk and vulnerability.”
When it comes to climate related planning you are really on the edge of science.. its more like OA where all you have is sketchy data and various models.
Like war planning.. historical data is small, incomplete, not collected with science in mind. And where models of how war happens and evolves are basically narratives with numbers attached. Still, it’s precisely
narratives and models like this that led Reagan to do Star Wars and the huge build up our military to counter a threat that ONLY EXISTED in the minds of modelers. You read that right. To plan for the future war we had to project, imagine, “predict” what we thought the soviets would look like 20 years into the future. Turns out we were wrong. Opps
But sometimes planning for the worst is vindicated
http://www.dailymail.co.uk/news/article-1386978/The-Japanese-mayor-laughed-building-huge-sea-wall–village-left-untouched-tsunami.html
It is one thing to plan for known risks, like hurricanes, which are relatively frequent; and for others less frequent but still known to occur, like tsunamis; and even for speculative but possible dangers, like an enemy with an existing arsenal of ICBMs. But it makes no sense to plan for fantastic events that cannot occur in less than thousands of years, like an ice-age glaciation melting. /Mr Lynn
Most offshore sedimentary basins subside under their own weight. This provides accommodation for further sediment deposition. Without this process there would be no hydrocarbons, as organic material must be buried at depths ranging from 2 – 5.5 km to form hydrocarbons i.e. sufficient heat and pressure.
The US eastern seaboard is a passive margin which no doubt has a very extensive and thick sedimentary basin offshore. It is quite possible for the continental coastal region to be dragged down too. I doubt that this would be as high as 1 mm/yr.
Just some basic geology
IOn 2007 Chao. Yu. and Li determined that if the impoundment of water in artrificial reservoirs is taken account of the sdea level rise foir the last 80 years becomes linear with a slope of 2.47 millimeters per year. This works out to judst under 10 ionches per yuear, nmot the twenmty feet as in Al Gore’s book that was awartded a Nobel Prize. I If something has been linear asw long as that there is no rason to thuinkj that it is abpot to change anytime soon. Lookimng at more recent sea levcel rise curves, including the current one from NOAA verifies thsat the linear trend is still present in currently available vdata. The problem is that people studying it simply want to rewad morer warming into it thjanj there is. I am willing to bet that the centennial sea level value will come out at ten inches, just as the work of Chao, Yu. and Li from 2007 would predict, plus or minus at most one inch for unforeseen circumstances. Thje numerous asttempts to find some other value since then are testimony to the strenth of the belief in pseudo-science that predicts iditioc values in the meters or tens of meters range.
Ten inches perr century is correct. (Sorry!)
The New Zealand Governments Parliamentary Commisioner for the Environment (PCE) Dr Jan Wright went on a similar rant in her first report on Sea level rise. Page 19 had a graphic from the IPCC report indicating rises of 50 to 100 cm by 2100. the current average for NZ and for Auckland is 1.4mm/an , the same as for the Globe. Dr Wrights report rate requires a rise of 9mm/yr every year from now to the end of the century. There is no CO2 signal in the New Zealand data and there is no acceleration evident in the real data. The PCE’s report did not reference New Zealands current expert in sea level (John Hannah) nor the retired head of The Department of Scientific and Industrial Reseach (Dr Kerr) who did his Doctorate in Sea Level.
When I pointed out these flaws(absurdities) in the report a second report appeared a year later but it still blamed sea level rise on CO2.
I decided to use a different different method to detect the possibility of catastrophic sea level rise. Our recently departed Prime Minister has a holiday home on a sand spit (roughly sea level) just north of Auckland, when he sells it I will take another look at sea level.
Enjoy
Willis: The first half of your post deals with the current rate of SLR. The second deals with the key issue acceleration of SLR. Current SLR is about 1 inch/decade. For SLR to reach 1 m by the end of the century, acceleration of SLR needs to be 1 inch/decade/decade. We obviously haven’t seen that much acceleration over the past few decades. If we are experiencing sea level rise of 2 inch/decade in 2025, then we might experience 1 meter of SLR by 2100. So we appear to be safe at the moment.
Or are we? Tide gauge records are too noisy to provide reliable rates of SLR in periods shorter than about 50 years. Clearly tide gauges aren’t going to be of much use telling us that SLR has risen from 1 to 2 inch/decade between now and 2027. They don’t provide an instantaneous measure of SLR, they provide half-century averages. Perhaps combining several hundred tide gauges will help some, but they aren’t up to the job of measuring acceleration.
That leaves us satellite measurements. Unfortunately, they show that global SLR is quite noisy. So we need to detect acceleration of SLR in noisy data. A few years of data around today’s SLR of 1 inch/yr and a hypothetical 2″ inch/yr in 2027 will unfortunately not be statistically significant due to the amount of noise in the data we have been seeing.
I agree with you that a 5-fold increase in SLR by 2040 looks absurd, but detecting and quantifying acceleration in SLR is a challenging problem. Fortunately, the 30-year satellite record doesn’t show evidence for worrisome acceleration.
Some interesting info here emphasising the influence of both geological subsidence and ground water extraction. Until these kinds of studies are done on an extensive scale all tide gauge data should be considered useful only for relative sea level change. Most coastal zones around the globe are moving, either up or down in relation to mean sea level. These are simple principles taught in first year Geology. Why don’t they get it?
http://www.gps.gov/cgsic/meetings/2015/dixon.pdf
Your graph of the St Pete Tide Gauge data seems to be missing some of the most recent data, the most recent version with data up to Nov 2016 is as follows:
https://tidesandcurrents.noaa.gov/sltrends/sltrends_station.shtml?stnid=8726520
The last few years show levels above the 95% CI, a quadratic fit to the data gives a slightly better fit to the data showing a modest acceleration, and appears to be the form of the USACE projection.
Phil
I did post such a fit in an earlier comment. It is virtually the same result I get when looking at the satellite record of sea level change. It is modestly accelerating.
Phil. January 16, 2017 at 7:42 am
First, note that the 95%CI is NOT the 95%CI of the data. It is the 95%C! of the trend. Most of the data is either above or below the CI of the trend … so? Look at the data. It is both above and below the 95% CI everywhere.
Second, while the fit is “slightly better” with a power curve, it is not significantly better. As a result, Occam’s Razor suggests that we should use the straight line, because there are less tunable parameters.
Next, we cannot use the power fit thus determined, because the power fit starts in 1947, and the USACE power fit starts in 1992.
Finally, I strongly object to the idea that a power curve can simply be extended a century into the future. You MIGHT, and I emphasize might get away with extending a straight line for a few years, that’s physically possible.
But as I showed in the head post, if you extend a power curve very soon you are into unphysical, never-seen rates of annual sea level rise.
All the best, thanks for the thoughts,
w.
“You MIGHT, and I emphasize might get away with extending a straight line for a few years”
Not legitimately. No empirical model can be used legitimately to predict the behavior of a system. Unless there’s a sound and well verified theory backing the model, it can’t be used to predict.
This is a feature of statistics regularly ignored by the people who produce these “predictions”. They’re all invalid. Books have been written on the subject. It’s drilled into every trained statistician; you cannot use an empirical model outside the boundaries of observation. It’s the same problem Mike Mann had in his absurd paleo reconstructions based on tree rings and other proxies that were only calibrated over the short time we’ve had instruments. It’s all pure nonsense. Doesn’t matter if it’s a straight line or a power curve; it’s an empirical model. It isn’t predictive.
I wrote: “No empirical model can be used legitimately to predict the behavior of a system”.
That was too emphatic.
An empirical model can be used to predict observations within the calibration range. So if a model was developed to record the behavior of Tampa SLR between 1945 and 2016, but it was based on annual averages and you wanted to make a statement about the sea level in Tampa on January 16th, 1962, you could legitimately use this model to estimate it.
But you can’t use it to predict the SLR in 2035. That’s not cricket.
And I’ll add, “bad scientist. No cookie”. 🙂
Willis Eschenbach January 16, 2017 at 10:36 am
Second, while the fit is “slightly better” with a power curve, it is not significantly better. As a result, Occam’s Razor suggests that we should use the straight line, because there are less tunable parameters.
The version attributed to Einstein is:
“Everything should be kept as simple as possible, but no simpler.”
Since the straight line doesn’t allow for the possibility of acceleration a straight line would appear to be ‘too simple’.
Extrapolation of any fit without an underlying justification is speculative, and should be done in knowledge of the limitations.
Willis,
Did you realize you have been Taminoed?
https://tamino.wordpress.com/2017/01/16/coping-with-sea-level-rise/#more-9231
Of course, he says that using a power curve is the only scientific choice and that anything else is unscientific. But then he always likes power curves as they show rampant acceleration in the out years.
Once again AGW (cough, hack, gag) scientists project a sea level rise caused by a tiny change in energy not even worthy of a B-rated sci-fi movie. At least their premis of enlarged insects was based on nuclear energy. This sea level rise monster is based on… wait for it… organic gas fertilizer increasing by a parts per million tiny fraction.
I dare say the Inquirer, back in the days of Alians, had better research behind their reports than this peer reviewed drivel.
The comparison between sea level rise and tide range, is rather like that between the warming effect of CO2 and seasonal temperature changes. Both involve measurement of a tiny quantity which is totally masked by a far larger cyclic change. Worse, the cyclic change has a random component as well.
When I was at uni, I was told that it is poor scientific practice to derive conclusions from measurements made ‘below the noise floor’ of the system. That salutary piece of wisdom seems to have been forgotten by the climate change movement.
“whoever did this at NOAA should resign.”
Their resignation should be accepted. It’s pretty hard to fire a GS level anything “scientist”. Another argument against public unions.
I don’t notice any mention of subsidence in your report? My understanding is most of Florida (like Holland) is sinking due to depletion of the fresh water aquifer?
The place to look for the cost of this nonsense is the local building and planing department, who very likely will place all sorts of new restrictions on building, along with requiring modifications of existing property to meet new codes based on these findings. The real cost will be felt by Florida property owners and the beneficiaries will be local contractors and, of course, local government.
This issue is already hitting some unfortunate individuals in New Zealand in the pocket. A nephew recently completed a elevation survey for a City Council so they could zone regions “at risk”. Insurance companies are already studying these and planning adjustments accordingly. Government has also absolved themselves from any liability should property prices be influenced – as I am sure they are or will. The authorities just don’t want to know about the real science.
NZ is an active tectonic country. Until GPS or other surveying apparatus are installed along with every tide gauge we can’t know what the heck is going on. This is the sort of injustice that makes me livid.
Dean P January 17, 2017 at 8:57 am
Hia “scientific” choice is to extend a power curve out a hundred years? Sounds like Tammy, all right.
Doesn’t surprise me. Ever since he kicked me off his website a decade ago or so for asking inconvenient questions Tammy has been doing his trivial best to bite my ankles … hasn’t succeeded yet.
w.
Willis, there seems to be an inconsistency between your charts of annual rate rise and your fig 3.
You seem to have plotted the instantaneous rates at the future dates whereas for the ‘observed rate’ is the trend since 92, examination of the data shows that the current observed rate is more like ~4mm/yr.
To make an ‘apples to apples’ comparison surely it would be appropriate to plot rates based on the same basis?
Phil, thanks for checking the numbers. However, Table 1 in the cited paper says that under the “NOAA Low” estimate the level goes up by 0.93 feet in 109 years, from 1992 to 2100. This is 2.6 mm/year.
Since I am comparing this to the other NOAA estimates in Figs 3 & 4, it is indeed apples to apples. All the numbers I used were from Table 1.
w.
Willis Eschenbach January 17, 2017 at 1:32 pm
Phil, thanks for checking the numbers. However, Table 1 in the cited paper says that under the “NOAA Low” estimate the level goes up by 0.93 feet in 109 years, from 1992 to 2100. This is 2.6 mm/year.
Since I am comparing this to the other NOAA estimates in Figs 3 & 4, it is indeed apples to apples. All the numbers I used were from Table 1.
You’re welcome. Thanks for the Table ref I’d just been eye-balling the graphs, however I still get a discrepancy.
For example NOAA High in 2100 shows 6.89 ft
So 6.89x12x25.4/109 gives 19.3 mm/yr
NOAA Int Low in 2025 shows 0.38 ft
So 0.38x12x25.4/33 gives 3.5 mm/yr which is less than the value for Nov 2016.
I can’t see an error?
Phil, if I understand you I think you may be confusing average change with annual change. For NOAA High, for example, the annual change in 2100 will be much larger than the average change over the period. They are only the same for the straight line case.
w.
I agree, that’s what I said in my first question but you said that you used the data in Table 1 which only allows you to calculate the average. In order to calculate the annual change in 2100 you’d need the gradients of the projected fits. In which case in the 2016 plot the ‘observed value’ in your table is not correct and you should have another column labelled ‘linear fit’ (2.66/yr).
I did use the data in Table 1. The “NOAA Low is an extension of the observed long-term trend, starting in 1992 and extending for 100 years. That’s what I meant by “observed”, sorry if it wasn’t clear.
w.
No statistics here. No analysis to back up the claims. Just loads of attitude & ridicule. Eyeballing of graphs. How about a demonstration that a linear function DOES give a better fit to sea level rise than higher-order, and that it is statistically significant? Hmm? Or is making defensible claims not what this site is about?
Thanks, Patrick, but I must object. “Eyeballing of graphs”? What on earth are you talking about? I gave you the link to the paper. I referred you to Table 1 in the paper which contains the data I used. I explained what I did.
If you think that my analysis is incorrect, if you want to get traction you’ll have to do what I asked and QUOTE THE EXACT WORDS THAT YOU OBJECT TO.
In addition, I’ve given you the location of all of the data involved. Let’s see your figures for what you think is going on.
Do you really think I got the numbers in Figs. 3 & 4 to one decimal place from eyeballing a graph? Following the form of their data, I simply fit a power curve of the form y = m x b to the data in Table 1 for each of the NOAA scenarios.
You have the data. I await your analysis …
w.
Well, Willis, Excel is a powerful tool where you don’t have to type data manually.
Just adapt Exels grid size, lengths and hights, to said graph.
Take that graphic for Excels background picture and calculate the formula aka ‘model’ you need to get that graph in Ecxel.
Ce’ voila, excel stems of lotus.123, use your magic wand and get while the getting is good.
Of course don’t forget to x your excel file:
set an ‘x’ into every cell your underlying graph has to pass before doing that .123 magic wand thing so excel knows what’s up.