By Vijay Jayaraj
With ice coverage for July and August remaining above the 10-year average of 2010-20, the extent of summer sea ice in the Arctic has surprised experts who once predicted that such levels would be impossible.
This stands in stark contrast to the dominant climate narrative that predicts the dwindling of summer ice in the Arctic. Some politicians had even claimed that parts of the Arctic would be ice-free by now.
With the seasonal Arctic melt technically over, it is fair to conclude that the extent of ice in the summer of 2022 has been greater than the 10-year average. On most days in July and August, sea-ice levels were above the 10-year average and significantly more than the previous few years.
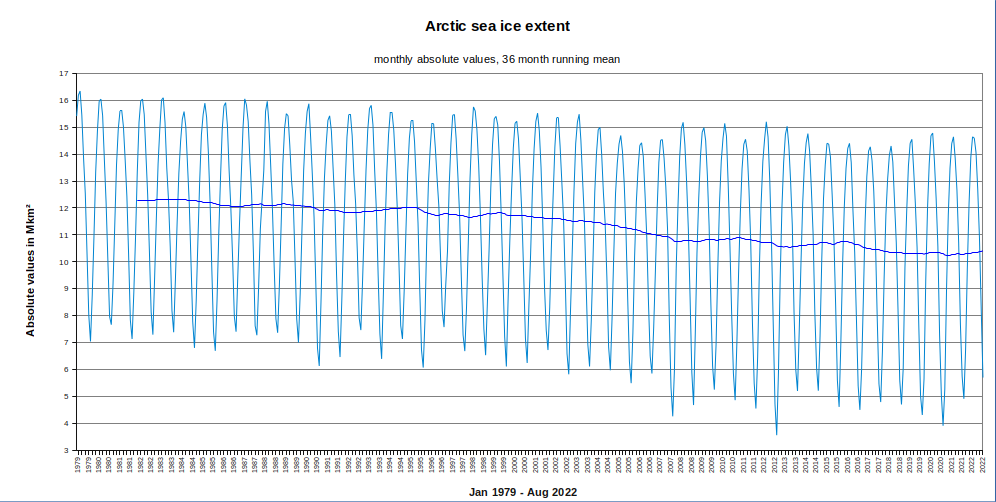
The Japanese National Institute of Polar Research provides a useful visualization in the graph below. This year’s Arctic sea ice — shown in red — is compared with the 10-year average and the levels of the previous few years, including that of 2012 when ice had reached its lowest of the period tracked.

Data of sea-ice extent in square kilometers in the Arctic Ocean from June 2002 to the present and decadal averages of 1980s, 1990s, 2000s, and 2010s are included.
Source: National Institute of Polar Research, https://ads.nipr.ac.jp/vishop/#/extent
According to the Danish Meteorological Institute, the extent of Arctic sea ice was much greater than the last five years as shown in the nearby graph.

Arctic Sea Ice Extent
Source: Danish Meteorological Institute, http://ocean.dmi.dk/arctic/icecover.uk.php
Summer temperatures in the Arctic remained at levels similar to the 44-year average of 1958-2002, with no marked increase in warming. In the graph, temperature is shown in the Kelvin scale; the horizontal blue line is freezing, or zero degrees Celsius and 32 degrees Fahrenheit.

Daily mean temperature and climate north of the 80th northern parallel as a function of the day of year. Source: Danish Meteorological Institute, http://ocean.dmi.dk/arctic/meant80n.uk.php
Now, here’s the big question: Why were internationally acclaimed climate scientists unable to predict this marked increase in the extent of summer sea ice? Is it because their overall approach is biased toward supporting the theory that carbon dioxide is warming the planet to dangerous levels? Or is it because their models are incapable of predicting future temperatures?
The answers must come from the doomsayers themselves. They need to explain why Arctic summer temperatures have been no different from the 44-year average and why summer sea ice is above decadal averages.
Acknowledging that we are yet to understand the complex climate system will undermine the credibility of scientists and political institutions advancing destructive energy policies to address a fantasy of climate catastrophe.
Melting of Arctic ice has been used as a major data point in the justification of restrictive energy policies adopted by many countries. It is ironic — and infuriating — that millions across the world are suffering from high energy prices and blackouts at the same time that Arctic sea ice has been at its greatest extent in five years!
Europe is facing rapidly rising electricity prices and a natural gas shortage. Citizens in the U.S. are experiencing high energy prices as their access to cheap fossil fuels is restricted by government’s infatuation with solar and wind power. China is scampering to reduce blackouts. All this could have been avoided if political leaders had not promoted a false climate emergency.
It makes no sense to force people to live in darkness in the name of climate policy when the policy makers themselves have so little understanding of the planet’s mechanisms of warming and cooling. Acknowledge the infancy of climate science and liberate people from energy tyranny.
Vijay Jayaraj is a Research Associate with the CO2 Coalition, Arlington, Va., and holds a master’s degree in environmental sciences from the University of East Anglia, England. He resides in Bengaluru, India.
This commentary was first published at American Thinker August 30, 2022.
One season does not a trend make, regardless of which side of the argument you stand on. Personally, I’m voting for natural variability, but if you want to compare decadal averages you should stick to that and wait until 2029 before speculating on the decadal trend.
It’s not only one season if you take a closer look
2020 was second lowest on record…2019 third
Griff, how long is your record?
His record for being wrong – how old is griff
” The trend is that the ice is increasing. Explain that instead of playing your usual puerile games.”
Arctic sea ice increasing?Just because it increases a tiny bit since a few years?
OMG.
You are kidding us a bit.
The trend is that the ice is increasing. Explain that instead of playing your usual puerile games.
HotScot said: “The trend is that the ice is increasing. Explain that instead of playing your usual puerile games.”
Based on the NSIDC data I get -0.59e6 km2/decade from 1979 to 2021. And from 2001 to 2021 it is -0.74e6 km2/decade. That is a 12% decline since 2001 as compared to the 5% decline that the IPCC predicted in 2001. There are a lot of things needing an explanation. I’d put the IPCC’s extreme underestimation of the decline in the top half of the list.
bdgwx,
“Based on the NSIDC data I get -0.59e6 km2/decade from 1979 to 2021.”
Cherry picking one’s starting dates (in this case 1979) seems to have been a favorite tactic of the CAGW alarmists for quite some time now.
Were you around during the Ice Age scare back in the 1970’s when the Earth had been cooling for at least several decades? How does the ice sheet in the Arctic today compare to the 400+ years of the Little Ice Age?
I should have said how the Arctic today compares to the Medieval Warm Period or Roman Warm period in reply to bxgwx.
1979 is the start of the satellite extent data. It hasn’t been cherry-picked.
Picking only the data base that supports what you want to prove is cherry-picking.
MarkW said: “Picking only the data base that supports what you want to prove is cherry-picking.”
It’s not just NSIDC. DMI and JAXA support the conclusion that not only has Arctic sea ice been declining, but that the IPCC significantly underestimated the decline.
How could the IPCC underestimate anything? They report information, they don’t observe it.
Doonman said: “How could the IPCC underestimate anything? They report information, they don’t observe it.”
They provide predictions. Their 2001 prediction was for a ~5% decline in Arctic sea ice extent through 2021. The observed value is much larger than that.
Nonsense. According to the IPCC, they accumulate and report on information generated by “experts”.
So the “experts” are unable to predict arctic climate. Big surprise.
That’s because their 2001 CliSciFi climate models were woefully off on Arctic sea ice. When they changed the models to better match historic Arctic sea ice, it forced other modeled climatic metrics to deteriorate.
If Arctic Sea Ice is disappearing, this seems quite odd, no?
MAJOR ICEBREAKERS OF THE WORLD
https://bit.ly/3s54OGK
9/22/20
Here are the nations who have either built new ice breakers, or are building or refitting ice breakers.
This seems like a lot of nations to be building ice breakers if they believe all the ice is going to melt at the Poles.
There are more who have ice breakers but I only included those who either have built new ones, or are building them.
US
Russia
China
Canada
Norway
Finland
Sweden
Australia
Germany
Chili
UK
_____
Arctic race heats up as Russia launches flagship nuclear-powered icebreaker
Russia billing new vessel as largest and most powerful of its type in the world
https://fxn.ws/2Et65U2
9/22/20
…Comparatively, three new U.S. Coast Guard icebreakers under development by VT Halter Marine in Mississippi will boast 45,200-horsepower, diesel-electric engines, stretch to 460 feet and smash through ice as thick as 8 feet. The Coast Guard’s new Polar Security Cutters are expected in 2024, 2025 and 2027.
President Trump sent a memo over the summer to executive branch leaders asking them to report back with plans to expand the U.S. icebreaker fleet. Until the new vessels are completed, the government owns two – the USCG Polar Star, designated a heavy icebreaker capable of performing in the Arctic and Antarctic, and the USCG Healy, a medium-class icebreaker. Other U.S. icebreakers are privately owned.
Vice Adm. Scott Buschman, the Coast Guard’s deputy commandant for operations, told Fox News in August that the U.S. needs to increase its efforts in the region to keep pace with rival nations.
Russia has dozens of icebreakers, in addition to the Arktika.
STATE DEPARTMENT APPOINTS SPECIAL ENVOY TO ARCTIC AMID CONCERNS OVER RUSSIAN, CHINESE INFLUENCE THERE
China, which also aims to stake a claim in the Arctic, is reportedly developing its own version of a nuclear-powered icebreaker and maintains a fleet of medium icebreakers. Other players in the region include Canada and Norway…
KcTaz said: “f Arctic Sea Ice is disappearing, this seems quite odd, no?
MAJOR ICEBREAKERS OF THE WORLD
https://bit.ly/3s54OGK“
The existence of ice breakers? Why is that odd?
It’s not the existence, bdgwx, it’s the production of new icebreakers by so very many countries that is odd if the Arctic sea ice is melting and going to be gone. Why bother with the time, cost and expense of new ones when they won’t be necessary to navigate the Arctic?
Why do countries like Chinaand Russia want to stake a claim to the Arctic when, per CC/AGW enthusiasts, there won’t be an Arctic at all since it’s just a floating ice ball that is melting?
Now do you see the contradictions?
KcTaz said: “It’s not the existence, bdgwx, it’s the production of new icebreakers by so very many countries that is odd if the Arctic sea ice is melting and going to be gone.”
Even under an RCP8.5 scenario Arctic sea ice will not be gone for hundreds, if not thousands of years.
KcTaz said: “Why do countries like Chinaand Russia want to stake a claim to the Arctic when, per CC/AGW enthusiasts, there won’t be an Arctic at all since it’s just a floating ice ball that is melting?”
I don’t know what CC means. And if AGW enthusiasts are those that advocate for the knowledge and understanding we have accumulated thus far regarding the climate then it is important to point out that they don’t think the Arctic will be gone or even just the sea ice. What they think is that given the current emission pathway the summertime minimum sea ice extent in the Arctic region will drop below 1e6 km2 prior to 2100 with the over/under at around 2050. Just because the summertime minimum may drop significantly in the coming decades does not mean that the seasonal buildup ceases. Ice breakers will be needed for at least several hundreds of years at least.
When it comes to ice breakers, they say that their impact is insignificant because their paths are too small compared to the total area of sea ice. They must also think chewing hard candy doesn’t make it dissolve faster.
Not sure what you mean.
Of course, their impact on ice is insignificant. Ice just reforms after they pas through. I do agree that hard candy dissolves faster when you chew it but it’s not ice. Ice does dissolve faster when you chew it, too, though, but I don’t think the Arctic is in any danger of dissolving from ice breakers traveling through it.
Sorry, per this and included charts, your statement is 100% false.
Arctic Ice at Decade-High Level: Can Doomsayers Explain? – CO2 Coalition
https://bit.ly/3wM6SaB
08.30.2022
Arctic Ice at Decade-High Level: Can Doomsayers Explain?
With ice coverage for July and August remaining above the 10-year average of 2010-20, the extent of summer sea ice in the Arctic has surprised experts who once predicted that such levels would be impossible.
This stands in stark contrast to the dominant climate narrative that predicts the dwindling of summer ice in the Arctic. Some politicians had even claimed that parts of the Arctic would be ice-free by now.
With the seasonal Arctic melt technically over, it is fair to conclude that the extent of ice in the summer of 2022 has been greater than the 10-year average. On most days in July and August, sea-ice levels were above the 10-year average and significantly more than the previous few years.
The Japanese National Institute of Polar Research provides a useful visualization in the graph below. This year’s Arctic sea ice — shown in red — is compared with the 10-year average and the levels of the previous few years, including that of 2012 when ice had reached its lowest of the period tracked.

Data of sea-ice extent in square kilometers in the Arctic Ocean from June 2002 to the present and decadal averages of 1980s, 1990s, 2000s, and 2010s are included. Source: National Institute of Polar Research, https://ads.nipr.ac.jp/vishop/#/extent
According to the Danish Meteorological Institute, the extent of Arctic sea ice was much greater than the last five years as shown in the nearby graph.

Arctic Sea Ice Extent
Source: Danish Meteorological Institute, http://ocean.dmi.dk/arctic/icecover.uk.php
Summer temperatures in the Arctic remained at levels similar to the 44-year average of 1958-2002, with no marked increase in warming. In the graph, temperature is shown in the Kelvin scale; the horizontal blue line is freezing, or zero degrees Celsius and 32 degrees Fahrenheit.

Daily mean temperature and climate north of the 80th northern parallel as a function of the day of year. Source: Danish Meteorological Institute, http://ocean.dmi.dk/arctic/meant80n.uk.php
Now, here’s the big question: Why were internationally acclaimed climate scientists unable to predict this marked increase in the extent of summer sea ice? Is it because their overall approach is biased toward supporting the theory that carbon dioxide is warming the planet to dangerous levels? Or is it because their models are incapable of predicting future temperatures?
The answers must come from the doomsayers themselves. They need to explain why Arctic summer temperatures have been no different from the 44-year average and why summer sea ice is above decadal averages…
The point is that you are not explaining anything. Explain WHY the extent increased even with normal temperatures.
Quit relying on TRENDS to explain everything. Trends, especially time series, are only indicators, they are not capable of explaining the functional reasons for changes, haven’t you learned that yet.
The late 70 and early 80s were a high point in the northern ice cycle.
bob boder said: “The late 70 and early 80s were a high point in the northern ice cycle.”
Close. It was actually the 1960’s. [Walsh et al. 2016]
Wrong… Walsh does not “gel” with US DOD data, nor with Russian data.
It is a FAKE designed to further the AGW narrative, as are so many of these things.
REALITY is that current levels of Arctic ice and glacier are pretty much in the top 5% of the last 10,000 years
https://notrickszone.com/2022/08/29/arctic-wide-glaciers-and-ice-caps-were-absent-or-smaller-than-today-from-10000-to-3000-years-ago/
Arctic sea ice often close to zero for much of the time before Neoglaciation.
And starting the Arctic ice data at the anomalous extreme peak in 1979, when real data exists from several years before that showing much lower levels…
.. yes.. very much cherry picking
FinalNail,
I understand that the satellite record for the Arctic ice begins in 1979. But the history of the Arctic ice does not. That is why using the Arctic satellite record (which has been trending down since its start) to defend the CAGW narrative is misleading and deceitful.
That was my point. I apologize if I did not make that clear.
Now that is FALSE! since it began in 1972
Sunsettommy said: “Now that is FALSE! since it began in 1972”
DMI, JAXA, and NSIDC datasets only go back to 1979. It is true that the ESMR was operational from 1972-1977 onboard the Nimbus 5. However, it was problematic in many ways including being unreliable and ineffective at measuring extents owing to only one microwave channel. It wasn’t until the SMMR onboard the Nimbus 7 that consistent high quality data from multiple microwave channels. This is why most datasets start in 1979. You can, of course, still download the ESMR data here.
What you say is true but misleading since the Nimbus 5 ESMR is of good quality and resolution good enough to be included especially since there are hundreds of published papers using proxies with LOWER resolution values than Nimbus 5’s level and of today’s temperature data that has a yearly resolution level.
There have been other published papers that supports a lower polar ice cover in the early 1970’s as well.
Sunsettommy said: “There have been other published papers that supports a lower polar ice cover in the early 1970’s as well.”
That’s a twist I wasn’t expecting. It seems to be universally agreed (even on here) that the 1970’s were a relative high point in regards to Arctic sea ice extent. The Walsh et al. 2016 reconstruction certainly shows higher extents in the 1970s than today.
Artic ice extent from satellite observations was increasing from the early 70’s until 1979 where it peaked and then started to trend down. This is clearly shown in the 1990 IPCC (FAR) report. It is a little close to special pleading to say the satellite data prior to 1979 is rubbish when a 1979 start so enhances the desired narrative.
I don’t think the satellite data prior to 1979 is rubbish. I do, however, think the ESMR’s efficacy was lower than that of the SMMR for several reasons. That doesn’t mean it is rubbish though.
Walsh was “fabricated” to support the AGW meme.
It does not follow measure Arctic temperatures, either, so utterly destroys any argument that temperature and sea ice are linked.. a big oops for the climate meme. !
Reality is different
Current levels of Arctic ice are probably within the TOP 5% of the last 10,0000 years.
They are still VERY HIGH compared to the rest of the Holocene.
b.nice said: “Walsh was “fabricated””
Can you post a link to an investigation showing that Walsh et al. “fabricated” their data?
Can you post a link to an Arctic sea ice reconstruction that you feel is not “fabricated” so that we can compare to the Walsh et al. reconstruction?
b.nice said: “Current levels of Arctic ice are probably within the TOP 5% of the last 10,0000 years.
They are still VERY HIGH compared to the rest of the Holocene.”
The graph you posted does not show that.
I’ve seen the Alexseev data before but haven’t seen an explanation of what is being plotted, monthly average, september minimum, etc. Any information, as of today extent is below 5Mkm^2 with a couple of weeks of decline to go?
“1979 is the start of the satellite extent data. It hasn’t been cherry-picked”
It just happens to be a peak , up there with extents of the LIA.
Very much an anomaly.. an extreme high.
For nearly all the last 10,000 years there has been FAR LESS ARCTIC ICE than there is currently.
https://notrickszone.com/2022/08/29/arctic-wide-glaciers-and-ice-caps-were-absent-or-smaller-than-today-from-10000-to-3000-years-ago/
Why does anyone care about Arctic sea ice?
Who lives there besides polar bears?
If the ice melts, sea level does not rise.
How about the climate where people actually live and work?
Do you any idea of the manifold problems of trying to accurately measure the degree of sea ice “extent” from satellite observations, particularly from 1979 to about 2000?
Late 70’s early 80’s was also the coldest in the last 100 years. The Long Island Sound froze over in the late 70’s. So start at a extreme cold point and claim the planet is warming is cherry picking. If increase in CO2 was really warming the planet then explain the artic sea ice rebound over the last decade. The answer is……you can’t. There is no climate emergency.
CD in Wisconsin said: “Cherry picking one’s starting dates (in this case 1979) seems to have been a favorite tactic of the CAGW alarmists for quite some time now.”
I didn’t pick 1979. Vijay Jayaraj did by defacto when he limited his analysis to satellite based datasets like those provided by DMI and JAXA.
CD in Wisconsin said: “Were you around during the Ice Age scare back in the 1970’s when the Earth had been cooling for at least several decades?”
Yes.
CD in Wisconsin said: “How does the ice sheet in the Arctic today compare to the 400+ years of the Little Ice Age?”
CD in Wisconsin said: “I should have said how the Arctic today compares to the Medieval Warm Period or Roman Warm period in reply to bxgwx.”
If by “ice sheet” you actually mean Arctic sea ice then it is lower today than at any point in several hundred possibly going back to 600 AD or longer. [Kinnard et al. 2011]
Arctic ice lower today than during the Medieval Warm Period?
CD in Wisconsin said: “Arctic ice lower today than during the Medieval Warm Period?”
Correct. It may have been lower around 600 AD though. And it was almost certainly lower during the Holocene Climate Optimum.
So, you admit that there is no reason to for all the alarmist histrionics about ice levels.
Don’t tell Mike Mann you admitted that – he’ll have you cancelled!
Doesn’t seem to be.
link to DMI ice volume:
http://ocean.dmi.dk/arctic/icethickness/thk.uk.php
ARCTIC ICE 2004-2022 DMI*
That is ice volume. It is different than extent. FWIW it is trending down too.
Meaningless short term starting at a extreme high level of sea ice that was similar to that of the LIA.
Your own 100% modeled chart shows the decline stopped after 2008.
Oops.
Sunsettommy said: “Your own 100% modeled chart shows the decline stopped after 2008.”
First, all of the graphs presented in this article and comment are based on models.
Second, it’s not my chart. It was created by the University of Washington.
Third, it shows the decline “stopping” several times. And yet despite all the “stops” it keeps unstopping with the trend decisively down over the period of record.
EXCERPT from your link. All based on models, not measurements. Oh.
“…Sea ice volume is an important climate indicator. It depends on both ice thickness and extent and therefore more directly tied to climate forcing than extent alone. However, Arctic sea ice volume cannot currently be observed continuously. Observations from satellites, Navy submarines, moorings, and field measurements are all limited in space and time. The assimilation of observations into numerical models currently provides one way of estimating sea ice volume changes on a continuous basis over several decades. Comparisons of the model estimates of the ice thickness with observations help test our understanding of the processes represented in the model that are important for sea ice formation and melt.
VersionsVersion 2.1We identified a programming error in a routine that interpolates ice concentration data prior to assimilation. The error only affected data from 2010-2013. These data have been reprocessed and are now available as version 2.1. Ice thickness is generally greater in the Beaufort Chukchi Sea area with the largest differences in thickness during May. Differences in ice volume are up to 11% greater in late spring.
http://psc.apl.uw.edu/wordpress/wp-content/uploads/schweiger/ice_volume/version_diff.png
Fig 5. shows the differences in volume between Version 2.0 and Version 2.1 (click to enlarge)
Version 2. 0This time series of ice volume is generated with an updated version of PIOMAS (June-15,2011). This updated version improves on prior versions by assimilating sea surface temperatures (SST) for ice-free areas and by using a different parameterization for the strength of the ice. Comparisons of PIOMAS estimates with ice thickness observations show reduced errors over the prior version. The long term trend is reduced to about -2.8 103 km3/decade from -3.6 km3 103/decade in the last version. Our comparisons with data and alternate model runs indicate that this new trend is a conservative estimate of the actual trend. New with this version we provide uncertainty statistics. More details can be found in Schweiger et al. 2011. Model improvement is an ongoing research activity at PSC and model upgrades may occur at irregular intervals. When model upgrades occur, the entire time series will be reprocessed and posted.”
KcTaz said: “EXCERPT from your link. All based on models, not measurements. Oh.”
Every sea ice chart/graph posted in this article and comment section is based on model including the one you posted.
The historical record shows your statement is false.
‘HO! FOR THE POLE!’ — DID DUTCH SHIPS REACH THE 89TH LATITUDE IN 1665 AND 1675?
MARCH 8, 2020
A 19th century periodical highlights various voyages to the North Pole throughout the 17th-18th centuries with meticulous detail. It appears that many wooden ships penetrated as far north as the 89th latitude in ‘open iceless seas’ during this time…
https://electroverse.net
https://www.rmg.co.uk/discover/explore/roald-amundsen-north-west-passage-expedition-1903–06%20
Northwest Passage – HISTORY
https://www.history.com/topics/exploration/northwest-passage
“Norwegian explorer Roald Amundsen became the first to successfully navigate the Northwest Passage in 1906. Climate change has caused Arctic ice cover to thin in recent years, opening the passage to…”
Except he sailed through it in a wooden boat and, today, they need icebreakers.
That was near the North pole, in September. Remember, Willem Barentsz did the same trip in 1597 and reached the north fjord of Svalbard in June, with a wooden ship and closer to the North pole: no ice. Ice is less in September (end of summer) than in June…
going back to 600 AD or longer!
RUBBISH
There is more Ice now than MWP, and in fact for nearly all the last 10,000 years.
b.nice said: “There is more Ice now than MWP, and in fact for nearly all the last 10,000 years.”
As I noted down below that graph was photoshopped.
That graph shows only data before 1950 and is only for the Chukchi sea, and it’s an interpretation of biological data. I’d need something more convincing than that to call something rubbish.
Earth does not operate on human time scales. When this happened, there were no SUVs, or even homo sapiens to be found on the planet. It appears flora and fauna thrived.
The Canadian Arctic Probably Once Looked Like Present-Day Florida
https://www.atlasobscura.com/articles/plants-of-the-canadian-arctic
1/2/20
…From these characteristics, West concluded that back in the Eocene, the land that would become Ellesmere Island was stippled with ancestors of birch, horse chestnut, pine, spruce, and cedar trees, in addition to gingko, dawn redwood (Metasequoia glyptostroboides), and Chinese swamp cypress (Glyptostrobus pensilis). There were elements of a modern tropical forest, too, with magnolias and ferns, and large monocots that resembled palms and were related to the ginger family. The fossil evidence suggests that the floral neighborhood might have been a bit like the modern-day temperate rainforest of British Columbia as well as the swampy, diverse ecosystems of Georgia and northern Florida.
New Study Shows How Tortoises, Alligators Thrived in High Arctic Some
A new study of the High Arctic climate roughly 50 million years ago led by the University of Colorado at Boulder helps to explain how ancient alligators and giant tortoises were able to thrive on
https://bit.ly/3gjafOp
https://www.colorado.edu/today/2010/08/24/new-study-shows-how-tortoises-alligators-thrived-high-arctic-some-50-million-years-ago
1979 was really cold. A lot of our cold records came out of the 70s
1979 was not really cold. In the GISTEMP data set it was the 4th warmest year up to that date.
GISS…. LOL !
A fabricated urban temperature farce that bears absolutely zero resemblance to any reality !
Hansen Arctic data
Oh how things have changed 😉
forgot image…
Real, (ie , un-manipulated) data from station around the Arctic
Not in my area…very weird how we have lots of cold records in the 70s
I am sure you have the best data 😉
Yes, looking at the GISS map for the year and other records it was colder in the US and Northern Europe in 1979.
GISS isn’t a credible database source.
I am mystified how you get “it was the 4th warmest year up to that date” from the chart you posted. It’s not even close to being that. Maybe I’m missing something?
Anyway, that is not reliable since NASA has bee busy “adjusting” temperatures in that data set.
Remember this?
From: Tom Wigley <wigley@ucar.edu>
To: Phil Jones <p.jones@uea.ac.uk>
Subject: 1940s
Date: Sun, 27 Sep 2009 23:25:38 -0600
Cc: Ben Santer <santer1@llnl.gov>
It would be good to remove at least part of the 1940s blip, but we are still left with “why the blip”.
di2.nu/foia/1254108338.txt
NASA LOWERS 1940s TEMP
Climategate Scientists Getting Rid Of The 1940’s Temperature Spike In The Arctic
https://bit.ly/3rAQbcx
Posted on April 13, 2014 by stevengoddard
As of 2011, NASA showed a large spike in eastern Arctic temperatures around the year 1940
http://data.giss.nasa.gov/cgi-bin/gistemp/show_station.cgi?id=620040300000&dt=1&ds=1
di2.nu/foia/1254108338.txt
I didn’t get it from the chart, I got it from the data the chart is based on. In case it wasn’t obvious, the red dot is 1979.
Here are the 10 warmest years up to and including 1979 from GISS.
These are the global annual anomalies, relative to 1951-1980. Northern regions were somewhat cooler than the rest of the world that year, which might be what people here mean when they say 1979 was a very cold year.
Here’s the same for NOAA, using a different base period. In their data 1979 was third warmest.
HadCRUT4 has it 4th.
BEST has it 3rd
It is a very different picture looking North of 64°.
Applying a linear fit, and projection to a cyclical (albeit complex cycles) system will generally end up with you being more wrong than you can possibly believe. Take a 40 year segment of a signal with a major wavelength (AMO / PDO) of 60-80 years and you’ll definitely make a poor projection. The late ’70s were Ice Age Cometh era, when the signal was going down, then it went up and the message changed to runaway greenhouse. Until you understand the cyclical nature of the climate you will continue to make wrong projections, and even if you do understand the cyclical nature, the complexity is such that models may never be sufficiently detailed to make any projections that have predictive value.
Great explanation of cyclical phenomena.
Prove current ice levels are outside the range of natural variability. Oh yeah, you can’t.
It’s all perfectly natural.
Andrew Wilkins said: “It’s all perfectly natural.”
What wholly natural agent is responsible for the decline since the 2001?
That question is for you to answer since you are proposing the change means nothing because of the trend. Hate to tell you but the trend is due to real physical phenomena, and if you believe the trend tells you something about what the phenomena are, tell us.
Something changed in the recent years to buck the trend, what was it?
You want a decade, do 2012 – 2022
DGS said: “You want a decade, do 2012 – 2022”.
-1.2e6 km2/decade from 2012/01 to 2021/12. The data can be downloaded here. Note that I took the liberty of ending the trend at 2021 so that I’m accused of selecting the near minimum of 2022 as the end point.
There is more ice now than there was a few millennia ago before human influences were significant. Obviously, the conjecture that CO2 acts as a control knob is wrong.
There probably was. But would you mind posting a link to an Arctic sea ice reconstruction showing that anyway? I want to see which reconstruction you are basing that statement.
Do you get paid not to work?
This picture my give you some idea of the Arctic climate during the Holocene.
It’s a good picture. But it neither answers my question nor adds anything of value to my current understanding since I already know about it. I’m more interested in which sea ice reconstruction Scissor was referring to. Maybe it is something I haven’t seen yet.
So the lack of permafrost during the mid-Holocene with the lack of Arctic sea ice that certainly accompanied the lack of permafrost adds nothing to your understanding of this topic?
Correct. And it’s not just that picture. We know from other lines of evidence that sea ice extents we’re lower during the Holocene Climate Optimum. They may have even been lower in the last 2000 years.
Ok, now tell us all why current sea ice levels have you and others of your persuasion in such a tizzy since currentsea ice levelsare anythingbut unprecedented.
I guess my “tizzy” is the statement that “The trend is that the ice is increasing.” which over decadal period is not correct.
But the ice trend is doing nothing to warrant a tizzy of any kind if the entire Holocene Epoch is taken into consideration.
The sea ice trend is doing the opposite of what was claimed. What the sea ice was doing in the distant past does not make the claim that “The trend is that the ice is increasing.” correct.
So, no ecplanation for the many MWP remnant found UNDER retreating glaciers
Not surprising that you are EMPTY.
Did you know that basically all Arctic ice has been much lower than now for nearly all the last 10,000 years, and in fact, many Arctic glacier didn’t even exist before the Neoglaciation which started about 3000 years ago
https://notrickszone.com/2022/08/29/arctic-wide-glaciers-and-ice-caps-were-absent-or-smaller-than-today-from-10000-to-3000-years-ago/
take Greenland for example..
“Glaciers were likely absent altogether between ~7.3 and ~1.3 ka”
“Between ~7.9 and 1.6 ka, the ice cap had completely melted away”
“Ice Cap…remained smaller than present between ~9.4 and 0.2 ka”
“North Ice Cap was smaller than present or absent through most of the Holocene from at least ~10.1 ka to ~1850 CE when the ice-cap reached its present-day size”
b.nice said: “So, no ecplanation for the many MWP remnant found UNDER retreating glaciers. Not surprising that you are EMPTY.”
I have no idea what you are talking about. Did I miss a conversation somewhere along the way?
Or maybe Alaska, northern Canada
“general warmth, diminished, if not entirely ablated glaciers between ~12.2 and 4 ka”
“100% of GICs were smaller than present or absent…between ~9.1 and 4.5 ka”
“at least 60% were smaller than present or absent…between ~8.6 and 2 ka”
Or Svalbard..
the glacier…was small or had completely melted away between ~9.2 and 3.5 ka and was smaller than present between ~1.4 and 1.2 ka”
“Between ~8.4 and 1 ka…the glacier was smaller or absent”
“the cirque remained free of ice until the LIA [Little Ice Age] or sometime between 0.6 and 0.4 ka”
Why not?
Derg said: “Why not?”
I’m not sure what this is in reference to. Can you clarify the question?
https://www.researchgate.net/publication/252572926_Ice_free_Arctic_Ocean_an_Early_Holocene_analogue
That’s just one proxy. I’ve read papers that have foram proxies as well.
I still crack up with the WW2 bomber buried in over 200 feet of snow. Control knob indeed.
I’m not sure what the WW2 bomber buried in snow has to do with CO2 being a control knob.
“2020 was second lowest on record…2019 third”
***********
Griff,
How does the Arctic ice sheet today compare to the state of it in the Medieval Warm Period or the Roman Warm Period or the Minoan Warm Period or the peak of the Holocene? Are you aware that the Vikings were able to sustain themselves with farming on the coast of Greenland in the Medieval Warm Period? Is Greenland warm enough to do that today?
Why do you persist in having a severe allergy to putting today’s climatic state and meteorological events in long term historical perspective? Trying to get you to understand the problems with the CAGW narrative is like trying to explain those problems to a brick wall.
That the CAGW theory provides you with confirmation bias for your opposition to (hatred of?) fossil fuels does not make the theory scientifically sound. But I somehow doubt you will ever understand that.
‘Trying to get you to understand the problems with the CAGW narrative is like trying to explain those problems to a brick wall.’
Then why bother?
Then why bother?
In the hopes that he (and others) will read it and perhaps understand that he is wasting his time and effort at this blog. Few (if any) people here have any respect for him, and his unwillingness to defend anything he says here makes his presence here unconstructive and pointless.
He seems to have a hit-and-run behavior here that is designed to merely intimidate. My response to that (my comment) is a natural one.
The entire world seems hell-bent on “correcting Misinformation” at present, even Joe Biden with his ill-conceived and ill-fated MINISTRY OF DISINFORMATION, yet you ask why anyone on the other side of the CAGW debate bother to correct actual misinformation as opposed to information governments find inconvenient?
Here are a few presentations to ponder:
Little to no Summer ice in the Arctic
6 posted and more is coming.
Chukchi Sea ice using biodata…
Sea ice north of Iceland
Sea ice near Greenland
OK but what about the last 70 years?
Sea ice north of Iceland, observed…
You can see the LIA and the late 1970s peak clearly
Even HadCrut shows the Arctic warmer in the 1940s, with a cold spike in 1979.
Also shown here using GISS weather station data.
There is no way the Arctic warms and cools differently to the global temperature trend. Global temperatures will warm and cool at a lower rate than the Arctic, but it doesn’t change between cooling and warming. The removal of significant cooling for the global data between the 1940’s and 1970’s is fraud. The AMO maches very well all reliable global temperatures except this period.
And from Jones et al..
oops for image again… why does image link disappear when you go to edit mode?
And showing that current levels are STILL ABOVE the range of the rest of the Holocene.
There is an old saying in physics: If you keep your data base short enough it will fit your theory.
Third only if you consider 2019 tied with 2007 and 2016, as NSIDC did in order to fake a headline.
But that’s in the satellite record. Arctic sea ice was just as low in 1931-40 as in 2011-20. During WWII, 1939-45, the Northern Sea Route off Siberia was open in summer. It’s still closed at the moment.
And 2013 and 2014 bounced back from the record low of 2012 by over 1,500,000 km2 or 50%
So what’s your point?
Just as did 2021 and 2022 from 2019 and 2020. The low years release a lot of heat, cooling the Arctic Ocean. Same thing happened after low years of 2007 and 2016.
The low years–2007, 2012, 2016, 2019 and 2020, occur when Arctic cyclones separate and pile up the ice floes. In 2016, there were two such cyclones.
The trend is flat since 2007 and up since the record low year of 2012. From 1979 to 2012 in the dedicated satellite record, there was never a five year period without a new record low. Now ten years, soon to be 11, without a new record low summer minimum. The trend is up again, as after WWII until 1977.
Heads up Griff! It’s 2022 and the ice is not melting! The Greenland SMB just gained 7 gigatons of mass. That is a summer time record! And the storm that brought all that snow is forecasted to hang over there today.
griff repeated exactly what was written on the first chart in the article and this quote got 52 down votes so far?
While I don’t vote on comments, I’d give griff an upvote for this one. The down votes reflect poorly on those people who hate griff with such a passion that they down vote his quote from an article (that I believe they approve of).
Some commenters here need to have their heads examined — those who agree with the article have no logical reason to disagree with griff’s quote from the article. That’s like a griff derangment syndrome.
Save your down votes for griff’s future malarkey posts, not this quote, or you will look as biased as he usually is. Let the Greene down votes begin !
You do know the Arctic has been ice free in the past, don’t you?
Be afraid. Be very afraid.
After a high 2021, this year is going to rival, if not beat, the three iciest minima since 2007, ie 2009, 2013 and 2014:
https://nsidc.org/arcticseaicenews/charctic-interactive-sea-ice-graph/
How is this possible after 15 years of steadily rising plant food in the air, including during economic downturns?
The evidence, including historic evidence going back to the days before satellite monitoring, suggests that there is a cycle.
I don’t disagree. My point was that if you’re going to make comparisons, make them of like objects. The fact that 2022 looks to be higher than the decadal average for the 2010’s isn’t a useful comparison, and you’ll need to wait until the 2020’s are done to see whether we are really on the upswing for minimum sea ice extents.
We have been in an upswing since record low of 2012, or possibly 2007, already, ie 10 or 15 years.
So far, both years in this decade have been above the 2011-20 average.
Summer ice extents have been growing from the low point a decade ago
Not smoothly, but in general they have been increasing.
Last year was also above the 2011-20 average.
I agree that one season does not make a trend. However this trend has been continuing for the last decade. Nice of you to ignore that.
By the way, you can create a decadal average by going back 10 years from the present. Nice dodge.
The fact that some collection of ten years may be showing an increasing trend is the sort of cherry-picking we rightly despise in the climatariat. If we pick a data subset to compare to like data subsets, then it’s too early to claim we are on the upswing. You are usually smarter that this, Mark.
I’m sorry but I’m confused. What is magical about the ten year data set ending in 2010 as opposed to one from 2012 ending i 2022? Am I missing something?
The OP picked the datasets to use. I’m just saying for internal consistency, stick with what you start with, and don’t try to compare a 10-year average, ANY 10-year average, to a single year.
Compare it to two years, ie 2021 and 2022. If this year falls in the range of the high years of 2009, 2013 and 2014, the Arctic sea ice meme is effectively falsified, even without reference to the low ice decades of the 1920s, ’30s and ’40s.
ignore the fact that the doom sayers have bee crying from the rooftops the exact opposite would happen! Why?
Natural variability.
Of the 15 lowest years, 14 are in the last 15 years
“Natural variability.”
Are you letting Hom Sap off the hook, griff?
If it’s good, it was caused by nature. If it’s bad it was caused by CO2. /sarc
And the record maximum extent for the Antarctic was set just a few years ago.
I’m not sure that you can understand the concept of a “seesaw,” griff, but there does seem to be a similar effect in play, which others have recognized.
The record minimum (in the satellite era) was set only a few months ago.
The beginning of the satellite era was the coldest period on the planet since the little ice age.
If we only count the Holocene, the satellite era is 5/1000 of the history of the epoch. Meaningless in geological time.
What are you basing this claim on? According to all the surface data sets the late 1970s were nowhere near being the coldest period in the temperature record.
Every decade from the 1880s to the 1930s was colder than the 1970s globally.
Now the lies are flying hard!
The 1960’s and 1970’s were cooler than in the 1940’s.
Sunsettommy said: “Now the lies are flying hard!”
Sunsettommy said: “The 1960’s and 1970’s were cooler than in the 1940’s.”
I’m confused. TFN’s graph shows the 60’s and 70’s cooler than the 40’s. Are you saying that this statement is a lie?
And what about the 70’s being warmer than the 1880s-1930s?
Which dataset are you using to assert that TFN is lying? And what content is the post are you keying off of to make the indictment of lying as opposed to just being mistaken even assuming you believe the information is incorrect?
For the record…I’m not seeing anything incorrect in TFN’s post.
You glossed over this and until recent years it was about .5C colder in datasets for the 1970’s over the 1940’s when that was the previous peak of a warming trend that had started around 1920 until their get got it revised upwards to about .1C
Final Nail writes this falsehood
The 1930’s and 1940’s were clearly warmer than the 1970’s
Sunsettommy said: “The 1930’s and 1940’s were clearly warmer than the 1970’s”
First, TFN did not say anything about 1940’s. Second, here is the data from GISTEMP.
1880’s: -0.21
1890’s: -0.24
1900’s: -0.32
1910’s: -0.33
1920’s: -0.24
1930’s: -0.12
1970’s: +0.04
TFN is right. Every decade from the 1880s to the 1930s was colder than the 1970s globally.
All this short term NATURAL VARIABILITY after the COLDEST period in 10,000 year (LIA)
We should be VERY THANKFUL for that slight warming !
Planet is still WELL BELOW the average temperature over the Holocene.
MarkW said: “The beginning of the satellite era was the coldest period on the planet since the little ice age.”
Which dataset are you looking to support this position? I’d like to review it if you don’t mind.
Certainly cooler than the the 1940s according to real unadjusted measurements and to people like Jones etc
And certainly in Hadcrut !
Notice the cold spike.. around 1979.
Is that the temperature of the planet?
If CO2 be the control knob, then why did Antarctic sea ice extent grow hugely from 1979 to 2014, while Arctic sea ice extent fell from 1979 to 2012?
Clearly, CO2 can’t be the cause of Arctic decline and Antarctic growth.
CO2 isn’t the control knob. It is only a control knob. Remember, just because variable C does not explain all of the effect E does not preclude C from explaining part of E. It also does not preclude another variable X from being of an opposite sign thus opposing the influence of C upon E.
It’s not even a control knob; with the amount of water vapour in the atmosphere it is a complete and utter irrelevancy. You might as well make a case for tree pollen to be a climate control knob.
Richard Page: “You might as well make a case for tree pollen to be a climate control knob.”
See Riccobono et al. 2014 for relevant information.
Not according to Gavin and unindicted co-conspirators:
https://www.science.org/doi/10.1126/science.1190653
Atmospheric CO2: Principal Control Knob Governing Earth’s Temperature
It’s a great paper, but it has little relevance since it is not discussing decadal or short term modulations in Arctic sea ice, Arctic temperatures, or global temperatures. It is discussing why Gt = Te – Ts = 33 K given the current albedo and no planetary energy imbalance. It provides insights into why Earth’s surface temperature is 33 K higher than its effective temperature. But it does not provide insights into why Earth’s surface temperature isn’t exactly 33 K and does exactly stay at 33 K on all time scales. Nor does it discuss why Arctic sea ice ebbs and flows or why it has been declining the last couple of decades.
Antarctic sea ice grew alarmingly from 1979 to 2014, while Arctic sea ice was declining. Obviously increasing CO2 isn’t the control knob on Antarctic ice. The Super El Nino 2015-16 set in, combined with two freakish WX events in 2016.
Here’s the record for Arctic sea ice:
Declining 1911-40. Growing 1941-80, Waning 1981-2010. Waxing 2011-present. Probably to 2040, as evinced so far.
Arctic and Antarctice sea ice are cyclic and largely out of phase, ie the well-known polar seesaw effect. No correlation with CO2 is in evidence.
That’s what I’m trying to say. CO2 isn’t the control knob. It is only a control knob.
Even if true, you haven’t connected any of this ice loss to air temperature changes, Even more so, to changes in CO2 levels.
Yes, Arctic sea ice is still VERY HIGH compared to the last 10,000 years.. Isn’t it griff.
Probably in the top 5% or so. !
Or are you into climate denial?
“Arctic Ice at Decade-High Level: Can Doomsayers Explain?”
Well, as they didn’t model it, they can’t or perhaps would rather not try to explain it.
First, one has to be humble (and at least honest) enough to admit we don’t know how it works.
Climate science is heavily pregnant with hubris and arrogance. Stillbirth is inevitable.
Yeah, even the current decade-high wasn’t modeled to be this low. In the IPCC TAR (7.5.2) from 2001 their modeled prediction for annual Arctic sea ice extents did not drop below 11e6 km2 until about 2030. It actually dropped below in 2005 and every year since then. And once again 2022 is on pace to drop below 11e6 km2 making it the 18th consecutive year to do so. There is a long history of subpar prediction skill in regards to Arctic sea ice extents. It is a similar situation in the Antarctic region as well as it has been record low territory for much of 2022 despite the IPCC predicting that sea ice extents down would actually increase slightly through 2030 before beginning to decline. The question is why has sea ice extents in both hemispheres been consistently lower than predictions?
One possible answer to the question is that more energy is going into the cryosphere than expected. This might also explain why the energy content (and thus temperature) increase in the atmosphere is less than expected.
Because they generally suck at predictions?
In all directions.
Because they generally suck at math. If they could actually do the math then they’d be physicists, not failed high school teachers with delusions of adequacy.
The ATL article is more about “summer sea ice” or “ice coverage for July and August” in the Arctic, but with the “annual minimum” due to become clear in only 3 or 4 weeks I’ll “move the goalposts” again to that target instead.
Methodology
1) Download the NSIDC NH daily data (direct link)
2) Calculate the averages for “the last N days of August” since 1987 (when the satellite data shifted from every 2 days to daily), for N = 7 to 31.
3) Calculate the deltas for those averages from the annual minimum for each year.
4) Note the (relatively) “narrow” range for the value N = 9.
5) Use that range (the 23-31 August averages) to “predict” what might happen this year.
6) Compare the shape of that curve with the shape of the “predictions” (for the annual Arctic sea-ice extent) shown in the TAR’s “Box 7.1, Figure 7.1” … particularly during the post-2012 decade …
This is embarrassingly rudimentary but I plotted NSIDC annual extent vs the IPCC TAR prediction. Because I had to pixel scape from the IPCC graphic which is laborious, I only plotted every 10th year.
I have said elsewhere that I tend to have to “visualise” data in order to start to “understand” it.
Your “plot” is much more “understandable” than the original words you typed, isn’t it ?
– – – – –
From 2007 to 2021, i.e. fifteen years, the “plot” for the NSIDC (annual mean) data consists of oscillations around a (roughly ?) horizontal straight line.
How does that compare to the “shape” of the (smoothed) curves in the TAR figure ?
Blah, blah, blah, arrogant rant, blah, blah, blah, cherry picked start date, blah, blah, blah.
Mankind has long been loathe to answer a question with “I don’t know.” Consequently, to avoid appearing ignorant, human history has been filled with guesses, fantasies, wizards and witches, demons and gods, all in an attempt to avoid saying,”I don’t know what caused that.”
Once the imaginary answer has been uttered, one must never back down, or risk being labeled “wrong!” The thing people fear most is being publicly outed as wrong.
I have found in my many years that the most intelligent people have the most self doubt about their beliefs while the most ignorant of people are absolutely certain of their genius.
Well, it’s a “change” therefore it is proof of “Climate Change”. Right?
(If it was at a decade low level it would have been proof of “CAGW”.)
No, today it’s at a record high decade level according to U.S. National Ice Center.
I wonder if the bears even noticed?
I think it’s pretty simple. Arctic melt was driven by suit deposited by wildfires and coal consumption. Coal in China has been largely cleaned (not clean by western standards, but much better than 2007), and there were fewer wild fires than the last few years. Maybe California will allow tree trimming along the roads and the arctic ice growth will continue.
Arctic melt is a function of seawater currents taking different paths.
AMO is in rule.
China is depositing formal wear in the arctic?
suit you sir !!
https://youtu.be/nLHv46-vOjE
‘Experts have told me, the Arctic will be ice free in the summer months as soon as 2014’
With such fantastic experts to look to for guidance, who are we mere mortals, to argue with them?
Thanks Al you revealed the scale of the unreliability of experts….
The only “expert” I’m aware of that made such an aggressive prediction was Wadham’s as reported by The Guardian in 2012. Strangely Wadham’s peer reviewed publication from 2012 says 2042.At any rate, it is never a good idea to put all of your faith on only one line of evidence. Most predictions were in the 2050-2100 range with the more aggressive end of that range (2050) looking more likely at this point.
We had Al Gore. Who needs a more expert expert?
The only thing worse than appealing to authority is appealing to a false authority.
Bill Ney backed him up. 😎
Here’s Wadham in 2016
https://www.theguardian.com/environment/2016/aug/21/arctic-will-be-ice-free-in-summer-next-year
He keeps crying wolf.
It is a good lesson in appealing to evidence as opposed to appealing to authority.
So, who had the evidience, Gore or Wadham? It appears they were on the same page and you seem quite fond of quoting Wadham, still.
From the Wadham 2016 article.
You have said on several occasions that summer Arctic sea ice would disappear by the middle of this decade. It hasn’t. Are you being alarmist?
No. There is a clear trend down to zero for summer cover. However, each year chance events can give a boost to ice cover or take some away. The overall trend is a very strong downward one, however. Most people expect this year will see a record low in the Arctic’s summer sea-ice cover. Next year or the year after that, I think it will be free of ice in summer and by that I mean the central Arctic will be ice-free. You will be able to cross over the north pole by ship. There will still be about a million square kilometres of ice in the Arctic in summer but it will be packed into various nooks and crannies along the Northwest Passage and along bits of the Canadian coastline. Ice-free means the central basin of the Arctic will be ice-free and I think that that is going to happen in summer 2017 or 2018.
KcTaz said: “So, who had the evidience, Gore or Wadham? It appears they were on the same page and you seem quite fond of quoting Wadham, still.”
I think you have me confused with someone else. I’m not fond of Wadhams.
Anyway, no one person has all the evidence. There many lines of evidence from many different people/institutions available for review.
I’ve never tried a Wadham so I wouldn’t know. However it is good to see that you have an open mind and are not concerned with what has gone before as long as scientific rigour is maintained. sarc
Poor Wadhams,
so irretrievably wrong that he has a unit of Arctic sea ice named after him 🙂
1 Wadham = 1Mkm²
Currently at around 5.3 Wadhams.
Big OOPS! from him (and all other Arctic Ice Worriers)
He did not put a number on it but Mark Serreze, director of NSIDC claimed that the Arctic was “screaming”. How’s that for scientific rigor?
Serreze claimed frequently that the Arctic was melting/”screaming”. Along with claims that the Arctic snow season would be much shorter too.
It looks like Wadham’s model is already wrong. Per Wadham’s model, this was not supposed to happen but, even though he missed the near term predition, you still believe he got it right for 2100? I wouldn’t, why do you?
Arctic Ice at Decade-High Level: Can Doomsayers Explain? – CO2 Coalition
https://bit.ly/3wM6SaB
08.30.2022
Arctic Ice at Decade-High Level: Can Doomsayers Explain?
With ice coverage for July and August remaining above the 10-year average of 2010-20, the extent of summer sea ice in the Arctic has surprised experts who once predicted that such levels would be impossible.
KcTaz said: “It looks like Wadham’s model is already wrong. Per Wadham’s model, this was not supposed to happen but, even though he missed the near term predition, you still believe he got it right for 2100? I wouldn’t, why do you?”
Can you post a link to Wadham’s publication you are referring to?
What is his prediction for 2100?
Either way, I’m not going to put all of my faith on only one line evidence especially from a guy who has a history of alarmist predictions that do not verify and which do not even match the evidence he submits to the academic community.
LOL! Arctic summer ice could vanish by 2013, expert says | Reuters
Warwick Vincent, director of the Centre for Northern Studies at Laval University in Quebec, said recent data on the ice cover “appear to be tracking the most pessimistic of the models”, which call for an ice free summer in 2013.
Years of Failed Arctic Sea Ice Predictions – Electroverse
Professor Wieslaw Maslowski from the Department of Oceanography of the US Navy predicted an ice-free Arctic Ocean by the summer of 2013.
NASA’S JAY ZWALLYAlso back in 2007, we had NASA climate scientist Jay Zwally’s prediction: “The Arctic Ocean could be nearly ice-free at the end of summer by 2012, much faster than previous predictions.”
In 2008, University of Manitoba professor David Barber prophesied: “We’re actually projecting this year that the North Pole may be free of ice for the first time [in history]. This is a very dramatic change in the High Arctic climate system.”
I could go on and on with that list but what is the point. You wouldn’t remember that either.
Its obvious. All the heat is hiding in the oceans and in the European heatwave instead of going to the arctic!
Simples!
😃
Joking apart, that is going to increase the polar albedo which may mean a harder than usual winter.
Albedo of water at that angle of incidence is indistinguishable from ice.
Albedo in winter is completely irrelevant because there is no sun.
The only effect of more ice is to insulate the water and prevent both radiation and evaporation. More ice keeps it warmer, and less ice lets it cool down. It’s a negative correlation.
Zig Zag Wanderer said: “Albedo of water at that angle of incidence is indistinguishable from ice.”
Sure, at very steep angles. But even at the North Pole itself the incident angle is below the threshold during the summer and yet we have an additional 30 degrees of zenith at the 60th latitude.
Anyway, you can see how albedo warming potential is inversely proportion to the amount of sea ice. Notice that 2022 is still +40 MJ/m2 relative to the 2000-2019 average.
Maybe somebody can help me out on this one. Why does anyone care how much ice there is in the Arctic ocean? I don’t get why that one is trotted out in these discussions. What is the actual harm if the Arctic is ice free?
All the polar bears would drown!
I don’t understand the Polar bear issue either. They can breed with grizzly bears and so are not a distinct species. If the world had an unfrozen Siberia and Boreal forest but lost the Polar bear I suspect it would be better off. The Grizzly could take the role of apex predator in the now unfrozen north. It isn’t quite the same thing as killing off all wolves in the eastern United States.
It is not unusual for related species to interbreed.
Hybrids from crossbred species are the foundations for husbandry, agriculture, orchards, flowers, etc.
Imagine the massive continent under the Antarctic ice devoted to growing food instead of being icebound.
I’ve read that there are large oil and coal deposits in Antarctica.
Because the polar bears will drown and the world will end, that’s why.
The Arctic and Siberia have the most global warming since the 1970s, while Antarctica has the least. So the Arctic and polar bears became the CAGW “poster children” Not working as intended for the past 12 years.
ff all the Arctic sea ice melts, there may be fossil fuel deposits that become accessible, and that would be good news. I don’t care about the polar bears. I don’t like any animal that would eat me for lunch.
It lowers Earth’s albedo.
Actually it doesn’t. In polar latitudes, water reflects almost as much light as does ice.
You think water reflects as much light as sea ice?
At low angles of incidence I know that water reflects as much and even more light than does sea ice.
How much will Earth’s albedo increase if Arctic sea ice were to completely disappear? Can you link to the evidence supporting your position?
Yes, it does.
Ice actually keeps the water from radiating and evaporating. It keeps the Arctic ocean warmer. Less ice lets it cool down.
That has nothing to do with albedo.
Directly from the Nick Stokes copybook?
The fact that ice suppresses radiation and evaporation has nothing to do with albedo. And I have no idea what Nick Stokes or his copybook have to do with that.
Zero harm.
However, if they can’t blame it on Man’s CO2 then there is zero excuse for the War on Fossil Fuel.
Alarmists have zero of their ‘predictions’ come true.
Including alarmist desperate belief that polar ice caps will melt.
When Antarctica utterly failed to show signs of melting away, alarmists bet their entire AGW claim on Arctic ice melting completely.
Alarmists claimed an iceless Arctic would cause many disasters.
Glaciers retreat that uncover plants/trees grown thousands of years ago in the holocene have scientifically destroyed the Arctic sea ice melting completely.
Which is why trollops refuse to recognize that Arctic sea ice is naturally cyclical. Instead they insist that CO₂ somehow directly melts sea ice.
Records assembled by Vikings showing the number of weeks per year that ice occurred along the north coast of Iceland date back to A.D. 870, but a more complete record exists since 1600. More extensive written records of Arctic sea ice date back to the mid-18th century.
Why is the period from 1979 the only important one? Do we think that the Vikings made up stuff or adjusted historical records?
The minimum ice extent was actually growing up until the mid 1980’s before it began declining. So, for a significant amount of time, CO2 and Arctic ice extent were correlated positively. This sort of ruins the narrative, so inconvenient data is disappeared.
As noted above, cycles play a role.
It’s not that it is the only important period. It’s just that it is the only period in which we have a bird’s eye view of the sea ice at both poles.
We have data that precedes the satellite era. Why are you so adverse to using it?
I use data that precedes the satellite era all of the. I have no reservations in using it. The WUWT commenters are quite critical of its use though. Perhaps you can help me convince them that it is useful?
Here it is:
From your link:
Looking at these lines of evidence, scientists surmise that Arctic sea ice may have melted completely in summertime about 125,000 years ago, during a warm period between glaciations. As recently as 5,500 years ago, summertime Arctic sea ice may have been much less extensive than it is today.
I would say it is more likely than not that Arctic sea ice extents were lower during the Holocene Climate Optimum. Also, there were periods when all low elevation ice on Earth was absent. In fact, one the warmest eras of the PETM in which is almost certain that there was no ice except maybe on mountain tops.
“Arctic sea ice extents were lower during the Holocene Climate Optimum.’
Arctic sea ice level were LESS THAN current for nearly ALL the Holocene.
LIA, 1979 were extreme high anomalies.
b.nice said: “Arctic sea ice level were LESS THAN current for nearly ALL the Holocene.”
Refer to the Stein et al. 2017 publication. Notice that the graph you posted does not appear in that publication as-is. It has been photoshopped. Notice that the data in the publication uses the “before present” convention of 1950 so the publication does not contain the last 70 years of sea-ice cover. Finally, notice that the data labeled as “Chukchi Sea” is actually from a single site only that happens to be in the Chukchi Sea and is actually identified as ARA2B-1A in the publication.
Just more Nick Stokesian nitpicking….
I allays wonder whether or not to indicate sarc in WUWT….
FN’s fabrication vs REALITY
FN’s fabrication does not match measured temperatures.
Is he saying that temperature doesn’t affect Arctic sea ice?
that would make even further NONSENSE of the AGW meme. 🙂
b.nice said: “FN’s fabrication vs REALITY”
It looks consistent with the graph posted by TFN.
BTW…Is this graph photoshopped as well? I’m asking because before I’d rather not waste my time pulling up the Alekseev et al. 2016 publication only to discover that this graph does not appear in it.
Vijay Jayaraj cherry picks his observation interval. Arctic sea ice is still two standard deviations below the 30 year 1981-2010 average.
.
.
http://nsidc.org/data/seaice_index/images/daily_images/N_stddev_timeseries.png
And still WAY above what it has been form most of the last 10,000 years
Vijay Jayaraj is usually a very good climate science writer, often presenting information about Asia that other writers ignore. This is not a good example. This is data mining a short term trend without the context of the 35 year trend of declining Arctic sea ice. And that is bad journalism.
“data mining a short term trend….”
Is this Newspeak for cherry picking?
Richard
What about comparing it with an even longer period and the substantial melt from 1908 to 1940 or a decade or so around 1820?
Over 30 years is a climate trend and measurements can be trusted if satellites are used. Are earlier estimates using a different methodology comparable? More context would be even better — the past 30 years, or the post-1979 trend, is just the minimum necessary for a fair article.
, The past 12 years could be the start of a new 30+ year trend, or a nothingburger — no one knows. But it happened, so the past 10 years is news, but best presented along with at least the past 30+ year trend. That’s not so hard to do.
Why go on about trends when the past has been cyclic?
Because the 1979 to 2022 database is being truncated for propaganda purposes, that’s why
“Over 30 years is a climate trend”
Who decides that? Cycles such as the AMO and PDO are more than double that arbitrary 30 year period. And then we have the warming trend since the Little Ice Age. Looking farther back we have more warming and cooling cycles. Three decades is ridiculously inadequate to determine climate trends.
And that is bad journalism.
It’s worse than that. Saying:
“Summer temperatures in the Arctic remained at levels similar to the 44-year average of 1958-2002, with no marked increase in warming.”
and posting this in support and ignoring the wild winter high spikes it is disingenuous.
https://wattsupwiththat.com/wp-content/uploads/2022/08/Untitled-3-3.webp
High Arctic (the DMI graph is modelled temperatures north of 80N) summer temperatures are capped all summer long by latent heat of melting: any additional heat just melts more ice that is the only reason it has not spiked too. When that ice is gone, it will spike too. Jayaraj knows this. Meantime crazy warm winter spikes – on the same graph – that hinder freezing, weakening the ice and making it more prone to melt in summer are ignored.
These days summer Arctic seaice is little more than a highly mobile, floating slushy of mostly first year ice, highly vulnerable to another melt event like that of 2012.
also of note: NW passage open this year…
It opens every year.
We have records of voyages through the NW passage going back hundreds of years.
Notably the RCMP St Roch, first vessel to complete the Northwest Passage in one season (1944), also making it the first to use the more northerly, deeper route and to complete the passage in both directions.
… and then there’s the reports of Captain Martin Inge-Brigstsen, a mariner who sailed those artic seas for 54 years.
The captain says that he first noted an annual warmth in 1918; and since then temperatures have risen steadily higher. Today the eastern Arctic is “hardly recognisable as the same region of 1868 to 1917.”
Weather History tells the story.
Throw the computer models in the trash.
More proof of warming in the region. Before 1920 the coalport at Spitsbergen (Svalbard) was only open for three months of the year. By the late 1930s it was open for more than seven months of the year
Another example. In 1984 the luxury cruise ship ‘Lindbad Explorer’ sailed the NW passage and completed the 4790 mile journey in twenty three days. 98 people paid between $16,900 and $23,000 for the privilege.
And yet – some numpties try to sail through it every year and get stuck in the ice that isn’t there.
Starting in 1906 is hardly ‘hundreds of years ago’. Then about 40 years until the next one. It is open most years recently though.
Also of note:Still no ice free summers at both poles.
Was open for nearly all he Holocene.. closed during the extreme high sea ice levels of the LIA and period after around 1950 as the extent increased due to Arctic cooling.
Fact that it is only just opening p now, shows just how cold it is up there , and just how much sea ice that still is. !
Has anyone managed the St Roch (1944) route yet, or do they still all sculk around the southern route via Churchill. !
It’s one season, true enough.
However, AGW promoters state we are in a crisis… CRISIS… past the point of no return, etc.,etc.,
So, while it’s one season, it does suggest we are not amid a crisis.
This is not a physical crisis or problem, but the result of mass psychology carefully crafted & developed over time by those who want to impose an economics of scarcity where none exists.
Earth is an abundance… it’s up to us whether we benefit from that abundance or not.
AGW promoters would have Americans live as serfs in a land of plenty.
Sick & wrong.
“Arctic Ice at Decade-High Level”
Not that important, but the headline is wrong.
2013 and 2014 were both higher at this time of year.
Decade high refers to greater than normal which is shown.
The article doesn’t say “Arctic Ice at Decade-highest Level”
“high”
great, or greater than normal, in quantity, size, or intensity.
“highest.” adjective. 1. Of, being, located at, or forming the top: loftiest, top, topmost, upmost, uppermost.
Cool. So if 2022 is warmer than the average of the last ten years, we can say it’s a decade-high temperature?
Be VERY GLAD its warmer than the LIA. !!
They already do almost every year.
By extension we should also be able to say that it’s Decade-low when it’s below the average of the decade? I can’t see that going over well here.
And 2021, according to JAXA data for 31/8.
It is merely the start of the next big Ice Age.
It is probably because China has been at a standstill all year.
The reduction in Arctic sea ice was due to Chinese industrial dust lowering the albedo of the northern ice sheets, thus allowing greater insolation absorption and melting. With China at a standstill, the Arctic ice sheets can now recover.
Note that Antarctic ice sheets have been INCREASING since 1974. Why the hemispheric disparity, if a global feedback agent (CO2) is supposed to be responsible?
Answer: Because the true feedback agent is ice-sheet albedo, not CO2.
R
More likely because we have just experienced the rare phenomenon of a triple La Niña, likely we will transition to an El Niño next year.
This September, we will have the flattest 16-year trend in the 44-year record (zero trend). 16 years pause. Of course, it’s not a pause – Arctic sea ice will be increasing in the next few decades.
http://nsidc.org/arcticseaicenews/files/1999/10/Sep_monthly_extents13yr.png
http://nsidc.org/arcticseaicenews/files/2021/10/Figure-3-sept2021.png
AMO is due to dip down soon.. Then Arctic sea Ice will increase.
Hopefully NOT to the extreme extent of 1979.
It far better for people and animals living up there NOT to have year round sea ice.
The drop from the LIA-like level of 1979 has allowed many Arctic sea creatures to return, after a very cold period where they were forced out of the habitat they had become accustomed to for nearly 10,000 years.
Is there any harm whatsoever from an ice-free Arctic? Are we still stuck on the Polar Bear excuse?
We shouldn’t worry about things over which we have no control.
The Lord controls all things natural and supernatural. Man has a desire to predict to control. Pretty sure He waits for the predictions and then does what He wants!
What evidence have you to support your supposition … “The Lord” is a “He” ???
Griff wins again. Guys, give it up. As in, stop feeding the troll. It would make viewing all the other meaningful comments easier.
This is not to say what you post in response to Griff is wrong. Just ignore him. Wasted time.
It’s worse than they thought.
According to NSIDC Charctic graph 2012 and 2020 were indistinguishable from this year.
Since 2007, only 2009, 2013 and 2014 was there more ice extent. 3 years out of 15 since Al Gore’s scientists were predicting imminent “ice free summers”.
???
My eyesight is degrading with time, but the 3 lines below are readily “distinguished” as different by me.
Do you have an error in your bookmarks ?
https://nsidc.org/arcticseaicenews/charctic-interactive-sea-ice-graph/
Yes but it is rotten ice, don’t cha know. 😉
I get a big laugh when I see such manipulative blah blah:
” Summer temperatures in the Arctic remained at levels similar to the 44-year average of 1958-2002, with no marked increase in warming. ”
Firstly, the guest poster manipulates his readers by talking about summer temperatures in 2022
http://ocean.dmi.dk/arctic/plots/meanTarchive/meanT_2022.png
without allowing the readers to compare 2022 with other years, because he intentionally posted a link to the 2022 chart instead of posting the original link:
http://ocean.dmi.dk/arctic/meant80n.uk.php
There you can see that the summer temperatures behave similar for nearly every year.
The relevant differences are before and after the summer!
*
Second manipulation: the guest poster has hidden the fact that DMI presents a tiny part of the Arctric, namely 80N–90N.
But the Arctic, that is 60N-90N!
There is no DMI data for 60N-90N, however.
The only way for me to give you an idea of how 60N-90N differs from 80N-90N is to show you UAH grid data:
Got it?
“The relevant differences are before and after the summer!”
LOL! You mean when it remains below freezing the whole time and thus there is no melting?
From the DNI Polar Portal. (bold mine).
Sea Ice Thickness and Volume: Polar Portal
The graph on the right shows the annual variation of the volume of the sea ice in the Northern Hemisphere, excluding the Baltic Sea and the Pacific.
You need to take volume (thickness) into account and combine both to compare