Guest Opinion: Dr. Tim Ball
When you put the claims of the Intergovernmental Panel on Climate Change (IPCC) in perspective, you get a very different picture that defies logic. I decided to do this because of their recent hysterical claims in Special Report 15 (SR-15) designed to frighten and bully the world into completely unnecessary and enormously expensive environmental and energy policies. Charles Steele summarized their claims and proposed policies in his article, “Climate Doom Ahead? Think Twice,”
“…we have only twelve years to avert climate catastrophe and calls for a fundamental transformation of society and end to the use of fossil fuels. Endorsing it is a critical step towards adopting it, and adopting it would change virtually every element of civil society as we know it today.”
Steele notes that,
“It’s less a scientific report and more a political platform, driven by ideology, not science.”
I agree. Even some members of the IPCC admit it is not about climate but involves an excuse for ideological actions such as a transfer of wealth. However, the majority of the IPCC and its proponents would disagree. They would claim the concern and demand for action are based on science set out in the AR5 Working Group I Report, The Physical Science Basis. Well, let’s examine what they say.
My comments in regular type follow the IPCC claims in italics.
1. Human influence on the climate system is clear, and recent anthropogenic emissions of greenhouse gases are the highest in history. Recent climate changes have had widespread impacts on human and natural systems. {1}
The first sentence is a non-sequitur and represents a classic form of introduction to deception. Human influence is not clear because human production of CO2 is within the error of the estimates of two major natural sources, the oceans, and rotting vegetation. You cannot separate human production from the noise of non-human production and variability. Obviously, anthropogenic emissions are the highest in history. If you have a constantly increasing level, the highest levels are the most recent. The second sentence is unprovable. If you don’t know the baseline, that is the impact of climate change before the human impact, then you cannot determine any trend. Consider just one example. There is more total forest in the world than existed in the past. America has more trees than existed 100 years ago. How do they know? Besides, it depends on what time in the past you choose. For example, there are many more than existed 20,000 years ago at the peak of the last glacial period.
2. Warming of the climate system is unequivocal, and since the 1950s, many of the observed changes are unprecedented over decades to millennia. The atmosphere and ocean have warmed, the amounts of snow and ice have diminished, and sea level has risen. {1.1}
This is another form of introduction to a deception that starts with a false premise. Even a brief look at any historical climate record shows equivocal and even greater periods of warming than those between 1950 and 2018. Just look at the Antarctic ice core record from Petit et al.

Remember, they subjected this curve to a 70-year smoothing, so much of the variability was eliminated. Despite that, there is great variability over short periods. Then consider the Central England Temperature curve from 1659-2018. There is nothing extraordinary in the 359-year record when compared to the 68 years from 1950.

The IPCC assert with 95% certainty that 95% of the temperature increase since 1950 is due to human CO2. The problem is if that is true then the record cold temperatures occurring now cannot occur. If the IPCC claim is correct the only way such record cold can occur is if the CO2 level decreased. However, it is the IPCC who tell us it continues to increase.
The fallacy of the IPCC claims is in the continual changes of temperature that occur every day. The Sun rises, and the temperature begins to increase as the solar angle increases. There is no increase in CO2, just as there is no decrease when temperatures begin to decline as the Sun sets. If CO2 is the dominant factor in temperature increase as the IPCC claim, then it should be a major influence on the daily temperature, but there is no such evidence.
As usual, the mainstream media reports that 2018 is the sixth warmest year on record even before the year is over. This is not surprising or significant because the highest temperatures must occur at the end of a warming period. The most reasonable period to consider for this warming trend is from the nadir of the Little Ice Age in the 1680s or over the last 338 years.
The media reported on front pages all over the world the IPCC 2001 Report that drove the world into warming hysteria because they said temperatures rose 0.6°C in approximately 120 years – an increase not possible without human CO2. Why aren’t they reporting with equal vigor that in just two years from February 2016 to February 2018 the global average temperatures fell by 0.56°C? If the IPCC claim about the dominant role of CO2 post-1950 is correct, then that warming simply cannot happen.

3. Anthropogenic greenhouse gas emissions have increased since the pre-industrial era, driven largely by economic and population growth, and are now higher than ever. This has led to atmospheric concentrations of carbon dioxide, methane and nitrous oxide that are unprecedented in at least the last 800,000 years. Their effects, together with those of other anthropogenic drivers, have been detected throughout the climate system and are extremely likely to have been the dominant cause of the observed warming since the mid-20th century. {1.2, 1.3.1}
Here is another typical form of introduction designed to set the stage for the falsehood that follows by making a statement that appears absolute because of its unjustified certainty. They neglect to say they limited the ‘greenhouse gases’ to CO2, which is approximately 4% of the total. Yes, human greenhouse gas emissions are higher than ever, but you cannot substantiate the claim of their impact if you don’t know how much water vapor, the most important and abundant greenhouse gas by far, there is, or how it varies over time. The claim that levels of carbon dioxide and methane are unprecedented in the last 800,000 years is only true if you ignore the severe problems and limitations of the ice core measures and ignore the 90,000 19th century CO2 readings that show much higher levels. It is not true if you extend the record back to 280 million or 600 million years then the levels are among the lowest. All of this is only valid in their claims if you assume that a CO2 increase causes a temperature increase. However, that is not true in any of the records. Indeed, the lack of correlation between CO2 and temperature in the geologic record contradicts their claim more dramatically. The Ordovician Ice Age, approximately 432 million years ago, occurred when CO2 levels were over 4000 parts per million.
4. In recent decades, changes in climate have caused impacts on natural and human systems on all continents and across the oceans. Impacts are due to observed climate change, irrespective of its cause, indicating the sensitivity of natural and human systems to changing climate. {1.3.2}
This is another classic introduction that appears authoritative, but in fact, is what the English call “Stating the bleeding obvious.” In all decades throughout Earth’s 4.5-billion-year history, climate change caused impacts on natural systems. It is disingenuous and wrong to separate human systems because we are part of the natural system. This is another example of the false assumption that humans are not natural that I wrote about before. The entire comment is an insult to the intelligence. It is a statement of environmental platitudes that says absolutely nothing – in other words, it is purely political. Despite that, production of the IPCC Reports costs millions, and the unnecessary policies, based solely on their falsehoods, cost trillions.
The saddest part of all is a horrible irony. All this waste of time and money to create a lie and inflict completely unnecessary policies at great cost, pain, and damage, is only possible because of successful and wealthy economies based on burning fossil fuels. Paradoxically, the IPCC acknowledges this by saying the less successful economies need financial help to succeed. What do the less successful economies want? The ability to burn fossil fuels. These are the insane actions of politically misguided, ideologues with tunnel vision. It is time to stop the insanity.
Thus the progress of climate change in a culture of corruption fueled by fossils, young and old.
Neomarxism desperate to have a green(Dark red) change, read a classic radical change of the Western World dressed up as being climate action.
Before reality and facts make these radical changes in the Western World meaningless? Its not about saving Nature, climate and Environment. Its about saving marxism?
The proper conclusion they should have arrived at is that we still understand very little about the climate complexity, and that the warmist scientific bias is a threat to the advancement of science. However, that there are no signs of a short term threat of an ice age and that therefore everybody can go to sleep without worrying about the climate.
They don’t care how much we understand. They only want to generate large transfers of wealth on which they can parasitize as rent seekers.
A hundred million is lost here and there. Who will notice in the Trillions being wasted on something that will have no significant impact whatsoever on the temperature of the planet. It doesn’t matter what we can prove because there’s too much money involved for any of them to care. You hit the nail squarely on the head there. The UN believers have to have money for more, “research” and “reports”. Which are an affront to real scientists everywhere and they know how unethical and criminal these UN officials are. Everyone in the scientific community isn’t brainwashed by some of the well paid professors in our universities. Excellent article.
Incompletely, and, in fact, insufficiently characterized, and unwieldy. Chaos, and the imperative for a scientific logical domain in the near space; otherwise, prophecies of the future, and myths of the past.
Better yet, show me that carbon dioxide actually causes warming! Incredibly enough, THIS HAS NEVER BEEN DONE!!! All “proofs” of which I’m aware are THEORETICAL, ONLY (e.g., Feldman, et al., 2015). FACT: CO2’s IR output is from 13 to 17 microns, wavelength, corresponding to a temperature range from -53 to -101 degrees C. FACT: MEAN Earth surface temperature is 288K = 15 degrees C. Tell me how CO2’s relatively weak radiative output equivalent to a range of temperature from -53 degrees C to -101 degrees C can ever raise Earth’s surface temperature by 56 to 118 degrees C? The impossibility of doing that is what finally convinced me that “greenhouse warming” is nothing more than “voodoo science!” (Please respond to my email address, davidlaing(at)aol.com)
Don’t try to bring logic and evidence to this discussion. Show me your model.
A model, hypothetically speaking.
I’ve got Lego models, match stick models, airplane models, just give me a million and I’ll make any model you want to validate thy belief in climate change 😉
Where does that 12 year deadline come from? Why do they project exponential change just now?
That 12-year “deadline” comes from a place where the sun doesn’t shine.
I knew it, Canada, eh?
https://www.youtube.com/watch?v=TKUDRW9EA2c
Sasskatoon…
Nice one Ron +1
DR BALL SPEAKING OF CANADA HERE IS A LINK TO AIChE JOB POSTING:
https://careerengineer.aiche.org/job/professor-in-chemical-storage-of-renewable-electricity-energy/45769222/?utm_source=JobFlash&utm_medium=Email&utm_campaign=JobFlash-1%2B2%2C%2B2019
Thought you might find this interesting
Desperation. This may be the last chance the alarmists have before we get some serious cooling.
Even if we ignore sunspots, we still have the AMO which is heading into its cool phase and which will take the global average temperature with it. link CAGW could be a hard sell in the next few decades.
That’s why there is this panic among the warmists and the fraud for grants industry. Ordinary people have seen through the lies. Failed models and forecasts have convinced ordinary taxpayers that there a tsunami of BS. Politicians who try this on are going to get pulverized. The MSM is still affording fraudsters unfettered media space, whilst the independent minded are getting stronger every day.
A lot of **global warming** is tied to the loss of sea ice in the Arctic. If the -AMO regenerates that sea ice then there will be strong cooling in all the data sets. That should mark the end of the alarmism.
If we get a strong La Nina (probably take 2 years) after the current El Nino fades, then that could help drop the AMO (and PDO) and along with the current solar minimum lead to a quick build up of sea ice.
And all of this probable near term cooling will be generally bad for civilization. I remember the winters of the 1960’s and 70’s.
On the positive side would be the (possible) salvation of our scientific institutions… currently corrupt… the vast majority either participating or silent.
Overall a net positive.
The cooling will definitely be a great net positive if we can put the wasted $Trillions to more efficient and positive economic use.
The ignorance of the amount of time needed for doing major projects is staggering. Upgrading Ottawas sewerage system has been going on for about 25 years. Ive been on mining orojects that take 7 to 12 years to complete, building highways, harbour works, railroads … and these ivory tower clowns want to completely dismantle global civilization, switch away from our transportation and power technology, to unproven (actually proven inoperable) alternatives. Its an impotent scream (to whom?) to do something.
Some among this cult must know that with the US out if it there IS no one to do anything. Perhaps the new crop of Climate Depression sufferers are a measure of this awareness.
Trump is really the only good news.
The Global Warming gravy train now has huge momentum. The Australian Capital Territory, where Australia’s law makers take refuge would be 90+% in favour of all the trappings of Global Warming. I figure most Washington DC residents have a similar proportion riding this spectacular money train, who despise their uninformed president.
It would appear London, Brussels, Paris and other capitals are infested with the same politically correct alignment with Global Warming. It will be at least 20 years and lots of obvious cooling before there is enough disillusionment amongst the faithful that Global Warmer loses its PC gloss.
Banks and retirement funds are now locked into the gravy train and would suffer badly if subsidy farming was turned off. Banks are a powerful global lobby and we have seen how high governments jump when banks demand they jump.
A little bit of cold weather is not going to slow this particular train. The weather constantly supplies the rare events that reinforce a message of climate disruption. Fiddling of data can go on for ever as long as government and their authoritative mouthpieces hold true to the religion. There are classic ways to promote Global Warming; like POLAR MASS LOSS being the headline but the actual number being negative or this year was the 70th WARMEST in the last 100 years. The headline gets the attention; the number meaningless.
The major political parties in Australia are essentially aligned on Global Warming because the elected representatives only represent their minders and lobbyists in the capital. Their broadcasting commission is fully aligned with Global Warming and repeat every alarmist headline without filter or even fact checking.
I agree, Rick, 100%.
We tend to think of the AGW issue as a stand-alone issue, but that is far from true. It is an offshoot of a political culture, which, in turn, is a symptom of a disease currently spreading through the human population like the plague.
The disease is victimhood, and the symptomatic politics is socialism.
There is a huge difference between being a victim and living in victimhood. We are all victims on a daily basis, as someone will likely inconvenience us in one way or another at some point, as we tend to in convenience others by just living our lives. Some ‘inconveniences’ are much bigger than others, and the pursuit of justice is a noble endeavor, but victimhood is not about justice. It is about being addicted to the mindset that one’s miserable existence is the fault and responsibility of others, thereby feeling justified in doing anything (or nothing) one wants to do! It is a disease that eats away the life of the infected, individually or as a society, and is highly contagious. It destroys the spirit, happiness and well-being of the diseased, and is the primary cause of human conflict.
The disease of victimhood has always been around, but it is a state of mind that is transmitted through communication. It is no wonder that victimhood is now endemic in human society. The communication revolution has unleashed this plague upon our species, and it is rampant in our schools, our media and our political systems. In today’s world, addiction to victimhood is praised and rewarded, while notions of responsibility and self-reliance are looked upon as suspicious at best, and with great hostility at worse.
It is only in this diseased state of victimhood that socialism can be seen as virtuous and workable. And it is only in this diseased state of victimhood that man-made climate change can even be an issue! If we weren’t infected with victimhood, global warming and CO2 fertilization would obviously be heralded as a gloriously wonderful thing! Mired in this state of ‘look what you did to me’, there can be no good news. Everything is a problem that is someone else’s fault!
Global cooling will not do away with the climate change issue, because the issue is not derived from the almost imperceptible changes in climate, which are overwhelming positive. As long as victimhood is driving our lives, we are doomed to a life of pessimism and misery. That is the legacy we are leaving our children.
God help them!
RickWill, agree. The only way I see the gravy train stopping is hitting the bottom of the canyon after falling off the wrecked bridge.
Excellent comment. I consider it the decline in the physical, mental and spiritual vitality of the middle and upper classes. The decline cuases people to be inadequate to the challenges of overcoming obstacles and induces resentment and spite to those who have the physical, mental and spiritual resources .
We have a large affluent effete impractical opinion forming class who lack the qualities of those who gave us the Agricultural, Industrial Revolutions and great period of exploration.
They are like the Mandarin class which oversaw thedecline of China from about the 18th century.
And we have all these volcano’s going pop.
Theres a decade of cooling, more contraction, more popping.
commieBob
The next important climate change
is going to be the end of our current,
pleasant interglacial period
Minor average temperature changes
of a degree or two C.,
over a century or two,
are meaningless, harmless,
natural variations
… that no one would even notice
if not for the leftists braying like donkeys!
If we could warm the planet
with extra CO2 in the air,
which is a reasonable theory,
but without scientific proof
outside of simple lab experiments,
the extra CO2 would be beneficial
for C3 plants used for food
by humans and animals
… and would
also delay the end
of the interglacial,
and the coming cold climate,
caused by changes
in planetary geometry.
Of course those conclusions
are based on logic,
and real science experiments.
The timing is unknown,
but our current interglacial
has been around for quite a while !
With the usual junk climate science,
any scary fairy tale about CO2
is accepted, and published,
because the primary goal is to scare people
(not to accurately predict the future climate).
After three decades
of wrong climate predictions,
made with computer games,
we all know that predicting
the future climate
is not possible !
With real science,
wrong predictions
falsify a theory / model.
With climate junk science,
wrong predictions are repeated
every year, assuming the sheeple
will forget the prior years’
wrong predictions !
My climate science blog:
http://www.elOnionBloggle.Blogspot.com
Is your word wrap broken?
They assume that the models are correct and that some unknown factor has delayed the warming, and any day now the temperatures are going to snap back to where they are “supposed” to be.
Remember that claim from five or so years back: the missing heat is hiding in the world’s oceans! Time to dust that off and front it once again to explain the developing global cooling trend.
Oh missing heat, olley olley oxen free . . . come out, come out wherever you are!
BTW, why can’t any of those super duper IPCC climate models tell exactly were the “missing heat” is going? (No, please don’t answer that . . . it’s a rhetorical question, of course).
The heat has escaped to outer space where it is doing its small part to bring the universe to thermodynamic equilibrium aka “heat death” or maximum entropy.
Haven’t we already passed several past “deadlines”?
It seems that every time they claim we need to do this or that by (plug in the year), and that year passes, they start up anew with a new year we have to do this or that to avoid some calamity that should have already happened.
Arctic must be already over the threshold if the global average is just 0.5 C away. And my Siberian willows love it 🙂
Haven’t we already passed several past “deadlines”?
The continuous stream of ever revised doom-deadlines over 30 years proves that this is a propaganda exercise and nothing to do with science. It’s all about allowing a governmental structure of high level centralization to form and ‘save.the planet’. (Or was that ‘enslave’).
Agreed. Wasn’t in 2010 we were told that we only had 10 years to save the planet. And the Arctic Ice Death Spiral would mean an ice free Arctic Ocean by 2018.
Can we just except that we are all gonna die and get on with it ?
expect?
Yes prognosis of death is 99.99999999%. ( excepting when the trumpet sounds – 1 Cor 15.)
I’m in denial.
Similar place to this: http://www.jri.org.uk/brief/Briefing_18_Joseph_JTH.pdf
Former IPCC boss Sir John Houghton, in 2009 wrote that we had 7 years to save the planet, based on the story of Joseph in Egypt.
Pharoah and Joseph had
7 YEARS
So have we
2016
Also in 2009, Prince Charles said we had 100 months to save the world.
https://www.telegraph.co.uk/news/uknews/theroyalfamily/4952918/Prince-Charles-we-have-100-months-to-save-the-world.html
It was of course before the Copenhagen Climate COP later that year and they always ramp things up beforehand, as with SR15, started 2 years ago, to be ready just before Katowice.
“Of course the climate is changing. That’s what it does.” Just to be fair, if you intend to say such a thing to a believer, the humane thing is to have some smelling salts available. 🙂
He’d better have Durian at hand.
Thank you, Tim, for your untiring efforts to speak truth to power. What is painfully obvious to most individuals with a solid introduction to the scientific method needs to be stated over and over again.
More than just politics, the modern movement to ostensibly control climate through unprecedented restrictions in the combustion of fossil fuels is a full-blown religion, with original sin, clinate guilt and indulgences. The UN statements are declarations of faith, difficult to prove or disprove, as nobody really knows how much of recent climate change was man-made or not, despite haughty claims otherwise.
Deep down, even the most ardent proponents of the global warming fanaticism know that this is all about moving large sums of money from one place to another. The ‘scientists’ who play along with the charade have knowingly corrupted science in order to keep the party going.
The alarmist rhetoric is becoming shrill, a clear sign of desperation. Let’s hope this is a turning point!
Yes I know, lies, lies and yet more lies.
But it makes no difference, the Media loves it, both to sell the newspaper or TV time, and the fact that at least part a part of the Media use this report for its own political ends.
But sadly the poorly educated politicians as usual are far more concerned at keeping their jobs, than any concern for the well being of the economy.
As said many times before we must wait till the power system finally collapses. Then its time to done the yellow jackets, but by then it will take years to recover.
MJE
Unfortunately, I think you’re correct Michael. It makes no difference and the media loves it.
From where I sit (Toronto, Canada) if you are not on board with the AGW Climate Change alarmist narrative you are irrelevant.
All of our political, academic, media and corporate elites buy into the man-made global warming conjecture. The ignorance surrounding the issue is so dominant I avoid talking about it.
And this nonsense will continue,
This is not the end. It is not even the beginning of the end. But it is, perhaps, the end of the beginning.
Don’t avoid talking about it. Confront alarmists at every turn and make it plain that you won’t put up with their bullshit. Visit me on twitter and then email me. I have a plan.
Thank you for the encouragement Alan but it’s not easy.
I come from a family of academics, I sit on the board of my condo and I play senior men’s curling….they are all in the alarmist camp and they are all important to me…so I have no choice, I do not want to be hated.
Heck, I’m the only one in my family with a STEM degree, and I’m the one who gets called anti-science. Luckily my personality prevents me from being put off by that at the least. I just ask them questions like “Do you know how a temperature anomaly is calculated, and what the difference is between an anomaly and a mean temperature?” “Do you know how to calculate the error bars in a series of measurements, and how to determine the precision of the mean?”
“When you’re going through hell, keep going”
IPCC
Press release: May 2017
“Edmonton to host 2018 cities and climate change science conference”, Edmonton, Alberta
https://www.ipcc.ch/search/?search=SDSN
Sustainable Development Solutions Network (SDSN), or a.k.a UNSDSN
IPCC
CitiesIPCC
“IPCC Working Group lll at COP23, November 2017
https://www.ipcc.ch/search/?search=CitiesIPCC
CitiesIPCC
“Cities & Climate Change Science Conference”, March 5-7, 2018, Edmonton, Alberta
Conference information. Follow the links.
http://www.citiesipcc.org
Need to view all 3 of these items for information about IPCC activities in Alberta/Canada and organizations involved with the IPCC. Otherwise, way too much information to try to post here.
Networking?
And,
IPCC
“View Useful Links”
Links include SDSN and other organizations.
Click on any link/links on the Links list menu.
https://www.ipcc.ch/links
Networking?
“bully the world into completely unnecessary and enormously expensive environmental and energy policies. ”
It’s worse than that. They state explicitly that they want to reorganize society from the top to the bottom. That is take power and money from the bottom and middle and concentrate it at the very top.
The IPCC is a clear and present danger to civil society.
Of course, this means that politicians need to “do something” in order to take credit for the drop.
I have noticed that the alarmists on this site have slunk off and are relatively silent on the basis of the preponderance of evidence that this is a scam. They dont have the balls to admit this or else they are still part of groupthink religion.
Oh where is Griff when we need him (for comic relief)?
Alan you need to go on Reddit. The religion is very strong there. Lots of young people.
Warning: it’s mostly anti-Trump, cat and dog postings, but there a few alarmist posts
Thank you, Dr. Ball, for this refutation.
I make a point of reading all your pieces on WUWT because of the clarity of your prose and your citation of sources. I frequently quote your writings for both climate realists and proselytizers of pseudoscience.
Despite relatively mild weather and all that ‘fantastic’ renewal energy, the export of Russian gas to Europe has reached a new record in 2018.
Gazprom, which has a monopoly in gas pipeline exports, has sold 201 billion cubic meters of gas to Europe and Turkey in 2018, or about 3.5 percent more than a year earlier.
The thing that is constantly overlooked is what the IPCC charter says, and has said since the beginning – to identify ways in which HUMANS are affecting climate. With that charter, there is no need to understand what drives climate change, because ipso facto, it is claimed that CO2 is the control knob, and no one has proven differently. I have said for 2 decades that it is time to use ‘real’ scientific methods to determine exactly WHAT greenhouse gases do, if anything. I suspect the answer is nothing, since all gases must obey the same ideal gas laws, and there is no provision for any gas to be treated differently. So, gh gases cannot be at a different temperature than the other gases in the same volume.
So, all the solar effects on our climate are non-starters – we cannot be responsible for changes in the sun, thus no research is needed into that area. It is worth reading the charter just to see how they outlined a way to ignore virtually all natural climate change and focus on only one thing – we emit CO2, and thus it is claimed there is an effect. It is a hypothesis, not a theory, nor a law. Hypotheses are proven wrong all the time – they are the weakest of scientific proclamations. Why is no one willing to do the experiments to prove what CO2 does or does not do?
John Shotsky, December 29, 2018 at 12:57 pm
Hi John. You say:
“With that charter (the IPCC’s), there is no need to understand what drives climate change, because ipso facto, it is claimed that CO2 is the control knob, and no one has proven differently.”
That’s an interesting point. The CO2 control-knob has been the central, fundamental axiom of the whole alarmist man-made global warming thought-system from its beginning, but it was formally rationalized and enshrined in the peer-reviewed literature only in 2010 with a paper by Andrew Lacis, Gavin Schmidt et al entitled Atmospheric CO2: Principal control knob governing Earth’s temperature. Their essential argument is summarised in the last sentence of the Abstract, which says:
“Without the radiative forcing supplied by CO2 and the other non-condensing greenhouse gases, the terrestrial greenhouse would collapse, plunging the global climate into an icebound Earth state.”
In other words, they are proposing (elaborated in their full paper) that if all the non-condensing GHGs in Earth’s atmosphere were to be removed, the global mean temperature would drop sufficiently to cause all of the condensing GHGs (chiefly water-vapour) to precipitate out completely and leave the atmosphere totally without any GHGs at all, whereby the Earth would revert to its so-called “black body temperature” of about –19°C.
i.e.: No non-condensing GHGs (chiefly CO2) = no global warming = “Snowball Earth”. Thus, non-condensing GHGs control the global mean temperature.
As readers might guess, they justify this proposition wholly on the basis of their own, self-invented climate model and computer simulations, without reference to any empirical observations of the ways in which condensing GHGs actually behave in the real atmosphere and without explaining how their argument can possibly be reconciled with basic laws of physics with which it is obviously in conflict.
It is well-known to physicists that all liquids evaporate and all solids sublimate to some extent, even though their rates of evaporation and sublimation depend on their surface temperatures (and other factors). But whatever their temperatures might be, there will always be some evaporation and sublimation; it just happens more slowly under cooler temperatures, right down to absolute zero.
So if we could remove all non-condensing GHGs from Earth’s atmosphere and, at the same time, somehow cause all the condensing GHGs to precipitate out and cause the global surface to cool to its most frigid possible “Snowball Earth” average temperature as Lacis, Schmidt et al hypothesise, what would happen next?
According to the standard laws of physics, what would happen next is that all the ice which covered the planet from pole to pole would start sublimating, i.e. producing airborne water vapour and, at least at the equator where the intensity of incoming solar radiation was at its strongest, the ice would start to melt and produce water vapour at a faster rate by evaporation. Now, water vapour is recognised by all concerned as being a powerful GHG, so the effect of all this continuous sublimation and evaporation would be to accumulate water vapour in the atmosphere, which would act as a new resident atmospheric greenhouse to produce global warming at the surface via the greenhouse effect.
The accumulation of atmospheric water vapour would continue until it was in balance with the rate of precipitation from clouds and at that point the average global temperature would stabilize – perhaps not at the same level that it had at the start before we removed the non-condensing GHGs etc. (that question is beyond the scope of my present argument), but still substantially above the basic “black body temperature” because of the resident greenhouse effect solely from water vapour. It might take a long time – perhaps a whole geological age – for the new watery atmospheric greenhouse to establish itself, but what of that? It would still happen, inexorably.
So the end effect of removing all non-condensing GHGs from Earth’s atmosphere would be not to turn the planet into a giant snowball as Lacis et al’s bizarre computer-program maintains, but simply to replace its current atmospheric greenhouse consisting of a mixture of various condensing, and non-condensing GHGs with another atmospheric greenhouse consisting solely of water-vapour. There might not even be any significant change in the equilibrium global mean temperature at all.
I am at a loss to understand how supposedly intelligent, highly-educated “climate scientists” like Lacis, Schmidt et al (and their peer-reviewers!) can have missed seeing this basic physical flaw in their argument when it surely must be obvious to any high-school physics student who takes the trouble to read their paper.
+42 and many more.
Since CO2 is quite soluble in water/seawater (think of soda pop, for instance, in the first case), unless Earth’s oceans were fully degassed of all dissolved CO2 before becoming ice-covered, even under snowball Earth conditions the sublimation/evaporation of water into the atmosphere would necessarily involve restoration of some amount of CO2 into the hypothetical non-condensible GHG-free atmosphere.
As to your last paragraph, look up “confirmation bias”.
Cassio
It is fine is they publish such a paper and continue to believe in it. That’s science.
It’s what you do with this proposal which is the problem. Circumventing the validation, verification, certification and auditing processes that happen for every other commodity and service that we deem safe, is the issue.
Saying that for some reason climate is different is another issue.
The erosion by precipitation in a watery world produces the non condensing gases as would volcanic activity which would never cease.
An enjoyable read Cassio.
A real greenhouse does not stay warm because of the action of “heat trapping” greenhouse gases that cause a radiant greenhouse effect. A real greenhouse stays warm because the glass limits cooling by convection. It is a convective greenhouse effect and not a radiant greenhouse effect that keeps a real greenhouse warm. So too on Earth. Instead of the glass of a real greenhouse, gravity and the heat capacity of the Earth’s atmosphere provide a radiant greenhouse effect . As derived from first principals, the Earth’s convective greenhouse effect keeps the surface of the Earth on average 33 degrees C warmer than it would be. 33 degrees C is the amount derived from first principals and 33 degrees C is what has been observed. No added warming has been observed from a radiant greenhouse effect. A radiant greenhouse effect has not been detected on Earth or anywhere else in the solar system for that matter. If CO2 really did cause global warming then one would expect that the increase in CO2 over the past 30 years would have caused at least a measurable increase in the dry lapse rate in the troposphere but that has not happened. Hence there is no real evidence that CO2 has any effect on climate. The IPCC will never acknowledge such a possibility for fear of loosing their funding.
The alarmists will soon run out of lies.
How do I know?
They are already out of half-truths.
🙂
Re: “The saddest part of all is a horrible irony. All this waste of time and money to create a lie and inflict completely unnecessary policies at great cost, pain, and damage, is only possible because of successful and wealthy economies based on burning fossil fuels.”
Profoundly well stated, Dr. Ball! This is what tears at me the most. The greatest waste of personal and planetary resources ever, driven by a political and scientific fraud deemed essential to create the new socialist world order.
i bet they said that about Stonehenge and the Pyramids too..
Leo,
I’m guessing that only very cynical people would have said that about Stonehenge and the Pyramids. When these mysterious structures were built, civilization and culture flourished thereafter.
By contrast it is foreseeable that if the mentally-toxic climate doomsday cult is not stopped in time, our civilization and culture will perish.
“Why aren’t they reporting with equal vigor that in just two years from February 2016 to February 2018 the global average temperatures fell by 0.56°C? If the IPCC claim about the dominant role of CO2 post-1950 is correct, then that warming simply cannot happen.” Should that not be ‘then that cooling simply cannot happen.’ or can I not understand the meaning?
I think the same thing . . . that the author meant it per your correction, but inadvertently wrote it the wrong way.
Fortunately, we have context to guide us.
Maybe ctm can consult with Dr. Ball on this, and then make the needed correction to the above article.
Agreed, that was my immeidate reaction that it must refer to cooling.
I found numerous typos and grammatical errors and what appear to be rewrites that were not edited properly afterwards.
For example, in this paragraph:
“This is another form of introduction to a deception that starts with a false premise. Even a brief look at any historical climate record shows equivocal and even greater periods of warming than those between 1950 and 2018. Just look at the Antarctic ice core record from Petit et al”
I am pretty sure that the word “equivocal” should instead be “equal”. It does not make grammatical sense as written.
There are lots of others, and punctuation errors too, such as the comma in the second to last sentence.
I think Dr Ball is in a hurry when he writes.
Not taking anything away from his message…I make tons of typos myself.
Ball is completely correct, but the problem is psychological, pervasive, and massive. Those of us who reject the ideology of “sustainability” for which “climate change” is a cover are confronting a mind set that is now nearly universal among educated people in the west. This includes the leaders of all the governments of Western Europe, Canada, and Australia. It includes all the “Academies” that are supposed to guard the standards of science, including the AAAS, and even the American Statistical Association which remains shockingly silent in the face of continuing violations of elementary statistical norms. The underlying problem is fear of the acceleration of human progress which has been accelerating over the last 100 years or more. The fear is that there are too many humans and has a clear lineage from Malthus to P. Ehrlich to the Club of Rome to Al Gore. Every prediction has been totally wrong. Every time they up the rhetoric
The same fear is also expressed by Trump and his followers who fear the massive hoards coming across the southern border, so there is an odd way in which environmentalism and hostility to immigration come together. From my perspective they are both profoundly reactionary ideologies, and they both derive from an anti-human impulse. My fear is that the walk-back from this craziness will never happen in my lifetime. The only interest group which has the resources to fight back are the oil companies, and they would rather play nice and pretend they agree. Such hypocrisy.
We may have a tipping point here. People start to think when they hear that others are skeptic too.
Fearmongering is a signature of fake news and fake science.
Thank you, Dr. Tim Ball, for yet another detailed refutation of the nonsense emanating from the IPCC. One can only hope that continued falls in temperature will finally put an unwilling end to this Red/Green propaganda. Looking at the CET record would be enough for rational folk but this is only a small percentage of the population.
Good ole 1979.
So was the warming we had 12 000 years ago a good warming or a bad one? And would life really be better in Canada with a 2 mile thick ice layer on top of it ?
Tim Ball:
“The problem is if that is true then the record cold temperatures occurring now cannot occur. If the IPCC claim is correct the only way such record cold can occur is if the CO2 level decreased. However, it is the IPCC who tell us it continues to increase.”
But there can be continued cold records.
The world is a big place with plenty of opportunity for weather to play it’s part.
What is expected to happen, and is, is that there will be increasingly be more warm records than cold.
AGW is not a switch!
“The fallacy of the IPCC claims is in the continual changes of temperature that occur every day. The Sun rises, and the temperature begins to increase as the solar angle increases. There is no increase in CO2, just as there is no decrease when temperatures begin to decline as the Sun sets. ”
Nothing like the same thing.
That is the perpetual diurnal/seasonal variation that nature is “aware” of.
It is not aware of AGW warming.
As it continues it’s decadal/century trend.
It therefor has to adapt.
“Why aren’t they reporting with equal vigor that in just two years from February 2016 to February 2018 the global average temperatures fell by 0.56°C? If the IPCC claim about the dominant role of CO2 post-1950 is correct, then that warming simply cannot happen.”
You’re correct, it can’t – and didn’t as that is a tropospheric temp global average and not the surface, where the greatest GHE warming is occurring nocturnally over land.
It can vary due to natural variation though (of course).
I’m sorry Tim, but you are an expert in climate?
And it’s 0.66 actually (from Spencer’s site).
You do know that Trop sat temp radiometers are sensitive to atmos moisture, hence the spikes on them in the peak of an EN ?
And that temps fall back after?
Climate scientists know this.
They also know that it is the long-term temp trend that depicts the climate and not a 2 year one.
UAH V6 is currently warming at 0.127C/dec.
This is leaving aside that UAH V6 is also the coolest trop sat temp series of them all and has had multiple changes in it’s algorithm inflicted on it from the same data that RSS use to come up with 0.2 C/dec.
Because it sounds like you are unaware of natural variation, which still very much affects GMST over the short-term. The ENSO/PDO cycle being the main one. Indeed the prolonged -ve PDO/ENSO cycle of ’99 to ’15 was the reason for the “hiatus”.
“There is nothing extraordinary in the 359-year record when compared to the 68 years from 1950.”
Excuse me but what about after?
A tad important as the GHE only really escaped the -ve forcing of aerosols from ~1970 ….
https://encrypted-tbn0.gstatic.com/images?q=tbn:ANd9GcSYE1ZiW4tkN4WboZleOPmgw8LS7FCsWeCxFUQRe301c971GM3nCQ
“and ignore the 90,000 19th century CO2 readings that show much higher levels.”
https://www.tandfonline.com/doi/pdf/10.3402/tellusb.v38i2.15083
“We have reassessed measurements of the concentration of atmospheric carbon dioxide made
during the 19th century by examining original data published between 1880 and 1905 and an
interpretation of these data carried out during the 1930’s by C. S. Callendar, a British
engineer. We have perused an unpublished notebook of Callendar which contains a detailed
analysis of air masses and wind velocities attending some of these 19th century analyses. We
find new evidence to support Callendar’s contention that the concentration of C02 in the late
nineteenth century was close to 290 ppm. Of particular interest are the observations of J. A.
Reiset made on the coast of France from 1871 to 1880 which we show to be consistent with the
seasonal cycle of COz as known from modern measurements. From Reiset’s data, we deduce
that the mean annual concentration of atmospheric COz circa 1880 in uncontaminated air at
SOON latitude was 292 ppm. “
Banton,
You said, “AGW is not a switch!” I guess you didn’t bother to tell Gore that. Why else would he use the “Tipping Point” phrase?
“Why else would he use the “Tipping Point” phrase?”
Spencer:
Because climate “tipping points” are points at which the level of atmospheric GHGs coupled with the time within which a particular RCP would take to slow down the rising trend of CO2 to that which is deemed a safe level has been passed.
So not a “switch” where it has been turned on.
Atmospheric CO2 is only increasing at around 1-2 ppm/year.
We do not know at what exact level it becomes irreversible to avoid certain events that will cause mankind physical and economic hardship that is intolerable.
Depends on your definition of intolerable also.
Science is doing it’s best to inform where that level may be given our current emmisions and likely future paths, that is all.
AB
You said, “We do not know at what exact level it becomes irreversible to avoid certain events that will cause mankind physical and economic hardship that is intolerable.” The latest US government report says that we have 12 years.
Mr. Banton
The CO2 measurements in the 1800s
were not made in suitable locations.
Attempts could be made to replicate
those experiments to double check
the use of ice core data
for pre-1958 CO2 levels,
but no one seems to care.
Humans have added CO2 to the air.
That fact is not in doubt.
In my opinion doing that was good news,
based on my 21 years of reading
about climate science.
If CO2 caused any of the warming since 1950,
which was mainly in the northern half
of the Northern Hemisphere, at night,
and in the colder months, that is good news too.
I have found no logical reason to oppose adding
more CO2 to the air, EXCEPT when done without
modern pollution controls, as too often happens
in China and India — the real pollutants from burning
fossil fuels are dangerous — the CO2 is beneficial.
Anthony and Kym, Not too many skeptics have denied the existence of DWIR. Here is the real effect of CO2
http://applet-magic.com/cloudblanket.htm
Clouds overwhelm the Downward Infrared Radiation (DWIR) produced by CO2. At night with and without clouds, the temperature difference can be as much as 11C. The amount of warming provided by DWIR from CO2 is negligible but is a real quantity. We give this as the average amount of DWIR due to CO2 and H2O or some other cause of the DWIR. Now we can convert it to a temperature increase and call this Tcdiox.The pyrgeometers assume emission coeff of 1 for CO2. CO2 is NOT a blackbody. Clouds contribute 85% of the DWIR. GHG’s contribute 15%. See the analysis in link. The IR that hits clouds does not get absorbed. Instead it gets reflected. When IR gets absorbed by GHG’s it gets reemitted either on its own or via collisions with N2 and O2. In both cases, the emitted IR is weaker than the absorbed IR. Don’t forget that the IR from reradiated CO2 is emitted in all directions. Therefore a little less than 50% of the absorbed IR by the CO2 gets reemitted downward to the earth surface. Since CO2 is not transitory like clouds or water vapour, it remains well mixed at all times. Therefore since the earth is always giving off IR (probably a maximum at 5 pm everyday), the so called greenhouse effect (not really but the term is always used) is always present and there will always be some backward downward IR from the atmosphere.
When there isn’t clouds, there is still DWIR which causes a slight warming. We have an indication of what this is because of the measured temperature increase of 0.65 from 1950 to 2018. This slight warming is for reasons other than clouds, therefore it is happening all the time. Therefore in a particular night that has the maximum effect , you have 11 C + Tcdiox. We can put a number to Tcdiox. It may change over the years as CO2 increases in the atmosphere. At the present time with 409 ppm CO2, the global temperature is now 0.65 C higher than it was in 1950, the year when mankind started to put significant amounts of CO2 into the air. So at a maximum Tcdiox = 0.65C. We don’t know the exact cause of Tcdiox whether it is all H2O caused or both H2O and CO2 or the sun or something else but we do know the rate of warming. This analysis will assume that CO2 and H2O are the only possible causes. That assumption will pacify the alarmists because they say there is no other cause worth mentioning. They like to forget about water vapour but in any average local temperature calculation you can’t forget about water vapour unless it is a desert.
A proper calculation of the mean physical temperature of a spherical body requires an explicit integration of the Stefan-Boltzmann equation over the entire planet surface. This means first taking the 4th root of the absorbed solar flux at every point on the planet and then doing the same thing for the outgoing flux at Top of atmosphere from each of these points that you measured from the solar side and subtract each point flux and then turn each point result into a temperature field and then average the resulting temperature field across the entire globe. This gets around the Holder inequality problem when calculating temperatures from fluxes on a global spherical body. However in this analysis we are simply taking averages applied to one local situation because we are not after the exact effect of CO2 but only its maximum effect.
In any case Tcdiox represents the real temperature increase over last 68 years. You have to add Tcdiox to the overall temp difference of 11 to get the maximum temperature difference of clouds, H2O and CO2 . So the maximum effect of any temperature changes caused by clouds, water vapour, or CO2 on a cloudy night is 11.65C. We will ignore methane and any other GHG except water vapour.
So from the above URL link clouds represent 85% of the total temperature effect , so clouds have a maximum temperature effect of .85 * 11.65 C = 9.90 C. That leaves 1.75 C for the water vapour and CO2. CO2 will have relatively more of an effect in deserts than it will in wet areas but still can never go beyond this 1.75 C . Since the desert areas are 33% of 30% (land vs oceans) = 10% of earth’s surface , then the CO2 has a maximum effect of 10% of 1.75 + 90% of Twet. We define Twet as the CO2 temperature effect of over all the world’s oceans and the non desert areas of land. There is an argument for less IR being radiated from the world’s oceans than from land but we will ignore that for the purpose of maximizing the effect of CO2 to keep the alarmists happy for now. So CO2 has a maximum effect of 0.175 C + (.9 * Twet).
So all we have to do is calculate Twet.
Reflected IR from clouds is not weaker. Water vapour is in the air and in clouds. Even without clouds, water vapour is in the air. No one knows the ratio of the amount of water vapour that has now condensed to water/ice in the clouds compared to the total amount of water vapour/H2O in the atmosphere but the ratio can’t be very large. Even though clouds cover on average 60 % of the lower layers of the troposhere, since the troposphere is approximately 8.14 x 10^18 m^3 in volume, the total cloud volume in relation must be small. Certainly not more than 5%. H2O is a GHG. Water vapour outnumbers CO2 by a factor of 50 to 1 assuming 2% water vapour. So of the original 15% contribution by GHG’s of the DWIR, we have .15 x .02 =0.003 or 0.3% to account for CO2. Now we have to apply an adjustment factor to account for the fact that some water vapour at any one time is condensed into the clouds. So add 5% onto the 0.003 and we get 0.00315 or 0.315 % CO2 therefore contributes 0.315 % of the DWIR in non deserts. We will neglect the fact that the IR emitted downward from the CO2 is a little weaker than the IR that is reflected by the clouds. Since, as in the above, a cloudy night can make the temperature 11C warmer than a clear sky night, CO2 or Twet contributes a maximum of 0.00315 * 1.75 C = 0.0055 C.
Therfore Since Twet = 0.0055 C we have in the above equation CO2 max effect = 0.175 C + (.9 * 0.0055 C ) = ~ 0.18 C. As I said before; this will increase as the level of CO2 increases, but we have had 68 years of heavy fossil fuel burning and this is the absolute maximum of the effect of CO2 on global temperature.
So how would any average global temperature increase by 7C or even 2C, if the maximum temperature warming effect of CO2 today from DWIR is only 0.18 C? This means that the effect of clouds = 85%, the effect of water vapour = 13.5 % and the effect of CO2 = 1.5%.
Sure, if we quadruple the CO2 in the air which at the present rate of increase would take 278 years, we would increase the effect of CO2 (if it is a linear effect) to 4 X 0.18C = 0.72 C Whoopedy doo!!!!!!!!!!!!!!!!!!!!!!!!!!
Remember CO2 affect by itself is logarithmic, not linear. (If fossil fuel grows exponentially, then log of exponential is linear.)
Alan:
You should have gone to the below for your explanation of physics of the inbalance of incoming Solar SW vs outgoing LWIR as caused by anthro GHGs.
Rather than your sky-dragon slaying death by wordiness you posted above ….
https://scienceofdoom.com/roadmap/atmospheric-radiation-and-the-greenhouse-effect/
Be sure to read all 12 parts (and the addended
Theory and Experiment – Atmospheric Radiation – real values of total flux and spectra compared with the theory.with referrence to he peer-reviewed papers cited.
You say, “At the present time with 409 ppm CO2, the global temperature is now 0.65 C higher than it was in 1950, the year when mankind started to put significant amounts of CO2 into the air. ”
According to NASA GISS, the “global temperature” rose at much the same rate between 1910 and 1940 — previous to, as you say, ” the year when mankind started to put significant amounts of CO2 into the air. ”
So, if 40 years before humans put significant amounts of CO2 into the atmosphere, the global temps rose at much the same rate, what caused that warming?
“Really? Rejecting even the most basic atmospheric physics?”
Funny. There is no basic atmospheric physics.
There is a very complex and poorly understood air/sea/land system
that does include radiatively active gases. Other than the inclusion part,
there is a lot of disagreement.
Confusing 2 different things.
The 0.6°C warming since 1880 (as it was in 2000; it’s now ~1.0°C) is the value produced using linear regression of the surface data 1880-2000. You can do this yourself on Excel. Use the ‘=linest’ function and the monthly surface data anomalies from more or less any of the producers. Multiply the ‘=linest’ value by the number of monthly updates. You’ll get ~ 0.6°C. That’s the total temperature change estimate 1880-2000.
The fall in temperatures between February 2016 to February 2018 hardly makes a dent in the overall warming figure; which, as I say, is now closer to ~ 1.0 than 0.6°C. Again, you can check this for yourself using surface data and Excel ‘linest’ function. This is because linear regression takes account of the whole data set; not just the recent perturbations.
The drop since the last El Nino doesn’t even make a dent in UAH, which only starts in Dec 1978. The fall after the last big El Nino was totally expected and makes practically no difference to the overall UAH trend.
Please check this for yourself, as I often urge people to do. Here’s a starter though: the chart below shows UAH TLT current data with the trends from Dec 1978- Dec 2000 and the trend Dec 1978-present. Do you see any big cooling impact since Feb 2016? Me neither.
http://www.woodfortrees.org/graph/uah6/plot/uah6/to:2001/trend/plot/uah6/trend
Discussion of a temperature ‘drop’ off a planetary El-Nino peak, to its former approximate level, is crackpot land.
It has nothing to do with climate-change.
Modern observational data also have nothing to do with the climate-change trend. Including the entire SAT record and the entire history-adjusted and then UHI-degraded ‘global’ ground station ‘log’, which is useless for elucidating any climate-change trend, and is only serving as confected props for a despicable political-propaganda factory that produces phony fake-nuws click-bait blather about mere weather cycles.
‘Climate-change’ occurs on a timescale humans don’t comprehend hence the desperate nonsense of claiming a 30 year period of SAT records provides climate-change ‘trend’ clarity, or that mere El-Nino-cycle temperature noise signifies something relevant to a climate variation process.
/turboflush
My point is that the so-called “cooling” since the peak of the last big El Nino was entirely to be expected, was widely forecast, and has made not the slightest dent in the long term temperature trend. That stands true whether you use the long term surface data sets or the more recent satellite TLT sets.
The claim that ‘temperatures in Feb 2018 were lower than they were in Feb 2016, therefore the IPCC’s projections have failed’ is risible nonsense.
DWR54,
El Niño is a natural climate phenomenon.
So you are telling us that the spike in 2015/2016 and the plummet from 2016 to 2018 are occasioned by natural non-human induced causes?
Two years of global cooling from 2016 to 2018 are insignificant but 23 years warming from 1976 to 1998,( less than a Climate Normal) are probative of a global warming theory?
“Two years of global cooling from 2016 to 2018 are insignificant but 23 years warming from 1976 to 1998,( less than a Climate Normal) are probative of a global warming theory?”
Yes. Two years of anything are almost certainly insignificant. 23 years of warming much more likely to be significant.
For example according to UAH the trend between 2015 and 2017 was a rise of almost 16°C / century. Nobody should suggest that that was indicative of how temperatures temperatures will behave over the next century. Since the spike in 2016 temperatures have “plummeted” at the rate of around 14°C / century. In neither case was the rate of change statistically different from noise.
In contrast the trend over the 40 years of UAH history is a rise of around 1.3°C / century. Less than all other data sets but still statistically significant. There’s no doubt that global warming has been happening over that period, whatever its cause.
DWR54,
You attempt to invalidate what Tim Ball is saying about the issue of the world temperature plummet from 2016 to 2018 by referring us to the UAH data from December 1978 to the present.
Would you now do the interactive graph at woodfortrees.org for 2000 to 2018 for the UAH6.0 lower trop. global mean.
Note the spike peaking at an anomaly of +0.85 C and now around +0.4 C.
Would you not agree that the trendline for this century is flatlining?
Secondly,the SR15 Summary for Policymakers at A1.1 says that global warming overall is increasing at about 1 degree C since pre-Industrial (1750) times ( likely range 0,8C to 1.2C).
At A1.2 it states that warming is ‘ generally higher’ over land than over the ocean.’
What does the IPCC say is the decadal increase in Ocean temperature since 2003 as recorded by the Argo buoys?
Willis Eschenbach as well as a number of sceptical climate scientists say that the decadal movement in OHC is negative, or mildly positive.
Bear in mind that we are assured by mainstream scientists that most warming since 1960( about 85% ) has happened in the oceans.( Source: Australian Chief Scientist Penny Sackett and Professor Will Stefan in response to Professor Bob Carter and 3 others’ Questions to Climate Minister Penny Wong, 15 June 2009.)
Richard Molineaux,
The decadal rate of warming you get from the UAH 2000 to 2018 bar line is hardly frightening.
Yes, I have tried 30 years ( a Climate Normal) and the warming is still insignificant and certainly not ‘unprecedented’, as we are repeatedly misinformed.
Try 8,500 years back to the Holocene Optimum.
Are world Temperatures warming or cooling?
Depends on your start and end points, and Tim Ball’s points are correct.
And you have not addressed the Argo buoys question.
“Frightening” and Insignificant” are not scientific terms. They are terms used in policy making.
We know what time period we should look at for policy making. It is the time that we take to renew our infrastructure.
Infrastructure needs renewing periodically so almost all of the cost of adaptation is already built in if the climate change is within natural variability over the time that we take to renew our infrastructure.
That time period is 50 years. But we should use 30 years as we don’t want to run up to the limits (remember Katrina).
We know what temperature rise is considered newsworthy. It’s 2°. However, some people think that 1.5° is a safer limit. Me, I think 3° would be a net benefit as we could make use of Siberia and Canada.
So the key question is: Will the world warm 1.5° in 30 years?
If the answer is No then the AGW issue requires no action. The Precautionary Principle does not apply.
No mitigation actions or costs are needed.
Adaptation will suffice.
And any resources used on mitigation (e.g. renewables) is food taken from the mouths of the world’s poor.
That is how to distinguish the significance of the science. What does it mean for practical purposes.
“Steyn isn’t a scientist, and his opinion has no bearing on science.”
That statement merely proves you know nothing about science, and are just an NPC following its programming. Which, frankly, is no shock.
The High Priesthood of Science don’t get to tell us what reality is. The data does.
By what metric can one claim knowledge exceeding that of another by several orders of magnitude and by what evidence is there that this claim is true?
Your bias is again confirmed by attacking Steyn’s lack of scientific
education.
1. Nobody claimed he did.
2. He researched the many and known fallacies of Mann’s hockey stick. He researched the scientific criticisms by PHD scientists. He researched Mann’s own colleagues and co-authors, a number of whom denounced the hockey stick and many facets of paleo-climate research. One said defending the work was “defending the indefensible.” A co-author said they could take all the studies, combine them with the most published researchers, and ” we would still know fuxx all about 20 th century variability.”
Yet you instead attack Steyn’s lack of a science background; a pathetic excuse to ignore the easy to understand criticisms of many PHD scientists.
In a like manner you have failed to address many specific criticisms, instead attacking blog posts use of “unscientific” terms.
The entire field of CAGW is full of unscientific terms. The term CAGW is a far more accurate term for the theory. Yet the pseudo scientific political pundits of doom call the theory “Climate Change”; a purely political label.
With El Nino the temperature peaked and with weakening of El Nino it comes down to its original leve; but if La Nina follows El Nino, the fall peaks down with weakening of La Nina again it goes up. Indian rainfall show pattern with El Nino and La Nina. For example [southwest monsoon rainfall]
D BN N AN E Total
El Nino 07 05 05 00 01 18
Normal 14 13 37 14 06 84
La Nina 00 00 07 07 10 24
Total 21 18 49 21 17 126
D = deficit, BN = below normal, N = normal, AN above normal, E = excess [1880-2006]
With the normal condition in temperature, rainfall occurs around normal; in La Nina years normal to above normal and in El Nino years normal to deficit.
Dr. S. Jeevananda Reddy
Richard m
“No study has proven it false”
McIntyre and McKitrick 2003 proved it false.
Following publication of this proof, Mann started to say “The debate is over”.
Oh look Obfuscation by omission.
Remind us again of the amount of the warming that comes from NOAA Adjustments to the Data as declared by NOAA.
At the time of the Menne-etal study in 2009 the change in Temperature trend from 1895 to 2007 was 0.063-0.018 = 0.045C per decade for the Max and 0.090-0.054 = 0.036C.
So from 1880 to 2020 we have 14 decades at 0.045C/decade = 0.63C of warming.
So how much does that leave far ACTUAL warming one asks?
ftp://ftp.ncdc.noaa.gov/pub/data/ushcn/papers/menne-etal2009.pdf
It means for 140 years it is 0.63 oC and thus for 150 years [IPCC consider 1951 as the starting year of GW; 1951 to 2100] will be 0.675 oC. This is not global warming due to anthroppogenic greenhouse gases increase in the atmosphere. If 50% of it is GW, then it is 0.3375 oC. If we correct this for adjustments made by NOAA, GW practically zero. The other 50% is contributed by local factors associated with ecological changes, general circulation patterns, orography, etc. They are all location specific. They differ: coastal to inland stations.
Dr. S. Jeevananda Reddy
When I meet a member of the brainwashed public, all innocent, I ask wonderingly “what causes climate change?” “Oh, global warming I suppose “. “Did you know there hasn’t been any?”.
Perhaps President Trump, using the threat of the USA ceasing to support the UN, could insist on the charter of the IPCC being changed to simply being research into both climate and weather as to what may occur in the near future, such as say the next 10 years.
A “Balanced research project might be of some value, mitigation of floods etc. Adaptation to whatever nature throws at us. ” I am sure that it was meant t to be that but then the likes of Maurace Strong saw the possibilities politically and the rest is as they say, is “History”.
At present its quite clearly simply a means of removing money from the Western nations and giving to the so called undeveloped countries.
But the crazy part of all this is that on the one hand they say we in the West should De-carbonise, yet if that were to happen then we would no longer have any spare money to give to the undeveloped countries.
But then nothing the IPCC and its Green “Useful idiots” say makes any sense.
As one reader mentioned let have a proper analysis of the properties of CO2. Question Does it store heat, or simply re-radiates it. Because if it re-radiates it, then at night with no input from the Sun, it should absorb any heat in the atmosphere and again re-radiate it out to Space.
And that appears to happen, certainly in a dry place, low humidity y such as desert or near desert such as South Australia, it can be 40 C during the day, yet drop to 15 C overnight. So just how does that happen ?
MJRT
Here’s a scary thought:
If cooling continues, what’s to stop the hoaxers claiming that atmospheric CO2 levels are falling, and causing it?
Adjusting the data to suit………..
I’m surprised they haven’t done that already to cover up for the failure of wind turbines to reduce emissions. If they could point to (fake) reduced levels that would be a more convincing way to sell the things than saying, ‘This isn’t working, but that’s because you don’t have enough of them yet.’
…what’s to stop the hoaxers claiming that atmospheric CO2 levels are falling, and causing it?
That’s the beauty of switching from ‘global warming’ to ‘climate change’… whichever way te thermometer goes they’ve got it covered…”see we told you so!”
Added to which when the Catastrophic predictions turn out to be gross exagerations they will be able to say “see! all those windmills and solar arrays saved the day keeping the global temperature change under 1.5*C … which it undoubtedly will be 20, 30 years hence or in 2100.
Cheers
Mike
Mauna Loa is still showing increases of CO2. That wouldnt matter anyway if they fudged those figures because they cant fudge the emission figures coming out of China, India and Japan.
Dee: “Here’s a scary thought:
If cooling continues, what’s to stop the hoaxers claiming that atmospheric CO2 levels are falling, and causing it?”
Well, the Climate Charlatans already have that covered. They say there is a possiblity that the temperatures may decline for a decade or so, although they don’t blame dropping CO2 levels for the cooling, but rather natural forces, but they assure us this will only be temporary and then CAGW will resume after this time. So Hansen and Gavin Schmidt are all ready trying to cover their behinds by trying to get out in front of any cooling that might be coming our way. You can’t win with these guys. Everything is CAGW to them, or if they aren’t True Believers then they are the most devious, underhanded people in the world.
https://wattsupwiththat.com/2018/01/24/nasa-james-hansen-gavin-schmidt-paper-10-more-years-of-global-warming-pause-maybe/
: “Therefore, because of the combination of the strong 2016 El Niño and the phase of the solar cycle, it is plausible, if not likely, that the next 10 years of global temperature change will leave an impression of a ‘global warming hiatus’.”
end excerpt
So they have put off their day of reckonig for another decade, even if it cools. In their minds anyway.
The data says CO2 has little if any effect on climate. Temperature is now about what it was in 2002. CO2 has increased since 2002 by 40% of the increase 1800 to 2002. By similarity, none of the other ghg (except water vapor) have any significant effect on climate either.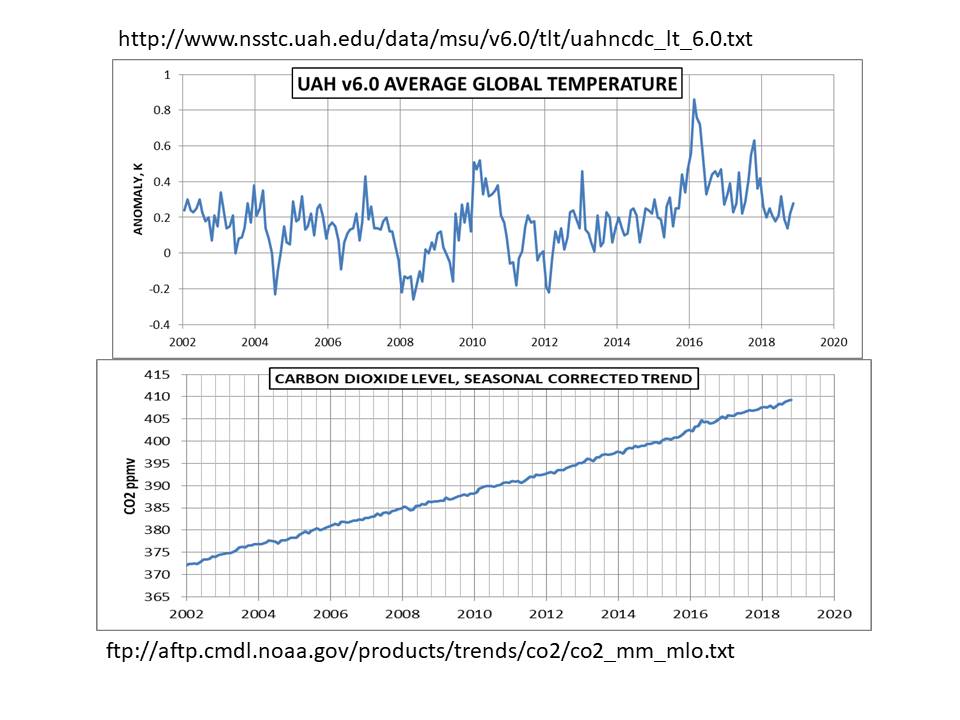
If CO2 had an effect then the specific heat of the air must have changed. I have seen no new value for it.
Anthony’s CO2 jar experiment proves it.
If CO2 actually affected climate then one would expect that the increase in CO2 over the past 30 years would have caused at least a measurable increase in the dry lapse rate in the troposphere but such has not happened.
“As usual, the mainstream media reports that 2018 is the sixth warmest year on record even before the year is over. This is not surprising or significant because the highest temperatures must occur at the end of a warming period.”
No media are quoted. And if any truly have essayed an early estimate, they would have said it would be the fourth warmest surface temperature on record, behind only 2015 (just), 2016 and 2017. And that surprisingly and significantly shows the falsity of the headline here:
“Recently Dropping Global Temperatures Demonstrate IPCC Claims are Impossible”
You know Nick when you have the time you might tell us all what the average temperature of the globe is supposed to be while you and the experts are dialing in that world CO2 thermostat of yours because living in Adelaide South Australia (Glenelg actually) I’m a wee bit confused by the daily forecasts for the greater metro area. A SEVEN degree Centigrade variation in forecast for today with the thermometers in the greater metro area between Mt Barker and Elizabeth is not a good look for your thermostat twiddling of the knob-
Adelaide 29
Elizabeth 31
Glenelg 28
Noarlunga 26
Mt Barker 24
Am I OK living in Glenelg or should I be moving somewhere else in the metro area where the CO2 thermostat is working properly?
http://www.bom.gov.au/sa/forecasts/adelaide.shtml
I’m in Adelaide too (Prospect), and I’m unsurprised by a 7 degree difference for the forecast high between Mt Barker and Elizabeth.
That said, Nick’s assertion about “fourth warmest on record” doesn’t falsify the headline at all, in fact it vindicates it; that is unless Nick is redefining fourth to be higher than first.
“doesn’t falsify the headline at all”
The headline doesn’t just say temperatures are dropping, which is hardly consistent with being the fourth warmest in the record. It says that proves that something about “IPCC claims” is impossible (which?). And there is no “IPCC claim” that says you can’t have a local peak year in an El Nino year. There has always been weather, and CO2 doesn’t change that – just makes it warmer weather.
But I don’t know what the complaint about Adelaide temperatures is. Is it querying forecast accuracy (so let’s see)? Or is it saying that CO2 will smooth out all local variation (no one said that)?
“There has always been weather, and CO2 doesn’t change that – just makes it warmer weather.”
Just as there’s been warmer weather due to the long interglaciation we’ve been enjoying with the concomitant rise of mankind. Answer the question. What should the average temperature of the globe be once you and the experts have deduced the dooming of the anthropogenic trace gas effect and will you have to then counter the warming due to the ongoing interglaciation because it’s higher than what your average temperature calculation says it should be?
Xth warmest on record is meaningless for a whole continent given the pitiful time span we have records for and even then the bozos at the BOM shifted one of the longest serving Stevenson Screens in the SH from the west parklands to their new offices east of the city at Kent Town in 1979 so it was more convenient to read-
http://joannenova.com.au/2014/01/forgotten-historic-hot-temperatures-recorded-with-detail-and-care-in-adelaide/
It’s like this chaps the CBD was largely being airconditioned at the time and the prevailing winds are from the west over the Gulf. Not that the west parklands site would be measuring the same temps today as it would 50 or 100 years ago with metro development and concomitant UHI but little did they know temps would be recorded automatically anyway after the shift. Now the BOM are busy reading another SS built at the old site to get a couple of years data so they can magically reconcile the two. As if…
Those temperatures, fourth warmest etc., share them please?
2015 was what °C, and so on?
http://woodfortrees.org/graph/hadcrut3vgl/from:1998/to:2019
So why do you plot an index that expired in 2014?
GISS numbers are here. HADCRUT here
No, you still haven’t supplied the figure for what the global average temperature was for the years you’re talking about.
Fourth warmest, third warmest, like, so what? It’s as nonsensical as describing the fourth reddest or whitest colour in a painting.
If you want to get people on side, dont direct them to a page full of digits when all you’ve been asked is what the global average temperature was.
So why the plot of the HadCRUT series that ended years ago? Did you not know that it had been updated?
It’s just that the site you used to make the plot also contains the up to date data series; the one endorsed by HadCRUT.
“Did you not know that it had been updated?”
Yes, we are all VERY aware it got “updated ™© ” 😉
So why not use their latest data?
If you’re suggesting that HadCRUT should be regarded as unreliable, then why use their previous data?
The comparison between Hadcrut3 (unadjusted) and Hadcrut4 (adjusted because unadjusted is not available) is interesting. Hadcrut 4 is a complete joke. But that was discussed here at WUWT years ago.
UAH is much more credible
Dee: “Those temperatures, fourth warmest etc., share them please?
2015 was what °C, and so on?”
Here you go, Dee (according to the UAH satellite data).
so the claim is now that they are not making claims about ‘warmest years ‘ , amazing !
it is opposite day?
Yessir, it’s all about the anomaLIES.
😉
Stokes,
You are correct that 2018 is on pace to be the 4th warmest. However, it really is a strawman argument because the essence of Ball’s complaint is “…the highest temperatures must occur at the end of a warming period.” and some minor record is not really surprising.
https://weather.com/news/climate/news/2018-10-17-earth-on-pace-fourth-warmest-year-on-record-noaa-nasa
An inquiring mind might ask why anyone felt a need to forecast any kind of a record three months before the year was over, other than for the political impact before the COP-24 meeting in early-December.
“the essence of Ball’s complaint is “…the highest temperatures must occur at the end of a warming period.””
Put the other way around, a highest temperature is very likely to be at the end of a warming period – that is just arithmetic. The argument that it is warming because of end of LIA or whatever is vacuous. What is the LIA? A period that was observed to be cooler than present. That is why we call it that. It is an observation, not a cause. The argument just says that it warmed because it was cooler before.
Yup, saying that warming is the result of ‘warming’ (from the LIA, or from whatever else) is arm-waving; an attempt to explain the observed warming away without describing any physical mechanisms.
DWR54
While it may be impossible to ascribe a physical mechanism to the LIA, we can be reasonably confident that humans weren’t responsible. If ‘agent X’ were to disappear, would it not be reasonable to expect the system to regress about the mean temperature that existed before ‘agent X’ reduced the temperature? That is, the temperatures are rebounding to what they were before being suppressed.
By what mechanism? That’s the question these ‘rebound from the LIA’ comments never address. We know it’s not orbital forcing; we know solar output has diminished slightly over the period of the most recent warming; we know that the oceans have been warming over the same period as the surface and atmosphere, so it’s not coming from the ocean…. so what exactly is causing this so-called ‘recovery from the LIA’?
DWR
If you get hit up the side of the head with a 2×4 plank, and never saw it coming, it doesn’t really matter whether you know what caused you to become unconscious. The reality is that it happened. We were long aware of the effects of ionizing radiation before we really understood what was happening. It is false to claim that something that we don’t know exists cannot have an impact. It only means that we don’t have a name for the mechanism and that we understand it so poorly that we can’t make reliable predictions. There is an old saying that “What you don’t know won’t hurt you.” It is demonstrably false. Things that you don’t know about can have important consequences. One should focus on learning about the unknowns, rather than trying to assign the results falsely to things we do know about.
And the Holocene Optimum, RWP and MWP were warmer than now, and ever warmer than the LIA
Current period could be called the “modern a-little-bit warm period.”
This “4th warmest” meme, in a piddlingly small period of dubious data manipulation, out of the coldest period in 10,000 years, is just basically NONSENSE.
Especially when much data still exists showing that the 1940s was a similar temperature, or a bit warmer, than current
Looks like 2018 will probably end up being the 6th or 7th warmest in the satellite data era.
So What !!!
Be very glad of that SLIGHT warming since the LIA.
fred250 December 29, 2018 at 4:29 pm
And the Holocene Optimum, RWP and MWP were warmer than now, and ever warmer than the LIA
——————-
I assume you have verifiable data for the RWP MWP and Holocene. I’m not sure the thermometers of the period were up to much!
ghalfrunt December 29, 2018 at 4:29 pm
With respect to the Holocene Climate Optimum: tree line in the Alpes was ~300 meter higher than now and for instance the pond turtle ( Emys orbicularis ) was found in South Scandinavia (present boundary: North of France), implying a summer temperature 2 degrees C higher than now.
Mr. Stokes said “The argument that it is warming because of end of LIA or whatever is vacuous.”
The LIA was anomalously cold, so saying that it is warming because temperatures are reverting to a more normal temperature is not a vacuous statement, but instead it is a statement that the warming is within the bounds of the natural variations in temperatures.
No, he’s asking what the mechanisms were/are.
Just saying that ‘it’s warmer now than it was earlier’ is not an explanation. That’s true whether we’re talking about the change of temperature from the LIA to the present or whether we’re talking about the temperature change we experience when we walk into one room from another.
What *caused* the change? Why is one state warmer than the other? There has to be a physical mechanism. ‘Recovery from the LIA’ does not describe a physical mechanism. It’s arm-waving.
DWR54 said: “…an attempt to explain the observed warming away without describing any physical mechanisms.”
The ‘physical mechanism’ is natural variation and since the current warming is well with natural variations in temperature, no other mechanism is required (see Occam’s razor)
the LIA is just a made up constraint…overall temps could be rising…or falling..right now
…no one knows
Mr. molineux said: “I hate to inform you but ‘natural variation’ is not a physical mechanism”
OK, I was a bit imprecise: Natural variation is the result of the climate system being “a coupled non-linear chaotic system” (See IPCC AR3). Since the current warming is well within the bounds of the natural variations in temperatures that have previously been produced by this chaotic system, the simplest explanation is that the current warming is being produced by this chaotic system and no other ‘physical mechanism’ is required.
The physical mechanism?
i don’t believe I am hearing that from a man who Believes in AGW!
How many do you want me to list?
The only physical mechanism that cannot account for the end of the LIA is CO2.
As for the rest – solar output, simple feedback delays in a chaotic non linear climate system, water vapour, cloud cover, cosmic rays, geological activity, a butterfly flapping its wings in a Brazilian rainforest…
i cannot really decide if I am envious of your simple minded innocence, or scared by it.
Mr. molineux said: “RicDre, radiative physics offers an even simpler explanation (GHG).”
I disagree, since the warming can be explained without the GHG theory, GHG theory is just an unneeded complication. And since the GHG theory can not explain why it was warmer when there were less GHGs in the atmosphere, it isn’t even a particularly good theory.
“No Ricdre, when you invoke natural variation’ all you are saying is that ‘we don’t know why.'”
Actually we do know why, the system is chaotic and chaotic systems can produce large swings in its values without requiring any additional mechanism (I suggest you read up on Chaos Theory).
“GHG fits the data much much better”
GHG theory can not explain the swings in temperature that have occurred in the past such as the Holocene Optimum, RWP, MWP or the LIA, but a chaotic system can produce these kinds of swings without requiring GHG theory.
“…scientists are saying…”
Sorry, argumentum ad verecundiam doesn’t impress me.
““when there were less GHGs in the atmosphere,” …. Pray tell us when was that?”
For example, in the 1930s there were less GHGs in the atmosphere and yet it was a very warm period.
DWR54 said:
“What *caused* the change? Why is one state warmer than the other? There has to be a physical mechanism. ‘Recovery from the LIA’ does not describe a physical mechanism. It’s arm-waving.”
Yeah, but they are waving their arms rather furiously. That must count for something! 😀
Mr. molineux said: “This is not chaotic:”
It looks pretty chaotic to me, it’s certainly not a nice, neat straight line. In any case, run that graph again, but this time include the last 10 thousand years and you will see real Chaos.
Mr. molineux said:
“However GHG explains the current rise in temperature very well, as there is no other recognizable forcing that would cause it”
You assume a forcing is required, but a chaotic system doesn’t require a forcing for its values to change so the GHG explanation is not required.
“I don’t buy your ‘natural variation’ explanation, since the correlation between CO2 and modern warming is undeniable”
Even if this is true, the correlation with CO2 and past warming periods is very poor and in any case correlation doesn’t prove causation.
Nature isn’t required to give us answers we like, and Chaos, for better or worse, puts limits on what we can know.
Mr. molineux:
Thank you for this interesting discussion. You gave me some things to think about and hopefully I did the same for you.
No, that is a rationalization, not an explanation. You are engaging in confirmation bias. You seek a reason that fits your preconception. Once a reason is found, however tenuous, you stop looking, shifting the onus onto other parties to prove you wrong.
The transition to the LIA took WAY less than 26,000 years. Try again.
Doesn’t work, Dickie. It bottomed out, then rose again long before increasing CO2 could have been responsible for the rise. The change was too rapid to be associated with Milankovitch cycles, and you are flailing.
It doesn’t work, Richard. The dip of the LIA is not due to Milankovitch cycles.
If you don’t know what caused the LIA, you don’t know enough to say what should have come after it.
Your rationalization doesn’t work. Your graphic with a larger time span doesn’t help. If you claim the dip is merely a continuation of a larger cycle, then you have to explain the 1000 year plateau prior that interrupted it. There is no end to the excuses and conjectures you have to make to patch it together.
Your complaint about Wikipedia shows you are desperate. Face it: you’re just spinning a yarn that coincides with what you want to believe.
“The first principle is that you must not fool yourself—and you are the easiest person to fool” – R. Feynmann
Also Bartemis, you have to consider the following data:
..
https://upload.wikimedia.org/wikipedia/commons/9/95/Lawdome75yrco2.svg
…
The LIA might be the synergistic combination of axial precession and the drop off in atmospheric CO2 between 1500 AD and 1600 AD
“Seriously Mr. Bartemis, apparently you do not know how the scientific method works.”
More desperation. I am done here.
Hey Nick Here is a question for you to answer .
What caused the Little Ice age and what caused the world to warm from 1680 ?
And while you are thinking about it here is a fact that not many people are aware of .
In 1540 high temperatures and widespread drought occurred in Europe and it was hotter and drier than the 2003 event when 35000 people died of heat stress .
I’m waiting .
I’ll respond when you provide some factual backing for your claims.
Mr. Stokes has now provided us with his self described formula for when claims must be responded to.
When they are “factual”.
Thank Nick!
Nick
The few years prior to and after 1540 are well known to have been exceptionally warm with considerable drought. I do have contemporary references and scientists such as Lamb wrote about them.
Here are some of the references I made in my article ‘The long Slow thaw’
1537 Good summer Baker
Good harvest according to Lamb-chmw- citing Hoskins wheat harvest survey
1538 Excessively hot summer, rivers dried up in summer Baker
1539 Excessively hot summer Baker
1540 Great heat and drought agc
Excessive drought rivers dried up ‘in other places (All over the country?) hottest and healthiest year in the memory of man (Short)
Summer exceedingly hot wof
Fine weather and heat Feb to Sept 19th mid harvest on June 25th grapes ripe in July, rain fell only six times exceedingly early spring cherries ripe by end may . Extreme drought at end of summer Baker
This year was remarkable for the abundance of corn and fruit Lowe
Very cold winter
1541 Dry and hot wof
Hot and dry. A remarkable drought (Nottinghamshire area) Baker
The river Thames so low that even at ebb, extended beyond London bridge
Lowe
1538-1541 These four years apparently experienced drought, with 1540 & 1541 particularly dry – in both these latter years, the Thames was so low that sea water extended above London Bridge, even at ebb tide in 1541. Three successive fine / warm summers from 1538-1540: the weather in 1540 was so fine that picking of cherries commenced before the end of May and grapes were ripe in July.
General warmth over Europe during the spring & summer of 1540. For England, there are several references to a hot summer, with great heat & drought; also many deaths due to the ‘Ague’. (The next warm summer of equal worth is possibly that of 2003!)
(also noted in usw via Holland .. ” 1540 is described in contemporary chronicles as the ‘Big Sun Year’; the lower part of the Rhine from Cologne into the Netherlands is ‘dry’ – it didn’t rain over Italy, with Rome dry for something like 9 months. Forest/city fires, with many people dying of heat stroke, heart failure etc.”)
1541: as indicated above, another drought year with rivers drying up (must have been quite extreme given that the previous year was notably dry). Cattle / other livestock dying for lack of water: dysentery killed thousands. Booty
Good harvest according to Lamb chmw, citing Hoskins wheat harvest survey
—– —-
You might also like to read the book ‘Climate and weather’ by John Kington who recently retired from CRU. I would tentatively say the three/five year period was the warmest in the last 500 years and was accompanied by damaging droughts
tonyb
The 1930’s were just as hot as today. Hotter than today when you consider only the US. Catastrophic Global warming would have to be truly global (except in deserts) since the CO2 is mixed everywhere. The reason why CAGW cant happen in deserts is because according to alarmist theory, the CO2 needs the extra water vapour to feed the runaway positive feedback. Since there is little or no water vapour in a desert, that can’t happen. Since there is always evaporation and evapo transpiration happening all the time, ~86 W/m^2, the question is at what level does it have to reach before runaway CAGW would happen? At the present time the latent heat that gets carried upward with evaporation is released before the atmosphere gets to 4% water vapour. The water vapour condenses to clouds or condenses directly. That latent heat that is released gets carried high into the atmosphere by convection. It doesnt get back to the surface or else we would have had CAGW already. Clouds are the cause of 85% of any DWIR. water vapour causes 13.5% and CO2 causes the remaining 1.5%. See my previous post higher up on this.
CAGW is an impossibility.
“The 1930’s were just as hot as today.”
Another “whack-a-mole” naysayers climate myth.
No the US was hot (though not as much as recently – yes even using unadjusted data).
Sorry to inform our US friends but the US is not the world.
Just 2 % of it by area.
Read Nick Stokes’ blog for why US temps were so useless for climate reanalysis back in the day when they red max thermos (and reset them) while it was still hot in the evening….
https://moyhu.blogspot.com/2014/05/the-necessity-of-tobs.html
Roy Spencer calculated (20 Dec)
Latest Global Temp. Anomaly (November ’18: +0.28°C) 2018 6th Warmest Year Globally of Last 40
How many times have the global warmists, sold all the silver told us the world is ending, run up a hill only to creep back down and say “oh we meant next year!”
Still there, alive and unforgotten, except by the IPCC, is Mother Nature. I am confident that this old lady will put the IPCC in the wrong and out of business.
if that were to happen then we would no longer have any spare money to give to the undeveloped countries.
============
The “spare money’ doesn’t exist. What is being proposed is that people already $ 100k in debt the moment they are born now borrow an extra $ 10k and give this to help people that are less than $ 10k in debt.
The oceans ate all my heat.
Speaking of oceans and heat, why haven’t Nature and the Resplandy and Scripps squad retracted or at least corrected their flawed and simultaneously rigorously peer reviewed paper wrongly claiming that the oceans have absorbed 60% more heat than was originally thought?
Next year maybe?
Thank you, Dr. Ball! Others who write for WUWT re-enforce this fraud in a number of ways. For instance, analyzing alarmist junk science as though they’re wrong rather than devious, which basically equates to critiquing the Emperor’s New Clothes. So I wonder: is it weak intellect, cowardice or complicity?
There is certainly some vindication, here. The Warming Alarmists have been trying to convince everyone that human CO2 is causing more warming. As most of us already know, climate changes in cycles, otherwise the 1970s scare of global cooling would’ve continued unabated. But this is actually bad news.
Global cooling in our current, ongoing Ice Age is not a good thing. And as cycles go, we’re slightly overdue for the next glacial period (ref: W.S. Broecker, 1998).
The upcoming experiment by Harvard and fellow psychopath, Bill Gates, should send chills up our spines. They want to cool the planet “like volcanoes do” (said Brennan, CFR, June 2016). Accelerating the cooling could mean permanent snow cover for Canada and Northern Europe within a lifetime. And all that extra white could accelerate the cooling even more.
You can bet that lawyers are drawing up the lawsuits even as we speak.
So they cool the atmosphere, and the next farmer or even whole industry that gets frozen out by unseasonable frost or hard freeze then sues the whole lot of them completely pantsless, shirtless, and naked.
End of that particular brand of jackassery.
An end? I hope. It would be nice to see Michael “Hockeystick” People lose his pants for the sheer hilarity from all the lawsuits he’s filing, except it’s likely someone with far deeper pockets is funding his legal forays.
Dr. Ball,
Why did you truncate your Central England Temperature chart at 1945. If you add the next 63 years, to 2018, you will see a pronounced increase.
Indeed, he was doubtless hoping that no-one would notice! He doesn’t reply to questions about his posts anyway.

Here’s the up-to-date version:
Phil
Speaking of which, I see that you didn’t respond to my response about your remarks about ozone depletion in the article from 5 days ago. I showed that O3 starts to decline in early-July, not August as you claimed.
Actually I have responded to it, your response was incorrect.
“Why did you truncate your Central England Temperature chart at 1945.”
DHR:
As I pointed out in my post above.
It is indeed a mystery why someone trying to debunk AGW omits the last ~75 years from his demonstration of that alleged point.
Could it be that it does not support it? (sarc).
Again ……
I expect it is just a stock graphic that he had handy. I have seen it in other places.
But, your up-to-date plot doesn’t really say much. In 1890, one could have been equally as convinced that the world was heading into a deep freeze as today one could be convinced of the opposite.
I expect it is just a stock graphic that he had handy. I have seen it in other places.
But it’s rather deceitful to say the following and to follow it with a graph of that quantity which terminates in 1945
“Then consider the Central England Temperature curve from 1659-2018. There is nothing extraordinary in the 359-year record when compared to the 68 years from 1950.”
“Nothing extraordinary” so he’s not going to show you it, you’ll have to take his word for it!
Tim,
What does NASA GISS or the CRU say as to the decadal rate of Ocean warming from the Argo buoys introduction in 2003/04?
I have read the several posts from Willis Eschenbach on the Argo buoys and he notes a trivially small warming of 0.03 degrees C per decade?
As 85%+ of the Earth’s warming comes from the Oceans, it seems rather important for this topic.
Herbert:
Try converting that “trivially small” warming into Joules…..
The SH of water is 4x that of air AND the oceans have 1000x the mass of the atmosphere.
Which means that ….
0.03C if applied to the atmosphere would result in a rise of 120C (in 10 years).
Of course it wouldn’t in the real world as the atmosphere is constantly losing heat to space.
Additionally the ocean accounts for 93% of the climate system’s heat content.
Which has been doing this …..
Anthony,
You are now talking about the Earth’s energy imbalance by some speculation as to what a 120C rise in the atmosphere (!) would convert to in terms of the Oceans, and then point to a Wikimedia graph.
I’ll pass on your graph.
“All of the accumulated warming of the climate system since the 1950s, including the deep oceans, was caused by a global energy imbalance of one part in 600; yet modern science does not know with a precision approaching 1 part in 100, ANY of the natural energy flows in and out of the climate system.
It is simply assumed that the tiny energy imbalance- and thus warming – was caused by humans.”( Source- Dr. Roy Spencer: “ Global Warming Skepticism for Busy People”.)
So increasing CO2 is involved in some of the recent warming but we really don’t know with any level of confidence how much of the recent warming has been caused by humans.
Moreover, even if the fraction of warming that is human caused is 100%, the rate of warming is hardly alarming as Tim Ball points out.
There is a large element of faith involved in claims of human causation.
“AGW has become the new religion of the environmental sciences.”
“in terms of the Oceans, and then point to a Wikimedia graph.
I’ll pass on your graph.”
The US Agovernment is closed.
So the source is currently unavailable.
So I’ll pass on your conspiracy ideation.
You could Google and you’d even find the like here on a WUWT opinion piece.
“So increasing CO2 is involved in some of the recent warming but we really don’t know with any level of confidence how much of the recent warming has been caused by humans.”
I beg to differ Herbert.
And so does the scintific community.
But on the other hand – if you say so.
Anthony,
My ‘ conspiracy ideation’ is a proposition advanced by Dr. Roy Spencer as I indicated in my source.Another ad hom.
If he is correct it should be obvious to you that the chart you reference must be suspect.
It is not a proposition unique to Dr.Spencer.
Dr.Judith Curry has repeatedly addressed the Uncertainty Monster,and given Congressional evidence on same.
I repeat: The estimates of accumulated energy in the climate system are so imprecise that modern science does not know with precision approaching 1 part in 100 ANY of the natural energy flows in and out of the climate system.
You can differ with me all you wish but the scintific ( sic) community is NOT in unison on this matter.
Here is James Lovelock, the Gaia author and scientist in The Guardian of 29 March 2010-
“ The great science centres around the world are more than well aware how weak their science is.If you talk to them privately they’re scared stiff of the fact that they don’t really know what the clouds and the aerosols are doing.They could be absolutely running the show.We haven’t got the physics worked out yet.”
And again ,” The problem is we don’t know what the climate is doing.We thought we knew 20 years ago.That led to some alarmist books-mine included – because it looked clear cut, but it hasn’t happened .The climate is doing its usual tricks. There’s nothing much really happening yet.We were supposed to be half way toward a frying world by now.Twelve years (now 20) is a reasonable time …..it ( the temperature ) has stayed almost constant, whereas it should have been rising- carbon dioxide is rising, no question about that.”
On the other hand if you and Al Gore and ALL the scientific community say to the contrary , well I guess I’ll have to think again……
The ocean temperatures are measured in degrees. The only reason they are converted into Joules is try make them is seem more scary. It’s a propaganda ploy.
BTW the ARGO buoys showed cooling until the data was adjusted to show warming. It’s kind of pointless anyway because they ARGO floats are free floating, so you can’t infer any trend in the data. It would like reading the temperature in Santa Monica, then driving to Las Vegas and reading it again, and claim it was warming.
AB
By what mechanism do you propose to heat the atmosphere 120 degrees with the cooler ocean water?
Making the observation that two things have equivalent energy does not mean that it is possible to exchange or even balance the two energy contents.
A rather important point. That old pesky 2nd Law.
After decades of excited anticipation for warmer weather in my region, every winter I am sadly disappointed that I still need to brave the cold. How much longer must I wait to get temperate weather??? I am aghast – my 15 year old potted citrus trees are in full bloom just begging to go outdoors right about now but I don’t dare. The IPCC liars promised me I would be guaranteed tropical weather by now…
“After decades of excited anticipation for warmer weather in my region, every winter I am sadly disappointed that I still need to brave the cold.”
If you live in Minnesota, you may receive some solace from the web site Minnesotans For Global Warming
http://www.m4gw.com/
Hey thanks, never thought that Minnesotans had this kind of brilliant humour.
They deserve a big hand.
Tim, I was disappointed to learn that you never read or comment on the responses to your work. It’s a bit elitist and school teacherish to just deliver a ‘lecture’ and take no interest in feedback. On this site, you miss out on getting an enriched education for yourself.
I’m sure people have pointed this out before, but have probably missed it in comments…someone should do a full post on it, but I lack the expertise…
In any case, this post reminds me yet again that “global warming” is predicated on the amplification of CO2 effects by water vapor, not just a little, but by a lot. Where is the study showing this drastic increase in absolute humidity? Shouldn’t 200 ppm CO2 increase water vapor by 800-1000 ppm globally?
If we can measure the tiny increase in ppm of CO2, surely we can measure the 4x-5x ppm increase in H2O?
Roland
VERY IMPORTANT INFORMATION. If true this means that sea level rise is meaningless.
https://platform.twitter.com/widgets.js
we have had so much snow in the north and south hemispheres in the past few years the glaciers have to be coming back, its not so much the climate evidence that worries me, its the social reaction to the theory of it. From manipulating the past to theorising about the future , tis the damning of anyone who stands against this and the thoughts of the majority or groups of influence who invent it as truth, that is the worry.
BTW , NASA says the ocean is rising at 2.5mm per year, this is actually immeasruable. The ocean is so fluid such a miniscule rise is nonsense. Go and stand by the sea and imagine it. Tides, storms , rising seabeds , volcanoes , heating and coooling, melting , floods, droughts, its absolute nonsense. Plain fearmongering. The El Nino trade-winds drives an ocean tide in Australia 60cms above normal levels, 60CMS !!! A 2.5mm rise is ridiculous, its a AGW lie.
For those that believe in the radiant greenhouse effect, what is most important is the total greenhouse gas concentration and the total radiant greenhouse effect. Both are so dominated by H2O that CO2 emissions are insignificant. They do not have any data that shows that mankind has caused total greenhouse gas concentrations and the total radiant greenhouse effect to increase. If CO2 really affected climate than one would expect that the increase in CO2 over the past 30 years would have caused at least a measurable increase in the dry lapse rate in the troposphere but that has not happened. We must also take note that the primary greenhouse gas, H2O is really a net coolant as evidenced by the fact that the wet lapse rate is significantly less than the dry lapse rate in the troposphere. In terms of trapping heat it is really the non-greenhouse gases that are more apt to retain heat energy than the so called greenhouse gases because the non-greenhouse gases are such poor LWIR radiators to space. Based on observations and atmospheric physics it is most likely that the AGW conjecture is false.
It gets tiresome reading all this stuff here and most other places that rely on their versions of radiative physics and statistical devices to produce hockey sticks as is well- proven, Nick.
What we do know, who have looked upwards, is that radiative physics can be and here are sidestepped by Equipartitition in Real Life eg Nature or Physics. That is to say, Atmospheres above 0.1bar allow convection and phase change to dominate because they follow the line of Entropy, LOTD, the best.
Think on this. Learn about Equipartition and equally important, about how Quantum Oscillators do not react to weaker forces and EMF is a Vector Force. Following the Net Energy Gradient ONLY. From real understanding comes the truly illuminating ability to picture and understand. Brett
You say that the human influence is impossible to pinpoint, but the isotopic composition of atmospheric CO2 is decreasing, which is consistent with fossil fuel burning…
What has isotopic composition of atmospheric CO2 to do with the balance of the carbon cycle?
Ah yes, “consistent with”. According to NOAA, δ13C of CO2 from vegetation is around -26 per mil and fossil fuel burning -28 per mil, with flux from oceans of around -9.5 per mil (source: https://www.esrl.noaa.gov/gmd/outreach/isotopes/c13tellsus.html).
The decreasing atmospheric δ13C is actually “consistent with” the incremental CO2 having a δ13C content of -13 per mil. Not exactly “consistent with” -28 per mil. Keeling plot for South Pole (intercept is average δ13C content of extra CO2) here:
Thanks, Jim. But couldn’t the -13ppt signal indicate a mixture of sources? The mere fact that the d13C in atmospheric CO2 decreases as fossil fuels are burned supports the notion that some of this CO2 is being mixed in the atmosphere.
Matheus, the answer to your question is yes, I agree. If you mix two sources of differing δ13C content, then the result will be a blend as it is simply the ratio of 13CO2 molecules to 12CO2 molecules. There are two “buts”, however. The first is that the AGW hypothesis is that ALL of the additional atmospheric CO2 is from fossil fuel burning and it is then necessary to invoke a major influx of 13C into the atmosphere through CO2 exchange with the oceans in order to match the observed δ13C trend (i.e. “low” δ13C CO2 is replaced by “high” δ13C CO2, but with no net change of CO2). See Figure 5 here: https://agupubs.onlinelibrary.wiley.com/doi/full/10.1029/2001GB001845. The black arrow reflects atmospheric growth with a gradient of -13 per mil, while the light blue arrow shows the “adjustment” necessary to increase 13C without changing the CO2 level.
The second “but” is the point that the “blend” must have remained in constant proportions in order to see a linear relationship on the Keeling plot. In fact, there is some evidence that the incremental CO2 has had an average δ13C content of -13 per mil ever since the start of the industrial revolution. A Keeling plot of the Law Dome ice core data gives an intercept of -13.1 per mil (Figure 1, http://www.biogeosciences.net/3/539/2006/bg-3-539-2006.pdf). Note that Figure 1 also shows Point Barrow observations (not ice core data) and get intercepts of -25 per mil (detrended) and -17 per mil (“original”). The detrended value reflects the annual cycle and is consistent with it being driven by vegetation. Their “original” value is unfortunately a mixture of the long term trend and the annual cycle and is meaningless. If you use the Point Barrow data after removal of the annual cycle (as published by Scripps), you get -13.2 per mil.
Further, if you accept the ice core data that indicates atmospheric CO2 was at 280 ppm with a δ13C of -6.4 per mil back in 1750 and current observations of 410 ppm and -8.5 respectively, the additional atmospheric CO2 of 130 ppm has had an average δ13C content of -13 per mil:
((410*(-8.5)-(280*(-6.4))/(410-280) = -13 per mil
Note that there is an extremely minor approximation in this relationship as it takes the CO2 level and combines it with the 13C/12C ratio (relative to a standard). Since 12C is 99% of CO2, this approximation is insignificant.
Very good explanation, thank you.
Sorry, messed up the blockquotes. My response to Dr Ball’s quote was –
By the same token temperatures rose by 1.08°C between February 2012 and February 2016. Why did no one mention a rise of over 1 degree in just 4 years? Probably because they knew that comparing individual months is meaningless.
Alan Tomalty makes some great posts here.
His postings about c02 heat capacity and the 15 micron photon being impossible to be absorbed by co2 in the first kilometre of atmosphere falsifies this statement.
”The Sun rises, and the temperature begins to increase as the solar angle increases. There is no increase in CO2, just as there is no decrease when temperatures begin to decline as the Sun sets.”
Because the optically active co2 above 1km reduces at night, by morning 70%+ of atmospheric co2 is in the first 1km of atmosphere.
It descends quickly as it cools, its the heaviest molecule.
So as the sun rises so does the bulk of co2, to temperatures and pressures where it becomes radiatively [optically] active.
I do ofcourse mean warming or cooling relative to surroundings and pressures,…
Because obviously has to physically warm as it descends, and physically cool as it ascends.
“Because the optically active co2 above 1km reduces at night, by morning 70%+ of atmospheric co2 is in the first 1km of atmosphere.
It descends quickly as it cools, its the heaviest molecule.”
News to me and I suspect, the scientific commumity.
Citation please.
If CO2 were in concentration, in say, a balloon, then it would fall under it’s own weight.
However in the atmosphere it is diffused among N2 O2 And a few other trance gasses.
Remember its concentration is only 0.04%.
Therefore CO2 molecules are constantly being jostled by molecules of these other dominant gases, and the Earth’s atmosphere is never completely still through its depth.
The Earth’s gravity is not significant against these forces on such a tiny mass.
Here is a CO2 concentration graph from various locations around the globe. You can even see the annual variation due to the winter/summer cycle in the NH (predominant source of CO2 via vegetation.
Indeed it is well-mixed to get down there quickly enough that that signal is not eroded.
https://www.esrl.noaa.gov/gmd/ccgg/trends/gl_trend.html
If diffusion were the only mixing agent in the atmosphere CO2 concentration would diminish with height, at 10 km CO2 concentration would be ~200 ppm. However, turbulent mixing dwarfs diffusion, the atmosphere is well mixed.
Gary Ashe December 30, 2018 at 5:09 am
Alan Tomalty makes some great posts here.
His postings about c02 heat capacity and the 15 micron photon being impossible to be absorbed by co2 in the first kilometre of atmosphere falsifies this statement.
”The Sun rises, and the temperature begins to increase as the solar angle increases. There is no increase in CO2, just as there is no decrease when temperatures begin to decline as the Sun sets.”
Because the optically active co2 above 1km reduces at night, by morning 70%+ of atmospheric co2 is in the first 1km of atmosphere.
It descends quickly as it cools, its the heaviest molecule.
So as the sun rises so does the bulk of co2, to temperatures and pressures where it becomes radiatively [optically] active.
What a load of garbage, but considering the source not surprising!
It is early and I am doing Sunday chores, but I assure you his (and his cohort of warmista jackass partners-in-trolling) inane Gish Gallop of nonsense and hogwash has been duly noted and will be taken to the mat, all in due time.
When one’s opponent is flailing wildly, sometimes it is best to just stand back and let him punch himself out.
Been mentioned and cited many times here, one of the posters was actively measuring and posting the levels above his test areas and crops.
Most plant stomata are on the underside of the leaf, except where the plants are fed from above, deserts etc.
Co2 that descends.
No a peer-reviewed paper please.
Here isn’t peer-reviewed science, tho I know denizens think it is.
My link above shows what you say to be incorrect.
It must be for those traces to show both the same trends both in the long and short term at the same concentration.
Peer review is a joke. Someone recently submitted a scientific paper, to half dozen major journals, based on Star Wars lore. IIRC four of them offered to publish the paper — for a fee of course.
Speaking of pay-for-play. Muller (the converted skeptic) when on a PR tour before his BEST paper was even published. It was finally published by an Indian internet journal — for a fee of course.
And then there are the Climategate emails that show the top scientists in this field conspired to corrupt the peer review process.
Peer review is not what you think it is.
Rather than being a “joke,” peer review is the quality control system of science.
600 to 700ppmv in the mornings, which reduced to 100 to 200ppmv by 11am,…..
As the crop hoovered it all up.
I remember it all, his regular graphs of real world interaction.
i just dont remember the exactness.
ps demanding i do your bidding will just get you your head verbally ripped off.
Have a nice day.
BTW, where did I post “all global variations” ?
Gistemp is adjusted data. LOL Pretty sure you know that.
The actual data (before adjustments) show that the 30’s dust bowl era was as hot or hotter than the present. Tony Heller has covered this topic extensively.
Along with MWP & RWP the information has been erased, Soviet Union style, so Chicken Little’s can claim the sky is falling.
Sure. Here you go:
https://stevengoddard.wordpress.com/data-tampering-at-ushcngiss/
“Show me the data for the “hot 1930’s””
Here’s the Hansen 1999 US surface temperature chart. Hansen said 1934 was 0.5C warmer than 1998. That makes 1934 0.4C warmer than “the hottest year evah!” 2016 (according to the UAH chart):
Let me anticipate your reply that this chart only covers the US. Well, I have more charts from all over the world and in both hemispheres which show the same temperature profile as Hansen 1999, i.e, the 1930’s are as warm or warmer than subsequent years.
What this means is the Earth is not experiencing unprecedented warming today. It was just as warm or warmer in the very recent past. No need to go back to the Medieval Warm Period. And what that means is the warmth of the 1930’s was caused by Mother Nature, not CO2, and the current warm could also be caused by Mother Nature because the temperature levels are practically the same for both periods of time, and we should assume Mother Nature is the cause until proven otherwise.
Reg, GISTEMP data is going to be the downfall of the entire AGW scam. Now that they have to start using the 1980-2010 baseline, how cold do you think the next 3 decades are going to look. if you take Nov figure of 0.77c against 1951-1980, and then use 1980-2010, the figure comes in at 0.34c, less than half.
Not forgetting, they are also increasing adjustments to temps after 1980. What could they possibly do to alter this massive problem once the AMO and PDO go cold, given they have adjusted upwards in the warm cycles? Once the cold cycles come, GISS will start showing massive cold numbers well under UAH. That is the ultimate definition of shooting a harpoon through ones foot I would have thought.
My woodfortrees graph shows GLOBAL temps.
Um, no it doesn’t There were no global temps in the 30’s. The majority of the data is from the US, Europe, and few other countries. Seventy percent of the world has no surface temperature data. This was true in the 30’s and is still true today.
The US data which comprises a large percentage of station data from the 30’s, and has been adjusted to make the past cooler.
Phil Jones admitted in the Climategate emails that much of SH data was simply made up.
Show me actual, untampered data showing the 30’s were cooler.
Relatively hot. CO2 rising, temperatures not:
http://www.woodfortrees.org/plot/gistemp/from:1935/to:1975/plot/gistemp/from:1935/to:1975/trend
CO2 concentration rate of change is still tracking temperature anomaly. We are not in the driver’s seat.
http://woodfortrees.org/plot/esrl-co2/derivative/mean:12/from:1979/plot/uah/offset:0.6/scale:0.22
dC02/dt detrends the data. The derivative remove the actual trend. Besides, it’s the absolute level of CO2, not it’s rate of change that produces the GHG effect. Try again Bart.
There is still a trend in dC02/dt. Emissions also have a trend. There is little to no room for it.
It is hypothesized that the absolute level modulates temperature, as the IR absorbance properties of CO2 cannot be denied. However, this is only a top level effect, and the Earth’s regulatory system has many feedbacks. There is no fundamental requirement that the aggregate impact of rising CO2 concentration in a given climate state must produce surface warming.
And, in fact, the aggregate response cannot be significantly positive, because it would produce an unstable, positive feedback loop that would not be stabilized even by T^4 radiation. We have the relationship above, which indicates that temperatures drive concentration. If concentration also drives temperature, then a temperature rise produces rising CO2, which produces rising temperature, which produces rising CO2, and so on ad infinitum.
Other feedbacks can ameliorate the instability, but not quickly, as is indicated by the above relationship. The upshot is, aggregate climate sensitivity to CO2 concentration is not significant. If it were, the system would have reached a saturation level eons ago, and we would not be here.
See below for more.
You are thick.
…
…
dCO2/dt detrends the data
…
Here take a look:
http://woodfortrees.org/plot/esrl-co2/derivative/mean:12/from:1979/plot/esrl-co2/mean:12/from:1979/offset:-380
When you detrend the data, you remove the first order effects of it’s absolute value, and your derivative puts the focus on second order (noise) in the data set.
No, I am not missing anything. You are. Think on it.
dCO2/dt detrends the data.
…
So simple.
http://woodfortrees.org/plot/esrl-co2/derivative/mean:12/from:1979/plot/esrl-co2/mean:12/from:1979/offset:-350
…
Slope of red line (your dCO2/dt) is zero
Green line slope is from actual data.
…
Taking the derivative removes the trend. The actual value of that slope is missing from your derivative.
This is immaterial, Steve. There is still a trend in dCO2/dt, and it matches the trend in temperature anomaly.
It is absolutely material, because you are using dCO2/dt in your equation, and therefore your relationship ignores the trend in CO2. Just because there is a trend in dCO2/dt doesn’t absolve you of throwing away the trend in measured concentration of CO2 in the atmosphere. Since you throw away this trend , your equation says nothing about the effect that CO2 has on temperature. In fact your graphic doesn’t even tell us which quantity is independent, and which is dependent.
“There is still a trend in dCO2/dt, and it matches the trend in temperature anomaly.”
….
Nope, they are different
…
http://woodfortrees.org/plot/esrl-co2/derivative/mean:12/from:1979/trend/plot/uah6/offset:0.6/scale:0.22/trend
…
But of course you could jigger your arbitrary scale factor of 0.22, to make them align more closely. But then, all you are doing is mucking with your curve fitting parameters.
….
http://woodfortrees.org/plot/esrl-co2/derivative/mean:12/from:1979/trend/plot/uah6/offset:0.6/scale:0.24/trend
…
You better go back to the drawing board and try for something better.
No matter how you change either the offset or the scale, you can’t make the slopes of the two trend lines match Bartemis, so your statement that they match is false.
No, Steve. These are stochastic time series, and the trend lines are stochastic entities. They do not have to match perfectly, just well enough.
You have entered the phase of making up excuses to deny what your eyes can plainly see. It’s always the first step. In time, you may or may not graduate beyond it.
BTW, this:
“No matter how you change either the offset or the scale, you can’t make the slopes of the two trend lines match…”
is just silly. Of course you can.
http://woodfortrees.org/plot/esrl-co2/mean:12/from:1979/derivative/plot/uah6/scale:0.175/offset:0.146/plot/esrl-co2/mean:12/from:1979/derivative/trend/plot/uah6/scale:0.175/offset:0.146/trend
One word: Overshoot. Good article…reason and logic may yet win the day, but Climate Change is not the real problem, only a symptom of Overshoot: Too much energy expended extracting resources, manufacturing, consumption and increasing the population. We have Overshot Earth’s capacity to carry human beings, or soon will. Should the Climate Change scare fail to cripple civilization Overshoot is lurking the the heart and mind of every enviromental extremist and every morl person. Not my opinion, but do a search for “Why Climate Change Isn’t Our Biggest Environmental Problem, and Why Technology Won’t Save Us”. The media and politicians will make the transition seamlessly. Imagine a world with no nation-states, only third world societies, no traditional families, millions neutered at birth. War is good, disease is better. Suicide, abortion, euthanasia encouraged. Mankind excluded from nature. We can heal Mother Earth. That’s the goal, the dream.
Edit: morl = moral. Need to add: An egalitarian world with, of course, some more equal than others. I suspect all religions will be disallowed.
Dr. Ball: “Human influence is not clear because human production of CO2 is within the error of the estimates of two major natural sources, the oceans, and rotting vegetation. You cannot separate human production from the noise of non-human production and variability”.
Ice cores have shown nearly constant CO2 of 280 ppm in the atmosphere for more than 100 centuries. Was it merely by chance that CO2 has risen by 130 ppm in the two centuries since the Industrial Revolution? A period when we burned enough fossil fuel to raise CO2 by 250 ppm?
This is nonsense. Let’s hope that the rest of the post is better.
“Ice cores have shown nearly constant CO2 of 280 ppm in the atmosphere for more than 100 centuries.”
The ice cores are not and cannot be validated. Other proxies indicate different results. The ice cores are chosen because they give results that support the narrative. But, they are not established truth.
In fact, there is a fundamental disconnect in the narrative. Rock steady concentration for centuries would indicate high bandwidth regulation. Yet, for the level to be so sensitive to our inputs, regulation would have to be extremely low bandwidth. One cannot have both high and low regtulatory bandwidth. It is one or the other.
“Was it merely by chance that CO2 has risen by 130 ppm in the two centuries since the Industrial Revolution?”
Yes. This is a post hoc ergo propter hoc logical fallacy.
“A period when we burned enough fossil fuel to raise CO2 by 250 ppm? “
Do you weigh as much as the sum total of mass you have ingested since birth? Is the water level in a lake equal to the total volume of water that has flowed into it?
Of course not. These are dissipative systems, and the levels attained strike a balance between inflows and outflows. In such a system, the contribution of relative sources to the overall balance depends upon the linearity of the feedback that establishes the balance. For a linear feedback, the perturbation is 1:1, and any additional input cannot contribute proportionately more to the output than its proportion of the input.
It is widely believed that the ratio of natural inputs to anthropogenic sources is on the order of perhaps 30:1. With a linear balance, if natural inputs maintain a level of 300 ppm, human inputs could add only as much as 300/30 = 10 ppm additional.
In order for human inputs to contribute an additional 100 ppm, a ratio of 4:1, there would have to be a very strong nonlinearity indeed, and the system would be super-sensitive to additional inputs. Such sensitivity is not only highly unlikely, but again, contradicts the ice core narrative.
In actual fact, atmospheric CO2 concentration evolves such that the rate of change matches the temperature anomaly:
http://woodfortrees.org/plot/esrl-co2/derivative/mean:12/from:1979/plot/uah/offset:0.6/scale:0.22
Causality is necessarily in the direction of temperature anomaly to rate of change, because positing that the rate of change of CO2 drives temperature anomaly leads to absurd conclusions – in that case, we could pump CO2 up to whatever level we please, and once we stopped, the temperature anomaly would revert to its initial value, regardless of concentration.
The match occurs in both the short term variation, and the long term trend. Human inputs also have a trend. Adding them in would require rescaling the temperature dependent term to make room, but that would create a mismatch with the short term variation. The upshot is, there is little to no room for human inputs to have a significant impact.
In fact, CO2 concentration has been diverging from the emissions since the advent of the temperature “pause”. In this plot, we see that emissions increased by some 43% from 2002-2014, yet the rate of change of atmospheric concentration didn’t budge.
Such an outcome is perfectly consistent with all conservation laws. I outline a way into which such a dynamic could come about here.
Bartemis wrote: “The ice cores are not and cannot be validated.”
Ice cores are validated by the consistency of the results that have been obtained. Analysis of dozens of ice cores has told the same story: Snow deposited in the last 100 centuries (except the last two centuries) has turned into ice that contains 275+/-5 ppm of CO2 in the air trapped inside the ice. That is 100 ppm less than in the air today. If current air were contaminating the analysis, then the results would be very different. However, once you go deep enough to reach deposits from the last ice age, CO2 goes down. And the uppermost layers deposited in the early years of the industrial age show more than 275 ppm of CO2. (Analytical chemists always include lots of control samples to ensure that their instruments are functioning properly, especially with precious samples.)
If you look at the Grand Canyon, you can visibly see lots of layers of deposits because they have different colors. If they didn’t have different colors, you could analyze samples and see where one layer started and another stopped. If you drilled a well nearby and visually inspect or chemically analyze the material that came out, you would discover the same layers. Geologists don’t need visual evidence from a Grand Canyon to know what layers lie under the ground. As one moves from location to location geologists find different layers. However, no matter where on the planet we drill into ice – Greenland, Antarctica, Himalayan and Andes glaciers – we find the same story, a long period with 275 ppm of CO2. In some places we can clearly see the beginning of an increase in CO2 from the early years of the industrial revolution and in some places we can see back to the last ice age. Only in Antarctica can we go further back.
Dating the age of the ice core layers is easy near the top and more challenging as the ice is distorted by pressure from above. The ice itself contains isotopic proxies for temperature. Dating the age of the air trapped inside the ice is more challenging, since the compaction of snow into ice that prevents gas diffusion takes many decade in Greenland and centuries in drier Antarctica. But limited controversies over dating don’t change the BIG PICTURE about how CO2 has changed, just the timing of temperature change and CO2 change.
We can see the evidence of man’s emission of CO2 in many ways: 1) The rise that has been tracked and Mauna Loa and other sites since the 1960. 2) The rise in CO2 in the top layers of ice cores. 3) The change in the amount of C14 in these samples. Those 19th century samples ARE inconsistent with the current understanding of changing CO2 – but you would make equally confusing measurements today contradicting the conclusion CO2 is around 400 ppm if you didn’t make your measurement at carefully controlled locations. You breath out 4000 ppm of CO2 and plants take it up, but only in sunlight. Even on Mauna Loa during daytime there are fluctuations in the amount of CO2 in the air swept up the mountain over the vegetation during daytime. The data you see is obtained at night from descending air masses.
To understand the flux of CO2 between atmosphere, ocean and land reservoirs requires very sophisticated analysis using multi-compartment models and taking into account changing pH. I’ve dabbled with the problem and know this isn’t a field for amateurs or discussion at a blog post. It takes 1000 years for ocean currents to redistribute human emissions into the deep oceans, so emissions from the past century are nowhere near equilibrium. Short-term changes in temperature only effect the amount of CO2 in the mixed layer (top 50 m) of the ocean.
If you accept quantum mechanics (which governs the interactions between radiation and GHGs), then rising GHGs will slow the rate of radiative cooling to space. Conservation of energy means this radiative imbalance will cause warming. Observing this warming is challenging on a planet with chaotic ocean and air currents that produce phenomena like ENSO that can warm the planet almost 0.3 degC in six months and cool it 0.3 degC in the next six months is difficult, especially when we have little information about slower processes like the AMO and PDO. Proof that GHGs cause warming comes from QM and COE. The 0.85 degC of warming observed in the past half-century is consistent with highly uncertain expectations of warming (70% confidence interval of 1.5-4.5 K of warming per doubling of CO2).
It is idiotic would look at the Figure you linked for 2002-2014 and say it PROVES CO2 emissions don’t accumulate in the atmosphere or cause warming. Someone has simply cherry-picked the very noisy signal for rising CO2 from an unrepresentative period (the Pause), taken the derivative and smoothed it. The graph below shows the big picture. CO2 emissions have doubled since 1975 and tripled since 1960.
“Ice cores are validated by the consistency of the results that have been obtained.”
No. Consistency between bad proxies only shows they are equally bad. You need independent corroboration.
“Conservation of energy means this radiative imbalance will cause warming.”
No, it means the dynamics will be perturbed. It does not say that, in the aggregate including all feedbacks, there will be significant, or even any, warming.
Feedback dynamics are not intuitive. If you do not have significant experience with feedback loops, your intuition is likely to lead you astray.
“CO2 emissions have doubled since 1975 and tripled since 1960. “
And, this tiny perturbation to the natural flows has been almost full absorbed by the sinks. The net result is overwhelmingly dictated by temperatures, as the rate of change is proportional to the temperature anomaly in both the long and the short term.
Bartemis:
The isotopic variation (2-H and 18-O) are proxies for temperature. The CO2 in the air trapped inside the ice is real CO2 itself, not a PROXY for anything! Either the air in the ice was trapped when snow compacted to ice or it has found a way into the ice over the millennia since the ice formed. Unless you can devise a rational hypothesis where all other skeptics have failed, there is no way air could seep into hundreds of meters of ice and leave a constant 280 ppm of CO2 in most layers, but not in the deepest ones or shallowest ones. Or oscillate between 180 to 280 ppm in the oldest ice cores from Antarctica.
Conservation of energy means that an object that received more energy than it loses must be storing the difference as internal internal energy. In other words, it will warm. Heat capacity tell us how much energy is needed to raise temperature 1 degC. No ifs, ands, buts, caveats, feedbacks, dynamics, or loops. Warming.
A warmer planet will emit more LWR to space and may reflect less or more SWR. If our planet emits or reflects 1 extra W/m2 for every degK it warms, then it will need to warm about 3.6 K to correct the imbalance created by a slowdown in radiative cooling to space from 2XCO2. In that case, the planet will warm to a new steady state 3.6 K warmer. If our planet emits or reflects an addition 2 W/m2 for every K of warming, the new steady state will be only 1.8 K warmer. If 3 W/m2/K; 1.2 K of warming. 4W/m2/K; 0.9 K of warming. And so on. 10 W/m2/K; 0.36 K of warming. Note, you never reach zero warming. A graybody at 288 degK and with emissivity of 0.61 emits 3.3 W/m2 more radiation for every degK it warms.
Yes, feedbacks determine whether the planet emits or reflect an addition 1, 2, 3, 4, or 10 W/m2 per degK of warming. BUT FIRST, conservation of energy demands that a slowdown in radiative cooling produce SOME non-zero amount of warming. The climate feedback parameter (additional W/m2 emitted or reflected per degK of warming) only controls how much warming will be needed to eliminate the radiative imbalance that is causing warming.
The planet reflects about 100 W/m2 of SWR back to space, but only 50 W/m2 is reflected by clouds. So, if you want to a climate feedback parameter of 10 W/m2/K, you need at least 7 W/m2/K of cloud SWR feedback or about a 14%/K increase in reflection of SWR by clouds per degK of warming. That would mean there were almost no clouds during the ice ages. Absurd. +1 W/m2/K of cloud SWR feedback would be a 2%/K increase in reflection. More reasonable, but then the planet will behave at best about like a graybody and warm 1 degK after a doubling of CO2.
Only half of anthropogenic emission of CO2 has been absorbed by sinks. A 1000 years from now, the deep ocean will have absorbed about 85% of our emissions, but transport into the deep ocean is slow.
During the ice ages, the colder ocean can hold more CO2 and ice cores show atmospheric CO2 drops 100 ppm – about 20 ppm per degK of cooling. The 1 degK of warming we have experienced might have resulted in the emission of 20 ppm – if it didn’t take 1000 years for water deep in the ocean to reach the surface, warm and emit that 20 ppm.
Dr. Ball tells us: “The claim that levels of carbon dioxide and methane are unprecedented in the last 800,000 years is only true if you ignore the severe problems and limitations of the ice core measures and ignore the 90,000 19th century CO2 readings that show much higher levels.”
What Dr. Ball doesn’t tell us is where those measurements were taken? In a laboratory heated by a coal burning fire? Professor Keeler carefully placed his instruments on the top of Mauna Loa so he could sample CO2 in the air far from sources and sinks for CO2. The top is 13,500 feet above sea level where tropical winds bring in fresh air every day from about 1000 miles away. Measurements are only made at night, when land cooling faster than ocean produces descending air masses that originate thousands of feet above the top of the mountain. Why does Dr. Ball think CO2 measurements from undocumented and uncontrolled locations should have any meaning relative to Keeler measurements. Exhaled air contains about 4000 ppm of CO2. For all we know, those 19th measurements could have been biased by researcher’s breathing.
Ice cores also contain samples of air far from sources and sinks for CO2 that was trapped long ago. Measurements are very stable back until the end of the Little Ice Age, when CO2 levels suddenly fall according to dozens of ice cores that have been analyzed. Either there is a massive conspiracy to fool the public about changes in CO2 or the consensus view is correct. Unless Dr. Ball has some proof that the samples collected in the 19th century were collected in an manner intended to be representative of the bulk atmosphere, then the values are meaningless.
Furthermore, we can be fairly sure that those 19th century samples analyzed for CO2 weren’t representative of the atmosphere as a whole. It has taken a massive industrial effort for 50 years to mine and burn enough fossil fuel to raise CO2 in the bulk atmosphere by about 50 ppm. Those 19th century measurements show changes of more than 50 ppm within a single year! Where is all of the CO2 come from in such a short period of time? Meanwhile. ice cores show much smaller changes for more than 100 centuries from natural fluctuations.
The conclusion is obvious. Those 90,000 measurements of CO2 in the air couldn’t have be a representative sample of the bulk atmosphere – what we carefully measure today and what is found in ice cores. These old measurements are meaningless.
This is hand waving rationalization.
Bartemis: The air around you right now may not be anywhere near 410 ppm. Look at this data from a cornfield from a prominent skeptic and skeptical blog.
http://joannenova.com.au/2013/09/plants-suck-half-the-co2-out-of-the-air-around-them-before-lunchtime-each-day/
The scientists who measured CO2 in the atmosphere in the atmosphere were not trying to determine how much CO2 was in the entire atmosphere by analyzing sample representative of the whole atmosphere. Or, if that was their intention, they failed to obtain truly representative samples.
Or see this post from another skeptic showing how much CO2 varies depending on where you measure it.
http://www.ferdinand-engelbeen.be/klimaat/co2_measurements.html
Dr. Ball has been around climate skeptics for a long time. Either he is aware that local CO2 concentration varies widely (today and in the 19th century) and deliberately trying to deceive you. Or he is suffering from confirmation bias and unable to assimilate information that contradicts his deeply held beliefs about climate change. Confirmation bias is a huge problem in today’s world, where everyone is exposed to a narrow range of the media, social media and the internet. As best I can tell from looking at a number of sources (including Bock’s(?) paper), CO2 varies widely LOCALLY in the real world. Good luck figuring out who to believe.
Frank: I haven’t said the other proxies are accurate. I do not know if they are or not. I could hem and haw, and rationalize things one way or another, but that would not establish truth.
My point is that there is no way to verify the ice cores. There is no corroborating evidence in the distant past. As such, at best that data can only be considered provisional. It does not have the force of modern, direct measurements which tell us that the rate of change of CO2 concentration is tracking temperature anomaly.
Bartemis: What corroborating evidence do you want?! For the top layers of an ice core in Greenland, you can see and count the visible layers. At the top is compacted snow with air between the particles that allows some diffusion. Below the firn, pressure has obviously converted snow into solid ice with visible bubbles inside. Still with clearly visible annual layers. You can be sure air isn’t diffusing into that ice, because it contains 280 ppm of CO2, not today’s 400 ppm. Nor is 280 ppm the result of some averaging process, because it remains 280 ppm until you reach the depth where snow was deposited before the Holocene where CO2 starts falling towards 180 ppm. This happens in all ice cores around the world that go deep enough. In Antarctica, as you know, you can see at least four glacial/interglacial cycles in the deepest cores.
Have a look: See the layers? See the bubbles? How can many, but not, all layers have bubbles with 280 ppm of CO2, if that wasn’t the amount of CO2 in the atmosphere a when a layer of snow turned to ice?
This comment is juvenile. You might as well pose “Bartemis is a big poo-poo head.” Meh.
Richard: Even “brick walls” deserve an opportunity to learn. Confirmation bias makes it very hard for humans (including me) to assimilate information that contradicts their deeply held beliefs that have been acquired in poorly informed corners of social media and the internet. We are all “brick walls” to some extent and being forced to confront challenging and disturbing information is the only way we can learn. The idea that citizens can learn is central to democracy.
Projection much? The moat in mine eye…
Do you guys have anything substantive?
This has been answered.
Do you really want to continue displaying your butthurt to everyone with these catty replies? It’s not a good look, and it’s diminishing whatever gravitas you may have thought you had, not enhancing it.
The IPCC assert with 95% certainty that 95% of the temperature increase since 1950 is due to human CO2.
This is not true, they assert with 95% confidence that the majority of the temperature increase since 1950 is due to anthropogenic causes. The majority. Never said 95%, and even less so with 95% certainty.
How much are they saying with their ‘majority’ 95% confidence? 51%…60%….75%?
It is so obviously a hoax and yet we seem helpless to stop them.
All in good time as it’s their prescriptions that are beginning to see them undone at an increasing rate. Questioning what motivated their failed prescriptions will naturally follow from the fallout from that.
Let’s face it these are people who’ve been trying desperately to disprove a fundamental axiom of engineering, namely that you can’t build a reliable system from unreliable componentry with national power grids. Even if they work it out the only sanctuary for these unreliables charlatans is electrochemical storage when the history of mankind’s ability to store energy is pitiful, except in the form of calories and pumping water uphill. They’re now facing yellow vests or yellowcake but that’s Hobson’s Choice for them.
A lot of smart (brain washed ) young people keen on spending other people’s money chasing a non- problem.
As I commented more than ten years ago, everybody can read a thermometer. Everyone can can suffer the terrible effects of burgeoning winter. Winter is Coming. Winter can not be argued with or spun.