From the Institute for Hydrography, Geoecology and Climate Sciences comes this paper that is just one more piece of evidence that the Medieval Warm Period was global, and not regional.
Mapping Medieval Climate Change in Africa:
Continental warming, coastal cooling and shifting rainbelts 1000 years ago
Global climate is currently undergoing major change. Experts agree that this change is driven by a combination of man-made and natural factors. However, full quantification of the anthropogenic and natural components is still a matter of debate. In order to better understand the contribution of natural climate variability and distinguish this from man-made influence, researchers worldwide have gone out to the field to study Earth’s pre-industrial climate history. Of particular interest are the past thousand years, which in Europe and North America have seen the transition from a rather warm medieval period to major cooling of the Little Ice Age, followed by the temperature rebound of the Current Warm Period which was further intensified by human greenhouse gas emissions. Our understanding of medieval climate outside this well-studied North Atlantic region is unfortunately still poor.
An international team led by geoscientist Sebastian Lüning wants to change this. Lüning is a professional resources geologist who in his sparetime works on paleoclimatological studies with the Switzerland-based Institute for Hydrography, Geoecology and Climate Sciences. Together with colleagues from Poland, Nigeria, Turkey and Germany they embarked on a journey through the scientific literature to shed light on the so-called ‘Medieval Climate Anomaly’, a period comprising of the years 1000-1200 AD. The initial focus region of their study was Africa. Lüning and his team crawled through hundreds of publications and mosaiced together a fascinating picture of African medieval climate change that tracks ancient heat waves, local cooling, drought and phases of amplified rainfall. Using modern database and visualization technology, the team managed to synthesize astonishing trends from the large amount of filtered data. Lüning explains the challenge:
“This was true detective work. Obviously, we do not have any thermometer measurements or satellite data from medieval times. Scientists therefore analyze natural archives, namely sediment cores from the ocean floor, lakes and peatlands, as well as cave dripstones. Layer by layer the climate history is recorded like in a geological book, recorded by changes in geochemistry and fossil content. These property variations are then geologically translated back into climate parameters. Radiocarbon age dating provides the necessary time orientation”.
All published data were initially collected on a Google Map. The recorded climate development was then thoroughly correlated across the region and resulting temperature trends were mapped out. The vast majority of land sites in Africa showed a characteristic warming during the Medieval Climate Anomaly, in line with similar warming in Europe and North America. The situation in the coastal seas surrounding Africa, however, was different. Changes in the wind systems intensified the upward transport of deeper cooler water to the coasts, which resulted in a marked medieval cooling in the so-called ‘upwelling’ zones. Nevertheless, the areal extent of these narrow coastal sectors is rather small when compared to the total area of the African continent. The study was published in the journal Paleoceanography and is based on 44 study sites in and around Africa.
Besides temperature, Lüning and his group were also interested in medieval shifts in rainfall. An improved understanding of natural variability of rainfall is crucial, especially for the semi-arid and arid parts of Africa that heavily depend on seasonal rainfall for drinking water, agriculture and food production. Lüning describes the significance of this work:
“Our initial simplistic expectation was that we would find a uniform continent-wide medieval change in rainfall. However, this was not the case. As rainfall belts shift, some areas get drier and others wetter. It is important to understand these natural changes of rainfall patterns and their ultimate drivers. These are key calibration input data for climate models that still struggle to simulate regional rainfall correctly.”
The study identified three areas in Africa in which rainfall increased during the Medieval Climate Anomaly, namely Tunisia, western Sahel and the majority of southern Africa. At the same time, a reduction in precipitation occurred in the rest of Africa, comprising of Northwest and Northeast Africa, West Africa, Eastern Africa and the Winter Rainfall Zone of South Africa. The latter region includes Cape Town that currently suffers from a multi-year drought that has led to a serious shortage of drinking water. Similar droughts appear to have existed here during medieval times when the rain-bearing westerly winds were pushed so far south and away from land that they no longer intercepted the continent. The hydroclimate study has been published on 12th February in the journal Palaeo3 and is based on 99 sites in Africa.
In the absence of pre-industrial atmospheric CO2 variations, natural drivers have to be invoked to explain the observed medieval climate change. The most promising candidates are changes in solar activity as well as ocean cycles, which operate on times scales ranging from decades to millennia. The two new studies from Africa emphasize the great significance of natural climate variability on a global scale. A robust understanding of the natural ‘climatic heartbeat’ is essential. Ultimately, it will allow to better distinguishing between anthropogenic and natural contributions to modern climate change and will improve the predictive skill of climate models.
The two African climate reviews are based on a great number of published palaeoclimatic case studies which involved hundreds of scientists. Despite major progress in the field over the past 15 years, large parts of Africa are still white space when it comes to climate reconstructions of the past 1000 years. A dedicated structured research program is necessary to fill these important gaps. Climate policy depends on a robust foundation of such data. Compared to its large share of nearly one quarter of the world’s landmass, data from Africa and Arabia are significantly underrepresented in global temperature reconstructions of the past 2,000 years, an imbalance which needs to be swiftly and effectively addressed.
Papers:
Lüning, S., M. Gałka, F. Vahrenholt (2017): Warming and cooling: The Medieval Climate Anomaly in Africa and Arabia. Paleoceanography 32 (11): 1219-1235, doi: 10.1002/2017PA003237.
Lüning, S., M. Gałka, I. B. Danladi, T. A. Adagunodo, F. Vahrenholt (2018): Hydroclimate in Africa during the Medieval Climate Anomaly. Palaeogeogr., Palaeoclimatol., Palaeoecol., doi: 10.1016/j.palaeo.2018.01.025. The paper can be freely accessed until 11 April 2018 using this link: https://authors.elsevier.com/a/1Wbbe73Nzqmc1. Please also download the Data Supplement (link on left side of article page) which contains the detailed site proxy correlations.
About the Institute for Hydrography, Geoecology and Climate Sciences (IFHGK), and the medieval climate project:
The Institute was founded in 2017 by Dr. Hans-J. Dammschneider, who also serves as Chairman. The Institute conducts and supports research in the field of geosciences, with a focus on natural climatic drivers and their role in pre-industrial and modern climate change. The two African review papers form part of the Medieval Climate Anomaly Mapping Project which in its startup phase has been kindly supported by crowdfunding. No other funding has been received.
Global warming deniers like Michael Mann won’t be happy about this.
He’ll claim that the scientist’s brains were altered by AGW and thus, couldn’t see clearly while conducting their research.
Actually that’s not such an unreasonable alibi. We know, from self-interested assertions by Rajendra Pachauri, that AGW is capable of sophisticated acts of neural sabotage, like hacking Rajendra Pachauri’s motor system and turning him into the world’s most hands-on boss, all in order to raise that denihilistest of denihilistic questions:
Could Pachauri be said to be the Michael Mann of climate science, only instead of indecently interfering with data, he’s short-centred, screening-fallacied and regression-massaged young women?
And if they don’t see clearly, he’ll SLAPP them up the side of the head with his pet tree-ring.
@ Brad Keyes…now that is ironic indeed. Pachauri was actually a forerunner of change in the world, the great social change having to do with hands on.
Goldminor,
if you’re referring to Pachauri’s achievements as a feminist you’re preaching to the choir!
Prior to his tenure at TERI, 29-year-old women with cup size C and above (for the metric readers, that means Heaving or Voluptuous) were grievously underrepresented in the Indian climate research sector.
And?
Mann often calls sceptics “climate change deniers”.
And yet the long straight shaft of his hockey stick is the very essence of climate change denial.
Chris
There are only two things wrong with Michael Mann’s hockey stick: the shaft, and the blade.
Chris,
yep, that’s it. Humor shouldn’t need to be explained, but as explanations go, your comment’s spot on.
And he’s still giving everyone the shaft today.
For whatever reason, they still don’t field very good Winter Olympic teams.
Yet another reason why Mann’s hockey stick is erroneous.
they embarked on a journey through the scientific literature
So nothing new. Just organizing the data that was already there and presenting it. In other words the evidence that MWP was always there, the alarmists just ignored it because it didn’t fit the narrative.
The alarmists have denied the MWP and will still deny that it was warmer than present .
We know that the Vkings farmed in Greenland 1000 years ago and they dismiss the evidence that it was not global ,
More and more evidence is surfacing that the MWP was global and that has always been known but suppressed by the warmiists .
The fact that the MWP was global destroys the case that the recent warming is unprecedented but just wait for Nick Stokes etall to come up with all sorts of denial to defend the indefensible .
I always found the defense of the regional nature of the MWP implausible.
An extreme weather event causing extra warmth over a very small portion of the globe that lasted 300+ years that coincendently was over the only part of the globe where the people had good written records.
that coincendently was over the only part of the globe where the people had good written records.
Yup. They want us to ignore the evidence of all of Europe and in the next breath they want to cite a single tree in Siberia as representative of the entire globe.
Vikings?! So now you believe that Vikings actually existed once, is that it? So gullible. Geez.
I would like to see some scientific studies of various regions that actually DISPROVE that the MWP existed. So many climate scientists and none are willing to put in the work to determine the truth.
Jim Gorman – ” I would like to see some scientific studies of various regions that actually DISPROVE that the MWP existed. So many climate scientists and none are willing to put in the work to determine the truth.”
Mann did it in Mann Jones 2003 by applying near zero weighting the the highest resolution proxy in antarctica (dome C and law dome),
Gergis did it by ex post data selection (deletion) of several SH proxies with elevated MWP.
Climate audit dot org has numerous discussions regarding dome C, law dome, Gergis, pages 2k, and the quality of the SH reconstructions.
Joe: As I read these, they don’t DISPROVE the MWP as a global occurrence. They still only look at something less than a large regionand this is not what is needed. If it is wrong to say that the MWP exists because of only small regional studies, then it is likewise wrong to say the MWP didn’t exist because of only small regional studies.
Why aren’t climate scientists digging through historical records of temperature, grain production, river traffic, everything you can think of to provide information about what occurred during this time in as many areas as possible.
@jim gorman;
Whether the MWP was regional only over Eurasia, the Northern Hemisphere, or truly global isn’t really all that important. Even now, global warming isn’t global. It’s barely detectable in the Southern Hemisphere, and the continental US isn’t showing any. The true value of the MWP in the overall debate is to show that long before human activity could arguably have altered the climate, we have temperatures as high or higher than today. See also the Roman Warm Period and the Minoan Warm Period. Since we’ve seen warmer times before, now it’s on the warmunists to explain how now is different from then.
+1 Natural climate variation has to be proven over and over. Failing to match projections with models they went after history to try and force their outcome.
> In the absence of pre-industrial atmospheric CO2 variations, natural drivers have to be invoked to explain the observed medieval climate change.
No. The obverse. The presence of medieval climate change In the absence of pre-industrial atmospheric CO2 variations challenges the assumption that modern climate change is driven by industrial atmospheric CO2.
The ‘obverse’ means the opposite. I think you’re actually saying the same thing.
The MWP can’t be explained by human emissions of CO2. The cause must have been natural.
If the MWP was natually caused that means that the current warming can be explained by natural processes. The alarmists then have the problem of proving otherwise. It destroys their argument from ignorance:
The existence of the Medieval Warm Period provides that reason.
“If the MWP was natually caused that means that the current warming can be explained by natural processes. The alarmists then have the problem of proving otherwise. It destroys their argument from ignorance:”
That would also apply to the 1930’s, since the best record we have before the “Great Manipulation” has 1934 at 0.5C hotter than 1998, which makes 1934, 0.4C hotter than 2016, and makes 1934 the “Hottest Year Evah!”
We have been in a temperature downtrend since 1934.
Here’s the Hansen 1999 Global Proxy temperature chart. One of the last reasonably accurate temperature charts we have:
Or;
This finding raised doubt about the absence of pre-industrial atmospheric CO2 variation. Greenland ice core data must be adjusted to conform with established projections. Also, more effort is needed to find and conserve the gas-turbine powered Viking ships responsible for the detected warming.
I miss Hubert Lamb.
Just imagine what the “Climate Debate” might have been if the Climate Research Unit had remained faithful to its mandate.
Of course thanks to government expertise, we now cannot even guess if the weather trends warmer or cooler,than past cycles.
Policy Based Evidence manufacturing is a hell of a way to degrade the available information.
Or warmer or cooler from year to year.
It is the height of scientific illiteracy to suppose a 500 year MWP could be only a local phenomenon. Such a big patch of warm rising air would draw air in wind from outside it (weather created by the warm patch). When I saw that controversy, I knew we were dealing with people one couldn’t reason with.
A history student could easily debunk Mann’s erasure of the MWP. Because the tropics continually experience an infinite warming period, I suggest looking for it in the SH temperate zone. You can use me as a thesis advisor if you wish. Oh, and Dr Lining, “Hydrography, Geoecology and Climate Sciences” are basically synonyms. May I suggest “paleoclimatology”, it’s already in your dictionary.
Having first tried to get rid of the MWP, and then attempting to diminish it by saying it was localized, they will next try to say that the MWP “doesn’t matter”. LOL. Because that’s how warmunists roll.
Dr. Michael Mann will provide the missing data.
Piltdown Mann’s scam against Medievel global warming takes another hit…
“commieBob
February 24, 2018 at 3:17 pm
Despite major progress in the field over the past 15 years, large parts of Africa are still white space when it comes to climate reconstructions of the past 1000 years.
Dr. Michael Mann will provide the missing data.”
Bob, thanks.
Are we allowed to guess how many – or, perhaps, how few – trees the Great Mann will use to manufacture the aforementioned ‘data’?
I suppose having a share of a shadow of a Nobble Prize, as I do, apparently; being a serf of the EU when it won some Nobble for – I don’t know; how short postmen’s shorts can go whilst preserving their human rights? [or not] – should make me sympathetic to the Mann and his claims for a small share of a shadow of a smell of a slight sniff of a Nobble.
But – I don’t do sympathy.
Auto
Not even for the poor dolts who get to decide where this year’s politically-correct right-on Piece Nobble goes.
Surely there must be one or two treemometers in Africa suitable for making hockey sticks.
“The most promising candidates are changes in solar activity as well as ocean cycles, which operate on times scales ranging from decades to millennia. The two new studies from Africa emphasize the great significance of natural climate variability on a global scale.”
The above 2 sentences show that the authors do not really believe in AGW. I have noticed that more and more climate studies are producing hints like this that AGW doesnt exist. Of course the authors have to say that AGW is real or else their study wouldnt get published nor get past the peer review system.
“The study identified three areas in Africa in which rainfall increased during the Medieval Climate Anomaly”
Where was the peer review? “Anomaly”? The trend is known.. 8000 years of cyclical warming/cooling on top of a slow cooling trend. How can it be an anomaly if it is just a repeat of previous well known patterns?
http://notrickszone.com/2013/12/03/german-scientists-show-climate-driven-by-natural-cycles-global-temperature-to-drop-to-1870-levels-by-2100/#sthash.qkZBdDRW.dpbs
The term “anomaly” is meant as “phase”, i.e. wet vs. dry phase, warm vs. cold phase. Each of these phases are “anomalies”: Wet anomaly, dry anomaly, warm anomaly, cold anomaly. The cyclical repetition of these “anomalies” are the main pattern of natural climate variability. But I agree with you, sailboarder. These are well known patterns, therefore the term “anomaly” is a bit unfortunate.
The renaming of the MWP as an MCA was initiated by people who did not like a global medieval warming period because of their orthodox AGW worldview. The term anomaly is supposed to suggest that this should be a local and temporary exception. However, this term unmasks its inventors as fools because it automatically declares quite cold phases, such as the LIA, to be “normal”, which seems rather silly given the entire climate history in the Holocene.
Unfortunately, however, the term has become established in the meantime and must be used today by all authors who want to get through the peer review.
Sebastian
Thanks for dropping by and commenting.
This is I think the 3rd time your recent Africa/Arabia research has featured in a post here or at Judith Curry’s site. Which is good, since this work is very important. The MWP / MCE was real and global, denia1 of it isn’t really tenable any more.
“El geología estudia el pasado,para predecir el futuro”.
Los datos – naturales y científicos – estan ahi, el problema es que no saben que causa el Calentamiento Global y por eso “no saben que buscar y en donde buscar”.
INTERESANTE este articulo,pero tampoco saben porque se produce el Calentamiento Global.
Timbuctoo had the largest university in the world in the 14th century.
Today it is a dusty hovel.
Good to know that we have Climate Scientists getting paid to tell us important stuff about how the climate has changed in Africa because we’d never have been able to figure that out for ourselves.
It had several universities and several libraries. A not well known piece of Timbuktu history: French colonial gov in Mali ordered the destruction of Timbuctoo Library manuscripts – they saw such sophistication and intelligence to be a danger to that part of the empire. Uneducated farmers in the area raided the library and spirited the manuscripts away, burying them in various places in the desert. These people knew from oral history that the library was special and although they couldn’t read or write, they rescued a large part of the libraries “holdings”.
I have been unable to find the original article that I read but here is a snippet of the history:
“However, during the period of French colonial domination of Timbuktu (1894–1959), many manuscripts were seized and burned by the colonialists, and as a result, many families there still refuse access to researchers for fear of a new era of pillaging. Other manuscripts were lost due to adverse climatic conditions – for example, following droughts, many people buried their manuscripts and fled.”
http://understandingslavery.com/index.php-option=com_content&view=article&id=378&Itemid=233.html
This note has a different flavor than what I read a great many years ago. (modern fake news?)
I worked for the Geological Survey of Nigeria in the mid 1960s and on my statutory 12 day holiday in-country, I decided to take the steamer up the Niger to Timbuktu (three days upstream and one back) starting at Yelwa near the northwest corner of Nigeria. I was prevented by the outbreak of the Nigerian Civil War and always regretted missing out. The war was something else that would have been nice to miss out on, especially as I had my wife and two small children with me.
Once sail over took the camel caravan trade model Timbuktu was doomed, no matter what the “climate” did. Progress, ya know, the real thing? Not leftist stupidity? It marches on and leaves cities in bad locations to decline.
The history of the Middle East is rather well recorded. In the book Climate Change – Environment and Civilization in the Middle East, Arie S. Issar and Mattanyah Zohar lay out the evidence. There shouldn’t be any reason to doubt what the climate was doing.
+10
The big picture is that the MWP was a global period. This message
has to go into climate science from now on. No more studies to be
permitted that reckon MWP was local, regional or hemispherical.
…. And science should ask all those wrongdoers, who propagated a
regional character of this period, to admit
“mea culpa” and withdraw their mistaken papers.
“No more studies to be permitted”
That’s science! Luning and Vahrenholt have spoken. Case closed.
Is that all you can come up with Nick What is your take on it ,If the MWP was global as we have always known your case for GHG forcing is in tatters as it always has been Natural forcing caused the MWP and you cannot prove that the present warming is not a natural event with a very small push from C02 maybe
Nick
No – what wetklima said was no more casual pre-assumption of a local only MWP in publications. Or questioning the reality of the MWP/MCE. Not “no more research”.
There are many more details left to do. The case is closed after the foul studies are put to rest.
Its interesting how people respond to evidence.
If you have 40000 thermometers around the world, some people will argue that its not enough
They will disagree when you try to infer or interpolate across a few hundred kilometers.
Take those same people and give them one record they love — say CET and it becomes their ‘lone tree’ explaining all the world. weird.
Take those same people and give them a few hundred “proxies” in the LIA and they are certain it is global
Take those same people and give them a few dozen ‘proxies” in the MWP and they are certain it is global
Small is sometimes all we have:
https://goo.gl/images/GcH4WK
Let not perfection be the enemy of the good. Lack of surface stations means something. It just means less than is often argued. Each area of the globe is connected with the rest of the globe.
Mosher et all
We knew that you fellows would come out with this sort of thing .When I first took an interest 30 years ago in this so called global warming the people who had studied and understood climate said “Hang on a bit ,what about the MWP your theory is wrong prove that the warming is not natural as natural climate variability has caused the three warming events in the last 10000 years ”
So what did they do to make their theory work . They worked at disproving the MWP /They absolutely denied that it was global .They have been found out because they have denied history to prove that GHG has caused this recent warming .
Its a hard lesson Mosh and Nick and the other believers who hang on your coat tails .
Explain farming in Greenland 1000 years ago ,Was it because the Vikings were releasing CO2 ?
“Explain farming in Greenland 1000 years ago”
Yes, it would have had to have been warmer then than now. There’s no other explanation.
It all depends on what you are trying to measure.
40K thermometers is no where near enough to measure the temperature of the earth to a few hundredths of a degree.
Interpolating between stations is OK, but you must increase the error bars when you do so to account for the extra uncertainty you’ve added to your final numbers.
On the other hand, we have proxies from all over the world that indicated that the earth did warm.
It really is sad how once respected scientists have sold their souls to this new religion.
The CET exists as a historical record. The raw data can be seen in pure, unadulterated, unadjusted form.
Paleo climate and the multiple proxies employed to generate it is the product of much conjecture dispute and uncertainty.
You are comparing chalk with cheese.
Gosh, Mosh.
I think you deserve a Nobel prize for specious sophistry.
You are truly of the bandar log – if enough people say it, it must be true…
Let’s face it, the whole AGW meme is based on just one temperature record.
As a nine year old child, I really enjoyed Kipling’s “The Jungle Book”.
The bandar log was introduced in the second story of the book, “Ka’s HuntIng”
Having read the original story, I have never seen, nor wanted to see, the Disney adaptation.
Steve
It’s always baffled me why there was that sharp fall-off of numbers of temperature stations at the end of the cold war. With all the increased funding for climate science in the last couple of decades, could not this loss of stations have been made good? Why has funding gone elsewhere, not to something as essential as climate monitoring at ground level? Was the cold war really so much stronger a reason to have weather stations, than AGW?
Pretty funny coming from a guy that has defended a “study” involving a few tree rings, that if we were to believe it’s accuracy would have wiped out many previous studies involving many different proxies that support the MWP!
It’s not the thermometers, it the endless adjustments., like erasing the warm 1930s.
Steven, if you have 4000 thermometers around the world, why do you need to interpolate data?
Across a few hundred kilometers, too. How many hundred is “a few”? Every hundred kilometers is a degree of latitude. or a degree of longitude at the equator — more degrees of longitude at higher latitudes, too. Considering that 5° cells are used in generating the average global anomaly, that seems to be quite a large percentage of an entire cell that might be made up.
Because they don’t use the data from many thermometers. Huge areas of interiors of S. America, and Africa and Asia have no stations that the GISS uses to come up with their “global land surface temperatures”. They interpolate using 250 km grids smoothing for land only anomaly maps and 1,200 km grids for their ocean and land temperature anomalies. https://data.giss.nasa.gov/gistemp/
Steve Mosher,
Are you saying that we just don’t know about the past?
If we don’t know about the past, we have nothing in the past to compare with the present?
There is no “base line” before the industrial revolution to guess at how Man’s CO2 has caused “CAGW”?
The stakes are big in today’s Political Science Arena. Lots of bucks backing the desired excuse to control.
“Steve Mosher,
Are you saying that we just don’t know about the past?
If we don’t know about the past, we have nothing in the past to compare with the present?
There is no “base line” before the industrial revolution to guess at how Man’s CO2 has caused “CAGW”?
The stakes are big in today’s Political Science Arena. Lots of bucks backing the desired excuse to control.”
https://youtu.be/KfKFl7dp_J8?t=11s
I am not saying or suggesting anything of the sort.
I am making an observation about how some skeptics Assess evidence.
When you have 40000 THERMOMETERS sampling the earth, they say you need more.
When they want to assert that the LIA was colder than today, Then
A) they accept ANYTHING as evidence: paintings, diaries ( ‘it was colder”) and proxies.
B) they accept a dozens of proxies as being enough evidence for global claims.
When they want to assert that the MWP was warmer than today, the same applies.
A) They will accept any form of proxy data
B) They will accept handfuls of proxies as evidence enough to establish a global claim
The point is rather simple: IF you accept proxies as good evidence of temperature, then you are
in no good position to doubt thermometers, ESPECIALLY GIVEN that the proxies are calibrated
to the thermometer series. And further, if you accept SPARSE proxy sampling as good evidence
of global conditions, THEN, you are not on solid ground when you doubt the global nature
of the Thermometer record.
Now for Knowledge. We know nothing about the past. We have present records of the past. Using those records we can established, informed uncertain judgments about the past states required to produce
these ‘records’ of the past. We don’t know the past, we have uncertain judgments about the past.
Our uncertainty about the LIA is greater than our uncertainty about the present. The uncertainty comes
from the record keeping instrument ( a proxy, a document, a painting, words on a page) and from the spatial distribution of these records. Our uncertainty about the MWP is greater than our uncertainty about the LIA.
For the same reasons.
One’s judgments about all three : The present day record, LIA records, and MWP records, should
A) be consistent
B) refelect the uncertainties.
Lets talk about consistency: Lets say you complain about sparse data in Africa, and argue that 100 or so
thermometers in Africa is too few. Or suppose you make the same argument for the arctic. Suppose, you
find yourself on threads arguing against interpolation over long distances. To be consistent then I would expect the same person to make these arguments about the Proxies for the LIA which are MORE SCARCE
than thermometers.
There is a wonderful mail in climategate that many people glossed over: ( not me or Mcintyre). Tim Osborne
and Briffa are complaining about Mann. There complain is this: His PROXY series showed Less uncertainty than their Temperature series for the parts where they overlapped. That means Mann thought the knowledge from proxies was more certain than the knowledge from Thermometers.
In many cases I find skeptics makeing the same mistake as Mann. being more certain in the MWP than the data from today. being more certain in the LIA than in the temperature from today.
Me? I believe all three are uncertain, like all knowledge ( save math and logic) are uncertain and our job
is to characterize ALL the uncertainties fairly and completely and openly.
Here is a challnege to every skeptic. It’s one that started my process of understanding. I started at CLimateaudit many years ago. I came to believe that
1. the MWP was warmer than the LIA ( M>L)
2. the LIA was cooler than the Present (LM?
But BEFORE I tackled that I had to look at my own beliefs: HOW had I come to believe M>L?
and how had i come to believe that LL. explain what M-L =? explain why and how you know this
and to what level of certainty?
And if you believe LL?
what evidence? what would change your mind? what does this belief ( M>L) commit you to
my bet is no skeptic dares to do this as I have described
Wow’
Word press and symbols
1. the MWP was warmer than the LIA ( M ‘>’ L)
2. the LIA was cooler than the Present (L ‘L?
and how had I come to believe that L'” 0
and to what level of certainty?
And if you believe L “L) commit you to? What does your belief that L “<" P commit you to?
Medieval Warm Period and Little Ice
Apart from this 2016 Wattsupwiththat article
https://wattsupwiththat.com/2016/01/09/evidence-of-the-medieval-warm-period-in-australia-new-zealand-and-oceania/
There is much evidence for both medieval warm period and the little Ice Age in the South Pacific.
Much of it from archeological research as well as paleo climate data.
see
Abstract
[1] The occurrence of the Medieval Warm Period (MWP) in the Southern Hemisphere is uncertain because of the paucity of well-dated, high-resolution paleo-temperature records covering the past 1,000 years. We describe a new tree-ring reconstruction of Austral summer temperatures from the South Island of New Zealand, covering the past 1,100 years. This record is the longest yet produced for New Zealand and shows clear evidence for persistent above-average temperatures within the interval commonly assigned to the MWP. Comparisons with selected temperature proxies from the Northern and Southern Hemispheres confirm that the MWP was highly variable in time and space. Regardless, the New Zealand temperature reconstruction supports the global occurrence of the MWP.
http://onlinelibrary.wiley.com/doi/10.1029/2001GL014580/abstract
Abstract
Tree-ring widths from millennium-old Huon pine (Lagarostrobos franklinii) trees have been used to reconstruct warm season (November-April) temperatures back to AD 900 for Tasmania. The reconstruction indicates that the most recent 100 years of climate have been highly unusual, with the coldest and warmest 25-year periods occurring from 1890 to 1914 and 1965 to 1989, respectively. Although the most recent 25-year period is warmer than any comparable period over the past 1090 years, it is not yet statistically unprecedented. Some evidence for the Medieval Warm Period and the ‘Little Ice Age’ can be found in the reconstruction, especially during the twelfth and seventeenth centuries respectively. However, the latter is weakly expressed compared to many records from the northern hemisphere, suggesting that the southern oceans may have significantly moderated its effect on Tasmania.
http://journals.sagepub.com/doi/abs/10.1177/095968369200200302
Climate, Environment, and Society in the Pacific during the Last Millennium
By Patrick D. Nunn
https://books.google.co.nz/books?id=tzjomalYtNgC&pg=PA125&lpg=PA125&dq=medieval+warm+period+new+zealand+salinger&source=bl&ots=O-Lc1XMYl-&sig=Ea9Wrj9PJ5n9vJuHkKJXRPfHEfU&hl=en&sa=X&ved=0ahUKEwja766M8b_ZAhUTOrwKHV8QDikQ6AEIVDAG#v=onepage&q=medieval%20warm%20period%20new%20zealand%20salinger&f=false
and from the same author
ABSTRACT. Around a.d. 1300 the entire Pacific Basin (continental Pacific Rim and oceanic Pacific Islands) was affected by comparatively rapid cooling and sea-level fall, and possibly increased storminess, that caused massive and enduring changes to Pacific environments and societies. For most Pacific societies, adapted to the warmer, drier, and more stable climates of the preceding Medieval Climate Anomaly (a.d. 750–1250), the effects of this A.D. 1300 Event were profoundly disruptive, largely because of the reduction in food resources available in coastal zones attributable to the 70–80-centimeter sea-level fall.
http://onlinelibrary.wiley.com/doi/10.1111/j.1931-0846.2007.tb00277.x/full
Little Ice age
A University of Otago-led study has discovered that the “Little Ice Age” is linked to dramatic shifts in Southern Hemisphere wildlife.
The international research team used ancient DNA and carbon dating to assess archaeological remains from New Zealand and sub-Antarctic coastal sites, while also exploring prehistoric climate signatures from across the Southern Hemisphere.
http://www.otago.ac.nz/news/news/otago643506.html
“Little Ice Age (LIA) austral summer temperature anomalies were derived from palaeoequilibrium line altitudes at 22 cirque glacier sites across the Southern Alps of New Zealand.”
“Associated land-based temperature and precipitation anomalies suggest both colder- and wetter-than-normal conditions were a pervasive component of the base climate state across New Zealand during the LIA, as were colder-than-normal Tasman Sea surface temperatures.”
https://link.springer.com/article/10.1007/s00382-013-1876-8
Even in the Luening et al paper, the evidence for a MWP in Africa is not strong. Here are the first three of the graphs from the SI:
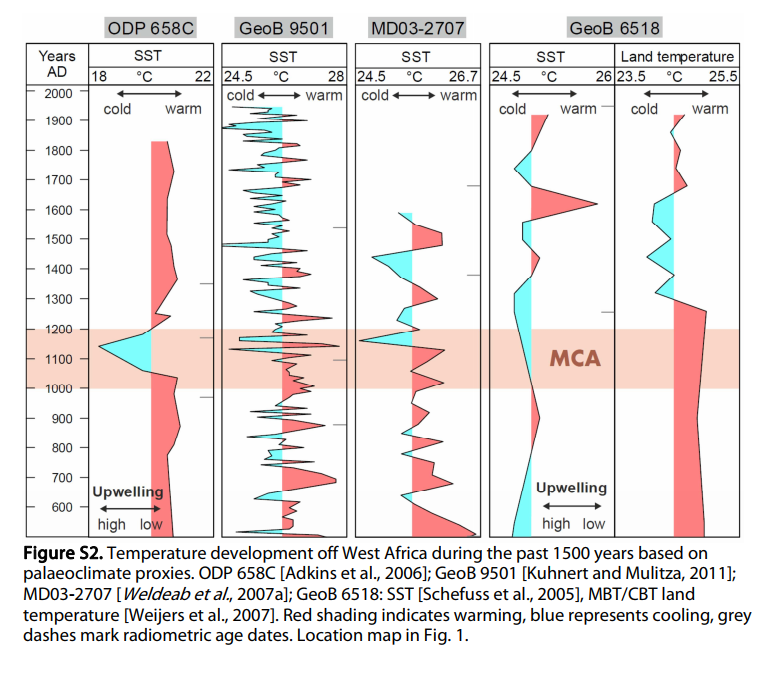

There is very little tendency to a warm peak in the MCA. There are even cold dips, and some that are just everywhere. But even when it is warm, it is often just part of a warm period extending well beyond the MCA (often into the LIA).
Nick, you really should read the paper first before commenting on it. The paper explicitly describes MCA cooling for the marine upwelling zones. The undifferentiated averaging has been a problem in the past which is overcome once the regional distribution of warming and cooling trends is understood.
There are 47 comments here. Mine is the only one that tries to evaluate just how much MCA warming there is. There is very little information in the text of the article. If you want to show the real evidence for MCA warming in Africa, you need to show some graphs like these which do convincingly show temperature peaks of something in the MCA period. Even looking at land-only data, I couldn’t see it.
The warming and cooling paper is paywalled, and it is one of those annoying paywalls where they won’t even tell you how much you will have to pay until you have registered. Fortunately the SI is free.
Nick
The second of Dr Luning’s papers is not paywalled, it’s here:
https://www.sciencedirect.com/science/article/pii/S0031018217310593
The MCE is not uniform and overwhelming. Neither for that matter is recent warming which is supposed to have begun in the 1800’s.
However warming and cooling of earth’s climate is not uniform anyway (data showing uniform warming is a very strong indicator of falsification by operatives with more political zeal than climate understanding). No – it’s about more or less heat transport from the equator to the poles. So the high latitudes show it most. This is basic. (The term “amplification” is clumsy and inept for this). The tropical region is where all climate change is always at its minimum. So any noticeable sign of the MCE and LIA in Africa is powerful evidence for the global extent of both. It would also be strong support for modern warming, if it could be found.
Correction:
However warming and cooling of earth’s climate is not uniform anyway.
(Corrected) MOD
Ptolemy2 is exactly right. The increased upwelling is a sure sign the ocean currents are the difference during this warm period just like they are today.
“The second of Dr Luning’s papers is not paywalled”
Yes, I have read it. It isn’t about temperature, but rainfall. And it also presents a mixed picture.
It seems the message is that the MWP was global. You just have to know where to look.
So the MWP was in Europe, North America, Asia, Africa, South America, and Australia. But we have no record if it being in Tahiti or Midway, thus it wasn’t global!
/sarc
And no evidence of it being in Peoria, Illinois or Kalamazoo, Michigan either. Until there is, I’m holding out that there is no MWP.
Their tactics are so transparent it’s hilarious. All my life I was told how warm the 1930s were. But now, poof. Gone. Put it on the Pay No Never Mind List.
As you have read in other posts I am investigating David Battisti for science fraud.He is probably in the top 3 of global warming PhDs in importance basedon the number of papers and his worldwide connections. I have posted on some of his other howlers and one them was this one that I didnt provide any references for.
Battisti seems to have given up on real data collecting out in the real world. He has entered his world of the general circulation model and seems to spend most of his time inside them. I guess it rains in there only when he commands it.
A study from 2015 where Battisti is one of the 3 authors. “Quantifying climate forcings and feedbacks over the last millennium in the CMIP5/PMIP3.”
In the paper they try to look back a 1000 years with cllmate modelling to try to understand the last millenium climates. In particular interest to them is the Little Ice Age. I will quote from the abstract.
“Analysis of the global energy budget during the
last millennium indicates that Little Ice Age (LIA; 1600–1850 CE) cooling is largely driven by volcanic forcing
(comprising an average of 65% of the total forcing among models), while contributions due to changes in land
use (13%), greenhouse gas concentrations (12%), and insolation (10%) are substantially lower. The combination
of these forcings directly contributes to 47% of the global cooling during the LIA, while the remainder
of the cooling arises from the sum of the climate feedbacks. The dominant positive feedback is the
water vapor feedback, which contributes 29% of the global cooling. Additional positive feedbacks include the
surface albedo feedback (which contributes 7% of the global cooling and arises owing to high-latitude sea ice
expansion and increased snow cover) and the lapse rate feedback (which contributes an additional 7% of the
global cooling and arises owing to greater cooling near the surface than aloft in the middle and high latitudes).”
So what they are saying is that the forcings contributed 47 % of the cooling while the feedbacks contributed the other 53% of the cooling. Of the 53% caused by feedbacks, they go on to outline in the abstract only 43% (29+7+7) of the feedbacks . The rest of the feedbacks are contained in the report. However I again quote
“The dominant positive feedback is the water vapor feedback, which contributes 29% of the global cooling.”
SO I ASK A VERY IMPORTANT QUESTION . How can a scientist in many climate reports say that the dominant feedback scenario for positive warming is water vapour which outnumbers CO2 500 to 1 on average in the atmosphere and which is the primary underpinning of AGW which is supposed to be a settled science AND on the other hand state that the dominant feedback for COOLING in the LIA was water vapour?. How can H2O be both a dominant feedback for cooling and warming in different eras?
Because, according to their theory, it is temperature dependent. Hence, if you have cooling it helps drop the temperature more and if you have warming it increases temperature more. Of course, this means climate should be very unstable unlike what happens in the real world.
Please provide a reference to authenticate what you say. This AGW theory is getting more convoluted all the time. Your explanation defies the laws of physics.
“SO I ASK A VERY IMPORTANT QUESTION”
I think you’ll have to learn a bit more science before you can set yourself up as an investigator. Feedback simply augments the response to both positive and negative inputs.
Alan, it’s really very important question. However, supporters of the greenhouse effect theory will not answer it. Indeed , IPCC list of greenhouse gases:
https://en.wikipedia.org/wiki/IPCC_list_of_greenhouse_gases
does not include water vapor in all, while NASA researchers consider it “as major player in climate change”:
https://www.sciencedaily.com/releases/2008/11/081117193013.htm
They can not agree among themselves, because behind the math models there is a lack of understanding of the physical nature of the problem.
Your first link starts out
“This is a list of LLGHG (long-lived greenhouse gases)”
Those do not include water vapr. Wv is a very important feedback, not a forcing.
Nick Stokes, the theory states that “greenhouse gases absorb infrared radiation emitted by the Earth’s surface” (IPCC, 2001, p.89). Water vapor absorbs IR-radiation as well as CO2, CH4, and so on. The physical essence of the process does not change from the names “feedback” or “radiative forcing”.
Off the topic but on a related issue:
I watched a French documentary which included the changed vegetation of Easter Island, which is explained by local inhabitants cutting down all the palm forests. My interest was piqued when they said the peak deforestation occurred in the 17th century. For all their multi-discipline expertise, not one comment was made about the possibility of natural climate change and the LIA extending to the southern hemisphere and wiping out the palms.
I guess they have to protect their ongoing grants.
“Geoecology” looks like a mis-spelling of gynaecology.
Do they not perceive the irony in that statement? All the previous climate change occurred naturally, by drivers we don’t yet fully understand. However, all the current ‘climate change’ is caused by atmospheric CO2, and none of those previous drivers had anything to do with it.
Yes it’s always amusing to note with what extreme reluctance and foot-dragging your average climate researcher allows discussion of any entity forcing climate change other than CO2. Getting teenagers to brush their teeth and go to bed is easy and painless by comparison.
Medieval climate has not changed. The past literature has not changed. What IS changing is that it is becoming less risky for academics to write the truth about the Medieval Warm Period and the Little Ice Age, which deceitful warmist scoundrels tried to erase from the climate record.
The following history on the subject of the MWP may be of interest – I wrote this article for E&E in 2005.
Willie Soon has managed to hang on despite many warmist attacks against him, but my friend and co-author Sallie Baliunas was driven from Harvard-Smithsonian, reportedly through the actions of John Holdren, Obama’s Chief Scientific Advisor.
I suggest that the conduct of people like Holdren and those who collaborated with them should be thoroughly investigated by the Trump administration.
Regards, Allan
DRIVE-BY SHOOTINGS IN KYOTOVILLE
The global warming debate heats up
by Allan M. R. MacRae
Energy and Environment, Feb 2005
https://wattsupwiththat.com/2011/11/28/the-team-trying-to-get-direct-action-on-soon-and-baliunas-at-harvard/#comment-811913
[excerpt]
In the April 2003 issue of Energy and Environment, Willie Soon and Sallie Baliunas of the Harvard-Smithsonian Center for Astrophysics and co-authors wrote a review of over 250 research papers that concluded that the Medieval Warm Period and Little Ice Age were true climatic anomalies with world-wide imprints – contradicting Mann’s hockey stick and undermining the basis of Kyoto. Soon et al were then attacked in EOS, the journal of the American Geophysical Union.
…
In both cases, the attacks were unprofessional – first, these critiques should have been launched in the journals that published the original papers, not in EOS. Also, the victims of these attacks were not given advanced notice, nor were they were given the opportunity to respond in the same issue. In both cases the victims had to wait months for their rebuttals to be published, while the specious attacks were circulated by the pro-Kyoto camp.
*****************
“The study identified three areas in Africa in which rainfall increased during the Medieval Climate Anomaly, namely Tunisia, western Sahel and the majority of southern Africa.”
Oh dear, the western Sahel becomes wetter during a warm AMO phase, which is most pronounced during a solar minimum, and southern Africa, has the opposite signal altogether.
This is what tax money is being wasted on?!?!? People are dying from common influenza and lack of clean water and THIS is what tax money is being wasted on. We are well and truly screwed.
Nick or Steven: Need some help from you. I’ve downloaded the GHCN Monthly files, but I can’t find a station metadata file. The README gives the format of the metadata, but darned if I can find a file with it. The station metadata file for the daily (*.dly) files uses a different ID format, though in some cases the WMO_ID number matches positions 4-8 of the GHCN Monthly ID. However, I can only match up 4483 out of the 7280 in the Monthly file.
Do you know where NOAA hides the station metadata file for the Monthly data?
Thanks!
James,
It sits within the same tar.gz file as the data, eq ghcnm.tavg.latest.qcu.tar.gz, here. It has the same stem as the data file, but a .inv suffix instead of .dat. Although they give a different file for each .dat (by date or adjusted status) they are always the same.
Thanks. However, there’s only 5795 station IDs in the .inv file. Is that the number of working stations now, and not 7280?
James,
There should be 7280. I post a station list here which is derived from the .inv file. Just press the “GHCN Stations” radio button at the top of the frame. Alternatively, I have posted a .inv file here
I loaded the file ghcnm.tmax.v3.3.0.20180224.qcu.dat into my Oracle database, ran the query “select count(distinct id) from ghcn_monthly_24_feb_2018;” and got 5795, which matches the number of IDs in the .inv file that came in the file you linked to above.
After further review, the ruling on the field is confirmed: there are only 4483 station ids in both the .dat and .inv files for a NOAA monthly data release.
SQL> select count(distinct id) from ghcn_monthly_24_feb_2018;

COUNT(DISTINCTID)

-----------------

             5795

SQL> select count(id) from ghcn_monthly_station_metadata t1 where not exists (select 1 from ghcn_monthly_24_feb_2018 t2 where t2.id = t1.id) order by t1.id;

 COUNT(ID)

----------

      1485

SQL> select 5795+1485 from dual;

 5795+1485

----------

      7280
Accidentally used the 4483 number from my attempt to match the WMO IDs to the substring from the Monthly IDs. That should be the 5795 number from the actual count of the IDs in the .dat and .inv files., and from my database count.
James,
The file I linked has 7280 lines, one station per line. You are counting distinct station ID’s. But are you including all 11 digits? There are many cases where stations have the same WMO but a different suffix.
Nick,
Mystery solved. I am looking at the TMAX file, not the TAVG file. The TAVG file has all 7280 stations, while the TMAX file only has 5795 stations. I’m more interested in the TMAX data since I believe it tells more about true warming than the TAVG data does.
Thanks again!
Your supposition that TMAX will tell the whole story is wrong.
The reason is simple:
Here is what I suggest you do:
Avoid Monthly data; Start with GHCN daily. raw. make your own monthly series.
As you can see understanding where all the data is requires some diligence and study. Years in fact.
Next, understand the science. Do we expect Global warming to influence Tmin or Tmax, both? why?
Next, research what has already been published
http://berkeleyearth.org/data/
You can see Tmin, Tmax, and Tavg.
Next, study the various methods for creating a spatial map of temperatures. Decide:
1. Use a published method
2. Design your own
If you choose 2, then you have to test your method. This is typically done with Synthetic data.
http://static.berkeleyearth.org/memos/robert-rohde-memo.pdf
This is how they get their lies to stick in the minds of the masses. Put speculation with facts and the association makes it look like a fact.
“Of particular interest are the past thousand years, which in Europe and North America have seen the:
#1 (data=fact): transition from a rather warm medieval period to
#2 (data=fact): major cooling of the Little Ice Age, followed by the
#3 (data=fact): temperature rebound of the Current Warm Period which was further intensified by
#4 (no data=Unproven speculation): human greenhouse gas emissions.
Well played Sebastian – what a star. Holding down the day job and getting these analyses out too.
weltklima,
we can’t forbid studies that “reckon” the wrong thing. That would make us no better than the alarmist enforcers.
And studies aren’t supposed to be retracted for the crime of being “erroneous.” Errare humanum est. Retraction is reserved for fraudulent papers and those that shouldn’t have survived peer review.
So unless your comment was a clever parody of a censorious Consensus Scientist, I object to it.
I found it interesting that the high point of development of the Angkor complex in Cambodia coincided with cathedral building in Europe. I conclude that agricultural surpluses during the warm periods in both regions provided the economic basis for these vast infrastructure developments.