These headlines have been recently making the rounds, such as this article at vox.com which describes “sudden scary ice melt in the Arctic, in three charts

One of the charts is below, along with some peer reviewed science that says otherwise.
h/t Andyg55
In December, NOAA released its latest annual Arctic Report Card, which analyzes the state of the frozen ocean at the top of our world. Overall, it’s not good.
“The Arctic is going through the most unprecedented transition in human history,” Jeremy Mathis, director of NOAA’s Arctic research program, said at a press conference. “This year’s observations confirm that the Arctic shows no signs of returning to the reliably frozen state it was in just a decade ago.”
The report, which you can read in full here, compiles trends that scientists have been seeing for years. The Arctic is warming at twice the rate of the rest of the world. And 2017 saw a new record low for the maximum sea ice extent (i.e., how much of the Arctic ocean freezes in the coldest depths of winter).

That huge drop-off at the end? That’s “the largest magnitude decline in sea ice, and the greatest sustained rate in sea ice decline in that 1,500-year record,” said Emily Osborne, the NOAA scientist who compiled the data for the chart.
Further to NOAA’s claim that Arctic sea ice extent is at its lowest for at least 1500 years, Kenneth Richard highlighted three studies last year that show the claim to be bunkum.
Re-posted from No Tricks Zone:
Earlier this year, Stein et al., 2017 published a reconstruction of Arctic sea ice variations throughout the Holocene that appeared to establish that there is more Arctic sea ice now than for nearly all of the last 10,000 years.
The study region, the Chukchi Sea, was deemed representative of most of the Arctic, as the authors asserted that “the increase in sea ice extent during the late Holocene seems to be a circum-Arctic phenomenon as PIP25-based sea ice records from the Fram Strait, Laptev Sea, East Siberian Sea and Chukchi Sea display a generally quite similar evolution, all coinciding with the decrease in solar radiation.”
The proxy data used to reconstruct Arctic-wide sea ice variations over the Holocene (PIP25) clearly show that modern sea ice extent has only modestly retreated relative to the heights reached during the Little Ice Age (the 17th and 18th centuries), and that the from about 1400 A.D.on through the rest of the 10,000-year-long Holocene, Arctic sea ice extent was much lower than it is today.

In 2014, Dr. Qinghua Ding and colleagues published a consequential paper in the journal Nature contending that much of the warming trend in the Arctic since 1979 can be traced to “unforced natural variability” rather than anthropogenic forcing.
“A substantial portion of recent warming in the northeastern Canada and Greenland sector of the Arctic arises from unforced natural variability.”
Then, a few months ago, Dr. Ding and co-authors published another Nature paper (Ding et al., 2017) that extended a natural attribution to trends in Arctic sea ice variability, concluding that as much as half of the decline in Arctic sea ice since 1979 is due to internal (natural) factors, further undermining the position that anthropogenic forcing dominates Arctic sea ice changes.
“Internal variability dominates the Arctic summer circulation trend and may be responsible for about 30–50% of the overall decline in September sea ice since 1979.”
Within the last month, two more papers have been published that further affirm the conclusion that modern Arctic sea ice extent has not changed significantly relative to even the last few centuries, nor has it fallen outside the range of natural variability.
1. Like Stein et al. (2017), Yamamoto et al., 2017 largely attribute Holocene sea ice concentration variations to solar forcing, and they assemble a reconstruction of sea ice trends for the region that once again clearly shows sea ice coverage is greater now than it has been for almost all of the Holocene.
“Millennial to multi-centennial variability in the quartz / feldspar ratio (the BG [Beaufort Gyre] circulation) is consistent with fluctuations in solar irradiance, suggesting that solar activity affected the BG [Beaufort Gyre] strength on these timescales. … The intensified BSI [Bering Strait in-flow] was associated with decrease in sea-ice concentrations and increase in marine production, as indicated by biomarker concentrations, suggesting a major influence of the BSI on sea-ice and biological conditions in the Chukchi Sea. Multi-century to millennial fluctuations, presumably controlled by solar activity, were also identified in a proxy-based BSI record characterized by the highest age resolution. … Proxy records consistent with solar forcing were reported from a number of paleoclimatic archives, such as Chinese stalagmites (Hu et al., 2008), Yukon lake sediments (Anderson et al., 2005), and ice cores (Fisher et al., 2008), as well as marine sediments in the northwestern Pacific (Sagawa et al., 2014) and the Chukchi Sea (Stein et al., 2017).”

2. In another new paper, Moffa-Sánchez and Hall, 2017 analyze subpolar temperature changes, glacier advances and declines, and sea ice variations in the Labrador Sea, North Atlantic, North Iceland, Alaska, Swedish Lapland, and Northwestern Europe region.
“Paleoceanographic reconstructions from a more northward location of the polar front on the North Iceland margin show centennial-scale cold events and marked increases in sea ice with similar timing to the cold events recorded in the eastern Labrador Sea. … The records from the northernmost sites show a linear cooling trend perhaps driven by the Neoglacial decrease in summer insolation in the northern high latitudes and its effects on Arctic sea ice production. “
“Periods of increased influence of polar waters in the eastern Labrador Sea, reduced LSW [Labrador Sea Water] formation and weaker subpolar gyre largely coincide with well-established cold periods recorded in glacier advances, tree-ring and pollen records in the circum-North Atlantic and northwest Europe [Dark Ages Cold Period, Little Ice Age]. … Conversely, periods of reduced influence of polar waters in the eastern Labrador Sea, stronger subpolar gyre and increase LSW [Labrador Sea Water] formation largely coincide with mild/warm periods in Europe namely the Roman Warm Period and the Medieval Climatic Anomaly.”
The authors find that while Arctic sea ice coverage was more advanced during the Little Ice Age, sea ice concentrations in the waters north of Iceland were far lower than now from about 500 years ago onward, especially during the centuries encompassing the Medieval Warm Period (or Medieval Climate Anomaly) and Roman Warm Period.

Read the full post here.
“unprecedented transition in human history”
Historical records for humanity only go back about 5000 years or so. For the arctic region, they barely go back 200 years.
Accurate data for the arctic only goes back about 30 years.
Not from what I understand. See, e.g., https://www.amazon.com/Two-Mile-Time-Machine-Abrupt-Climate/dp/0691102961
The book you link to does not contradict either the article or MarkW’s commentary.
The author of the book does stretch his personal opinions to accommodate alarmist claims; but, utterly fails to explain climate’s frequent instability.
MarkW,
No, no, no. It’s not just “unprecedented,” it’s the “most unprecedented.”
We must keep our hyperbole straight.
Exaggerated certainty is one of my biggest complaints about “climate science” and it goes both ways. Many graphs claim to know the average temperature of the earth to within 1/10th degree in 1850–a time when 99% of the earth wasn’t within 100 miles of a thermometer and most thermometers that existed were not designed, installed, or monitored to that level of precision.
As for the arctic, we have no 10,000-year-old core samples. Can they explain to a lay-idiot like me how they determine ice extent prior to the age of satellites, let alone prior to the age of exploration?
“As for the Arctic, we have no 10,000 -year-old core samples”…….
according to the British Antarctic Survey, the Greenland icecore samples go back 123,000 years.
OK, Greenland is a long way from Antarctica, and they cite Nature in a 2004 publication……but all the same it’s very close to the Arctic.
https://www.bas.ac.uk/data/our-data/publication/ice-cores-and-climate-change/
I think that their upside down hockey stick may be an artifact of our old friend – time resolution.
When actual measurement (200 years worth?) has been tacked onto proxy estimations, the older, proxy records are smoothed naturally by the resolution of the proxies. This removes the annual fluctuations which would have been apparent if the ancients had had the tools to record and hand down that data to us.
Comparing a multi-century resolution proxy results – in the same graph – to annual resolution measurements taken over the last 200 years, is gross scientific malpractice.
I think that first chart is a re-labeled one for Vox readership and staffing levels.
https://variety.com/2018/digital/news/vox-media-layoffs-50-employees-1202706362/
You know the way this works by now……if it’s extent….you know to look at volume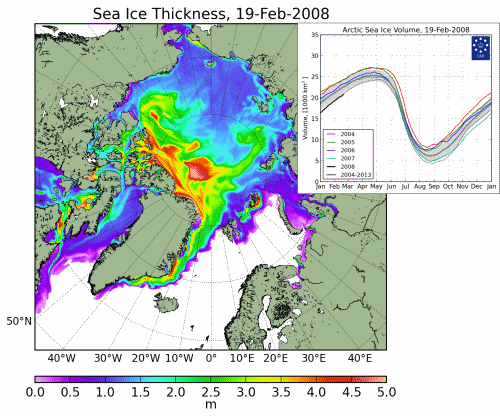
Dueling papers. I do wish there was a convention, though, on the orientation of dating on charts.
The Arctic Report Card claimed Greenland lost 285 Gt of ice, in contrast to the DMI noting Greenland gained ice. The report card is BS and political
Jim, careful with the comparisons. DMI shows ice mass gain/loss from snow accumulation/melt, but does not include ice sheet mass loss from glacial calving. That said, the GRACE net mass estimates are flawed for the same reason as for Antarctica—flawed but necessary GIA input (McIntyre had an excellent post on this for Antarctica a few years ago).
Careful? They are two completely different things, all too easily substituted.
GRACE, flawed but vital in debunking the zombie myth that Greenland’s icecap is not measurably shrinking at 200-300Gt pa, “The trend of total ice mass loss for the 14-year is 269 Gt/yr.” (http://www.arctic.noaa.gov/Report-Card/Report-Card-2016/ArtMID/5022/ArticleID/277/Greenland-Ice-Sheet) .
Notice how the troll just assumes that no matter how many problems are found with a data set, if it matches what he wants to believe, it must be the truth.
Have already commented on this chart twice elsewhere. It is not a NOAA chart. It is a reproduction of a chart in Kinnard et. al. 2011 in Nature. Paywalled, but the abstract shows the paper to be junk science. Kinnard’s high resolution paleo reconstruction of Arctic sea ice has NO sea ice paleo proxies, because those (Ocean bottom sediment cores) are at best very low resolution and at worst junk (spurious glacier signals). Kinnard’s reconstruction used circumpolar TERRESTRIAL paleoproxies for temperature (yup, Yamal tree rings, upsidedown northern Scandanavian lake varves) and then a modeled guestimate for ensuing sea ice. We know that is bogus because of the impact ocean currents have on underside melting, the impact of weather (2012 Arctic cyclone), and evidence for a quasiperiodic ~60-70 year Arctic ice cycle (essay Nirthwest Passage, Akasofu 2010, Wyatt and Curry 2014 (stadium wave paper)). The Kinnard abstracts only takeaway was “extreme uncertainty remains”. For sure.
Even more Gigo to append the satallite era ice observations to the bogus ‘guesstimate’—Mann’s Nature trick redux.
Good comment. I thought the chart was spurious, and straight out of the Mann school of paleoclimatology. It is nice when my presumptions are right.
Had same intuition. Which is why I spent a couple of hours yesterday afternoon running the thing to ground starting with the NOAA talking head quoted by Vox.
Also, even with the chart as given, if graphed a bit differently it would not look as bad. And the error bars in earlier times still overlap with the recent data.
If bogus, anyone taking bets that this paper will be referenced many times but a retraction will not see the light of day?
Um… which chart is “this chart”?
To be precise, the first chart in Anthony’s post with the blue dotted line showing a recent ‘unprecedented’ sea ice decline. Culled from Vox, who attributed it and the underlying data to NOAA’s Osborne. She had nothing to do with it. In her Arctic ice 2017 report, it is lowest subpart of her figure 3, itself reproduced from a different paper by Spitzhagen (IIRC). Look at that subpart of NOAA figure 3 on the left axis and you finally find the Kinnard attribution. Only after you look up the Kinnard 2011 paper and read the abstract do you realize how junky that figure put into isolation by Vox with Osborne’s comment actually is. Is as bad as MBH99 hockeystick, but for different reasons. The three counter papers in the post here found by Kenneth Richards at NoTricksZone I have not read, so have no opinions. KR has on past occasions found needing to be taken with a grain of salt. Not entirely trustworthy (stuff out of context, plus no critical paper review). KR MO is if it ‘debunks CAGW, he’s on it and citing it even if the paper is actually as bad as Kinnard 2011.
IMO not the proper way for skeptics to proceed.
If you’re going to level accusations like this, I would appreciate some specifics. I intentionally do not use words like “debunk” in my characterizations of what the papers we cite do. I try to avoid extremist/certain language like that. If you are referring to our willingness (at NTZ) to highlight or feature scientific papers that fall out of the mainstream of “accepted” science — such as those that defend a Nikolov and Zeller perspective on gravito-pressure planetary heating — then we are guilty as charged. I do not think that shutting off debate about a subject that is still quite unsettled (e.g., Why are Jupiter’s or Saturn’s atmospheres 200 K hotter than models of sunlight absorption would indicate they should be?) is what we should be doing as skeptics. But if you have a specific error in judgment or misrepresentation in mind, I would appreciate reading about it in a constructive way. I would prefer to correct and get better than have these unspecified criticisms festering.
The chart above says Kinnard, 2011 on the Y-axis
Not trust worthy, or garbage science based on agenda.. take your pick lad
That Kinnard plot is essentially the same as an earlier reconstruction by a Russian, whose name escapes me, but with a large section in the MWP offset up. Something about a recalibration from memory.
Also the current cold blasting Europe demonstrates that a classic negative NOA loops milder-than-normal air to the Pole even as more southerly areas experience winter extremes.
https://sunriseswansong.wordpress.com/2018/02/23/arctic-sea-ice-super-surge-alert-look-out-below-this-means-you-europe/
Unfortunately many of the navigational and operational records from the Skate and the Seadragon have disappeared, but there are plenty of good accounts that in 1962 they were moving about the Arctic as if ice was negligible, with multiple surfacing events well above 70N. I also suspect that Naval records from around 1974 would confirm relatively low levels of ice. But all that was cold-war era stuff, and the Russians were active too, so it all remained classified, on super-secret-double-probation, or something like that.
I do know a couple people who worked in Prudhoe 71 to 77 who claim that ice was never much of a navigational issue for all but two or three months, it’s just that the weather became too cold for the ships from November through April since all the hatches would freeze shut.
Yea most of the Navy submarine warfare stuff is still classified. One of the things that would be nice to see are their data on the thermal structure of the oceans. For years they set off explosions that were tracked by all their sounding equipment around the world. It helped decide where best to hide a missile submarine and where to look for the hunter-killers. Since we still “play” hide the submarine, now with China and Russia, I cannot imagine that anyone will declassify the research any time soon.
It’s just ridiculous — this ping pong game of claims.
If such a game can be played, then how can any layperson take it seriously?
When standards are the same, reference points consistent, definitions, methods, and procedures the same, and, using these, different people repeat the same results multiple times, then maybe I’ll start taking this more seriously. Until then, I’ll just keep shaking my head, because I’ve seen all this before.
That is part of how the science game is played. Though what we would hope is that all sides are doing good science, properly applying statistical models and being totally objective. Problem we face today that is no longer true. I began a skeptic when even for an old marine fisheries biologist some of the research was not making sense and certainly was not following good Scientific Method.
Sea ice extent is a nothingburger. It’s not a measure of ice. It’s a sum of all areas that have > 15% ice. Well not really. That’s the way the NSIDC describes sea ice extent. It’s really the sum of all areas that emit > 15% microwave energy (relative to open sea and ice that emits 100%). Each area (about 625 km^2) corresponds to one pixel on a passive microwave satellite photo. If the 8-bit grayscale value of that pixel is between 38 and 250 (15-100%) the entire 625 km^2 is considered to be 100% covered with ice, regardless of ice volume, quality and contiguousness. A 625 km^2 area could be covered with tens of thousands of small floes that add to 100 km^2 in area (16%), or it could be uniformly covered with thick slush, and both would be considered having 625 km^2 sea ice extent.
Wind, currents, waves can compress and stack ice floes and slush, which lowers sea ice extent, regardless of temperature. Water can actually be freezing while sea ice extent decreases due to mechanical rearrangement. Also newly formed thin ice is not picked up by the satellite microwave receiver because it can’t mask the underlying water’s microwave signal.
Sea ice area is a much more accurate number to determine the quantity of ice, but the NSIDC prefers to release the meaningless extent number to the public. Lying climate activists and reporters have a field day with it when it decreases, even though there are other drivers besides temperature.
btw, sea ice area is computed by totaling all of the sea ice concentrations, which are all of the 625 km^2 areas multiplied by their pixel value (> 38).
Sorry got sloppy. Concentration = area * pixel value/250
You criticize “meaningless extent number” but all graphs of concentration and volume from a variety of sources reveal a similar pattern. Can you post a link to any data regarding Arctic sea-ice you consider meaningful and not a “lie”?
Rather I’ll ask you, how can sea ice extent be meaningful data as a gauge of sea ice melting due to temperature (the way it’s used by climate scientists and their minions) when sea ice extent can increase and decrease based on non-temperature factors?
Do you mean “non-temperature factors” like compaction?
yep. concentration and compaction.
Or expansion. sea ice scattering.
And btw the graph above shows that sea ice volume is higher now than it was in 2008, but it’s claimed that sea ice extent “fell to its lowest level since human civilization began more than 12,000 years ago.”
The tiny, short-term fluctuations caused by compaction and expansion are significant but the far larger decadal trends can be ignored as meaningless?
Now you’re trying to shift the argument from sea ice extent to trends. If data are garbage to begin with, which sea ice extents are, trends don’t mean anything. But that’s the state of climate science – derive so much certainty from so much low quality data. Making meaningful trends from meaningless data. Junk science.
Do you have any constructive criticism? Or are you just a troll bomber?
We welcome real questions, just not copy/paste gigo.
You’re right, icisil. The whole sea-ice issue is a nothingburger.
Some clowns tried to sail to the North Pole the last summer. Changed their minds to going around it then to explore the effects of climate change.
They gave up around about where an early 70 s map showed that the ice extended to.
The recent sudden drop in sea ice seems to correlate directly with the failure of the NOAAF-17 satellite. As soon as that satellite went down, there was a stepwise change, not just in Arctic sea ice, but Antarctic sea ice as well.
According to the workers conducting algore-rithms of sea ice determination, there is currently less than 15% sea ice coverage in the Chukchi Sea along the coast of the peninsula — I find this hard to believe.
http://ocean.dmi.dk/arctic/icedrift_anim/plots/satcon.arc.d-00.png
If you were to walk out of your house in Alyatki, Russia right now, where the temperature is and has been around -10 – +10 degrees F for weeks, would there be no sea ice in the bay?
A simple ground truthing needs to be done to confirm or discredit some of these sea ice extent calculations. The devil is always in the details.
The NSIDC doesn’t release their official sea ice extent ‘product’ for about a month because the raw data have to undergo ‘quality control’ in which numerous assumptions and algorithmic/modeling corrections are made due to the measuring process’ many inherent errors. Snow, rain, high wind, surface texture, snow cover, temperature, satellite issues all affect microwave signal strength.
Climate activists like to use the newly released raw data before the final number is released when sea ice extent decreases.
“Snow, rain, high wind, surface texture, snow cover…” Does snow cover explain the positive temperature anomaly pockets throughout the Arctic that NOAA has all over its product?
http://polar.ncep.noaa.gov/sst/ophi/color_anomaly_NPS_ophi0.png
RWTurner, It is a temperature anomaly. It can be red and be 2.5 C higher than average but still be well below freezing.
But if you’ll notice, this particular product is showing an anomaly for SST only and used for sea ice extent. Anything not liquid water is white, although they obfuscate things by putting white in the legend as 0-0.25. The final product here is indicating large pockets of 0.25-0.5 degree warmer than average water, which doesn’t make sense at all for this, unless you’re telling me that the entire land and ice cap is all within 0.25+ of normal.
I’ve also never seen this product indicate any pockets that were colder than average, which you would certainly have at some point in time if this were merely the temperature anomaly of the ice itself.
In short, I’ve always noticed that this product that NOAA puts out is spurious, and it’s what they are using to determine sea ice extent.
I wonder if there’s a drop-off in rotten ice this season. ;->
Arctic Report Card? Oh dear, did we get a Participation Ribbon?
No, but it has been seen running with scissors, eating paste, and putting gum in girls’ hair.
Only yesterday The Sydney Morning Herald (an Australian left wing trash rag) published that the Arctic temperatures had risen suddenly by 25 degrees!!!!!! And, as expected, they stated that this was a sure sign of global warming.
This newspaper was probably Australia’s best, until it veered left about 30 years ago.
Are you referring to this?
Seems a bit odd.
Temperature for Cape Morris Jesup at the northern tip of Greenland.
https://www.dmi.dk/nyheder/arkiv/nyheder-2018/februar/plusgrader-i-nordgroenland/
Google Translate from DMI
Climatologist John Cappelen has examined the measurements.
“The reason for the exceptionally high temperature is probably the combination of relative hot air in the Arctic and the fohn around Cape Morris Jesup,” he says.
Føhn is a special wind that occurs in Greenland when the air blows up over the ice ice, so the moisture spills out. When the wind blows down from the ice again, the temperature rises sharply in the now dry air.
Plus degrees are unusual
DMI has measurements from Kap Morris Jesup back to 1980, and reveals that in February, absolute degrees are definitely not everyday at the world’s northernmost land-based measurement station. In fact, DMI has only twice previously measured similar high temperatures. The first time was in 2011. Second time last year; ie in 2017. Both times, føhn-winning may have contributed to the high temperatures.
The figures from 1980 onwards show that the average temperature at Kap Morris Jesup is cool minus 32.9 ° C in February. The figures also show that 2005 was the year with the hottest February – the whole minus 23.4 ° C could make it. The contradiction is in February 1985, which had average and record low minus 37.4 ° C on average.
Right now, the average for February is at Kap Morris Jesup at minus 21.2 ° C. In other words, it is hotter than the hitherto warmest February. However, that does not mean that the month ends with a record. Føhnen comes and goes and can quickly be below 30 ° C in the area.
And so what did that “left wing trash rag” say?:
“On Monday and Tuesday, the northernmost weather station in the world, Cape Morris Jesup at the northern tip of Greenland, experienced more than 24 hours of temperatures above freezing according to the Danish Meteorological Institute.”
Well?
and “This latest huge temperature spike in the Arctic is another striking indicator of its rapidly transforming climate.”. Well, no, it isn’t. It is just some fairly common fohn wind manifestation, you filthy left wing trash rag, that you cherrypicked and travestied.
Someone else who is taken in by Kenneth Richard’s concoctions. Let’s go through again:
“Earlier this year, Stein et al., 2017 published a reconstruction of Arctic sea ice variations throughout the Holocene”
No, they didn’t. A clue is that “PIP25” is not any unit of sea ice cover. The graph shown here has been doctored by Richard. It was extracted from this original:
It is not Arctic sea ice cover at all. Richard, apart from the other manipulations, added that heading. It is a plot of a single biomarker (PIP25) in a single sediment core in the Chukchi Sea, as the heading emphasises. The authors made no claim that it was a general measure of Arctic Sea Ice cover.
Then there is Yamamoto et al. You may notice something here. It is exactly the same data as the one above, with the same odd units. It is not a new result at all, but is at least labelled (by Richard) this time as Chukchi Sea. Again it has been derived by doctoring this original. Yamamoto et al make clear in that graph tableau (see caption) that it is a plot of Stein’s core, not a new result.
And yet again, a graph from Moffa-Sanchez, again in units of “PIP25”. Again just results of a biomarker from a single core, this time north of Iceland. Again a synthesized KR graph with annotations and headings added ( and a N Iceland label removed) from the original here.
It is not Arctic sea ice cover at all.
The Chukchi Sea is in the Arctic. The heading added for the Stein graph says “Holocene Sea-Ice Cover Variations”. There was no implication that the graph represents the entirety of the Arctic. It is not possible to map the entirety of the Arctic for the pre-satellite era. All reconstructions are necessarily must be regional.
All that was added was the heading and the well-known contextual timings of the Medieval Warm Period and Little Ice Age. In what way is this a misrepresentation?
Modern sea ice has undergone an oscillation, with similarly low values as today during the 1930s and 1940s…
http://notrickszone.com/wp-content/uploads/2017/10/Arctic-Sea-Ice-Alekseev-2016-as-shown-in-Connolly-2017.jpg
“The heading added for the Stein graph says “Holocene Sea-Ice Cover Variations”. There was no implication that the graph represents the entirety of the Arctic.”
There is no indication that it was anything other than entirety. Certainly no-one would take it from that graph that it was a single core. And to settle the matter, the associated KR text, quoted in this article, says (my bold):
“The proxy data used to reconstruct Arctic-wide sea ice variations over the Holocene (PIP25) clearly show that modern sea ice extent has only modestly retreated relative to the heights reached during the Little Ice Age (the 17th and 18th centuries), and that the from about 1400 A.D.on through the rest of the 10,000-year-long Holocene, Arctic sea ice extent was much lower than it is today.”
Nick, Stein et al. (2017) paper itself says that the Holocene sea ice changes in the Chukchi Sea represents a “circum-Arctic” phenomenon, as the changes there coincides with the changes in several other regions of the Arctic:
“The increase in sea ice extent during the late Holocene seems to be a circum-Arctic phenomenon as PIP25-based sea ice records from the Fram Strait, Laptev Sea, East Siberian Sea and Chukchi Sea display a generally quite similar evolution, all coinciding with the decrease in solar radiation.”
So do you disagree with Stein et al. (2017) that the PIP25 sea ice records are representative of the “circum-Arctic”? That’s what they wrote.
Again, here is the reconstruction, taken straight from the paper. The “Holocene Sea-Ice Cover Changes” was added. As was the “20th Century”, “Little Ice Age”, and “Medieval Warm Period”, which are quite synchronized with their timing in the Arctic region. What is misrepresented here?
http://notrickszone.com/wp-content/uploads/2018/02/Stein-2017-Holocene-Sea-Ice-Cover.jpg
“What is misrepresented here?”
The omission of the heading “ARA2B-1A”, which was then turned in to “Holocene sea ice variation”. But if you want to quote other bits of Stein et al, this seems most relevant (my bold):
“In the last four decades, the extent and thickness of Arctic seaice has decreased dramatically (e.g. Johannessen et al., 2004;Serreze et al., 2007; Stroeve et al., 2007; Cavalieri andParkinson, 2012; Laxon et al., 2013; Lindsay and Schweiger,2015), and this decrease seems to be by far more rapid than predicted by any climate model (Stroeve et al., 2007, 2012).The Chukchi Sea has become completely ice-free during the summer of the last few years (Figs 2 and 3).”
Nick, the average reader is not going to know what ARA2B-1A is. Nor will the uninitiated reader take a look at a graph that is sideways, far removed from a triangle-riddled y-axis with single digits on it…and come away knowing exactly what it is they are looking at. The changes to the graph were all about user-friendliness. The numbers and letters at the bottom were turned vertically correct for easy-to-read purposes. The “20th century” was added to the period that corresponds to the 20th century. Same for the LIA and MWP. There is no graphical misrepresentation here. Your accusations are false.
The Arctic climate is no warmer today than it was in the 1920s to 1940s. It’s undergone an oscillation, with cooling from the 1940s to 1980s before warming again in the 1990s to present. In other words, the Arctic isn’t cooperating with the trends in anthropogenic CO2 emissions.
Hanhijarvi et al., 2013
“According to Chylek et al. (2009), the Arctic warming from 1900 to 1940 proceeded at a significantly faster rate than the warming during the more recent decades and was highly correlated with the Atlantic Multi-decadal Oscillation (AMO) suggesting that the Arctic temperature variability is highly linked to the Atlantic Ocean thermohaline circulation at various temporal scales.”
http://notrickszone.com/wp-content/uploads/2017/06/Holocene-Cooling-Arctic-Hanhijarvi-2013.jpg
Kenneth Richard says, “It is not possible to map the entirety of the Arctic for the pre-satellite era. All reconstructions are necessarily must be regional.”
I mean, you could take a look at Kinnard et al., 2011 for an example of a whole-Arctic reconstruction. Isn’t that the paper you’re trying to rebut in the first place?
That first chart looks like my asthma peak flow readings over the last few months.Some drop offs depending on the weather!
Why is it that EVERYTHING the Left says or believes has to be propped up by lies, deceit and false statistics? The truth, on the other hand, doesn’t need propping up.
There is no truth in Kenneth Richard’s misrepresentations.
Nick,
What do you think about Kinnard, 2011?
billw, “Kinnard 2011”
Well, they say:
” Here we use a network of high-resolution terrestrial proxies from the circum-Arctic region to reconstruct past extents of summer sea ice, and show that — although extensive uncertainties remain, especially before the sixteenth century -…”
The weakness is the need to infer from terrestrial data. But at least it is a real recon, not a one-proxy affair (they use 4 ocean sediment cores, which is far too few, but better than 1). I think “extensive uncertainties remain”.
“There is no truth in Kenneth Richard’s misrepresentations.”, says the man who find just nothing wrong with “The Sydney Morning Herald” claims.
Double standard again, Nick? What will be your excuse, this time?
“find just nothing wrong”
OK, what is wrong with the SMH claims? With quotes, please.
To add to the list, here is another sea ice reconstruction for 2018 that shows a similar pattern as the ones for the Chukchi Sea (Arctic).
Perner et al., 2018
http://www.sciencedirect.com/science/article/pii/S0277379117305930
http://notrickszone.com/wp-content/uploads/2018/01/Holocene-Arctic-Sea-Ice-Iceland-North-Perner-2018.jpg
Typically, in response to pointing out misrepresentation, the response is that more are just piled on. This again is “extent” given in sed/μgm of IPI25. And it is from a paper titled “Heat export from the tropics drives mid to late Holocene palaeoceanographic changes offshore southern Australia” It’s about the Leeuwin current off WA. They are not describing results about Arctic ice. The plot has been doctored from this original: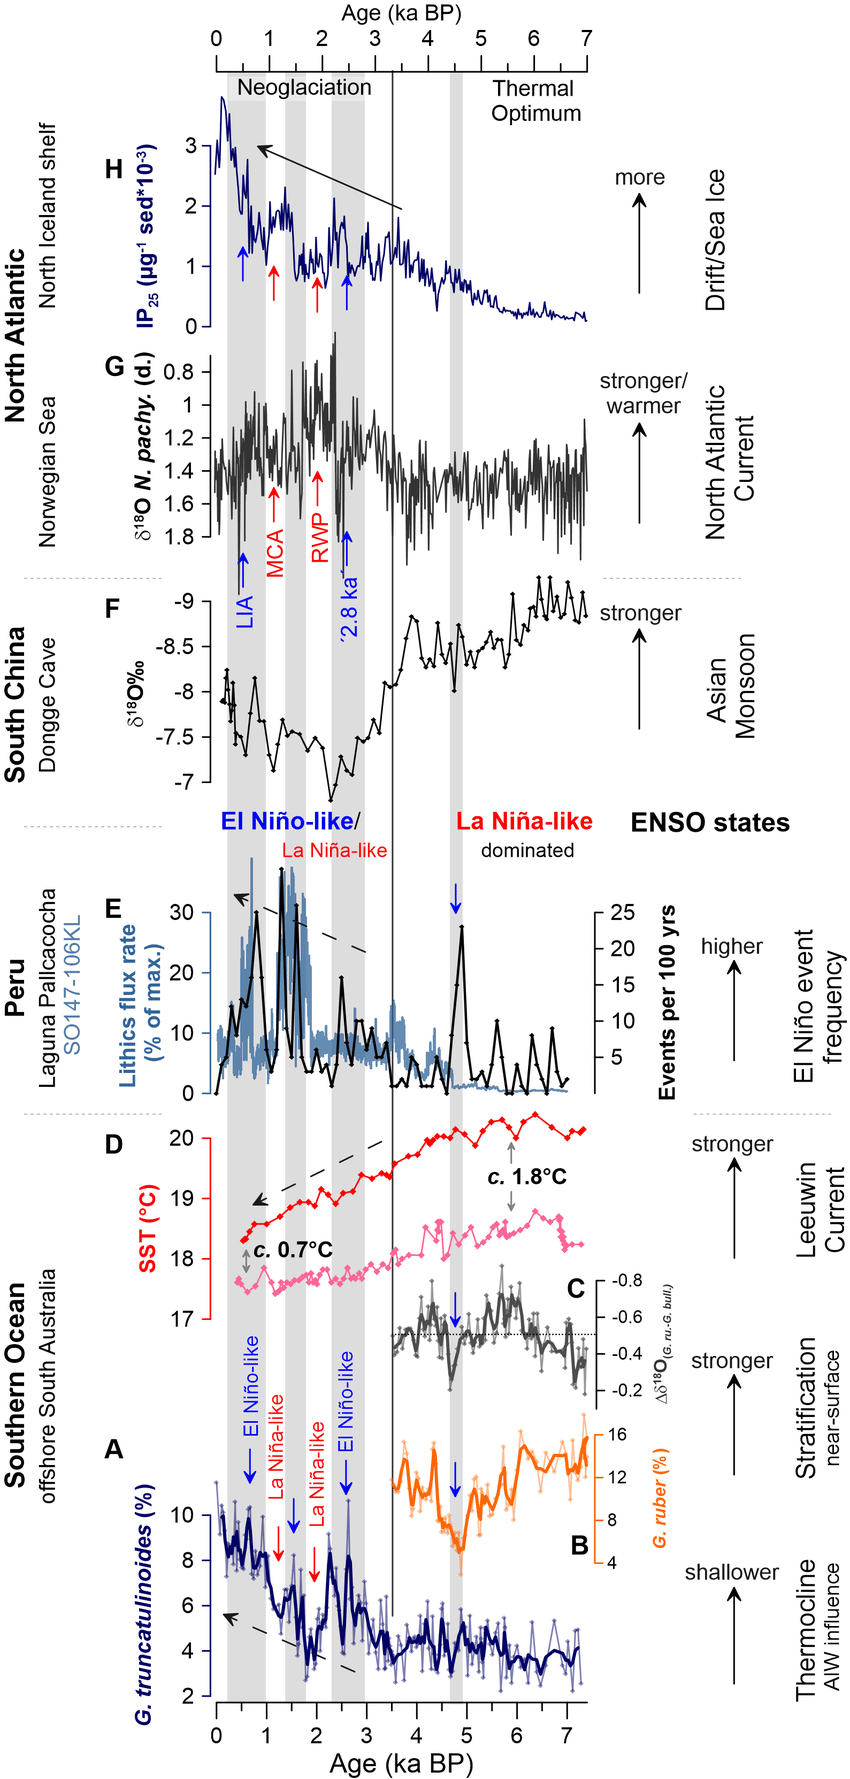
It seems to be just another plotting of the RAPiD-35-COM core analysis N of Iceland, which was shown in the “Moffa-Sanchez” plot quoted in the article. And typically, this graph of a single core biomarker was described thus:
“Graph from Perner et al. (2018) that shows modern-day Arctic sea ice (furthest left navy trend line) is still only slightly lower than during the Little Ice Age (LIA), and much more extensive (more ice) than during the Medieval Climate Anomaly (MCA), Roman Warm Period (RWP), and nearly all of the last 7,000 years.”
What misrepresentation are you possibly talking about with this Perner et al. (2018) graph?
I assume you notice the upwards-pointing arrow that says “More Drift/Sea Ice”, as well as the red and blue arrows denoting the MWP, LIA, RWP, etc. Right? The end of the record (present) is only slightly lower in drift/sea ice during the LIA, and it’s much higher than it was during the Medieval Warm Period. This is consistent with the Koch index, as shown in Lassen and Thejll, 2005.
http://notrickszone.com/wp-content/uploads/2017/03/Arctic-Sea-Ice-Iceland-Koch-Since-1200-768×411.jpg
“We also look at the approximately 80 year variability of the Koch [sea ice] index and compare it to the similar periodicity found in the solar cycle length, which is a measure of solar activity. A close correlation (R=0.67) of high significance (0.5 % probability of a chance occurrence) is found between the two patterns, suggesting a link from solar activity to the Arctic Ocean climate</b.."
"The considerations of the impact of natural sources of variability on Arctic ice extent are of relevance for concerns that the current withdrawal of ice may entirely be due to human activity. Apparently, a considerable fraction of the current withdrawal could be a natural occurrence.”
“What misrepresentation are you possibly talking about with this Perner et al. (2018) graph?”
You’ve added a heading “Arctic Sea Ice” which isn’t theirs, nor justified. And you’ve added a sub-head “7000 years ago to present”, when they use a specific unit ka BP. BP means before 1950, which is highly relevant here.
The North Icelandic Shelf is in the Arctic; hence the title “Arctic sea ice”. The title “North Icelandic Shelf” is also clearly visible in the graph. Did you fail to notice this?
It is well established that during the 1925-1955 period, the North Icelandic shelf’s sea ice concentration was as low or lower than today, and that the 1400s and Medieval Warm Period had much less ice than exists today.
So even if the Before Present = 1950 rather than Present (today), the Perner graph once again shows that there is nothing unusual about the current concentration of sea ice relative to the Holocene. The graphs of the Beaufort Sea (Arctic) (through 2004) and SW Greenland (through 2010) sea ice extent also illustrate this. In fact, the graph for SW Greenland sea ice shows that the volume of sea ice since the 1950s is higher than it was during some portions of the Little Ice Age (due to the extremely high extent during the 1960s.
There is nothing unusual about modern sea ice extent.
Ran et al., 2010
http://notrickszone.com/wp-content/uploads/2016/11/Arctic-Sea-Ice-Iceland-1903-2006-Ran-10.jpg
H.H. Lamb (1982) “Climate, History, and the Modern World” (book)
http://notrickszone.com/wp-content/uploads/2016/11/Arctic-Sea-Ice-Iceland-Since-MWP-1975-copy.jpg
The Beaufort Sea (Arctic) was up to 3 degrees C warmer during the late 1800s to 1930s, and sea ice cover values were 1.1 months lower than today during that time.
Durantou et al., 2012
https://www.biogeosciences.net/9/5391/2012/bg-9-5391-2012.pdf
http://notrickszone.com/wp-content/uploads/2018/02/Holocene-Cooling-Beaufort-Sea-Arctic-Ocean-Durantou-2012.jpg
A couple of thousand years ago people from Siberia moved east. Alarmists and their fellow travelers would have us believe that given the choice to keep moving south toward open water and better hunting they CHOSE to live in an ice-bound arctic. Hogwash.
Any migrant people are going to keep migrating until they reach an hospitable area. The arctic was so hospitable that they went to war with, and killed off, the people who were already there. That means that the area was so rich and accommodating that it was worth killing for. Over time the area got colder of course, and the people who called it home adapted and became permanent residents. We have evidence that those settlers cooked their food over fires, something that became impossible once the arctic was icy year-round. And, lets’ consider the human propensity to call a place home, regardless of the local conditions, when no one is trying to invade.
All in all, the idea that the arctic had always been frozen solid until recently simple doesn’t jibe either with human behaviour or the archeological record.
Yet another reconstruction shows sea ice near SW Greenland is no lower during the 20th century than during the Little Ice Age.
Kryk et al., 2017
https://www.researchgate.net/publication/320165732_Holocene_oceanographic_variation_in_the_Godthabsford_region_SW_Greenland_using_diatom_proxy
http://notrickszone.com/wp-content/uploads/2017/06/Holocene-Cooling-Greenland-SW-Kryk-2017.jpg
Werner et al., 2017
“[S]tatistical testing could not provide conclusive support of the contemporary warming to supersede the peak of the MCA [Medieval Climate Anomaly] in terms of the pan-Arctic mean summer temperatures.”
http://notrickszone.com/wp-content/uploads/2017/04/Holocene-Cooling-Arctic-Werner-2017.jpg
Everything is something else. Whatever I say this says you will say that it says the opposite. How dare you. How dare I. Yes it is. No it’s not.
I see hockey sticks
Trying to understand a complex phenomenon by just looking at a couple of graphs is a dangerous business rife with errors. I agree with Nick Stokes, that the interpretation of some of these graphs is anything but straightforward. When does that core really end? Was the top of the core lost or destroyed when recovering the core? Is the core representative?
What we know is that Arctic sea ice has lost 30% of its extent between 1995 and 2007. If that drop is not visible in the graph, you should get suspicious that the period is not included. And whatever way you slice it, losing 30% of Arctic sea ice extent in just a decade ain’t normal climate cyclical business. I read and write extensively on climate cycles, and it is not. I also have written here at WUWT about Arctic sea ice not melting since 2007 and looking stable until ~ 2035. Skeptics should start accepting that the cryosphere is being affected by the increase in CO₂, because that is what the data indicates and that doesn’t go against natural variability also having an important role. We should be based on evidence and leave dogma to model believers.
I don’t believe science has debunked the “Arctic sea ice at its lowest in 1500 year” meme. I don’t believe we can know with confidence how current sea-ice extent compares with MWP sea-ice extent. But what we do know for sure is that the cryosphere retreat for the past few decades is unusual and non-cyclical. Glaciers, ice shelves, and small permanent ice-patches are very clear in that respect. It would not be surprising that it is the same case for Arctic sea ice.
If CO2 would affect anything we would see it first in the Antarctica. That is where the water vapour is minimal and temperatures are close to CO2 wavelength.
It does not show up:
https://climateaudit.org/2017/11/20/new-antarctic-temperature-reconstruction/
So, no, I do not think CO2 has any measurable result.
The arctic sea warming is real, however I trust this is rather cyclical and in my opinion less arctic sea ice is cooling the oceans – what the ARGO buoys measured without adjustments.
However next 10-20 years should clarify this, there is no Heat-magedon awaiting from too much CO2 which has rather beneficial results at current concentration, so I make fun of alarmists for the time being.
Lars, someone will come up w/something — say, the CO2 over Antarctica is “rotten”, so is ineffective. /sarc
I agree that there is no warming in Antarctica, but disagree that it demonstrates CO₂ has no effect. Antarctica is weird. It sits 4 km high at a place were the tropopause is lowest. It is almost placed in the stratosphere and shows a climate unlike any other. There are hypotheses that the CO₂ effect works in reverse in Antarctica, cooling instead of warming. I don’t know. In any case the Antarctica argument cannot be considered decisive.
Lars P. February 23, 2018 at 6:49 am
If CO2 would affect anything we would see it first in the Antarctica. That is where the water vapour is minimal and temperatures are close to CO2 wavelength.
There is no such thing as “temperatures are close to CO2 wavelength”, the 15 micron band is close to the maximum in the surface emission, there’s just less of it at the antarctic temperatures.
When the temperature at the surface is lower then the temperature at the emission height of the 15 micron band of CO2 (~220 K) then CO2 enhances radiation. This situation can occur in Antarctica and Siberia.
At this site some spectra can be simulated:
http://climatemodels.uchicago.edu/modtran/
Javier: Maybe I’m missing something. You seem to say that we can’t know ice extent in the past because not enough data (I’m paraphrasing), so we can’t know the MWP ice was less than current. But we have enough data to conclude that losing 30% in a decade “ain’t normal climate cyclical business”? If data is insufficient to draw the conclusions Richards shows, then how is it sufficient for your conclusion? How do you know the arctic didn’t lose 30% ice extent from, say, 1924-35, or for that matter, any ten year period prior to satellite era? Maybe your work doesn’t debunk the proposition that ice extent is lower than last 1500 years, but it does debunk that hockey stick, doesn’t it?
Paul,
First, because there is only 3 thirds, and losing one in one decade within a multi-centennial warming period is excessive.
Second, because we know glaciers and they are going through the same process, an unusual loss within the first decade of the 21st century, and we have very good glacier records since 1850.
In my humble opinion the cryosphere does show some degree of hockey stick that I can’t find anywhere else within the climate system, and I’m trying to find an explanation for that.
Javier
“Second, because we know glaciers and they are going through the same process, an unusual loss within the first decade of the 21st century, and we have very good glacier records since 1850.”
The year 1850 is about the time the LIA ended and the earth has been warming in fits and starts since then! So how do we there was “an unusual loss within the first decade of the 21st century”?
“Skeptics should start accepting that the cryosphere is being affected by the increase in CO₂, because that is what the data indicates…”
No it doesn’t. You’re trying to imply that whatever change there has been is due to increased temperature, but sea ice extent is affected by things other than temperature. Wind patterns could have changed at critical times during the period you mentioned. Colder temperatures freezing together compressed and stacked ice could account for a long term decrease in sea ice extent (because it can’t be subsequently expanded by winds as easily). Sea ice extent is garbage data as indicated by the fact that sea ice volume in Jan 2018 was higher than in Jan 2008, but sea ice extent was lower in Jan 2018 than in Jan 2008.
I’m not trying to imply what you say I’m trying to imply. I only say what I say.
There is no evidence that temperature changes (both land and ocean surface) are unusual or non-cyclical, and their increase is linear and thus not responding much to CO₂ forcing increase that shows acceleration. It is only the cryosphere that shows unusual, non-cyclical changes, which leads me to believe that the effect is specifically taking place above the ice.
Precipitation has a huge effect over the cryosphere, but usually changes in precipitation are local or regional. The effect that we are observing is global. The glacier decline is global in nature. Not all the glaciers, but glaciers from most places, and more glaciers we have ever recorded are receding.
Javier,
“Skeptics should start accepting that the cryosphere is being affected by the increase in CO₂, because that is what the data indicates and that doesn’t go against natural variability also having an important role. “
NO! You assertion is nonsense. Utter hogwash. The data ONLY indicates there has been a change since the LIA. Good there should be.
Show the observed evidence of CO2 warming this world’s lower atmosphere. It is ALL natural variability and nothing, but nothing to do with the political driven computer modeled ‘evidence’ hogwash about CO2 levels.
Historically CO2 has never, ever caused global warming. It still does not now.
How many °C has this planet’s temperature changed in the last million years? Now show were CO2 controlled it. Never is the answer. QED CO2 driving global temperatures is a nonsense.
End of argument.
Ice?
It all fell down the spiral.
The warmists choose proxies to suit their agenda.
The skeptics choose proxies to suit their agenda.
So? What am I missing?
The real experts we should be turning to here are the likes of Shakun and Marcott, who killed the true Holocene proxy record of the isotopes in ice core and sediment, ironing them flat with an inflated host of bogus bio proxies.
This shameless scam is being perpetuated by the Pages2k consortium (conspiracy).
While climate mandarins deny outsiders access to the really telling Antarctic Law Dome (e.g. C) core data, with the end goal of its being forgotten and destroyed (see Climate Audit).
The data you want isn’t here?
https://www.ncdc.noaa.gov/paleo-search/reports/location?dataTypeId=7&search=true
roflmao.
Poor Nick, a re-orientation and labelling for clarity makes it a mis-representation ????
Sorry Nick.. BUT NO IT DOESN’T
I’m not really sure if the point of this post was to debunk the NOAA statement, but I haven’t seen anything that even contradicts it – did I miss something? These other articles are talking about actual extent, while NOAA refers to, “the largest magnitude decline in sea ice, and the greatest sustained rate in sea ice decline in that 1,500-year record.” That’s the direct quote. Just below it, Anthony says, “Further to NOAA’s claim that Arctic sea ice extent is at its lowest for at least 1500 years.” Abnormal magnitude and rate of decline are strong support for unnatural forcing, and in that sense mean more than whether the ice was thinner or thicker 600 years ago. It’s possible these papers do debunk a NOAA statement, but I couldn’t find it by following the link.
The graph by Moffa-Sánchez and Hall, 2017 supports the NOAA statement, doesn’t it?
The Yamamoto paper is interesting in its discussion of the currents and natural variation that might affect sea ice. “). This pattern contrasts with reconstructions from
other Arctic regions that show lower sea-ice concentrations
in the early Holocene (de Vernal et al., 2013). This discrepancy
suggests that the intensified BG circulation exported
more ice from the Beaufort Sea to the northeastern Chukchi
Sea margin. Furthermore, the heat transport from the North
Pacific to the Arctic Ocean by the BSI was likely weaker
in the early Holocene than at later times as indicated by the
C/ I and CK / I ratios of cores 06JPC and 01A-GC (Fig. 8).
We infer that this combination of stronger BG circulation
and weaker BSI in the early Holocene resulted in increased
sea-ice concentration in the northeastern Chukchi Sea despite
high insolation levels”
A little later they discuss tests with PIP25, and conclude, ” This suggests that marine production was not a simple response to nutrient supply but was affected by other processes such as the increase in irradiance in the water column (Frey et al., 2011; Lee and Whitledge, 2005) and wind-induced mixing that replenishes sea surface nutrients (Carmack et al., 2006).”
(Another abstract by some of the same people talks more about PIP25 http://journals.sagepub.com/doi/abs/10.1177/0959683616645939)
The Ding paper was apparently posted because of what it says about natural variation, but that doesn’t contradict or weaken the ideas of AGW.
I’m afraid I don’t see what’s been debunked here. What am I missing?