You Ought to Have a Look: Time for a New “Hiatus” in Warming, or Time for an Accelerated Warming Trend?
Guest essay by Dr. Ryan Maue
As you can tell from our blog volume, there’s been a blizzard of new and significant climate findings being published in the refereed literature, and here’s some things You Ought to Have a Look at concerning the recent “hiatus” in warming and what might happen to our (now) post-El Niño climate.
With President Trump still deciding on U.S. participation in the Paris Climate Agreement, new research suggests the Earth’s global mean surface temperature (GMST) will blow past the so-called 1.5°C Paris target in the next decade. But before making that ominous prediction, Henley and King (2017) provide us with a good history lesson on a taboo topic in climate science circles: the recent global warming “hiatus” or “pause” from 1998-2014. One could be forgiven for thinking the hiatus was “settled science” since it featured prominently in the 2013 IPCC AR5 assessment report. But a concerted effort has been made in recent years to discount the hiatus as an insignificant statistical artifact perhaps based upon bad observational data, or a conspiracy theory to distract the public and climate policymakers. Even acknowledging the existence of the “hiatus” is sufficient to be labeled as a climate change denier.
Social scientists, psychologists, and theologians of all stripes feared that widespread community acknowledgement of the hiatus would wither support for climate policy at such a pivotal juncture.
In a 2014 Nature Commentary (Boykoff Media discourse on the climate slowdown) saw the rise of the terms “hiatus and pause” in the media in 2013 as a “wasted opportunity” to highlight the conclusions of the IPCC AR5 report, which in itself ironically struggled with explaining the hiatus/pause (IPCC: Despite hiatus, climate change here to stay. Nature September 27, 2013). Amazingly, in a Nature interview a week prior to AR5’s release, assessment co-chair Thomas Stocker said this:
Comparing short-term observations with long-term model projections is inappropriate. We know that there is a lot of natural fluctuation in the climate system. A 15-year hiatus is not so unusual even though the jury is out as to what exactly may have caused the pause.
Claims that there might be something fundamentally wrong with climate models are “unjustified unless temperature were to remain constant for the next 20 years,” he said.
Except there was something fundamentally wrong with the climate models: they missed the pause! The IPCC was caught flat footed and their dodgy explanations were woefully inadequate and fueled continued questions about the credibility of future warming forecasts based exactly on those deficient climate models. What’s going on with this hiatus? A cacophony of explanations has filled the literature and media with several dominant themes: do not believe your lyin’ eyes – the data is wrong – and even if it is not, you are using it wrong. Karl et al. 2015 fixed the SST and buoy data, and (erroneously) claimed to have gotten rid of it. Cherry picking! The heat is sequestered in the depths of the ocean or the aerosols covered up the greenhouse gas signal. It’s enough to make you think climate “science” might not know what it is talking about!
Only a few years since the last (2013) UN climate report, there is now a strong scientific consensus on the cause of the recent global warming hiatus as well as the previous “big hiatus” from 1950s-1970s: a mode of natural variability called the Interdecadal Pacific Oscillation (IPO) which could be colloquially called El Niño’s uncle. The mode operates on longer time scales than El Niño but it is intimately related as a driver of Pacific Ocean heat exchange with the atmosphere and therefore a dominant modulator of global temperature. In a March 2016 Nature Climate Change commentary (Fyfe et al.), eleven authors including climate scientists Benjamin Santer and Michael Mann persuasively “make sense of the early-2000s warming slowdown.” Their article provides evidence that directly contradicts claims that the hiatus was a conspiracy, or scientifically unfounded fiction. Several important points are made that deserve mentioning:
The recent hiatus occurred during a period of much higher greenhouse gas [GHG] forcing e.g. CO2 almost 100 ppm higher than the previous “big hiatus” slowdown in the 1950s-1970s. The authors rightly raise the question if the climate system is less sensitive to GHG forcing that previously thought or global temperatures will undergo a major warming “surge” once internal natural variability (e.g. IPO) flips sign.
The observed trends in global surface temperature warming were not consistent with climate modeling simulations. Indeed, using a baseline of 1972-2001, climate models failed to reproduce the slowdown during the early twenty-first century even as GHG forcing increased. The hiatus was neither an artifact of faulty data nor statistical cherry-picking – it was a physical change in the climate system that was measured across multiple independent observation types.
Climate scientists still need to know how variability (natural and anthropogenic) in the climate system works to attempt to model its changes through time regardless of political inconvenience.
Now back to the Henley and King (2017) piece that predicts a flip in the Interdecadal Pacific Oscillation to a positive phase will lead to almost 0.5°C increase in global temperature by 2030. Based upon the RCP8.5 high emission scenarios (which are likely to be too high themselves), those same climate models that did not adequately predict the early 21st century hiatus are used to generate so-called warming trajectories.

Image adapted from Henley and King (2017)
How plausible is this extreme warming scenario? Regardless of the phase of the IPO, the model projections suggest an acceleration in the warming rates considerably above the hiatus period of the last 15-years. The authors allow for 0.1°C of warming from the recent strong El Niño as the offset for the “new” starting period, but that estimate is probably too low. We calculated the daily temperature anomaly from the JRA-55 reanalysis product—a new and probably more reliable temperature record–and apply a 30-day centered mean to highlight the enormous warming step with the 2015-2016 El Niño. Only an eyeball is necessary to see at least a 0.30°C upward step now into May 2017. Note that this is not carbon dioxide warming, and if we had a strong La Niña (the cold opposite of El Niño), we would expect a step down.
Is this warming now baked in (double entendre intended) to the climate system or will we descend to a lower level during the next year or two thanks to a La Niña? In other words, will the hiatus return, another one begin, or will the upward trajectory accelerate? Oh, and did we mention that we know of no climate model that warms the earth in jump-steps followed by long “hiatuses” after big El Niños?

via Cato@Liberty h/t to ossqss
Several sites are showing significant drops in march april 2017 global temps (after el nino)
Several other sites are showing warming global temps for feb march april 2017
any one have info on which data is showing warmer trends and which datasets are showing cooling trends
HadSST3 is now in for April and is showing a pause in ocean cooling.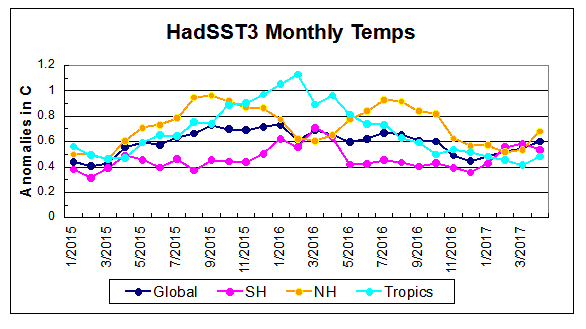
https://rclutz.wordpress.com/2017/05/23/april-pause-in-ocean-cooling/
A pause in cooling is acceptable; a pause in warming not.
Joe – the non climate scientist on May 25, 2017 at 9:48 am
any one have info on which data is showing warmer trends and which datasets are showing cooling trends
For april, tropospheric temps
http://www.drroyspencer.com/2017/05/uah-global-temperature-update-for-april-2017-0-27-deg-c/
went a little bit up, while surface temps
https://moyhu.blogspot.de/2017/05/giss-april-down-023-second-warmest.html
went a greater bit down.
It’s clearly a decline phase of the AMO but then that’s so inconvenient for some to even look at.
…when they stop thinking the PDO runs the world
The PDO (Northern Pacific) is not the same as
the Interdecadal Pacific Oscillation (IPO) as used in this post.
” In other words, will the hiatus return, another one begin, or will the upward trajectory accelerate?”
If I had to bet: the slight warming periods followed by pauses cycle will continue until it reverses. The humans who happen to be around then will envy the warmth we are presently enjoying.
This hiatus was/is warmer than the previous hiatus so I’m not sure the above statement proves anything. What am I missing?
The point is that the AGW theory maintains that CO2 is the primary driver of global temperature. This comes from the founding argument that only the increase in CO2 in the atmosphere can explain the warming of the late 20th Century. When the increase in greenhouse gases is taken out of the models, they don’t show much warming at all during this time period. In other words, natural variability is small and therefore, the warming must be man-made, and the science is settled!
If this argument is true, it is impossible for temperatures to remain flat for 15 years while greenhouse gases increase rapidly. The last 15 years invalidates the founding argument that only human emissions can account for the observed warming. When unknown natural cooling cancels out all the warming that the theory says must happen, it becomes obvious that unknown natural warming may have been taking place during the latter 20th Century, and the human contribution could have been much smaller than proclaimed, making a climate crisis very unlikely.
The warmests are in a tight spot of their own creation. If they acknowledge the hiatus in warming, they have to admit that either CO2 is less powerful than they thought or natural variability is more powerful than they thought or both. In any case, it weakens their argument for a crisis. It doesn’t make any difference that the recent hiatus was warmer than the mid-20th Century cool spell, because the hiatus raises the possibility that the difference is mostly natural. That is why they are acting so foolish trying to deny the hiatus.
They will really have their work cut out for them as the temperatures continue to slowly decline in the next decade or two.
Well summarized. Good job !
“If this argument is true, it is impossible for temperatures to remain flat for 15 years while greenhouse gases increase rapidly.”
No, that is false. The oceans absorb 92% of solar radiation, a very small change in the ocean uptake of heat can cause the air temperatures to be relatively flat for a period of time. The earth is still warming. And of course your point is dependent on only using satellite data, not surface data.
“If this argument is true, it is impossible for temperatures to remain flat for 15 years while greenhouse gases increase rapidly.”
Yep. Moreover….anyone that would even consider handwaving this “hiatus” away as being “just normal statistical variance”…..immediately must be considered a complete nutjob who should never be taken seriously again in climate discussions. I think thats the part thats often missing in skeptic’s response to this craziness.
Chris ,
And , particularly if the air is not warming , what is causing the oceans to suddenly retain more heat ?
Whatever it is , it debunks the CO2 argument .
I cannot distinguish today’s climate from that of 1975 or thereabouts. 40 years of “Warming” and nothing to show for it except thousands of altered temp records, fancy graphs and lousy statistical work by fraudsters!
Oh yeah! And a few trillion dollars thrown down a government hole!
Hah! Should read 1975! 1075 was warmer! Lol!
Also,where is all this heat coming from that is warming the oceans ,surely only the Sun ..The Sun must be the only supplier of heat energy to the earth .Take it away for long enough & temperatures would drop to well below 0degC as happens at both polar regions in winter seasons .Imagine No Sun at all ,what will warm the earth then? In desert regions it can cool from 40degc to below freezing in a matter of a few hours after sunset . It is only the relatively rapid rotation of the earth that allows for a rewarming from the cooling of night .
IT seems to me that the agw ,supporters want to ignore the long term historical records/data that we already have of earths climate/temperature changes .&then hold up their hands &say ‘but its too short term ‘,we now need longterm data’ ! What do they want???
I can agree that short-term observations and long-term observations do not compare properly. But Thomas Stocker and friends don’t believe that since they are the ones comparing the climate of earth to a period of time cherry-picked to start at the end of the Little Ice Age.
I have noticed that when one looks that the very long term — planet earth is cooling. Why is that not important?
Mr. Stocker is obviously trying to defend the theory and climate models. There is no intent to understand the actual climate system as it is. Much of what passes as climate research these days is really an attempt to defend the theory at the expense of actual science.
Bingo! And to advance an eco-religionist/ Socialist agenda.
Another great point.
It’s not a theory. A theory would have a coherent explanation for the observed facts. This is an unsupported hypothesis that has been invalidated by the observed facts.
Note: They were referred to long-term climate projections, not long-term climate observations. The projections mean nothing.
“Comparing short-term observations with long-term model projections is inappropriate. We know that there is a lot of natural fluctuation in the climate system”. If you know that there is a lot of natural fluctuation in the climate system, why were the models calibrated on the assumption that most of the post-industrial warming was due to CO2 forcing and that the natural fluctuations were assumed to be minor? You can’t have it both ways. This is the basic flaw in the modelling. You can’t separate the signal from the noise.
Indeed. But that won’t stop them using every artifice of the English language to try and talk their way around the continuing failure of the models. If it’s not worse-than-we-thought today then they say that means it will be even worse than that tomorrow. A tomorrow which never seems to arrive.
That and the fact that we don’t know what is “short-term” and what is long-term”.
And that there are clearly long-term natural fluctuations as well.
I wonder what would happen if airports and those weather stations that are not sited in rural areas, were dropped form the data stream?
There would be precious few weather stations left in the system.
MarkW on May 25, 2017 at 12:46 pm
There would be precious few weather stations left in the system.
Exactly 2,269 of the worldwide 7,280 having contributed to the data up to now.
Of course we could manage for a more severe rule for the extraction of the rural sites, e.g. by directly accessing the nightlight database in order to eliminate even more stations.
But it wouldn’t change that much. And even less when you focus on CONUS instead of looking at the entire Globe.
Larry on May 25, 2017 at 10:22 am
I wonder what would happen if airports and those weather stations that are not sited in rural areas, were dropped form the data stream?
That is an easy job if you know where is the data:
https://www1.ncdc.noaa.gov/pub/data/ghcn/v3/
In this directory you find, for averages, minima and maxima, the data i.e. the monthly measurements (absolute values) and the metadata i.e. the station list. All exist in two variants: unadjusted (nearly raw) and adjusted.
Look at a station list line line more or less arbitrarily chosen (425 is the country code for the USA):
42500011084 31.0581 -87.0547 25.9 BREWTON 3 SSE 44R -9HIxxno-9A-9WARM DECIDUOUS A
You see on it “R” for “rural” (instead of suburban and urban), and, in addition, the nightlight class “A” (lowest, “C” being the highest). Brewton has about 5,000 population individuals.
You can now extract out of the Globe’s station list all stations having “R” and “A” together, and then you can extract, out of the entire data, all measurements generated by these stations and compare that with the entire data (green: rural; red: all stations)
http://fs5.directupload.net/images/170525/92qcdxq5.jpg
The difference is not quite what most people would expect.
In blue you see what the GISS people extract out of the red data, by homogenisation, infilling and exclusion of outliers. And that many people do expect even less.
So the rural data says the world temp. in 1907 was the same as 2016. None of it seems like a catastrophe to me!
Scott Scarborough on May 27, 2017 at 2:31 pm
None of it seems like a catastrophe to me!
Indeed!
GHCN Ver. 3 data incorporates not only overt adjustments of the past record, but covert adjustments made in the name of quality control. Thus we are not dealing with what was actually measured. Also, the set of stations used to determine the 1981-2010 “norm” is by no means identical to the set available during the early decades of the record,
For these reasons, even the “R&A” selection of station records does not closely estimate the actual GAST, uncorrupted by UHI and land-use changes. Instead of peaking ca. 1910, the pre-war estimates, obtained from unadjusted, century-long station records that have been properly vetted, peak more than a decade later and only a few tenths Celsius lower than the temperatures of recent decades. The number of raw station records that that pass this far-more-stringent screening, however, is orders of magnitude smaller.
1sky1 on May 30, 2017 at 1:56 pm
Firstly, 1sky1, I use GHCN unadjusted (some special cases excepted), which contains only those corrections made by the instances responsible for the measurements. Work done by NOAA concerns the adjusted variant.
See the VOSTOK data as the best example of what you get when you solely rely on the GHCN unadjusted record.
Secondly, the anomaly shift to the 1981-2010 climatology has nothing to do with the original anomaly computation, in a first spatial step solely based on the stations’ data.
Ask BEST and Nick Stokes how to do…
In that case, your figure caption referring to “V3 adjusted” is totally wrong.
The arithmetic of anomaly computation has nothing to do with my major point: unless the SAME set of station records is used throughout, you are not controlling LOCATION in determining the monthly “norms.” Nor are you getting an accurate estimate of LONG-TERM temperature variation.
Why should anyone ask those who posit false assumptions about real-world spatio-temporal variability of surface temperatures? They’re also the ones who exhibit no capability in vetting station records professionally.
BTW, because you fail to account for the highly uneven geographic distribution of your mechanically selected stations, your compendium is not a legitimate estimate of GLOBAL average anomaly.
Calling it a hiatus is very unscientific. The correct word would be deceleration.
Since the advent of accurate satellite based lower atmospheric air global temperature measurements in 1978 the rate of warming on planet earth has decelerated. We were warming at a faster rate in the 1980’s than we were in the 2000’s. despite massive co2 increases
That would tell a normal intelligent person that CO2 might not have much to do with the recent warming. Of course the present day “climate scientist” are neither normal or intelligent.
They are not unintelligent, they get huge globs of money from the Federal Government, and they don’t have to deal crack or meth. Isn’t that smart. You probably have to work for a living.
Ronald Reagan — ‘It isn’t so much that liberals are ignorant. It’s just that they know so many things that aren’t so.’
It decelerated all the way down to zero.
When you park your car at home and step out do you say you are decelerating?
When it starts to roll back down the driveway do you call that increased deceleration?
Acceleration can be negative. Don’t you know?
I distinctly remember my high school physics teacher going on and on and on about “There’s no such thing as deceleration. There is positive and negative acceleration.” I have no idea if he was correct or not but I remember it because he made such a big deal about it. Yes he was one of “those” types.
🙂
Last panel!
Whip saw!
Stopped?
Or barely moving?
Add another 20 years to the goal post.
and another 20 years of grant money.
It’s enough to make you think climate “science” might not know what it is talking about!
We can’t even cure the common cold….and some glorified weathermen can predict the climate
…oh please
Ryan Maue:
Thankyou for your needed essay. I write to provide supporting info. that some may find useful when informing others of it.
Your essay says
That is truly amazing when the IPCC AR5 Report says in Box 9.2 on page 769 of Chapter 9 of Working Group 1 (i.e. the IPCC so-called scienceGroup) is here and says
GMST trend is global mean surface temperature trend.
A “hiatus” is a stop.
Your essay also says
YES and YES. The ‘Pause’ was “not “consistent with climate modeling simulations” and it was indicated “across multiple independent observation types”.
In 2008 the US Government’s National Oceanic and Atmospheric Administration (NOAA) reported
Ref. NOAA, ‘The State of the Climate’, 2008
http://www1.ncdc.noaa.gov/pub/data/cmb/bams-sotc/climate-assessment-2008-lo-rez.pdf
The following year (i.e. 2009), Phil Jones of the Climate Research Unit (CRU) wrote an email (leaked as part of ‘Climategate’) in which he said of model projections,
However, in 2012 when warming had ceased for seemingly 15 years, Phil Jones then insisted that
I hope this supplementary detail is helpful.
Richard
Thank you Richard.
Why do none of the models take into account the earths normal temperature? If all of you haven’t noticed we have been warming back to “normal” since the last ice age, which was an anomaly in the history of earths temperature. This might not be ideal for human life, but we had a good run!
Go out longer to the Holocene Optimum and we are cooling, with descent into another glaciation still probable within 1000 years and possibly much sooner. Zero indication on that time scale that ANY AMOUNT OF CO2 can stop that process. If another glaciation process begins and progresses at human lifetime speed, literally billions of people would starve and or freeze to death and modern society would cease to be!
But “climate science” says “don’t worry about that”, worry about it getting a little sweaty 3 or 4 times a year.
Yes, we’re still in a long-term cooling trend, dating at least from the Minoan Warm Period, ~3000 years ago, if not the end of the HCO, ~5 ka.
However a return of the ice sheets is still probably thousands of years in the future. There will be at least another cooling cycle after our current warm cycle end, then probably another, weaker, warming and stronger cooling, possibly leading to descent into the next long glacial interval.
However, advocates of eccentricity as the ruling parameter predict a very long Holocene interglacial, lasting tens of thousands more years.
The problem with an interglacial lasting tens of thousands of years ( I have heard it said that this present interglacial could last 50,000 years) is that we see no evidence of such a long interglacial in the past records going back at least 800,000 years, if not much longer. Why would this interglacial be so special? We are definitely on a downward trajectory since the Holocene Optimum, and notwithstanding the minimal warming of .85 C we have had since 1880, half of which may be human induced, humans in no way, shape or form can be the driver of climate now. Even with a halfway to doubling of CO2 since 1850 and all the massive land use change we have developed on the planet which probably exceeds CO2 as a net accumulation of heat, this will not be able to compete with the Suns forcing of earths orbital forcing.
The best current theory is the Milankovitch Cycles, that when the 3 major cycles line up for minimal solar forcing, then solar insolation at high polar latitudes (65 to 75 degrees) start a snowball/ice cover at these high latitudes and then albedo takes over causing a major ice age, and it does’t stop until the reverse happens. But I think there is many false starts and stops due to the varying regularity of the cycles within the 100,000 year eccentricity cycle, and perhaps it takes an external forcing like a volcanism event to really set it off. The geological records do show that we enter ice ages within decades, and you wouldn’t think the predicability of this slow motion oscillation would act in that matter. And the same for the start of an interglacial and more worrisome, the end of an interglacial. That means us. So it is still a bit of an intriguing mystery how all this exactly works.
Actually normal for the last couple of million years is the ice age. Something like 90% of it anyway. We’re between glaciers and that’s a short time indeed.
earth is steadily cooling
looking at the right data with the correct sampling plan
Wonderful piece.just adding some thoughts here.Been opining for quite some time in tweets and on Weatherbell, that the recent strong el nino may be the readjustment to a higher plateau, perhaps .1C or so higher than the previous one. Understanding that the warmer it gets, the harder it is to get warm and according to Le Chateliers principle a system is always in search for a balance and reacts, there is no tipping point here, but instead a series of actions, reactions, and then reconciliation The strong el nino, and I am a big fan of Grays MOC ideas that what you are seeing now is a product of a time scale on the order of centuries, may have supplied the heat, like the last super nino, to take us to a different level, where we level off, but is such that it was just a spike in what has been a gradually warming ocean vis natural means. Each successive step is likely to be less than the one before, since again to maintain the warmth takes a constant input of energy or storage of existing incoming energy, of which co2 has DECREASING effect as more is put into the air https://wattsupwiththat.com/2014/08/10/the-diminishing-influence-of-increasing-carbon-dioxide-on-temperature/. In any case the current fall off of temps to me is relative to how warm it got and not impressive nor can it compete with fall off after the 97-98 event, which still had a pause at a higher level behind it. , The nino coming on is likely to be a modoki type and may slow the continued fall, but I do not think reverse it. as overall SST’s are falling globally ( todays JMA analysis vs 3 months ago is quite impressive) and a responding la nina in the coming years will answer the question as to whether this a step to a new pause, but higher than the last, or the same story. In either case a paper like this is more in the realm of rational discourse that is needed to day, with people like Dr Maue, Dr Curry, Dr Spencer, etal, rather than the screaming hysteria and strawman arguments and painting oneself as a persecuted hero that is saving the planet, that I am seeing from the other side on this.
Thank you Joe but try paragraphs! Easier to read.
Let’s all keep in mind the Earth always wants to cool. It’s a pretty hot rock in a Universe of about 3 deg K. So the tendency is to radiate into Space. Turn off the Sun and it will freeze in a heartbeat. Maybe if you look at it this way, it might be a little easier to figure it all out.
That’s where water comes into play. Water (and its vapor) stores the insolation as oceanic and atmospheric heat. It also absorbs heat when it is crystalline or solidified. The keys to predicting the atmospheric trends is understanding the ocean oscillations (which Joe does well) and the individual timescales involved.
warmer it gets, the harder it is to get warm……..co2 has DECREASING effect as more is put into the air
Two very important things that are constantly ignored
It appears that CO2 can’t even hold the heat we already had.
.1C of variation is meaningless statistically as there are so many location specifics and measurement peculiarities to consider. The idea that we can say what the planet’s temperature is to an accuracy of .1C is laughable lunacy! It speaks to an obsession with numbers that ignores reality.
The temp outside my house this morning was 42. Inside it was 71. Therefor the average temp on my 20 acres is exactly 56.5. What’s so hard to understand? sarc/
Or not. Nobody knows what the temperatures are going to do over the next months and years. They could retrace completely the 2016 El Niño increase.
Nobody knows if an El Niño is coming o not. Eventually an El Niño will come, likely in the next 1-5 years, but we cannot predict it.
We’re about 2 months before the next El Nino is declared. This has been developing since January. Check out the Nino 3 and 4 regions. Additionally, every uptick in global temps since the Great Pacific Climate Shift of 1976 was accompanied by moderate to strong El Ninos. In other words, the warming of recent decades are nothing more than step increases brought on by changes in ENSO. See the work of Bob Tisdale. He’s done yeoman work in this regard
You are going too fast.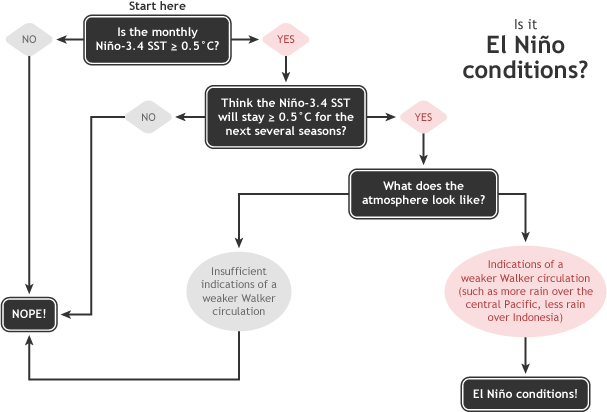
This is the decision process according to NOAA:
And according to the Australian Bureau of Meteorology, the latest weekly value for the Niño 3.4 region was +0.45
http://www.bom.gov.au/climate/enso/monitoring/nino3_4.png
(right-click the graph if not up to date).
So we don’t know when the next El Niño will be declared, and… Future predictions about climate are usually wrong.
Bob Tisdale’s hypothesis on warming by El Niño is unconvincing to me. It’s all circumstantial and not substantiated by El Niño paleo data.
JP on May 26, 2017 at 10:44 am
Check out the Nino 3 and 4 regions.
1. JMA
http://ds.data.jma.go.jp/tcc/tcc/products/elnino/elmonout.html#fig2
2. MEI
https://www.esrl.noaa.gov/psd/enso/mei/table.html
3. BOM SOI
http://www.bom.gov.au/climate/enso/monitoring/soi30.png
If ENSO was the climate driver some suppose it to be, then the 1997/98 edition would have had more warming consequences in the troposphere as did 2015/16, as the older edition was stronger than the recent one:
http://fs5.directupload.net/images/170529/9z6lnbeb.png
You may compare the three as you want: the result is alwas the same. The 2015/16 edition is the weakest of all.
But then: why is the 2015/16 heat blob so much higher than in 1997/98, and above all for both the TLT and the surface?
Climate is the average of [at least] 30 year ‘weather’.
The person who is able to predict all the weather for the next 30 years, that person is able to predict ‘climate’.
And no one can. No one, not even for 14 days. We simply don’t know.
How many tropical storms are we gonna have this year? When is the next El Nino? How much wind will there be next year if compared to this year? And what will be the relative humidity in the next year? Where? Exactly please. How many clouds are we gonna have and where? How exactly will the oceans behave? How much rain is gonna fall and where?
No one knows. But of course, everyone may guess. But never tell that you are ‘predicting climate’. Predicting in the scientific meaning is predicting EXACTLY what is gonna happen – and it has to happen exactly as you predicted. Ask people who say to KNOW about future climate developments to predict exactly what is gonna happen next year, when and where and in all detail. When they succeed for the full 100% they may guess for a period of 5 year. As detailed as the first time. And when they again exactly know, you may ask them to predict for the next 30 year. And if they exactly know, only then we started talking about ‘climate’.
Probably it will be easier to predict exactly the Dow Jones Index in the coming year for every second Tuesday of each week at exactly 14.25 GMT. You just need a theory, some models and some data. At the moment of writing the Dow Jones is 21.091,30. Must be easy.
Wim Röst:
You say
No. The 30 years refers to the standard period (or climate normal) for providing an average value for comparison to enable provision of anomalies.
The IPCC AR5 Glossary correctly defines climate as being
So,
climate is ‘average weather’ over any “period of time ranging from months to thousands or millions of years” but the period needs to be stated.
Indeed, if a climate datum were “the average of [at least] 30 year ‘weather’” we would only have 3 or 4 data points for global temperature since 1880 but climate temperature data is usually provided as monthly values since then.
Richard
“the period needs to be stated”
The bigger conceptual problem is that it doesn’t matter what periods you state as climate. It’s all one system. At one point you can call the same aspect of the system ‘climate’ and at another time you can call it ‘weather’. There’s no scientific difference between the two. This isn’t science we are dealing with. It’s just a narrative, shaped one way one day, and another way the next.
Andrew
The word “climate” was first used in Scottish English in the late 14th century, meaning “horizontal zone of the earth”. It came from Old French “climat”, for “region or part of the earth”, from Latin “clima” (genitive “climatis”) for “region or slope of the Earth”. from Greek “klima” for “region or zone”, literally “an inclination or slope”, hence “slope of the Earth from equator to pole,” from a suffixed form of Proto-Indo-European root “*klei-” for “to lean.”
The Sun’s angle on the slope of the Earth’s surface defined zones delineated by early geographers. The first English references, however, are in astrological works, since each of the then seven “climates” was believed under the influence of one of the “planets” (Sun, Mercury, Venus, Moon, Mars, Jupiter & Saturn). The shift from “region” to “weather associated with a region” perhaps began in Middle English, certainly by Early Modern English, ie c. AD 1600.
Today’s definition of climate is-
A political creation of bastardized data that is constructed to be spoon fed to fools and crammed into computers to produce useless models of zero predictive ability. Exaggeration of this data can be used to maximize grant applications and maneuvre the careers of sub par or pretend scientists to otherwise unimaginable heights. “See Hockey-stick shaped Horse-Hooey!
Richard,
“Weather” is the state of the atmosphere at a certain place and at a certain moment. It is very variable: from hour to hour, for day and night, from day to day, from season to season, from year to year. “Climate” on the other hand is the average state of ‘weather’, measured during a long period over a wide area. The difference between the two is made because no confusion must exist between ‘regular variations’ within (!) a natural system and an essential change in that natural system. As the definitions below prove, 30 year is a commonly used period for ‘climate’. It has ever been chosen because at that moment there were only 30 year of data for most of the weather stations.
In my opinion 30 year is not enough. Cyclical movements as AMO or PDO influence the 30 year period too much. Á 60 year cycle is often accepted as a period for natural fluctuations occurring in climate. Therefore to have a look at ‘whether the CLIMATE changed’ we need to look at least at periods of 60 years, a full cycle. The following definitions (below) however all used 30 years, therefore I mentioned that number. The discussion about which period exactly it should be is less important than the often practiced misuse of ‘weather variations’ as proof for ‘climate change’.
We must stay aware of the fact that in ‘media’, by politicians and even in ‘science’ natural weather variations on one place are used as a ‘proof’ of ‘climate change over wide regions and even ‘global’. Every storm, every dry or wet period somewhere is used to ‘prove climate change’. Which simply is not possible because nearly always it is just about ‘weather’ that people are talking: naturally occurring variations in an unchanged climate system. 40 Years ago we said ‘that is weather’ and now panic makers shout ‘climate change’, ‘climate change’.
Therefore we must keep a clear distinction between ‘climate’ and ‘weather’.
And again, who is not able to predict 30 year weather, can not predict ‘climate’. It means that no one can, not even one of us. So we don’t know, no one of us, and THAT is the message the world should get. Who is ‘predicting’ a certain climate for the year 2100 is just guessing on basis of a lot of assumptions – without telling so. Very unscientific. On such a base NO one decision should be made.
Some definitions:
Britannica:
https://www.britannica.com/science/climate-meteorology
The best modern definitions of climate regard it as constituting the total experience of weather and atmospheric behaviour over a number of years in a given region. Climate is not just the “average weather” (an obsolete, and always inadequate, definition). It should include not only the average values of the climatic elements that prevail at different times but also their extreme ranges and variability and the frequency of various occurrences. Just as one year differs from another, decades and centuries are found to differ from one another by a smaller, but sometimes significant, amount. Climate is therefore time-dependent, and climatic values or indexes should not be quoted without specifying what years they refer to.
NOAA
http://cpo.noaa.gov/AboutCPO/Glossary.aspx
The average of weather over at least a 30-year period. Note that the climate taken over different periods of time (30 years. 1000 years) may be different. The old saying is climate is what we expect and weather is what we get.
NASA
http://www.nasa.gov/mission_pages/noaa-n/climate/climate_weather.html
What Climate Means
In short, climate is the description of the long-term pattern of weather in a particular area.
Some scientists define climate as the average weather for a particular region and time period, usually taken over 30-years. It’s really an average pattern of weather for a particular region.
WMO
http://www.wmo.int/pages/prog/wcp/ccl/faqs.php
What is Climate?
Climate, sometimes understood as the “average weather,” is defined as the measurement of the mean and variability of relevant quantities of certain variables (such as temperature, precipitation or wind) over a period of time, ranging from months to thousands or millions of years.
The classical period is 30 years, as defined by the World Meteorological Organization (WMO). Climate in a wider sense is the state, including a statistical description, of the climate system.
KNMI – the Netherlands
http://www.sciamachy-validation.org/klimaatmaatwerk/KEW/data/index.html
Enkele definities
Wat is klimaat? Het klimaat van een bepaald gebied is het gemiddelde weer, dus het gemiddelde over langere tijd van de meteorologische grootheden zoals temperatuur, neerslag, vochtigheid, zonneschijn en wind, inclusief de extremen. Vaak wordt een periode van 30 jaar gebruikt om een klimaat te beschrijven.
(translation WR:
Some definitions
What is climate? The climate of a specific area is the average weather, so the average over a longer period of the meteorological parameters like temperature, precipitation, humidity, sunshine and wind, inclusive the extremes. Often a period of 30 years is used to describe a climate.)
Deutsche Wetterdienst (German Meteoservice)
http://www.dwd.de/DE/service/lexikon/Functions/glossar.html?lv2=101334&lv3=101462
(….) Im allgemeinen wird ein Zeitraum von 30 Jahren zugrunde gelegt, die sog. Normalperiode, es sind aber durchaus auch kürzere Zeitabschnitte gebräuchlich.
(translation WR:
(….) Generally a period of 30 years is used, the so named normal period, but surely there have been shorter periods used.)
WIKIPEDIA
https://en.wikipedia.org/wiki/Weather_and_climate
There is often confusion between weather and climate. Weather is the condition of the atmosphere at a particular place over a short period of time, whereas climate refers to the weather pattern of a place over a long period, long enough to yield meaningful averages.[1][2]
https://en.wikipedia.org/wiki/Climate
“Climate is the statistics (usually, mean or variability) of weather, usually over a 30-year interval.”
We have several problems here- climate “(IPCC)as the statistical description in terms of the mean and variability of relevant quantities over a period of time ranging from months to thousands or millions of years.”
All the models use similar methods, differing mainly in how variables that are not or cannot be modeled are guessed at.
The climate as presented by the earth is a chaotic system that cannot be modeled to produce single predictions. Ad hoc averaging of results from different models and/or time periods has not been demonstrated to be useful. There is no reason to believe that multiple models producing different results can be averaged, if that word even applies to multiple models, and produce more reliable results. Means, variability and other statistical methods apply to prior data, not the future.
The IPCC definition is totally unworkable. The mean and variability can and have changed, as best can be determined, over periods of hours, days, weeks, months, years, centuries, millennia, ages, epochs, periods, eras, and eons. etc. Not only can just about any(hedge) vary over those time scales but different measurements can have different means and variability that don’t necessarily relate to any other measurement.
The models all have one major problem. Each run of a current climate model produces one prediction of one possible evolution of the climate. There is no guarantee that the model can reproduce that one possible climate, or that any other evolution it produces will have any better or worse relation to the actual earth climate.it is modelling.
Wim Röst:
I quoted, linked and cited the IPCC definition of climate. It correctly states that climate is ‘average weather’ over any “period of time ranging from months to thousands or millions of years” but the period needs to be stated.
All the definitions provided by others that you cite agree with that.except for the ones from NOAA and Wikipedia. Those two exceptions are wrong.
Richard
Richard,
Wim’s definition of average WX over 30 years from Wiki cites the IPCC. See “Climate” entry in glossary:
http://www.ipcc.ch/pdf/assessment-report/ar5/wg1/WG1AR5_AnnexIII_FINAL.pdf
NOAA and the IPCC agree.
If you’re going to discuss climate “change”, then you have to set two periods of time which “contain” climate so you can discern a difference between them. A 30 year average is the standard choice at the moment. So – 15 years of no significant change – with the possibility of more after a big El Nino – is a very frustrating event for proponents of the CO2 caused warming models.
Chimp and Steele:
I reply to you both in one email for convenience and I intend no slight to anyone by it.
As Chimp says, the NOAA definition that Wim Röst cited agrees with Wim Röst’s claim of the definition. But only wiki also agreed with that definition and all the other definitions Wim Röst cited don’t. Importantly, the IPCC definition is used by all the people, the nations and the organisations which participate in the IPCC process, and that includes NOAA. So, prior to Steele’s post we are left with only Wim Röst and wiki who were known to be using a definition that differs from all others.
But Steele also uses the same definition as Wim Röst when he writes
Sorry, but no. Any period can be used and is. As I said, monthly periods are used to assess how global climate temperature is changing, and in 2004 the IPCC used 4-year periods to assess if hurricane frequency was changing.
However, Steele goes on to assert
I agree that 15 years of Pause is significant, but not for the reason Steele says. 15 years of Pause is a problem for the modelers because their models often show periods of 10-year Pauses but no periods of 15-year Pauses. And 15-years is as valid a climate period as 10 years or 30 years.
The fact that 15 years is as important a climate period as any other is one of the reasons why this pedantic discussion of ‘what is climate’ has importance.
Richard
Richardscourtney, May 26, 2017 at 11:30 am
“I quoted, linked and cited the IPCC definition of climate. It correctly states that climate is ‘average weather’ over any “period of time ranging from months to thousands or millions of years” but the period needs to be stated.”
WR: Richard, the aim of the IPCC is to bring a certain message to all people. The aim is not to bring clarity in the discussion. To make it possible for media to mix variable ‘weather’ events with the more stable ‘climate’, IPCC needed to redefine (!) climate to ‘any period’ shorter than 30 year. Permitting media to say: ‘hey, it did rain less last three months: a proof of climate change!’. It is just one of the many tricks of the IPCC. ‘How do we create panic’.
The idea of ‘climate’ has been developed to distinguish real long term changes from natural (weather) variations within a certain climate state. To remove that clarity gives maximum space for ‘manipulation’ of an ignorant audience.
To avoid all manipulation and all ‘panic nonsense’ from media and others, we should strictly use a 30 year minimum for ‘climate’. The classical period, as stated by the World Meteorological Organisation.
Wim Röst:
Yes, as you say, “the aim of the IPCC is to bring a certain message to all people” but so what? That does not alter the fact is as I said, i.e.
“the IPCC definition is used by all the people, the nations and the organisations which participate in the IPCC process, and that includes NOAA. So, prior to Steele’s post we are left with only Wim Röst and wiki who were known to be using a definition that differs from all others.”
The 30 years refers to a standard period to which climate data is compared to generate ‘climate anomalies’ and ‘climate normals’: it is NOT climate. And its length is arbitrary: it was adopted by the World Meteorological Organisation (WMO) in 1958 as part of the International Geophysical Year (IGY) because it was thought there was insufficient data for use prior to 30 years before 1958. It is an unfortunate choice because 30 years is not a multiple of the solar cycle length, or the Hale cycle length, or any other climate cycle length.
You assert
OK, that is your opinion and you are entitled to have it. But you have provided no reason for any others to agree with it and/or to adopt it.
Richard
Philo May 25, 2017 at 5:10 pm
“The climate as presented by the earth is a chaotic system that cannot be modeled to produce single predictions.”
“The models all have one major problem. Each run of a current climate model produces one prediction of one possible evolution of the climate. There is no guarantee that the model can reproduce that one possible climate, or that any other evolution it produces will have any better or worse relation to the actual earth climate it is modelling.”
WR: Philo, thank you for your comment. It is worth to read it well. The chaotic systems of the Earth like oceans and atmosphere and their interplay are not predictable. Instead of creating panic, scientists, IPCC and media should emphasize this most important feature of models any time they present a modelled result.
What modellers need to get good results, is ‘an Earth that will follow their specific model’. So far such an Earth does not exists.
Different runs of the same model with just a trillionth (!) of one degree difference in input produce over a period of 40 years (1963 and 2012) completely different results. Who looks in the maps at Northwest Canada sees variances in output for that region as big as double the difference between the glacial state and the Holocene state (4 °C). The same model, nearly the same input. The effect of chaotic behaviour. The Earth will choose one way to behave: unpredictable which one it will be. It could be any way.
Source: https://www2.ucar.edu/atmosnews/perspective/123108/40-earths-ncars-large-ensemble-reveals-staggering-climate-variability
Richardscourtney May 26, 2017 at 9:53 pm
Richard: “Yes, as you say, “the aim of the IPCC is to bring a certain message to all people” but so what?”
WR: “But so what”? This is exactly what it all is about. I will be more clear: the aim of the IPCC is to bring a certain possibly / probably wrong message to all people in a way to create a kind of panic after which everyone stops thinking. Because that is what people normally do when they are in panic: they stop thinking and just show reflexes like ‘follow the leader’ and ‘show me where to go’. The perfect scene to manipulate people. All well orchestrated.
In the seventy’s and eighties I was teaching geography. It was basic to learn everyone the difference between ‘normal variances’ in weather and ‘fundamental changes’ in more continuous average weather patterns called ‘climate’. The aim was exactly to avoid that feeling of ‘alarm’ when unexpected (but normal) weather patterns would manifest themselves.
In the well organised attempt to mislead people the difference between ‘climate’ and ‘weather’ had to disappear. After that, every event that before was mentioned ‘weather’ would be ‘a proof of climate change’. ‘Climate change’ had to be ‘continuous and everywhere’. Only then people could be manipulated in the way wanted. People continuously in panic and blind for what was really happening. Or not was happening.
That is what they did. Changing rules of the game in the way they can win, in this case by the self declared ‘official authority of climate science’ IPCC. A government institution.
I don’t like manipulation and I surely will continue to oppose the willful changing of rules that were broadly accepted in the times before that manipulation of the masses started. Weather is just weather and not climate.
Wim Röst:
You have changed the subject.
I suspect that I have been opposing the IPCC process for longer than you, but that is a different subject to what is the existing definition of climate.
Richard
…. or Time for Reversal of the global warming to the forthcoming global cooling.
hold that cooling, I haven’t figure out the tax model yet!!!!
Not possible Harry, we have reached ‘tipping point’ (or so they say) and now only way is downhill
and the climate ‘scientists’ will be running for their life.
One of those purloined emails from Hadley noted that the data and the models were not agreeing and that they believed the models were better than the data.
It is astounding that this fraud still has life in it.
But it is that belief that allows for all the changes we see to the data. It is simply unbelievable that all the changes wold fit the theory of the changes were being made independently. As statisticians looking for fraud and cheating in things like taxes and exams know, patterns usually show there’s a problem,a s we struggle to cheat and show something that looks like randomness.
No one ever seems to argue that there is zero correlation between CO 2 and temperature. They blame mistakes in assumptions, data, feed backs , clouds. I’m no scientist but what if there was no influence. Looking at recent history that would appear to be the case. On the other hand we know that the world has become greener . It seems to me that it would be useful to understand the extent of the correlation between CO2 and vegetation. It’s time that CO2 was lauded for its benefits to mankind and decriminalised ASAP.
There’s a continued assumption, even in sceptical circles, that “CO2 ‘must’ cause some warning”. This should not be assumed, but hypothesized and rigorously tested according to proper scientific methodology. All the evidence so far though seems to point to your understanding that there is zero correlation, therefore zero causation.
They can call it what they want, anyhow something is wrong with the central estimates provided by IPCC.
This is an estimate of the current global warming:
“Earth’s energy imbalance:
Earth’s energy imbalance measurements provided by Argo floats detected accumulation of ocean heat content (OHC). The estimated imbalance was measured during a deep solar minimum of 2005-2010 at 0.58 ± 0.15 W/m².[11] Later research estimated the surface energy imbalance to be 0.60 ± 0.17 W/m².[12] ”
– Wikipedia: Earth’s energy budget
(Also: IPCC;AR5;WGI;page 181; 2.3.1 Global Mean Radiation Budget)
While IPCC provide the following central estimates for cloud feedback alone:
«Water Vapour, Cloud and Aerosol Feedbacks
The net feedback from water vapour and lapse rate changes combined, as traditionally defined, is extremely likely2 positive (amplifying global climate changes). The sign of the net radiative feedback due to all cloud types is less certain but likely positive. Uncertainty in the sign and magnitude of the cloud feedback is due primarily to continuing uncertainty in the impact of warming on low clouds. We estimate the water vapour plus lapse rate feedback3 to be +1.1 (+0.9 to +1.3) W m−2 °C−1 and the cloud feedback from all cloud types to be +0.6 (−0.2 to +2.0) W m–2 °C–1.»
– WGI;AR5; Page 574
By current observations the central estimate for cloud feedback leave no room for net warming by the direct effects. And the estimates for cloud feedback that are higher than the central estimate are not supported by current observations.
What’s really cool is that there is a hiatus in lower stratospheric cooling that starts concurrently with the surface hiatus. It means the surface hiatus was likely very real. Why doesn’t anyone point this out? You cant post an image in these comments, but if anyone has a copy of “Lukewarming”, it is Figure 17 on page 76 of the final (Sep 16) edition.
Of course what this means is that natural variability in the lower stratosphere is also overwhelming the greenhouse forcing that should exert a cooling pressure there.
Funny, Karl et al. didn’t get the email on this when the cooked up the pausebuster.
“You cant post an image in these comments..”
You might want to see if the guidelines about “Images in comments” on the test page may be to any help in posting that particular image.
https://wattsupwiththat.com/test/
The URL of an image on a line by itself will display .
> …new research suggests the Earth’s global mean surface temperature (GMST) will blow past the so-called 1.5°C Paris target in the next decade.
He he giving odd and/or willing to bet real money?
NOAA’s global temperature dataset includes records from stations flagged as part of the GSN, which they describe as “a baseline network comprising a subset of about 1000 stations chosen mainly to give a fairly uniform spatial coverage from places where there is a good length and quality of data record.” One would assume that this is better than average data, and that nearly a thousand stations with good spatial coverage would at least give a fair idea of what global temps are doing.
I’ve loaded the TMAX data into a mysql database, which gives me a data mining opportunity with an unarguable data point for each day: the maximum temperature. Below is a graph of the global annual TMAX averages from 1979 to 2016. There’s no gridding, no weighting, no adjustments of any kind. Just the “quality data record” for each station, leaving out the -999.9 records, which means “no data.” Each year represents over a quarter-million daily records from nearly a thousand stations.
http://i497.photobucket.com/albums/rr340/jaschrumpf/gsn_global_annual_tmax_average_1979-2016.png
James Schrumpf on May 25, 2017 at 5:09 pm
I’ve loaded the TMAX data into a mysql database, which gives me a data mining opportunity with an unarguable data point for each day: the maximum temperature.
Unarguable? Why? The whole world uses TAVG, so we should do the same I guess. And TMAX mostly makes sense only if you use it in combination with TMIN:
http://fs5.directupload.net/images/170526/ftves9rr.jpg
Here you see in a graph I produced some weeks ago, clearly showing that, as predicted by many people, TMIN anomalies are surpassing those of TMAX measurements.
And that you will never see when using absolute values as in your comment above, James!
My question: what did you want to show us with the graph?
So temps are roughly 3 degrees C higher since 1940, news to me.
First off, after Nick’s post I realized that I’d done the anomaly calculation incorrectly, so the graph is inaccurate, though probably not completely, absolutely wrong. We will speak of that one no more.
What was I trying to show with the graph? Data mining has been what I do for the last 20 years for various clients. I look at their data and answer their business questions, and also try to see what the data might show about questions that were never asked.
But this is the kind of thing that drives me crazy. NOAA has a FAQ page where, among other things, they explain why anomalies are better than real data. They show this .gif:
First off, I went to NOAA and downloaded the daily records for those five stations in those years. Imagine my surprise when I looked at the data for Asheville 8 SSW CRN (USW00053877), and there IS no TAVG data for the entire dataset for those years. Nor does Mt. Mitchell, Asheville, Asheville 13 S CRN. Happily the airport has TAVG data. Figures…
So where did NOAA come up with those average annual temps for stations that apparently have no TAVG data at all? Did they “interpolate” it from elsewhere?
James Schrumpf May 27, 2017 at 12:56 pm
“First off, after Nick’s post I realized that I’d done the anomaly calculation incorrectly, so the graph is inaccurate, though probably not completely, absolutely wrong. We will speak of that one no more.”
WR: James Schrumpf, which post (Nick’s post) you are talking about? And which graph?
Your graph at James Schrumpf May 25, 2017 at 5:09 pm, is that one correct?
“So where did NOAA come up with those average annual temps for stations that apparently have no TAVG data at all?”
TAVG is just (TMAX+TMIN)/2
Sorry, Nick’s post was from a different thread. Tough to search with a smartphone, and I thought it was from here. The graph in this thread is just a TMAX avg.
Nick, how can NOAA possibly use something as simple as (TMAX + TMIN)/2 as a daily average? Don’t those weather stations take hourly readings? Can’t they calculate the sum of all 24 readings /24 at least? And if a simple averaging is all they do, why was TAVG missing while TMAX and TMIN were present?
Bob boder on May 26, 2017 at 7:10 am
So temps are roughly 3 degrees C higher since 1940, news to me.
Looking at the chart’s title might help…
Nick Stokes on May 28, 2017 at 4:29 am
TAVG is just (TMAX+TMIN)/2
Hello Nick! What’s the matter with you today? That computation is really brand-new for me.
http://fs5.directupload.net/images/170528/gtk3y98l.jpg
JS,
“Nick, how can NOAA possibly use something as simple as (TMAX + TMIN)/2 as a daily average?”
Because for a large part of he record, that is all the information available. Until MMTS about 25 years ago, people read min/max thermometers once every 24 hours. And there is nothing to gain by changing to a new basis late in the record.
The GHCN record just records what the originators supplied. If they calculated TAVG (most did) it goes into the record.
Nick Stokes on May 28, 2017 at 3:36 pm
Because for a large part of he record, that is all the information available. Until MMTS about 25 years ago, people read min/max thermometers once every 24 hours. And there is nothing to gain by changing to a new basis late in the record.
Thanks.
Là, je comprends Nick un peu mieux!
An interesting graph. Not only for the general trend but also for the higher variability after 2000.
GSN only seems to contain land stations:
The GCOS Surface Network (GSN) is a global network of over 1000 stations selected from the network of many thousands of existing meteorological stations. The GSN is intended to comprise the best possible set of land stations with a spacing of 2.5 to 5 degrees of latitude, thereby allowing coarse-mesh horizontal analyses for some basic parameters (primarily Temperature and Precipitation).
https://www.ncdc.noaa.gov/gosic/global-climate-observing-system-gcos/gcos-surface-network-gsn-program-overview/purpose-gsn
If you look at it, virtually all of our warming since the ’70s came during an anomalous period from the late ’80 through the late ’90s in which we had three consecutive El Ninos with practically no La Nina activity to speak of to counterbalance the warming. El Nino warmed…then another warmed more…then another warmed more. Other than that we’ve only had a miniscule amount of warming in the last 50 years.
I saw a great article today. It says that far from a hiatus, Global Warming ™ is acceleting. Reading further, it was based on Karlised data, but also claimed all data sets showed this.
In the middle of the article there was a graph very clearly showing the latest data point at the same level as about 1996, clearly refuting their claim!
Found it again
http://www.popsci.com/global-warming-leveling-off
There can not be a hiatus in AGW theory. The retained heat has to be somewhere. The energy flux from the sun is constant. The retained heat is not in the oceans you’d have sea level rise. Everything said about co2 and temperature by the IPCC and associates was that co2 causes warming. Did we forget about the graph going back in time and how temperature goes up and down with co2? ( let’s not mention the 800 year co2 lag) It’s been too many years with accumulated heat. The alleged heat retention machine didn’t just turn off. How is/was it that there is a pause when every natural variation has been previously ruled out? Was the pause local and not world wide? Perhaps when it gets cold again, it will only be intensely cold where you are.
“There can not be a hiatus in AGW theory. ”
Wrong. You can even have ice ages in the theory.
You cannot. The amount of heat being retained is enormous according to the theory. There just anyway a lack of heat to exist in the long run. The short run has already came and went. No possible way with the passage of time to have either a hiatus or a cool down. You do remember the tipping point? You do remember that we needed to do something now before it’s too late? You do remember that co2 ‘ last for hundreds of years in the environment’ ? You can not have an ice age with the current levels of co2. You do remember how the release of co2 brings us out of an ice age? You do remember the alarm over the amount of co2 is higher now than in the last Brazilian years that’s causing these frightening events worldwide? Stronger more frequent hurricanes, the Hymalayan mountains are free of ice and all the rivers dried up and 2 billion people are with out water? Those panic assessments? Are they lying to us at Climate Day workshops when they say such things? Coming to a university near you!
You are just playing word games Steve. Anything is possible in a chaotic universe as long as it meets your agenda. There is no reason that you become the sole arbitrager of that use of reason. Who died and left you king of the universe? You claim science, and just as quickly add in anything and everything could or might happen. There are at least 1 or 2 billion people on this planet that have a deep seated belief in a divine being that can perform magic. And willing to die to make you believe the same way they do. The laws of the universe may have been designed by a divine being, but the they don’t change on your whims. Either co2 retains heat as has been described by AGW or it doesn’t. There is no evidence that the heat associated with the concentration of co2 is anywhere on this planet. Let’s put it another way, the sun’s output varies historically no more than 0.012%. Not enough to cause cooling is it? And that’s despite the orbital parameters or axial tilt. AGW ruled that out. It’s co2 period that controls climate.
A theory that predicts everything is not a theory. If one can’t say “If this occurs, then this will happen, but if that occurs, then that will happen”, then it’s not scientific. One can’t say “If this occurs, then these diametrically opposed things might occur, we have models that predict both.”. That’s not actually saying anything.
The Southern Annular Mode (SAM) appears to be a precursor to the hiatus. ?itok=SfM6AroV
“The observed trends in global surface temperature warming were not consistent with climate modeling simulations”
Well there’s your problem right there! Stop observing real stuff, and everything falls into place.
I’d place even money on a long-term global cooling.
Five years of cooling will end the debate, should kick off any time now.
Temps have been running warmer in the last 12 months than our short term models (<5 years) estimated. We expected a bigger cool-down from the el nino by now. Last year was on track, but this year has remained stubbornly warm.
My post under the greening planet dilemma for doomsters would have fitted nicely here. The big blue patches where there used to be hot blobs I think answers the question of wither climate? Also no western Pacific warm pool in evidence.
We’ve had the most precipitous drop from an El Nino in the record. The “dead cat” bounce (courtesy of the under appreciated Le Chatelier Principle) has peaked and is set to finish the plunge. Indeed, instead of upwelling of cold water at the east end of the system, cold water is wedging into the equatorial zone from cold Blobs in both hemispheres. This not normal ENSO mechanics. The ENSO regions are seemingly decoupled from the global picture. What there is along the equator is pretty unimpressive. We ate going to get cooling in overdrive simply because there isn’t much warm water to be found in any of the oceans.
Noted for future reference. THX
what is the “observed data” the paper refers too, I hope not NCEI’s data set or the extra mutilation of it by GISS?
They are not observations, at ALL
Hadcrut, but you get the same answer with all datasets and even with raw data
“A 15-year hiatus is not so unusual even though the jury is out as to what exactly may have caused the pause.” That is correct. It is very natural for the climate to vacillate. So if that is in fact true, wouldn’t you think that the models analyzing the data would have period of no increase because the data would DEMAND IT. The fact their data did not include these anomalies clearly demonstrates their models can not properly predict the future climate. They are not reliable nor realistic enough to base all our future economy on flawed results.
It is not so much their data (fudged data at that). It is more a matter of the missing and fudged parts of the formulas in their code. Much of it needs to have fudge factors instead of actual physics-based math. In the early days, no matter what they did with the physics-based math, the models would pretty quickly shoot off to infinity. I.e., CRASH. They brought in a Japanese whiz, and he just inserted some fudge factors to tame the unruly beast. When others inquired what those factors were for, he explained that they were to tame the unruly beast, so they didn’t go to infinity. IOW, he cheated.
And is this still in the models to calm the beast? I don’t know, but I think so. I expect they didn’t want to risk infinity with new formulas that didn’t include it. I can’t know that for sure – except that it is very much in human nature to take what seems to work and don’t ask questions.
Why do the warmists only concentrate on CO2? Because it’s easy.
http://www.earth-syst-dynam.net/8/369/2017/esd-8-369-2017.pdf
NONONONONONONO – It is because their goal is to kill fossil fuel based industry. It is a matter of hating their own humanity. Don’t think this is wacko, either. Greenpeace founder and now ex-member, ecologist Patrick Moore discusses this in his book, ‘Confessions of a Greenpeace Dropout: The Making of a Sensible Environmentalist.’ He had to dropout because of politicos hijacking Greenpeace. He will tell you: THOSE people are not environmentalists but people with a whole different agenda.
Does anyone pay attention to the correct use of English grammar these days?
At the beginning of this article we see :
“and here’s some things You Ought to Have a Look at concerning”, which should read “and here are some things you ought to have a look at concerning”.
A little more effort from the writer makes life easier for the reader!
The temperature measurement record shows two previous pauses each about thirty years long with the current pause starting about 2002-2004 (not 1998) being the third. These pauses were separated by warming periods also about thirty years long. What information exists to lead one to believe that this apparent pattern of temperature change will not continue?
The interval from the 1940s to the ’70s wasn’t a “pause”. It saw a pronounced cooling. IMO the interval from the 1880s to 1910s was also a cooling rather than a pause in warming.
I agree with Chimp.
I suspect the magnitude of the ENSO of 1998 actually delayed the onset of the hiatus.
I love to look for patterns, and this one is a doozy. The PDO was discovered in 1997 (by biologist Hare) and was for at least decade attributed to warming and cooling “regimes” in the northern Pacific. It was at least honest in describing what had been observed, while it didn’t try to guess why the northern Pacific would be changing every 30 years +/- 10 or so. The PDO DID agree with those hiatuses of the past and the rises in ~1850-1880, ~1910-1940, and ~1970-1997-ish.
The last years of the periods of 1880’s to the 1910’s and 1940’s to the 1970’s featured downturns in temperature and this may again occur in the latter 2020’s and early 2030’s.
Okay, now they call the Pacific Decadal Oscillation (PDO) the Interdecadal Pacific Oscillation (IPO). That is supposed to be science? Renaming things? Piffle. That, under either name, was discovered in 1997 BY A BIOLOGIST studying the trends in salmon catches.
Then, long about 2010 or so – I think I actually saw it on a YouTube climate class video – the instructor/professor realized that the temperature curve for the last 130 years or so was an INCLINED since curve. Since it was inclined, the rises were steep and the falls were either flat (HIATUS) or neatly flat – before the next rise.
If one posits that our old argument that WE ARE STILL COMING OUT OF THE LIA, that accounts for the inclined to the sine curve. The tough part is accepting and explaining WHY the climate would be following a fairly consistent 60-year sine curve period with 30 year inclines and 30 year flats. (More or less. The 60 year part is as observed, as far as what observations were available back then. With the rounding at both ends, the peaks are kind of flattened out, so that the rising and flat portions are something less than a full 30 years.
But WHY? Sheit, the global warmers aren’t asked to spell out the exact and specific mechanisms of how anthropogenic CO2 actually warms the climate. They b.s. their way and avoid spelling out why. So why do their critics have to do that?
I do believe that they looked for some natural resonance or periodicity in some planetary or solar system thing – and didn’t find any. The closest, (as I recall) was the sunspot cycle, but that is like 3/4 in length of the PDO/IPO. So, there is no smoking gun pointing at anything that we currently suspect could be contributing.
So I think I know the following about the global temperature record:
1. Station measurements are read to tenths of a degree C once daily to get the maximum and minimum recordings for the day.
2. The average daily temperature or a station is just the average of the maximum and minimum station recordings for the day.
3. The station baseline is calculated by averaging these daily averages over the period 1981-2010
3. The station annual anomaly is calculated by subtracting this station baseline from the average of these daily averages over the course of a year.
4. These annual station anomalies are then used to interpolate within the 5 degree X 5 degree cells where there is no real data, but where there MUST be data, in order to balance the weighting factors and “calculate” the average global anomaly within the cell.
4. These cellular annual anomalies are then averaged with all of the other cellular anomalies to determine the global annual anomaly. Because we MUST have the average global anomaly.
Is that correct? Did I miss anything? I’m really trying to understand the process.
Obviously, my numbering got screwed up as I edited the post, and I neglected to notice until it was too late. [sigh] I’m sure everyone gets the idea, though.
It’s critically important that we stop lending tacit credence to the idea that carbon dioxide causes global warming. My new book, “In Praise of Carbon: How We’ve Been Misled Into Believing that Carbon Dioxide causes Climate Change” (amazon.com/dp/B01N7ZXTID) lays out the clear reasons why this arcane notion should be abandoned. Briefly, these are:
1) There is not even one hard-data-based study in the peer-reviewed literature that supports the theory and there are at least two that refute it (one of them mine). Note that spectral absorption/re-emission characteristics of CO2 (e.g., the HITRAN database) DO NOT prove an actual link between CO2 and warming. That link has only been theoretically inferred, but has never been shown by hard-data.
2) Ground measurements of back-radiation from the atmosphere by infrared astronomer Michael Sanicola and others have shown no wavelengths that are characteristic of Earth’s surface temperatures, thus effectively removing the rationale for the supposed CO2/warming link.
3) A better warming mechanism, and one that more closely reflects the actual behavior of temperature anomalies over the past half century, exists in the form of chlorine photodissociated from anthropogenic CFCs released to the atmosphere in the last three decades of the 20th century and catalytically depleting the ozone layer, admitting increased irradiation by high-intensity UV-B radiation. Basaltic volcanoes, like Iceland’s Bardarbunga, which recently (2014-2015) underwent the largest eruption since 1783, also release chlorine as HCl, which similarly affects the ozone layer, and this effect is not countered by albedo-increasing aerosols because basaltic volcanoes produce no eruption clouds and therefore cause warming rather than cooling. Warming following Bardarbunga’s eruption is a likely cause of the large El Nino and temperature spike of 2015-16, from which we currently seem to be returning to the “hiatus.” The catalytic nature of ozone destruction by chlorine and the long residence time of chlorine in the atmosphere guarantee that temperatures will remain elevated through at least mid-century.
If we fail to counter the myth of a CO2/warming link aggressively, especially by pointing out that such a link is baseless by 1) and 2) above, it will continue to dominate all debate regarding “climate change.”
DONALD TRUMPS rejection of the Paris climate change agreement is not without foundation,i quote.on NOV 13 2010 DR OTTMAR ENDENHOFER IPCC CO CHAIR WORKING GROUP 3, said in an interview,WE THE(UN-IPCC) REDISTRIBUTE DE FACTO, THE WORLDS WEALTH BY CLIMATE POLICY,ONE HAS TO FREE ONESELF FROMTHE ILLUSION THAT INTERNATION CLIMATE POLICY IS INVIROMENTAL POLICY, THIS HAS ALMOST NOTHING TO DO WITH INVIROMENTAL POLICY ANY MORE. in the mean time the climate do what ever it wants ,with or without mans input