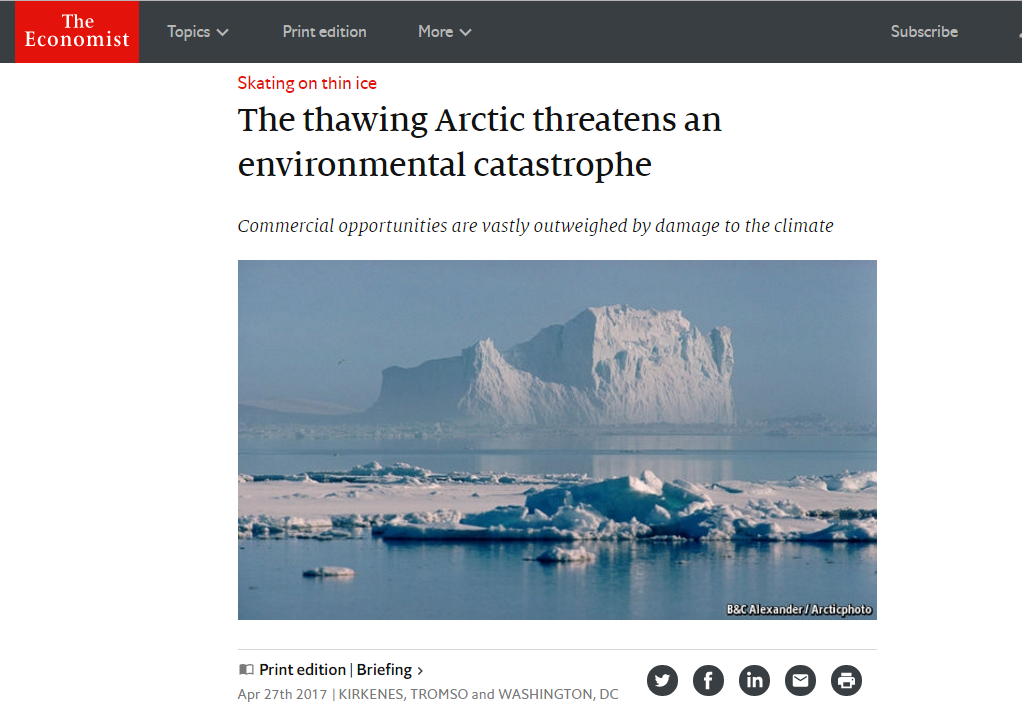
Guest post by David Middleton
[…]
The thaw is happening far faster than once expected. Over the past three decades the area of sea ice in the Arctic has fallen by more than half and its volume has plummeted by three-quarters (see map). SWIPA estimates that the Arctic will be free of sea ice in the summer by 2040. Scientists previously suggested this would not occur until 2070. The thickness of ice in the central Arctic ocean declined by 65% between 1975 and 2012; record lows in the maximum extent of Arctic sea ice occurred in March.
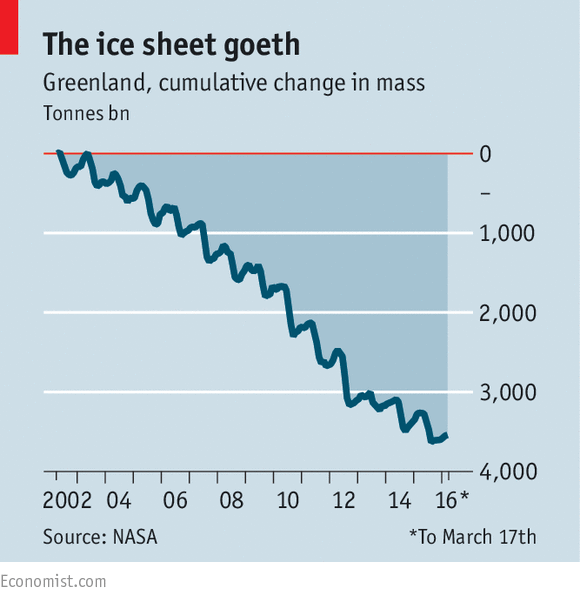
The most worrying changes are happening in Greenland, which lost an average of 375bn tonnes of ice per year between 2011 and 2014—almost twice the rate at which it disappeared between 2003 and 2008 (see chart). This is the equivalent of over 400 massive icebergs measuring 1km on each side disappearing each year. The shrinkage is all the more perturbing because its dynamics are not well understood. Working out what is going on in, around and underneath a supposedly frigid ice sheet is crucial to understanding how it will respond to further warming and the implications of its demise for rising global sea levels (see article).
[…]
375 billion tonnes per year… Oh my!
400 massive icebergs measuring 1km on each side disappearing each year… Oh no!!!
Wait a second… Those sound like big numbers… But how big are they compared to the Greenland ice sheet?
The USGS says that the volume of the Greenland ice sheet was 2,600,000 km3 at the beginning of the 21st century.
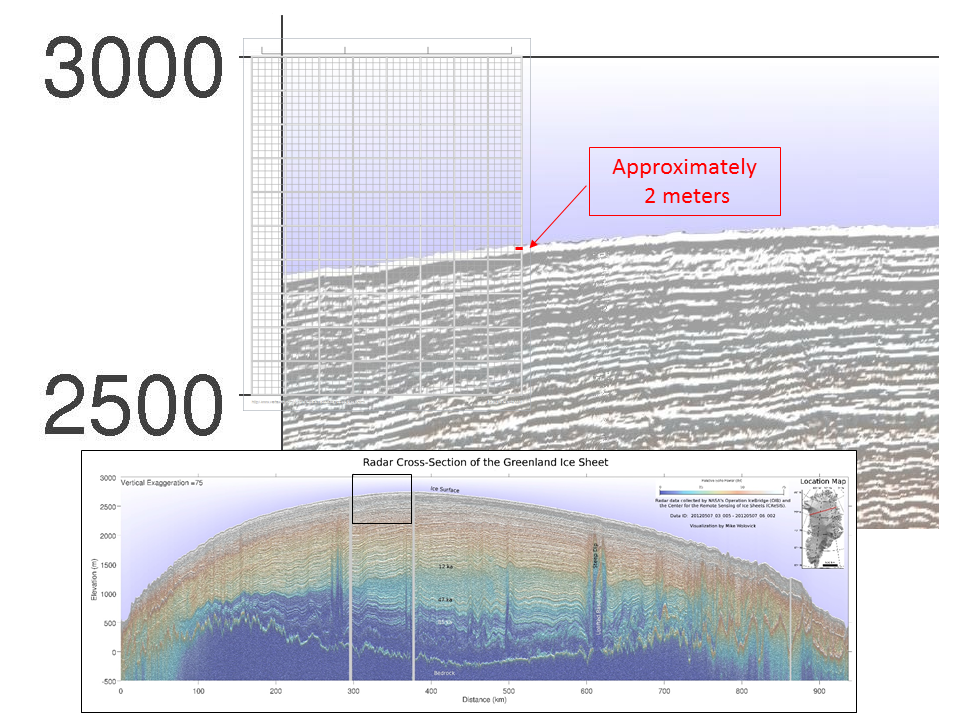
According to the “ice sheet goeth” graph, since 2001, Greenland lost about 3,600 gigatonnes of ice or about 3,840 km3 … That equates to a 16 km x 16 km x 16 km cube of ice (3√ 3,840 = 15.66). That’s YUGE! Right? Not really.
It’s not even a tiny nick when spread out over roughly 1.7 million square kilometers of ice surface. That works out a sheet of ice less about 2 meters thick… Not even a rounding error compared to the average thickness of the Greenland ice sheet.
- 2,600,000 km3 / 1,700,000 km2 = 1.53 km
The average thickness of the Greenland ice sheet is approximately 1.5 km (1,500 meters). 2 meters is about 0.15% of 1,500 meters.
From a thickness perspective, 2 meters looks like this:
Using The Economist ratio of 400 km3 to 375 gigatonnes, 2,600,000 km3 works out to 2,437,500 gigatonnes. When some actual perspective is applied, it is obvious that “the ice sheet goeth” nowhere:
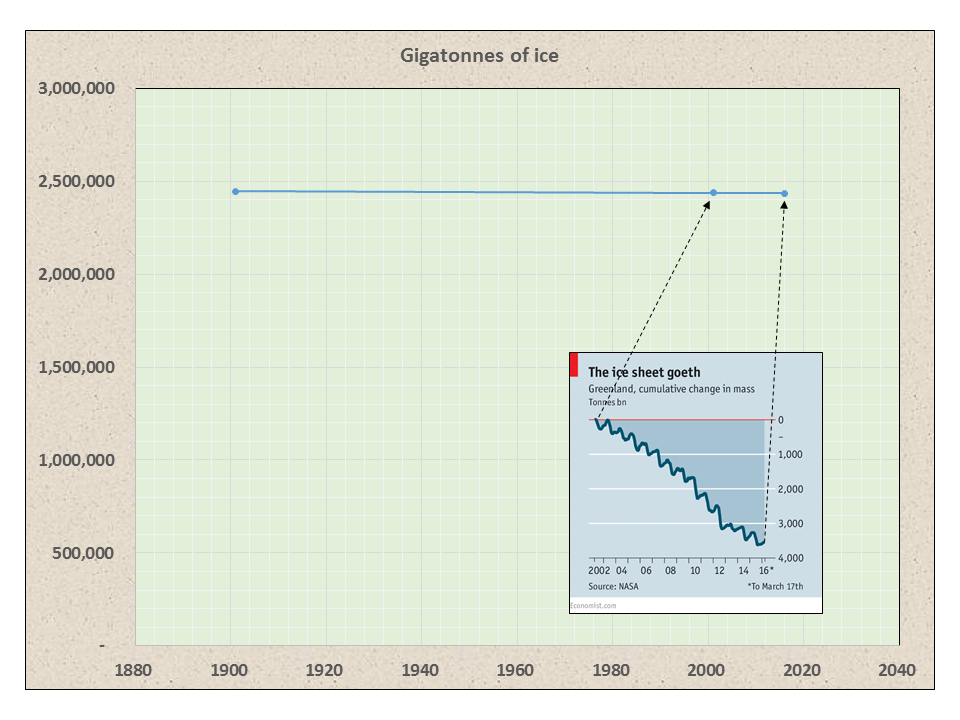
Despite all of the warming since the end of Neoglaciation, the Greenland ice sheet still retains more than 99% of its 1900 AD ice mass.
Multiple Choice Quiz
Fill in the blank:
Alarmists are _________ perspective.
- a) allergic to
- b) ignorant of
- c) willfully ignoring
And still no “acceleration” in sea level rise.
Yep! The Alarmists can lie about Greenland’s ice sheet melting away and the western ice shelf of the Antarctic collapsing all they want but until actual sea level rise impacts populated coastal areas the average person isn’t going to care. In the mean time such claims as this just damage their credibility as time passes and their multiple predictions of disasters do not materialize.
https://phys.org/news/2017-05-antarctic-peninsula-ice-stable-thought.html
Now that the Paris deal is done, the truth comes out.
Considering that Colorado University published the title:
“Is the detection of accelerated sea level rise imminent?”
and since the changeover to Jason-3 will almost certainly occur on the next release (CU is way overdue for that) I’m sure “acceleration” will be found and that “news” trumpeted far and wide. Oh, the acceleration will no doubt be a function of data manipulation more than anything else.
Gosh. What kind of tree rings are we gonna use for sea level rises?
so I peed in the ocean and you didn’t notice!!!!
That raises the level of all the oceans of the world about 5X10-17 inches. Much more than I would have thought.
Thermal expansion.
But 97% of scientists agree that you raised its volume when you peed in the ocean, ergo, there is a disaster imminent.
I’m going to stop swallowing seawater now!
You just doubled the amount that the oceans have warmed over the last decade.
Dang, now that’s truly messed up the glacial isostatic adjustment !!!!
“so I peed in the ocean and you didn’t notice!!!!”
“I’m going to stop swallowing seawater now!”
Just think of what all the fish do in it….
Environmentalists would be horrified…but would never be appalled that all sea life does the same. 🙂
The (ignorant) Warmista Clan don’t believe in Archemedes …
“And still no “acceleration” in sea level rise.”
It’s hiding in the deep oceans
LOL…thought you’d like that
..you also have to keep your eye on the ball (in this case gray) with these c r o o k s…..
…notice anything different between these two charts?
This is the way they reported it at the end of April
They changed the mean to make it look like less.
What is the percentage of error on the measurements. It appears the the “loss” could fall within that boundary.
Also, as I recall the 2011-12 graph originally didn’t end at zero accumulation (it was originally a positive gain) either but was updated to zero sometime later in the year. Never saw an explanation for that update (not that they didn’t publish one, I just thought it was a strange update that year).
“Danish Meteorological Institute Moves To Obscure Recent Record Greenland Ice Growth”
http://notrickszone.com/2017/04/28/danish-meteorological-institute-moves-to-obscure-recent-record-greenland-ice-growth/#sthash.utgAyOOl.dpbs
Today it is -18C
http://www.summitcamp.org/status/webcam/
Summit camp, the ONLY permanent weather station in the interior that is measuring weather parameters.
From Wiki: https://en.wikipedia.org/wiki/Summit_Camp
“The climate is classified as polar, and the weather is highly variable. Typical daily maximum temperatures at Summit Camp are around −35 °C (−31 °F) in winter (January) and −10 °C (14 °F) in summer (July). Winter minimum temperatures are typically about −45 °C (−49 °F) and only rarely exceed −20 °C (−4 °F). Annual precipitation is about 3,000 mm (118.1 in), much of which falls as sleet or snow, which is possible in any month. Inland, the snow line in summer is at an altitude of about 300 m (984 ft). The highest temperature at Summit Camp was 3.6 °C (38.5 °F), recorded on July 16, 2012; the lowest recorded temperature is −67.2 °C (−89.0 °F)”
Average high deg C, June -11, July -11, Aug -14.
Average mean deg C, June -15, July -13, Aug -16
Average low deg C, June -19, July -15, Aug -21
Mighty warm ice that melts at -11 C.
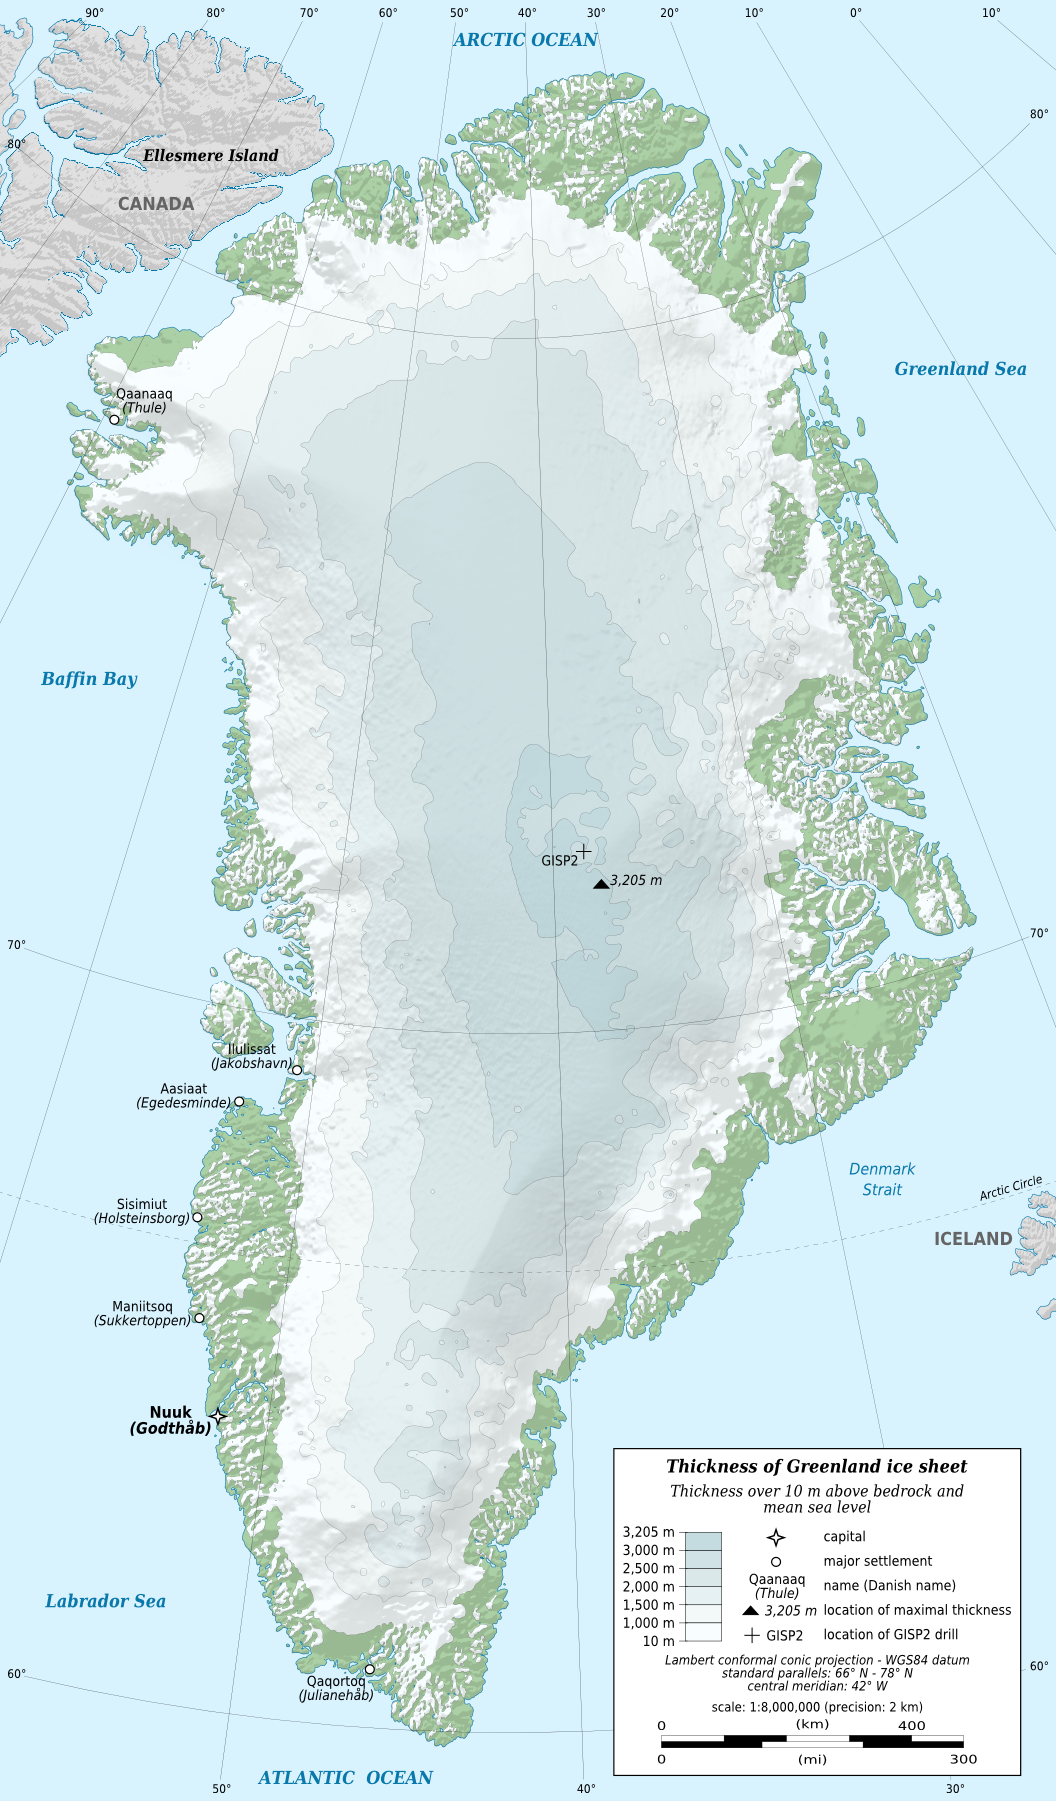
Lat – Glad David showed the top map of Greenland with the location of GRIP2.
please see ftp://ftp.ncdc.noaa.gov/pub/data/paleo/icecore/greenland/summit/gisp2/isotopes/gisp2_temp_accum_alley2000.txt
About half way down the data is :
2. Accumulation rate in central Greenland
Column 1: Age (thousand years before present)
Column 2: Accumulation rate (m. ice/year)
 Age Accumulation
 1st   0.144043 0.244106
 last 2 48.9746 0.091739
        49.0034 0.091599
So 48,856 years and there are no negative numbers for Accumulation. Or every time period has increased volume. On the summit, Greenland over the last 49,000 years has only gained ice.
{changed to fixed font for table. Not sure it is any more clear. .mod]
For the last 3,000 years they have data points about every 30 years, but nothing more recent than 144 years ago. Does it really take that long for the snow to compress into ice?
It usually takes longer… particularly in Antarctica. It’s dependent on the snow accumulation rate.
But what does this actually show?
For example, in 2011/12 (the red line) it suggests that there was no gain or loss of ice that year. In other words, as from 1st September 2011, ice accumulated, reaching a peak at the end of May/beginning of June 2012, and then lost ice through to 31st August 2012 such that by 31st August 2012 there was approximately the same amount of ice as there was on 1st September 2011.
However, the black line (the mean0 appears to suggest that throughout the year, on average over a 30 year period, there has been a gain of about 380GT each year.
If the mean is correct and each year ends with approximately some 350GT more ice than when the year started, it would appear that Greenland has gained some 10,500GT (ie., ~350 x 30) during the period 1981 to 2010.
Am I missing something? Am I mis-reading this plot?
CORRECTION
The reference to 380/350GT should be 300GT.
The reference to 10,500GT should be 7,200GT (ie., 300 x 24).
The chart shows gain from snow fall and loss from melting and sublimation. It does not include loss from glacial calving.
The web page ( http://beta.dmi.dk/en/groenland/maalinger/greenland-ice-sheet-surface-mass-budget/ ) states: “Over the year, it snows more than it melts, but calving of icebergs also adds to the total mass budget of the ice sheet. Satellite observations over the last decade show that the ice sheet is not in balance. The calving loss is greater than the gain from surface mass balance, and Greenland is losing mass at about 200 Gt/yr.”
Of course, this text has remained the same even though this year and last year were both years of large snowfall.
Thanks
I should have checked their web page, it contains a useful summary. That said, I consider the plot ought to contain a better description of what it is showing.
latitude,
to me that change means that this years increase is similar to the levels last reached in the 1980s.
BTW
Glacier calving is not the same as glacier melting
– calving is a lot of ice reaching the sea
– melting is the glacier RETREATING
Yep.
Increased calving is usually a sign that the glacier is growing.
Recycled.
“When glaciers calve, alarmist have a cow.
That explains all the bellowing!”
Ice cap loss and gain of mass is a function of precipitation and the calving of icebergs. That cause and effect relationship is separated by hundreds of years. Hence the change in ice mass today is likely due to the change in precipitation patterns hundreds of years ago. Assigning the cause of today’s ice loss on current CO2 emissions and climate is just plain silly.
Glaciers that aren’t advancing can’t calve icebergs.
Allencic – 2:22 pm
Glaciers that aren’t advancing can’t calve icebergs.
You don’t get it. If alpine glaciers recede it’s Global Warming, if continental glaciers advance, it’s Global Warming. Do you see how that works? Whatever happens leads to catastrophic disaster and CO2 and Climate Change are the cause.
They can if the seas rise!
As for “if”, if my aunt had balls, he’d be my uncle. Sea level rise is ~1mm per year.
But then doesn’t that result in the same loss of ice from the glacier? Whether it melts or runs off a cliff seems to me to be immaterial. Pls correct me if I am wrong.
Only if you think that taking your dog to a taxidermist is the same as taking him to a veterinarian, because they both return your dog to you when they are done.
You are wrong. Got it?
If there wasn’t calving and melting, then all the water on the planet would end up at the poles–like Mars. That would lead to other problems.
Jim
Scientists are happy to admit they were wrong — as long as it was wrong in the “worse than we thought” direction: “SWIPA estimates that the Arctic will be free of sea ice… by 2040. Scientists previously suggested this would not occur until 2070.”
You never see blaring headlines in the other direction.
Notice the current prediction is an “estimate”; the previous was a mere “suggestion”.
And didn’t Professor Wadhams “predict” 2015, no, I meant 2017, no I meant 2020?
Re: Retired_Engineer_Jim (May 1, 9:19 am): Professor Wadhams sure did, and so did Paul Beckwith, head of Sierra Club Canada.
Don’t forget Al Gore and John Kerry’s echoing of those predictions.
Maybe I’ll make it to 2040 so then I can comment again the North Pole is still there.
Well, I don’t think the geographic pole will have moved, but lets hope that Santa isn’t treading water by then. (although I severely doubt it.)
🙂
The ultimate cherry pick is taking an arbitrary five year period and comparing it to an arbitrary three year period to come up with a 25 year into the future prediction of dire consequences.
AFAIK one of the greatest problems with GRACE measurements is the problem of identifying where Greenland ends and the sea begins. It’s not an exact science, let’s put it that way.
Told you…
However, one of larger errors in GRACE measurements, land–ocean
leakage effects, restricts high precision retrieval of ocean mass and
terrestrial water storage variations along the coasts, particularly
estimation of mass loss in Greenland. The land–ocean leakage effect
along the coasts in Greenland will contaminate the mass loss signals
with significant signal attenuation. In this paper, the precise glacier
mass loss in Greenland from GRACE is re-estimated with correction of
land–ocean leakage effects using the forward gravity modeling. The
loss of Greenland ice-sheets is −102.8 ± 9.01 Gt/a without removing
leakage effect, but −183.0 ± 19.91 Gt/a after removing the leakage
effect from September 2003 to March 2008, which has a good agreement
with ICESat results of −184.8 ± 28.2 Gt/a. From January 2003 to
December 2013, the total Greenland ice-sheet loss is at−261.54±6.12
Gt/a fromGRACE measurements with removing the leakage effect by
42.4%,while twothirds of total glacier melting in Greenland occurred in
southern Greenland in the past 11 years. The secular leakage effects on
glaciermelting estimate is mainly located in the coastal areas, where
larger glacier signals are significantly attenuated due to leaking out
into the ocean. Furthermore, the leakage signals also have remarkable
effects on seasonal and acceleration variations of glacier mass loss in
Greenland. More significantly accelerated loss of glacier mass in
Greenland is found at −26.19 Gt/a2 after correcting for leakage
effects.
Re-estimation of glacier mass loss in Greenland from GRACE with
correction of land–ocean leakage effects
Shuanggen Jin a,b,⁎, Fang Zoua,c
http://www.sciencedirect.com/science/article/pii/S0921818115301168
The GIA (glacial isostatic adjustment) is also a big issue. The GIA is often much larger than the asserted ice loss.
Bit of an own goal, here, by the alarmists.
Their *first* point, about sea ice, was cogent. It *could* disappear during the summer months, with unknown effects on weather systems. Unlikely, according to some, but debatable.
Their, *second* point, however, about the Greenland ice sheet, is pure horse puckey.
Putting the two side by side only weakens the first point, without making the second more credible. It seems the CAGW enthusiasts can’t resist talking ball hooks, *even when they’re right*!
” unknown effects ?” Open Arctic waters allow more “ocean effect” snow to fall upon Greenland, with obvious consequences not involving Melt!!!
Never Right, invariably Left.
What happened to, d) all of the above?
My thought as well.
Only if you assume different answers don’t apply to different people. “All of the above” is possible if it applies to multiple different classes of warmists.
Good point… But that would be “any of the above.”
+1 – I knew someone had to have asked that already.
B and C are incompatible. “All of the above” is a logical impossibility.
These figures are a bit like 300ppm CO2 in the 18th Century to 400ppm now. It sounds a lot until you express it as 0.03% to 0.04%.
Or if you take into consideration that the additional .01% CO2 is being added to an atmosphere that in aggregate with water vapor included already contained about 3% ‘greenhouse’ gases. Time for panic. Uh huh, uh huh.
… and take into consideration the Beer-Lambert Law.
And take into consideration that whatever means of measuring CO2 were rudimentary to nonexistent in the 18th Century. Comparing proxy data to instrument data isn’t really very sound.
It’s OK to *compare* proxy data to instrumental data. It’s not OK to assume that it is a direct comparison… This leads to hockey sticks because the instrumental data demonstrate (higher frequency and higher amplitude temperature variations than the proxy reconstructions.
Or 3 molecules in 10,000 to 4 in 10,000
The DMI precipitation model has Greenland ice INCREASING – apart from one small corner.
I know the answer to the quiz! It’s “all three!”
Nice article.Perspective is important!
I do hope they have booked their cruises in the Arctic. I think I can get a really good price on popcorn futures this far ahead.
They should be OK, the Russians are building another 10 icebreakers.
And what was the growth of the Greenland ice cap 1940-75? I do seem to remember a bit about WWII planes found tens of meters down in ice.
Greenland has a fairly high snow accumulation rate, even when its mass balance is negative.
Those planes were buried under about 82 meters of ice, after just 50 feet.
http://www.airspacemag.com/history-of-flight/glacier-girl-the-back-story-19218360/?all
82 meters is an astonishing number. That’s an average of 1.6 meters of ice per year, which is equivalent to more than 24 meters of annual snowfall.
That snow was mostly from water evaporated from the Arctic Ocean, lowering global sea-level.
s/after just 50 feet/after just 50 years/
http://p38assn.org/glaciergirl/images/GPR-measurement-concept.jpg
So, correction:
Buried under 61 meters of ice plus 24 meters of packed snow, after just 50 years.
Dave – the man in your graphic is 65 ft. tall. Doesn’t do the burial rate justice..
Quiet, he’s looking for Captain Amaerica
The post Ice age warming began ~10,000 years ago and yet it continues. Ice ages have come and gone without the influence of human activity. And so it shall continue. Why would you NOT expect that the post ice-age warming to continue?
Why would anyone think it would stop?
Well it has actually stopped, it is just that the temperature fall after the Holocene Optimum has been a kind 1400 year phugoid with successively cooler optima we are about to see how cool the next dip in temperatures will be.
Ian W,
I number myself among the many of those who are skeptical that the earth is warming at this time, not to mention, skeptical of warming due to to human influence. More often I dismiss any melt report as hype, but here I wanted to express a different, related idea this time. I wish to reinforce the notion that the earth at one time was covered in ice and then it warmed, with no help from people.
Looking at ice core data from Antarctica, there is no significant trend over the Holocene. I was surprised since I’ve taken the “warmer” early Holocene pretty much on faith. It was technically very slightly warmer, but nothing to write home about. There’s a very weak correlation with increasing age. R-squared is about 0.008. Essentially no significant relationship between time and temperature in the Vostok data over the last 11,000 years. That was derived using a simple linear model in R. Vostok data has an increasing interval with increasing age.
The Vostok and most Antarctic cores are of very low resolution and the insolation trends of the Northern and Southern Hemispheres are different.
http://ars.els-cdn.com/content/image/1-s2.0-S0277379113004162-gr4.jpg
I love how they conflate Greenland ice sheet melt with loss of arctic sea ice. They discuss seemingly big numbers of one (nice work debunking this by adding the appropriate scale for perspective) and then offer it as unconnected and unsupported proof of the second. They then close with obligatory hat tip toward DOOM and it is very clear that the emotional response that they are trying to evoke is: BE AFRAID. BE VERY AFRAID.
This from the Economist, no less. I expect better from them.
One time maybe. In recent decades, no.
Whether it is economics or global warming, the Economist has drunk the left wing kool aid.
….they’ve gotten very good at spinning f a k e news
The Economist does this sort of nonsense all the time these days. Has for quite a few years now.
3,840km^3 spread out over the sea surface area 510.082e6 km^2 gives a sea level rise of 7.528e-6 km
=7,528e-6*1e3*1000mm=7.53mm if I have the maths right.
over 16 years that’s 0.47mm/year
A veritable Noachian deluge… /Sarc
0.47mm is a reasonable proportion of the 2.7mm/year since 2003 I though that the slr was down to thermal expansion.
Compared to the coldest time in the last 150 years, arctic ice has fallen.
Oh the humanity of it all.
Perspective? Wazzat?
As I have said many times:
Any scientist can calculate a value. It takes engineering perspective to let you know how big of a shit load that really is…or in this case…is not.
That is why we can engineer to 4 nines, and not have to worry about the next 4.
Do any of you ever point out their mistakes to “them” in letter, or email form?
Not in quite a while. The general response is “thank you” and the “mistake” is never corrected.
Becky, while we may view the omission of perspective as “error”, I firmly suspect they do not, as it detracts from their alarmist narrative. Given the frequency of occurrence, the omissions of mitigating data or perspective appear to be intentional to mislead “useful idiots”.
I’ve often thought and still do think along the same lines as you Becky: no point in making such (VALID) comments here, when they’ll only be read, let alone taken seriously by like minded people – sceptics like us. What’s desperately needed is something that is all but impossible, at least for the short term: MSM (especially TV and radio) exposure of this site’s and similar site’s hard-facts and truthful content.
Socialism has never worked, so we can only hope that soon it will end up doing what history has shown always happens – it will destroy itself. The useful idiots that are currently used to spread the fear and ramp up CAGW / climate change hysteria, must eventually realise at some time that they have been used and it will be their lives that will be compromised no less than the lives of other ordinary people, by this wicked, misanthropic scam…
Alan. Socialism does always destroy itself, unfortunately it seems take forever in term of human suffering and subjugation. Venezuela is a recent example.
Alan Vaughn:
You have introduced a ‘red herring’ that Leonard Lane has picked up.
The global warming scare is promoted by governments of all political types. It is a ‘band wagon’ that they are riding because it suites their various desires.
Indeed, the scare was started by Margaret Thatcher (i.e. a vituperative anti-socialist) and her political party (i.e. the UK’s Conservative Party aka ‘the Tories) still promotes it.
All politicians need to raise taxes but people don’t want to pay taxes so politicians seek a tax that people want to pay. Here in the UK we have one such tax that people want to pay; i.e. the National Lottery. When politicians fail to find a tax that people want to pay then they seek a tax that people will not object to paying. And who could object to paying a tax intended to save the planet for our children and our children’s children?
Also, each national government has its own special interests in global warming but, in all cases, the motives relate to economic policies. In general, the USA fears loss of economic power to other nations while this is desired by those other nations. Universal adoption of ‘carbon taxes’, or other universal proportionate reductions in industrial activity, would provide relative benefit to the other nations by altering relative competitiveness. Unfortunately, if a few nations adopted the changes they would increase their manufacturing, transportation and energy costs and thus lose economic competitiveness and industrial activity to all other nations.
Developing nations cannot afford technological and economic advances that would benefit them and also reduce their increases to CO2 emissions as they develop, so they are seeking gifted technology transfers and economic aid from developed countries as ‘climate compensation’.
These matters have nothing to do with any political ‘ism’.
We have truth on our side. Shouting about falsehoods damages credibility.
Please try to keep on topic.
Richard
“richardscourtney” writes “You have introduced a ‘red herring’ that Leonard Lane has picked up”, and then proceeds to declare that since “governments of all political types” promote the global warming scare, then no particular political “ism” can be blamed. But that’s a non-sequitur, since there is rarely a “pure” “ism” in any government, but rather all governments have varying degrees of alignment with, and opposition against, that particularly heinous abuse of science.
Dancing around the May Pole, as it were, distracting the reader from the clear pronouncements from U.N. one-worlders and leftists the world over, denouncing capitalism, declaring that abolishing capitalism is the way to fix the climate, demanding massive “progressive” taxes to fix the climate, etc.
Collectivism of any sort is the political insanity which permits the acceptance of this false science, since it is precisely the sort of “problem” that demands a “collective” solution. Socialists and one-world-government types simply can’t help themselves when presented with such a “problem” demanding a solution.
And it’s simply not rational not to recognize the affinity for collectivists and “global warming”.
Tom in Oregon City:
Clearly, logic is not your strong point. You say
Anybody can see the non sequitur is yours.
It matters not whether there is a pure “ism” when governments of all political types promote the global warming scare.
Please put down the ‘red herring’ and discuss the subject of this thread instead.
Richard
Becky:
Please read this.
I would be very grateful if you – or anybody – were to suggest a solution to the problem highlighted by your question.
Richard
Richardscourtney: good on you for trying.
Thanks for the update David. It’s another zombie climate scare that keeps coming back, no matter what. So many climatist claims are clearly “unfalsifiable”, in that tno evidence can stop them to be reasserted.
Greenland is Melting was a theme ahead of Paris COP, and there are the same six good reasons not to fear.
http://rclutz.wordpress.com/2015/10/29/greenland-is-melting-really/
You need to have 400,000 cubic kilometres of LAND ICE melting to raise global sea level by 1 metre.
It is amazing to me that the vast majority of climate scientists seem to be completely unaware of the fact that global warming increases snow and ice accumulation on ice sheets and glaciers, reducing sea-level, and offsetting ice loss through melting and iceberg calving. They frequently refer to “the two ways” in which warming influences sea-level: by melting of grounded ice, and by thermal expansion. They seem not to know that the process of accumulation of snow & ice on ice sheets and glaciers is at least as important in its effect on sea-level.
Decreased sea ice coverage in the Arctic and Southern Oceans increases water evaporation. The additional evaporation increases “lake-effect/ocean-effect” snowfall downwind. Some of that snow falls on the ice sheets and glaciers, increasing ice accumulation, and offsetting meltwater losses.
(Digression: the increased evaporation has other effects, too. It cools the ocean by evaporative heat loss — a negative/stabilizing climate temperature feedback. It also causes more snowfall on other land, increasing albedo and snowpack, decreasing land temperatures, and prolonging winter. It also apparently increases cloudiness, increasing albedo at altitude, and probably further cooling the surface, though clouds and their effects are very complex, and poorly understood.)
Snow accumulation has a HUGE effect on grounded ice mass, which in turn affects sea-level.
The magnitude of ice accretion from snowfall on ice sheets was illustrated by the team which salvaged a WWII P-38 (now called “Glacier Girl”) from under 268 feet(!!) of accumulated ice, 50 years after she landed on the Greenland ice sheet. That is an astonishing number. 268 feet of ice in 50 years is 5.4 feet of ice per year, which is equivalent to more than 80 feet of annual snowfall. That snow was mostly from evaporated water, removed from the Arctic Ocean.
daveburton says:
“They frequently refer to “the two ways” in which warming influences sea-level: by melting of grounded ice, and by thermal expansion. They seem not to know that the process of accumulation of snow & ice on ice sheets and glaciers is at least as important in its effect on sea-level.”
They know but it does not fit the narrative and thus their objective of continued funding. The Arctic was warmer than average for most of this winter and what did we see? Greater than average accumulation of snow on the vast majority of Greenland. Contrasts in the temperatures of air masses are a critical component in creating precipitation but that is just “weather” and has nothing to do with climate in their minds apparently.
“.. the Arctic will be free of sea ice in the summer by 2040. Scientists previously suggested this would not occur until 2070.” 2070, really? It used to be 2016.
According to Al Gore´s movie, An inconvenient truth, it was going to be 2014.
BTW, he has another movie coming this summer. An inconvenient sequel: Truth to power.
http://www.imdb.com/title/tt6322922/?ref_=nm_ov_bio_lk3
Maybe here we will now the new Arctic emancipation date.
The biggest thing is that these scaremongerers do not even mention the change, which have been visible since 2014, after all, already in the third year: http://beta.dmi.dk/uploads/tx_dmidatastore/webservice/b/m/s/ D / e / accumulatedsmb.png
The right link: http://beta.dmi.dk/en/groenland/maalinger/greenland-ice-sheet-surface-mass-budget/
Can I just fill in ‘a**holes’ and ignore the multiple choice options?
Personally, I prefer not filling in a**holes.
I have with my boot a few times. Old Army sergeants saying: “I’ll put my boot so far up your a$$ you’ll taste Kiwi for a week.”
Matt Ridley had a good post on Greenland ice some years back:
http://www.rationaloptimist.com/blog/greenlands-melting-ice/
At the rate of one percent per century, the GIS would be gone in 10,000 years, but since climate is cyclic, there will be more and probably colder Little Ice Ages during that interval in which the ice sheet will gain mass.
IMO the 11,000 year-old Holocene, even should it last another ten thousand years just hasn’t been and won’t be hot enough to melt the whole GIS. In the Eemian, which was warmer and lasted 16,000 years, the Southern Dome melted about 25% more than it has so far in this interglacial, but the Northern Dome remained largely intact.
However, should the Holocene last another 20 to 40,000 years, as some think possible, then the GIS could melt completely. The SD did so before in a longer, warmer interglacial, possibly twice.
Chimp May 1, 2017 at 10:10 am
2 questions:
1. Can the top boundary of Eemian ice be detected in Greenland ice cores?
2. How can max ice level be measured after melting has occurred?
1. Yes. But only if the ice is undeformed. IIRC only 1 core (NGRIP) has a clear Eemian (Sangamonian) section.
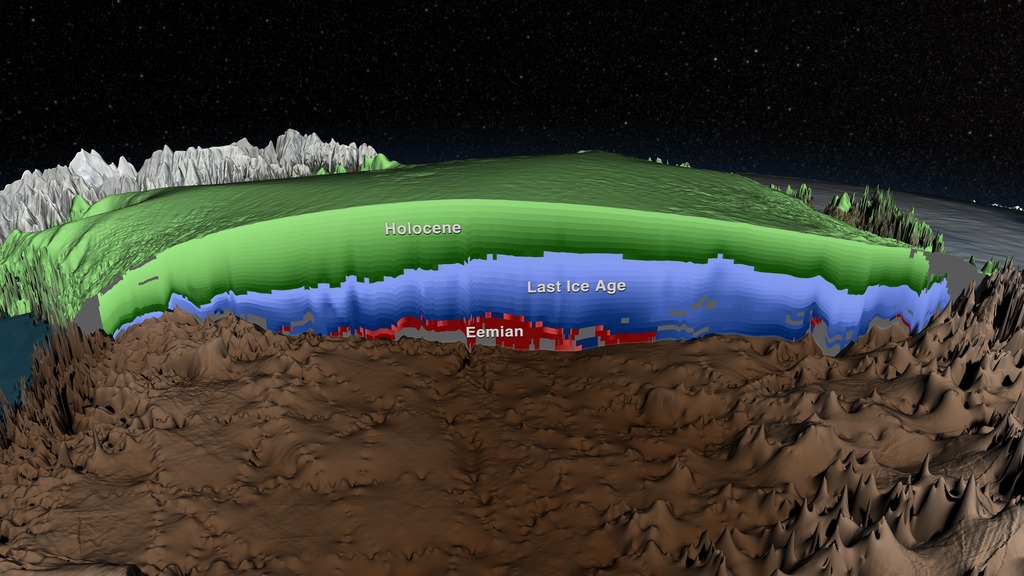
http://i90.photobucket.com/albums/k247/dhm1353/NGRIP.png
2. It can’t be measured.
Stevan,
Yes, the Eemian can be detected.
No, or with difficulty, but the max doesn’t really matter. Geology shows where how much mass must have been missing compared to now.
As for total melting, dating organic material from below the ice sheet indicates when the land was exposed.
Here’s one guess as to what was left after the Eemian ended.
http://www.rockyhigh66.org/stuff/greenland_ice_eemian3.png
Apparently they think their job, these days, is to tell you how/what to think. Forget facts, those are so patriarchal.
ROFLMAO! I love this line from the economist, “around and underneath a supposedly frigid ice sheet”. So now Warmists are doubting that the Greenland Ice Sheet is frigid, merely just common speculation they insinuate. I really wonder what goes on inside their supposed grey matter.
I’m guessing that they are trying to argue that going from -30C to -29.99C means that Greenland is no longer frigid.
RW same thing that goes on in NYC snow, its gets grey, granulates, and melts away. Nah, couldn’t be correlation is not necessarily causation. So I guess we don’t know what goes on in their “supposed grey matter”.
Everybody who knows anything about earth science (third grade and up) knows that we are in an interglacial period. What happens in interglacial periods? Yup – glaciers melt.
The only time that glaciers don’t melt is when we are in a glaciation period – what laypersons used to refer to as an “ice age”. It sucks to be a human during an ice age. It’s much better to be a human during an inter-glacial period.
Since the initiation of the Pleistocene, our planet has lived in a bipolar state – either a glacial period, or an interglacial period, or in one of the brief transitions from one state to the other. For the last 2.4 million years.
The very worst thing “man-made global warming” can do is just more of the same … continue melting the remnants of the same glaciers that have been melting the last 15KY or so … just as we’ve been doing anyway.
You forgot d) All of the above.
Alarmists are already far too much entangled in false reports to find a save way home to normality.
a) allergic to
b) ignorant of
c) willfully ignoring
d) far from reality
This years winter maximum was about the same as other recent years. What is “unprecedented” however is how slowly Arctic sea ice is melting this year.
The 30-year median melt in April is 1.175 million square kilometers. This year it was only 730,000 sq km. March melt was also lower this year.
As predicted here, sea ice extent is headed for the normal range. It’s already higher than on April 30 this year than it was in 2016 and 2015. Unusually cold Arctic SST, which even NOAA has grudgingly acknowledged but downplayed, is the main reason for the slow thaw, but air temperatures in the region are also back close to average.
http://nsidc.org/arcticseaicenews/charctic-interactive-sea-ice-graph/
Griff could still luck out on his assertion that this year was “sure” to set a new record low, if there are yet again August cyclones in the Arctic, but he has already been shown wrong that the ice would stay well below normal all year.
Last autumn, the Arctic had very much time to lose much heat from the upper reaches of the Arctic Ocean. Does no one notice what the Arctic really is? The biggest sink for the excess heat on the earth. And the longer the Arctic Ocean remains open in its peripheral regions, the greater the heat loss. Nevertheless, on the side of the NOAA is written, the ice sheet of the Arctic would lower the earth temperature. How can this happen when the ice isolates the water surface from the atmosphere? The albedo effect with thick ice is negligible in the arctic dark winter, since simply with such a non- insulation. In the arctic night there is no more heat in the atmosphere, which can be radiated. And also in Summer, except a few weeks at the ice minimum, the ice isolated the warmer water from the atmosphere, contrary to open water surfaces with a little frost in the atmosphere. But is the ice thinner, the heat release can happen also in late fall and early winter. At the time of the last real ice age the ice of the Arctic was about 3 times as thick as today, but the ocean below it was about 2-3 degrees warmer. What was not written after 2007 and 2012? But no, there were the years 2008 and 2009 and after 2012 came 2013, each year with an amazing rebound of the ice, where previously the early death was predicted. This year is even more striking, because the freezing in the 2016 fall and early winter was slower than ever and the Arctic Ocean is therefore very cold this spring and early summer. And therefore, the melting in the arctic is at a very slow pace.
Griff was told that this year might be like the rebounds from low ice previously, eg 2013. Ice was low in both 2015 and 2016, although not new records, so it could rebound rather than remain low for a third year. With the El Nino over, that might even be the way to bet. But actual extent will depend on the WX in August and September.
Basically Arctic sea ice extent has been flat for a decade, with some years lower, eg 2007, 2012, 2015 and 2016, others higher, eg 2009, 2013 and 2014, and the rest in between.
i think it will likely be observed that the ebb and flow of arctic sea ice extent, both summer and winter,drive the amo .
One has to ask what alarmists hope to accomplish with exaggeration and prevarication, other than risking their credibility. I presume that they think that the typical voter is too dumb or lazy to question the claims. Of course, that is an insult to the “common” person liberals pretend to represent.
Fear, Get enough people frightened of something they will demand that the Government does something about it. See the DDT response or the ozone hole thing. Tried and true tactics.
And yet we have Paul Ehrlich and his dismal record of incorrect prevarication carrying on with his sweet-ass career. Wrong about everything. Lauded a hero by the human haters.
At least the Malthusians are consistent… wrong 100% of the time.
I remember reading maybe 20 years ago now that the planes slowly ‘sank’ through the snow and later ice getting to 268 feet below the surface level. Along with some additional snow falling on top for 50 years. Obviously this area of the icecap didn’t get 80 feet of snowfall per year, making 5.4 feet ice per year. Recent ice cores tells us this basic fact.
The 2 Grace satellites are measuring gravity anomalies in the ice and bedrock below, so relying on Grace alone to measure ice balance alone may be in error if the underlying bedrock to great depth is changing density. The isostatic conditions are changing as well with LIDAR measurements to the actual surface so is difficult to get a real mass ice balance over all of Greenland.
The coastal glaciers are receding in some area’s as is obvious but the ice cap is relatively unchanged and would take thousands of years to melt, especially at the higher elevations in the interior.
Yep. The P-38’s mostly sank into the snow.
The problem with GRACE and bedrock is glacial isostatic adjustment (GIA). As ice sheets melt, the underlying crust rises (post glacial rebound, PGR).
The raw data from GRACE actually indicate that the Antarctic ice sheet is growing and Greenland is fairly stable.
The ice mass loss in Greenland is the result of subtracting the GIA from the raw GRACE data. The net ice mass loss is generally less than or equal to the GIA.
https://wattsupwiththat.com/2013/12/21/oh-say-can-you-see-modern-sea-level-rise-from-a-geological-perspective/
David Middleton
A frequent claim, but the “physics” of the airplanes does NOT support this myth.
A piece of metal, when liad directly on a ice mass (and slightly heated) WILL slowly sink into the ice mass as its pressure slowly melts the ice below the metal, the ice becomes water and moves, and the metallic mass moves down and again presses against more ice lower down. A very slow process, and depends on the metal being very heavy (compared to the ice) and very dense (with a high mass to contact surface ratio.)
A WWII P-38 is neither. Many that crash-landed in water stayed afloat for long periods, and these P-38 crashed because they were lightly-loaded (no guns, ammo, bombs, or cargo) for the long flight AND were out of gas! (No fuel forced them down.) They landed in smooth, “regular” glide slopes on the hard ice, and were essentially undamaged in body, lower body, nose, tail and wings. They would “float” above the ice, UNTIL more snow landed on top of them. The P-38’s would NOT sink in, but would be stable because the plane weighs less than the ice you are assuming it is “submerging” into by “pressure”. Further, the intact wings, body, and tail surfaces would RESIST further drops – even IF you assume that the full weight of the plane is on the small wheel area. (I will grant a near-certainty that they would sink 4 feet down when the tires deflate.)
No, the planes are 81 meters down because the ice increased in height by that much since WWII.
I stand mostly corrected.

The crash site was in southern Greenland:
http://p38assn.org/images/p38s/gg/greenland-lg.jpg
This area experiences some summer melting:
Some of the 61 m of ice overburden was due to the plane sinking during summer melt season.
Although it does look like that area of Greenland gets 1-2 m of snowfall per year:
So… More than 50 m of the overburden was probably due to snowfall.
No, they are 81 feet down because 81 feet of ice accumulated over them. The way glaciers work is snow falls on the top, and ice is squeezed out the bottom.
There is no evidence that the glaciers are 81 feet taller than they were during WWII.
85 meters: 24 meters of snow on top of 61 meters of ice. The crash site experiences some summer surface melting. Some (not most) of the overburden was due to the P-38’s sinking.
Since the crash landing the planes have moved about 10km downslope.
If sinking the weight of the engines would have meant the plane would have been found nose down. It was found level.
The P-38 was a twin-engine fighter. The engines were not in the nose.
And “Glacier Girl” was slightly nose-down.
http://p38assn.org/glaciergirl/images/GPR-measurement-concept.jpg
RACookPE1978:
You say to David Middleton
Sorry, but David Middleton is correct, and no heating and/or melting is required for a mass to sink through solid ice because of a material property of ice which was first discovered by Michael Faraday (of ‘electricity’ fame).
The property is why ice is slippery, why ice skates work, and is one of the reasons for doubt about paleo data from gas analyses of ice cores.
At all temperatures down to about -40°C all ice is coated with a few molecules thickness of liquid water.
So, the weight of an object resting on an ice surface pushes the object down into the liquid layer. This causes the liquid layer to displace downwards so the object sinks further.
The sinking is slow but can be increased by increasing the pressure the object applies to the liquid layer (e.g. by increasing the objects mass or reducing its vertical cross-section).
A nice demonstration of this effect can be used to amuse children at Christmas parties.
Place an ice cube on the top of a wine or bear bottle.
Attach two similar weights to a length of cotton thread; one of the weights at each end of the thread.
Place the thread across the ice cube so the weights hang down opposite sides of the bottle.
After some time the thread is seen to have entered the ice cube.
Eventually the thread exits the bottom of the ice cube.
The top and sides of the ice cube show no evidence that the thread sank through it.
Richard
RACookPE1978 and David Middleton:
This is an addendum to my above post. It adds detail that could confuse the clarity of my above post if it were not separate.
The empty plane would be lighter than ice so would move up (n.b. not down) through solid ice. This is similar to the reason why at any level in an ice core the ‘gas age’ differs from the ‘ice age’ often by centuries.
But the plane would not be empty. When covered with snow (firn) it would fill with melt-water during summer melt season. Hence, its bulk density would then be greater than that of ice (duralumin and steel are denser than ice) so it would sink.
Richard
Studies have found that:
1) The Greenland Ice Sheet may have receded tens of kilometers within its present day margins during the early and mid Holocene.
2) In many locations the ice sheet and mountain glaciers reached their maximum extents since the early Holocene during the Little Ice Age.
https://notalotofpeopleknowthat.wordpress.com/2014/04/06/we-live-in-cold-times/
Why should anybody be surprised that the ice sheet is getting slightly smaller again?
People who are unfamiliar with Quaternary geology have an excuse to be “surprised that the ice sheet is getting slightly smaller again.”
Science “journalists” generally have about the same level of scientific literacy as the general public… So, they have the same, lame excuse.
However, there is no excuse for climate “scientists” to be unfamiliar with Quaternary geology.
“The Greenland Ice Sheet may have receded tens of kilometers within its present day margins…”
The present day margins shown in the Greenland map at the top of the page are bogus.
http://www.rockyhigh66.org/stuff/Greenland6050'4345_map_zoom.png
The map dot is well within the large green ice-free zone surrounding the ice cap. On the map, anyway. Here’s a shot I took of the same area in 2004.
http://www.rockyhigh66.org/stuff/Greenland6050'4345_real.jpg
So much ice it’s overtopping the mountain ridges and flowing down into the fjords.
The white area on the map below the 1,000 m contour is where the ice is >10 m thick. The green area isn’t necessarily ice-free, much less snow-free.
The map dot is in the center of the photo, which is looking west. The entire top of the photo (and far beyond) is in the green area, and definitely > 10m.
The “dot” is right where two ice masses, presumably valley glaciers nearly merge…
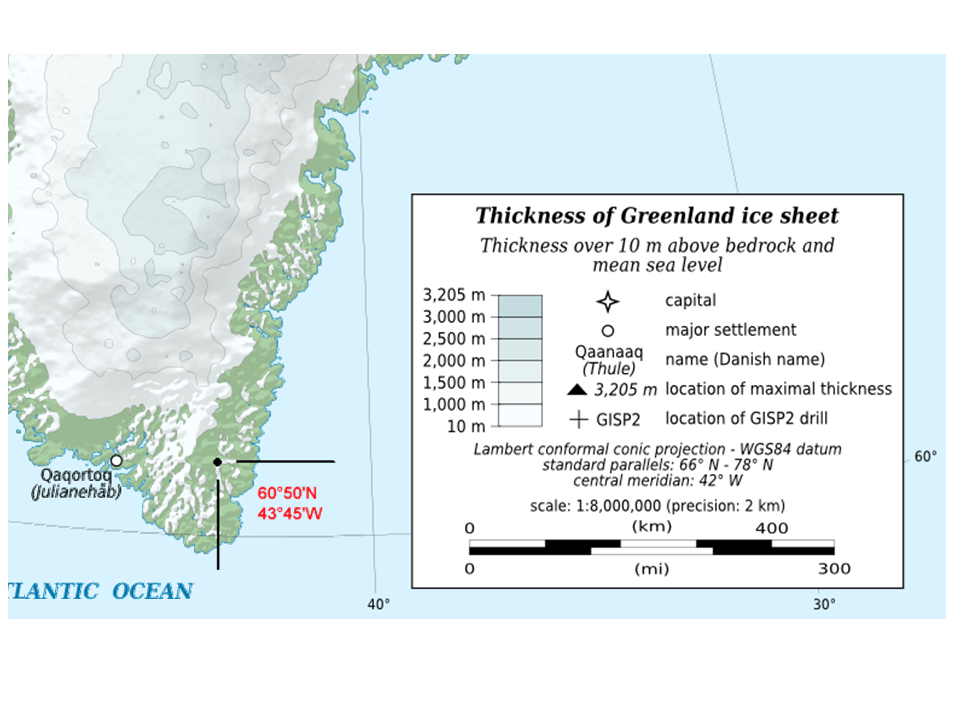


The “green” area doesn’t mean ice- or snow-free. It indicates that there is less than 10 m of ice. The “white” area below the 1,000 m contour indicates that the ice is greater than 10 m thick and less than 1,000 m thick. It’s an isopach (thickness) map of the ice, not ice and snow. It is not intended to be an ice and snow extent map.
Most of the “green” area along the southeast coast is clearly covered with ice and/or snow…
But, that’s not what the map is of.
Within the ice sheet, there are numerous cores and GPR cross sections which can be used to measure the thickness of the ice sheet. Now, I have no idea how the author of the map estimated the ice thicknesses outboard of the main ice sheet. So, it could very well be wrong. However, the tongue of ice trending from the rocky outcrop to the bottom of the photo looks like a valley or alpine glacier, it’s probably the eastward trending valley glacier on the map. The rest of the white on the photo looks like snow to me.
d) impervious to reason.
Good one.
d) impervious to reality
Hey, the good news is that Al Gore’s ice free Arctic summers are postponed by a further 26 years! I guess Al missed the scientists saying 2070. All of this feels like 1984 to me where statements can be redrafted historically at will.
he has another movie coming up this summer: An incoNvenient sequel: Truth to power.
http://www.imdb.com/title/tt6322922/?ref_=nv_sr_1
An Inconvenient Sequel: The Phantom Menace.
“alice does Dallas”
‘Even worse that we expected’.
It seems we always get these catch-phrases after a long period of nothing. Just to make sure we don’t go around believing our lying eyes.
You forgot D). All of the above.
Alarmists really need to stop partying so hard, drinking and doing drugs.
A longer term perspective of Greenland ice.
Yup. Earth has been cooling for 3000 years.
If you want to worry about climate, there’s your concern.
http://www.tonykieraldo.com/wp-content/uploads/2015/01/alfred-e-neuman.jpeg
Might as well worry about plate tectonics or entropy… 😉
Where was “all of the above” in the quiz?
B and C are incompatible…
b) ignorant of
c) willfully ignoring
You can be willfully ignorant by refusing to look at anything that might challenge what you want to believe.
“C” wasn’t “willfully ignorant.” It was “willfully ignoring.” You can’t willfully ignore something if you are ignorant of its existence.
If I willfully refuse to read a book, I’m ignorant of everything within the book.
You’re not ignorant of the existence of the book.
They aren’t ignorant of the fact that there are people who disagree with them (book). They are however ignorant of the arguments used by the people who disagree with them because they refuse to actually look at those arguments(contents of the book).
If:
Alarmists are ignorant of perspective.
Then they can’t be:
Alarmists are willfully ignoring perspective.
So true. This information has been put in front of them many times.
Facts and data are an enema to them.
David. thanks for the last graph.
I used a slightly higher total volume (different reference maybe) in my calculation and have been using this graph of Total Greenland Ice Mass to annoy ice worriers. they cannot refute it.
I think the difference is that I used the ratio of 375 gigatonnes per 400 cubic km (ice has a lower density than water). 1 gigatonne of water = 1 cubic km of water. Had I used a 1:1 ratio, I would have come up with same number you did.
Either way, 3,600 gigatonnes is nothing compared to 2.4 to 2.6 million gigatonnes.
[But the actual density of very thick static (ice cap) ice differs greatly from that of thin, fast-moving glacier ice, and both from “frozen” thin layers of sea ice. .mod]
Also ice becomes slightly more dense as it gets colder.
But no matter how you do the calcs.. the graph is still basically a dead flat line.
The 3600 Gt number is from GRACE, which is highly suspect over active volcanic regions,
Greenland has a massive intrusion of the Icelandic sack underneath the northern end.
Take those numbers with a grain of salt !
ps. I started with a larger volume from some reference somewhere. used the same density as you did.
Funny… Your ice mass looks like it’s about the same as my ice volume.
Of course, there are a wide range of estimates for Greenland’s ice mass and volume.
iirc, I started with 2.72 million km³.
Don’t know where I got the value from
As you say.. lots of different estimates.
I will use the value of around 2.4 x 10^15 tonnes from now on, so we match. 🙂
Estimates of the volume of the Greenland ice sheet vary from 2.6 to 5.5 × 10^6 km^3. The difference between 2.6 and 5.5 million cubic kilometers of ice is quite a bit larger than 3,600 gigatonnes. For that matter, GRACE derived estimates of recent (2003-2011) ice mass balance vary widely as do the glacial isostatic adjustments…
With ~±10% margins of error in modern satellite measurements of glacial mass balance and GIA accounting for up to 1/3 of the reported ice mass loss, it is truly amazing that a 0.15% reduction in the Greenland ice sheet during the 21st century can be identified with such robustness [/Sarc].
with henceforth use this one so we match. 🙂
It’s worse than we thought; Trump is cutting our funding!
This post does a great job addressing the Economist’s reference to ice mass loss in Greenland (pointing out that the Economist communicates the loss in absolute, not percentage terms).
Two points on this:
1. Is there a person with relevant background (Anthony himself for example) who could make this point visible to Economist readers, in a comment section, Twitter feed, or (absent something better) in a short letter to the editor?
2. Perhaps this post could be supplemented to address the Economist’s claim that “Arctic” sea ice extent has dropped by “more than half”? I am a casual student of all this, but I had thought that 1979-present satellite data showed a decline much,
much smaller than that (even putting aside the apparent non-representativeness of 1979 as a benchmark). So I was surprised to see that claim. Perhaps the percentage decline is smaller in the winter than in the summer, and the Economist is talking about the latter when it makes its “more than half” statement?
I now see that the article does have a comment section. A shortened version of this article there would be great. (The tone and tenor of comments there already is surprising — a healthy dose of challenge and skepticism. This suggests that it would be productive to add the facts above to the discussion.)
Never mind “perspective”. You need to “think of the children”.
Well, not really.
Arctic summers ice-free ‘by 2013’ (as predicted in 2007)
Scientists in the US have presented one of the most dramatic forecasts yet for the disappearance of Arctic sea ice.
Their latest modelling studies indicate northern polar waters could be ice-free in summers within just 5-6 years.
The bigger and more alarmed they are, the harder they fall……..
http://ocean.dmi.dk/arctic/meant80n.uk.php
http://www.climate4you.com/images/NOAA%20SST-NorthAtlantic%20GlobalMonthlyTempSince1979%20With37monthRunningAverage.gif
http://www.climate4you.com/images/AMO%20GlobalAnnualIndexSince1856%20With11yearRunningAverage.gif
NSIDC has extent GREATER than 2006, 2015, 2016, and it will probably shortly overtake 2004, 2007, 2014.
MASIE has sea ice extent above 2006, 2007, 2009, 2011, 2015 and 2016, and probably catching 2013 in the next couple of days.
I think the DMI has a graph of the Greenland ice that differs from NOAA. One shows loss and the other gains.
dmi also changed how it measures arctic sea ice extent last year .not sure if the new algorithm has been applied to the previous years displayed on the chart .
A further perspective on Greenland SMB
As we all know, the late 1970’s was the coldest period in nearly a century, (great time for a reference period for the AGW scam)..
…and 1930/40’s was a peak, probably about the same as now.
Graph looks incorrect compared to the stuff from Denmark itself. See graph from “Latitude”
What these ‘researchers’ need is a quick trip to the Total Perspective Vortex (so scary it has capital letters)
http://www.urbandictionary.com/define.php?term=Total%20Perspective%20Vortex
“The shrinkage is all the more perturbing because its dynamics are not well understood.”
Oh, my. It’s going to be a catastrophe because they don’t understand what’s going on. Give me a break!
This is exactly when we need Griff (BTW where has he/she/it been lately? Maybe took some vacation?).
Anyhow, Griff, besides being a polar bear expert, a de-certifier of polar bear experts (didn’t like Susan Crockford), Griff knows all about ice. Actually the less ice there is, the more he knows about it. And (this is very important) he/she/it is CONVINCED global warming only happens in the Arctic, not the Antarctic (or both).
Anyhow, we need him in this conversation.
Griff isn’t a troll… two different entities.
(in fact, I miss Griff so much, I’m going to post for him/her/it)
Ahem….
Actually, all the Greenland ice has already melted (this was reported in the Guardian just the other day). Greenland has been renamed “Ireland” and is now being farmed for the first time in human history (I would provide a link for this, but my notes from the Mother Ship didn’t include one).
The resulting sea level rise has been devastating. People in NYC used to go to Fire Island for fun & sun & sea. Well, there are no more fires, and sea has risen so much (you can actually hear it if you stand next to the water), the only thing above water is a long thin strip of what used to be mountain peaks. Interestingly, South Bay is just to the north of this.
Griff is my buddy… picking on him in abstencia isn’t cool.
Actually, I was shooting for troll ridicule.
Possibly Griff is absent due to lack of abstinence.
Is this the first post-election indicator that the Paris Climate Stupidity is walking dead? (From 13:30)
https://youtu.be/40iJUAHej14
“400 cubic km ice cubes per year!!!”
Nooooo! Think of the vodka! Won’t somebody please think of the vodka?
Shaken or stirred?
I’ll say C: Willfully Ignoring.
As long as there are scientists digging through permafrost to figure out how the Vikings lived there before when the permafrost wasn’t there,,,,,
For the quiz you forgot “d) all of the above”.
Great article. And since there are credible reports Greenland is gaining not losing ice mass, I think we can dismiss this report as yet more contrived lying.
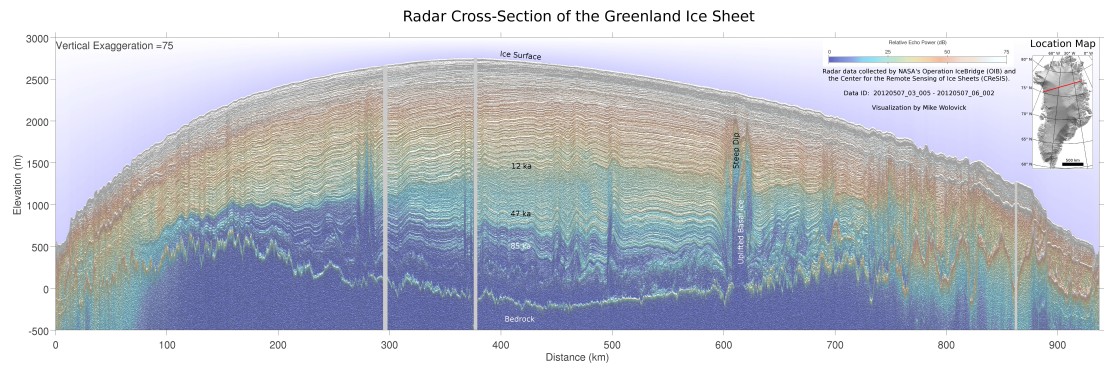
Wow. Nice radar cross section. That’s some seriously cool reflectivity.
Actually, the report is intelligently written — with close reference to the Manual on Scientific Alarmism.
1. Predictions must be sufficiently scary to ummm … scare people. Check!
2. Predictions must be close enough to justify impetus for action. Check!
3. Predictions must be sufficiently remote so that those responsible won’t be around to be held accountable when the predictions fail. Check!
Note: “It’s worse than we thought” is so universally applied as to be unnecessary in any manual.
Come 2040, it will be miraculous if anyone can remember this prediction. However, with luck, the children of certain scientists will have made it through higher education. We have to think of the children.
The bigger they open their mouths, the larger chunks of humble pie they will have to swallow, sooner or later.
I am a hard copy subscriber to the The Economist. I am compiling an old fashioned scrap book of news paper clippings on ‘global warming’ to become a coffee table book for my children from which I hope they can learn something about a fundamental flaw in human nature that never changes: group think. Even the most intelligent are vulnerable.
Of late, hardly a weekly publication of the The Economist exists that does not include something on ‘global warming’ and its impact of destruction and pending gloom. They have swallowed it, hook, line and sinker. Pity, as it does still remain an excellent publication IMO.
Oh – and their other gripe is Brexit. Man, are they sour about that
weep for what the Economist once was, and what it has now become
New Paper: Greenland Gained Ice Between 1940s-2000s, Added Just 1.5 cm To Sea Levels Since 1900
http://notrickszone.com/2017/05/01/new-paper-greenland-gained-ice-between-1940s-2000s-added-just-1-5-cm-to-sea-levels-since-1900/#sthash.CAVuDbIi.dpbs
http://notrickszone.com/wp-content/uploads/2017/04/Greenland-Ice-Sheet-Mass-Balance-Fettweis-2017.jpg
It may be rude of me to say this, but I am waiting for the moment when I run into someone having a panicky, hysterical panic attack over Greenland losing a chunk of ice (which becomes an iceberg) in the spring/summer calving season. If that ever happens, I do hope that I have a glass of ice water or iced tea to throw in that panicking idiot’s face. I know: that’s a rude thing to do. But I will enjoy it.
d) for deranged, dastardly, despicable, dishonest, disturbed, demented, delirious, disoriented, discombobulated.
Fill in the blank:
Alarmists are _________ perspective.
a) allergic to
b) ignorant of
c) willfully ignoring
d) mendaciously excluding
Glaciers grow only at the top – from snowfall that accumulates from year to year. Glaciers melt at the top and the bottom. Top melting is episodic and depends on variable we normally call ‘weather’ – temperature, sunlight, wind. Glaciers melt at the bottom from geothermal heat that slowly but steadily flows to the surface from deep in the rock.This heat is caused by the radioactive decay of minerals (mostly uranium and thorium inside the earth), and is for all intents and purposes constant over millennial time scales.Only geological processes over geological time scales can alter this heat flow. The maximum temperature of the rock on which the glacier sits is set by the melting point of water ice to 0 °C. The constant presence of ice water at the interface lubricates the downhill flow of the glacier. AFAIK, this process has not been empirically examined, and contributes an unknown (but probably significant) amount to the glacial melting process. On the other hand, water produced by surface melting can melt its way into the glacier when it can refreeze or join the subglacial rivulets or fill the microscopic pores left in the ice from the initial snowfalls, ‘aging’ the ice. into a less porous form.
Too many unknowns…some are unknowable.
Did one of these cubes fall on someone? I don’t think anyone was hurt.
‘SWIPA estimates that the Arctic will be free of sea ice in the summer by 2040. Scientists previously suggested this would not occur until 2070.’
Anyone who reads realclimatescience.com knows this is a felonious lie. They have been predicting it would be gone every year for the last 10 years. NOW! Not 2070.
Lately the Economist has gone off the deep end on science and politics. I’m canceling my subscription.
For god or evil statistics is always used to present numbers in a biased way since you use the numbers and grafs to put an emphasis one some part off the data. That way it is allways important to do a reality sheck as done in this article and it goes both ways. Even if the data presented in a graf is correct as fare as you now, it is importen to do every sheck you can to ensure that it really is so.