Guest essay by Alberto Z. Comendador
In two previous articles I made a point that seems inarguable but that advocates of emission cuts seldom acknowledge: the only worthy metric of progress in reducing emissions is the CO2 intensity of GDP, which one could also call CO2 efficiency. Looking at absolute emissions is absurd because absolute emissions depend largely or mostly on GDP and the growth thereof, which are of course unknown (especially if we’re making projections about the year 2100!).
In any case, climate policies aren’t supposed to reduce emissions by reducing GDP; sometimes advocates of emission cuts even brag about the economic benefits of their policies. So they can only work by reducing CO2 intensity, which is to say by increasing CO2 efficiency.
A second point hardly ever acknowledged is that CO2 efficiency isn’t static: it’s growing most of the time, in most places. It would have grown without the COP meetings and it did grow before the Kyoto agreement was signed – at a faster pace than thereafter.
Since CO2 efficiency is nearly always rising, using an absolute value doesn’t make much sense, especially for comparing progress across different countries and eras. Of course CO2 efficiency was higher in 2015 than in 1965, but that doesn’t mean the policies were better in the former year than in the latter. Likewise, the fact that Sweden is more CO2-efficient than India tells us nothing about the effectiveness of each country’s policies. What matters is the rate at which CO2 efficiency rises. The ‘rate of increase in CO2 efficiency’ is a mouthful, so instead I call it the rate of decarbonization.
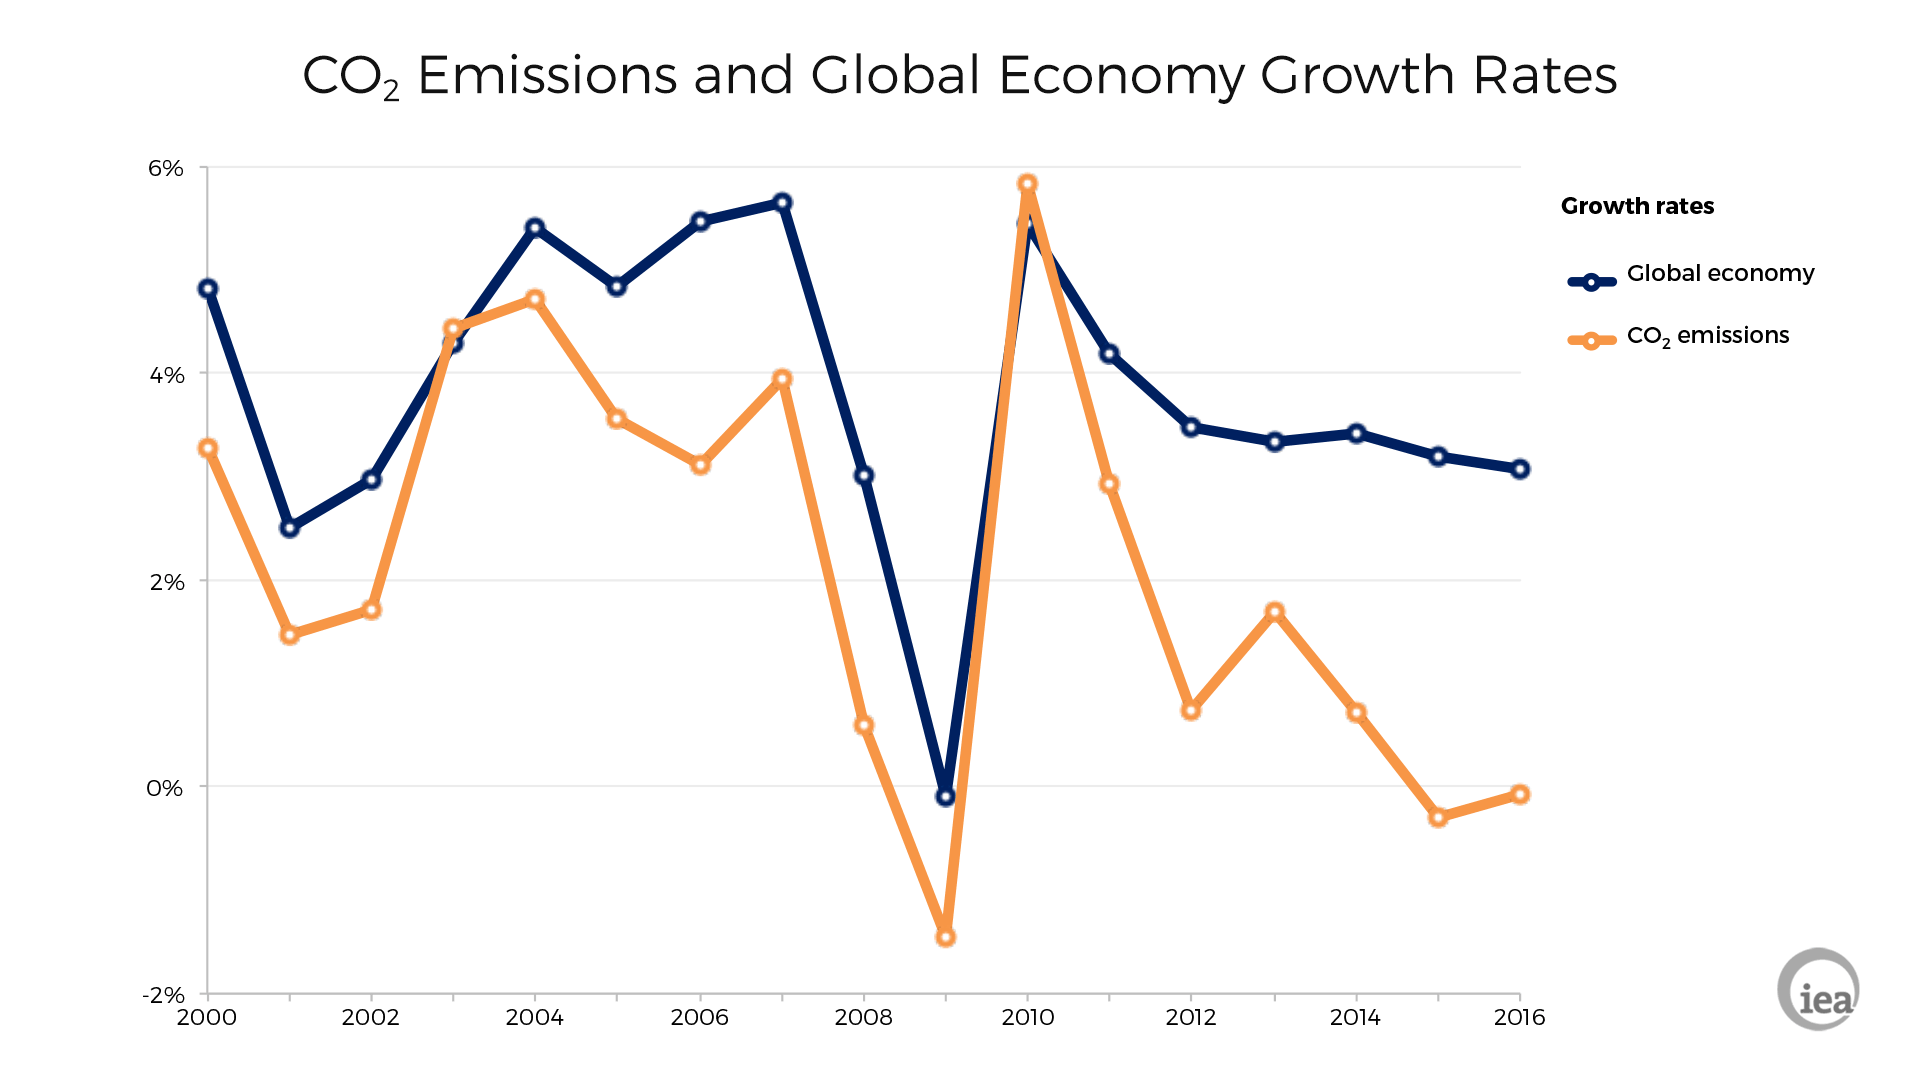
The last three years have had a high rate of decarbonization, which has prompted some bureaucrats to declare ‘victory’ over CO2. In particular, the International Energy Agency has just come out with this macro-cherry-pick:

They must think GDP was invented in 2000! Guess what happened before that year?

Ooops: turns out the decarbonization seen in the last three years isn’t that ‘abnormal’ by historical standards. It’s higher than the average, but then the 2000-2013 period had abysmal rates. And, no matter what starting period you choose (Kyoto 1997, Energiewende 2000, etc), the period during which decarbonization policies were implemented had a slower rate of decarbonization than the previous.
(I couldn’t update my chart with 2016 data because BP hasn’t published those emissions yet. But every time someone claims climate policies have achieved this or that, send them the second chart).
What will happen if we do nothing?
In the last article I estimated that climate policies could only avert 0.38ºC of warming by the end of the century. The assumptions behind this estimate were:
- GDP growth remains constant at the 2011-2015 average, i.e. 2.7%. In reality, GDP growth has been decelerating; constant per capita growth would make more sense. But I wanted to be ‘pessimistic’ emissions-wise.
- The fraction of emissions that remain in the atmosphere is 45%.
- There were two possible rates of decarbonization: ‘do nothing’ (1.1%) and ‘do something’ (2.1%)
- The transient climate response is 1.35ºC
Under the ‘do nothing’ scenario, concentrations reached 754ppm by the end of the century; that’s 22% more than under the ‘do something scenario’ (619 ppm) and, due to the logarithmic effect of CO2, it’s equivalent to 28.5% of a doubling of CO2; 1.35ºC x 0.285 = 0.38ºC.
What would have happened if we’d done something?
Here’s where it gets hilarious. Some claim not only that we could avoid the allegedly bad stuff that will happen by the year 2100, if we would only start decarbonization now. They claim that we area already seeing the impacts of our emissions – and that these could have been avoided!

Well, well, the Charney report came out in 1979 and was the first official assessment of climate sensitivity and anthropogenic global warming; hardly anyone outside the scientific community was reading on the topic before that. So let’s assume that, way back in 1979, the whole world saw the light and started decarbonizing. And let’s do the math.
Over 1979-2015, the world emitted about 890 billion tons of CO2 from fossil fuel combustion; the rise in CO2 concentration over the period was of 50 parts per million (roughly from 355 to 405). It takes 7.81 billion tons of CO2 to add 1 ppm to the atmosphere, so we actually ‘emitted’ 890,000 / 7,810 = 114 ppm; the airborne fraction, i.e. the emissions that remained in the atmosphere, was 50 / 114 = 44%. Or thereabouts.
Nobody knows what the airborne fraction would have been if we had emitted less CO2, so I will simply keep that 44%. Now, if the decarbonization rate had been 1% faster, we would instead have emitted 732 billion tons of CO2.
Wow! That’s 158 billion tons less! But wait a sec. All these tons add up to just over 20ppm. Even worse: with an airborne fraction of 44%, the actual difference in concentrations by 2015 would have been only 9ppm. Now you see why illustrating this with a chart would be rather pointless – it would show two lines running near-parallel.
Basically, if we had started to ‘mitigate’ warming back in 1979, instead of 405ppm we would have ended the period at 396ppm. And how much cooling is that?
An increase from 396 to 405 is a rise of 2.27%. Now, due to CO2’s logarithmic effect, this is in fact equivalent to 3.6% of a doubling in CO2 concentrations, because 1.0227^31 = 2 and 1 / 31 = 0.0326
We multiply 0.0326 by the airborne fraction of 1.35ºC and we get 0.04ºC.
That’s right. That’s not a typo. If the whole world had decided to ‘do something’ about CO2 way back in 1979, and we had kept that program going for 36 years, and the program had actually been successful (unlike the measures we did implement), then by now temperatures would be 0.04ºC cooler.
All I can say is these policies are, indeed, the height of folly.
DATA: I got global GDP data from the World Bank, CO2 emissions from BP, and CO2 concentration from NOAA. I put it all together in this file.
PS: it would a bit unfair to single out Justin Gillis without giving him the chance to respond. But perhaps he won’t see this article, and I suppose he gets many emails. Just to make sure he doesn’t miss it, you may tweet him @JustinHGillis
In 1979, we were still being warned of the oncoming Ice Age, so the advice would have been towards more CO2, not less.
Which is probably still true. Though, ice ages have a slow onset so we likely wouldn’t see the effect for quite a while.
But why wait? Let’s light our hair on fire and panic (and demand trillions of taxpayer funds) NOW!
Whew! I’m glad someone remembers what happened to start the last ice age.
In 1976, the UK experienced a major warm summer, but before that it was mostly cold.
But it would appear that the summer of 1826 may well have been warmer than 1976.
Prior to the endless adjustments to the data, this was the view of Lamb who was head of CRU (the Climate Research Unit, of HADCRUT fame). See:
There were also some very warm summers in Tudor times, particularly during the reign of Henry VIII’s fifth wife Catherine Howard circa 1540 to 1542. I think that it was 1541 that was considered to be a summer without rain and was extremely warm.
I should have mentioned that the extract that I posted came from, HH Lamb: Climate, History and the Modern World – at page 251.
;
@The Sage, actually the advice for the coming ice age was the same for global warming – the de-industrialization of the western world and a drastic reduction in the population of the planet.
Indeed, and THAT is how it (supposedly human-induced climate catastrophe) should be readily identified as BS. When the “climate catastrophe du jour” about faces 180 degrees and YET the supposed cause (human fossil fuel burning from industrialization) and solution (reduction in fossil fuel burning, via de-industrialization and drastic population reduction) remains the same, you know it’s all BS.
Please nobody dispute this. Its right. I couldn’t see any flaws in this at all. So no conflicting statements. Not even ones that based on facts. Facts and science is not appreciated on this site. We have to get behind this type of stuff then we can reference it and make peolpe think we know what we are talking about. I know it sounds crazy but hey this is the site for that sort of stuff.
Why would we not dispute it? If we find errors I assure you it will be disputed. You obviously don’t know what the folks on this site are like, do you?
By the way I’m waiting with bated breath for your analysis of this piece. Take your time, make sure you get it correct before you post.
Griff has a new sock-puppet?
What if we had listened to them in 1969?
How much of the catastrophic cooling would have been reduced if we had implemented their prescription of radically cutting industrial emissions? Well, now the “experts” say that that would have increased the catastrophic cooling. A joke.
It’s funny how these types forget that “The Press”, and thus now the internet, never forgets.
The ANSWER to global cooling is right before you at the bottom of the page: The 1970 Ford Torino Cobra a CO2 spewing behemoth if there ever was one. Thank you auto industry for saving us!
Too funny. I missed that. Preferred the Plymouth Cuda myself 🙂
Wow! 35 cents a copy. I want one.
One gets the impression that de-industrialization is the goal, NOT climate ‘control’.
And arguably .04C is a worst case scenario, as the transient climate response is probably less than 1.35C.
If the last 50 years is any guide, it’s probably less than 0.2C.
The NOAA CO2 growth rate table you linked to shows a difference of 69 ppm between 1979 and present, not 50 ppm as stated. The 69 ppm figure is also supported by the NOAA absolute CO2 figures (337 ppm in Jan 1979 versus 406 ppm in Feb 2017): ftp://aftp.cmdl.noaa.gov/products/trends/co2/co2_mm_mlo.txt
If that’s the case, then the fraction that remained in the atmosphere was 69 /114 = 61%, assuming your other figures are right. How does this affect your other calculations?
The affect is ZERO.
Yes, that was a bit sloppy – my fault. 114ppm is what we emitted from fossil fuel combustion over 1979-2015, but total emissions (including cement and land use) are unknown. If total emissions had been for instance 140ppm, then the airborne fraction would be 50% (69 / 140). Saying that total emissions are unknown may sound like handwaving, but it’s the truth.
The change to my final calculation is almost none; with a 50% fraction we’re talking about 10ppm, with 60% it’s 12ppm. So instead of 0.04ºC the result would be 0.045 or 0.06ºC.
Thank you Alberto.
It has been found that the original calculations of the climate sensivity of CO2 are too great by more than of a factor of 20 because the original calculations do not take into consederation that a doubling of CO2 will cause a slight decrease in the dry lapse rate in the troposphere which is a cooling effect. So we are talking less than .002 degrees C of warming.
Will Haas,
consederation / consideration
always great to hear of You. Seldom.
Thanks – Hans
that a doubling of CO2 will cause a slight decrease in the dry lapse rate in the troposphere which is a cooling effect. So we are talking less than .002 degrees C of warming.
___________________________________________
We don’t know if the outcome of CO2 impact goes up.
Sideways.
Or down. ( 1/3 ) Monte Carlo bets.
/ monte carlo is overcrowded by samplers of thrown away bet tickets off the grounds /
That’s the worst case for actions by the whole world.
But Governments must make policies for their own nations only. The impact of decarbonisation must be considered as that 0.04% reduced by the proportion of emissions that that single country produces.
For the US that’s way less than half (for the UK the impact is less still).
And remember, if the US decarbonises it adds costs relative to some other countries that don’t.
These are not the best thought out policies.
“These are not the best thought out policies.”
World War Two was a minor disagreement.
Reducing “carbon” impact in the West arguably only increased it
in the East.
I remember reading that China purchased a German steel mill,
disassembled it, moved it to China, and started producing steel
with far less environmental oversight.
I see no environmental gain for the world in such moves.
Ah yes, the Law of Unintended Consequences, as applied to the Eco-Fascists, is TRULY ironic, isn’t it? The very stupidity they lobby for ends up causing MORE pollution, not less – and we’re talking about REAL pollution, not CO2, which is not pollution at all.
The Justin Gillis post picture looks like a causeway by the sea so I guess the AGW horror happens roughly twice every day (during spring tides anyway). The Broomway on UK East Coast is at least 600 years old and is still useable. You can sail over it into Havengore on the right tide (and with the right boat). This from ‘Swin, Swale & Swatchway’ gives a flavour ‘The tide made up very fast, and soon we weighed and started for Havengore over the sands, but the sight of a horse and cart crossing the entrance of the creek shewed us that we were too soon to get in; we therefore brought up again, and by-and-bye one of the light barges made a start and stood in under foresail and topsail.’
http://www.broomway.org.uk/
And all this based on the still unproven hypothesis that raising the percentage of carbon dioxide in the real world atmosphere will lead to atmospheric warming.
Before all the clever mathematics is generated based on this unproven but falsified hypothesis, would it not be a good idea to show that the observational evidence supports it?
Would it not be a straightforward experiment to prove/disprove the supposed back radiation effect of CO2 in a lab experiment? e.g. a square meter of earth in a lab setting; T regulated to 90F; measure power reqd to maintain T w&wo a high Cconcentration of CO2. The effect should be calculable given the theory of heating from back radiation. Seems very simple to me – a dumb engineer,
Al Gore and The Science Guy tried to fake that experiment. They still have not retracted it, even though they’ve been exposed as a fraud.
The problem is the GHE of added water vapor and CO2 arises because of the temperature lapse rate in the atmosphere. The temperature lapse rate arises as a consequence of the vertical pressure gradient. The vertical pressure gradient due to gravity compressing a vertical column of air.
Now do you see the problem of trying to replicate the GHE in that laboratory flask of air?
There you go. Trying to murder a good hypothesis with actual, real world facts.
“We multiply 0.0326 by the airborne fraction of 1.35ºC and we get 0.04ºC.
That’s right. That’s not a typo.”
I think “airborne fraction” is a typo. But more seriously, I disagree with your reducing by the airborne fraction. If you reduce the emissions by 18%, then you reduce the resulting increase of CO2 by 18% (steady AF). That’s about 24 ppm. About 0.1°C.
But overall, the problem with your logic is that you have assumed quite a small mitigation (1%). And yes, a small mitigation will have a small effect.
You missed the first part about increasing CO2 efficiency. Your desire for large mitigation means drastically reducing GDP growth; the road to global poverty. Which is where Holdren wants to put humanity in order to drastically reduce global population. Not just bad policy, but ruinous policy. Which is the policy agenda of the Club of Rome.
Ok, so in order to stabilize CO2 completely, we only need to reduce emissions by 44%, not by 80-90% as has been claimed sometimes. In fact, if you’re right we can reduce the rise in concentrations to a very manageable 1ppm/year, simply by reducing emissions 20%. Suddenly the climate crisis doesn’t sound so urgent!
I don’t know what the ‘new’ airborne fraction would be, or would have been. Neither does anyone else. If a ratio of 100% applies to emission reductions, then we’d be talking about 20.5ppm or 0.09ºC. Since Justin Gillis was talking about the effect of warming on coastal flooding, I’ll go on a limb and say the floods seen would have been pretty much the same if temperatures had been 0.09ºC cooler.
As for ‘small’ mitigation, the historical decarbonization rate is 1.1%, so an additional 1% doesn’t sound small to me. Specially seeing that all the climate policies adopted so far haven’t moved the needle at all (the rate has actually gone down).
The measurable affect would have been a reduction in crop production requireing more land and water to get the same bio-mass.
“Ok, so in order to stabilize CO2 completely, we only need to reduce emissions by 44%, not by 80-90%”
No. The problem with your arithmetic is that the figures you quote – 890 billion tons etc, are after application of AF. We actually emitted about 2000 Gtons. Then, with the reduction, you take out the AF again, which is wrong.
To stabilize CO2 if AF stays constant, would require reducing emissions to zero. As FE says below, AF would not stay constant, so a smaller reduction would be enough. But you need to work out how AF would change.
The 890 billion tons figure is the gross emissions from combustion over 1979-2015; see the Excel file.
So the reduction of 158 billion tons is before applying the airborne fraction. As stated, if a ratio of 100% applied, then we’d be talking about 20.5ppm or 0.1ºC.
“The 890 billion tons figure is the gross emissions”
Apologies – you are right. I made a spreadsheet error adding them up.
If you reduce anthropogenic emissions by 18% then, on the assumption (for argument’s sake) that anthropogenic emissions are 5% of the total, you have reduced the resulting increase by 0.9% or about 1.2ppm.
No?
“No?”
No. Anthropogenic emissions are approx 100% of the total. Other exchanges are just cyclic, and have been going on forever with no net rise. What changed to make CO2 go from 280 to 400 ppm?
Nick Stokes, sorry but BS – as a lawyer would say, “facts not in evidence.” What caused CO2 levels to:
Increase by 2250ppm 550 million years ago?
Increase by 400ppm 450 million years ago?
Increase by 1000ppm 400 million years ago?
Increase by 1500ppm 250 million years ago?
Increase by 1000ppm 175 million years ago?
ALL before there WAS any human activity to blame it on?!
http://www.bing.com/images/search?view=detailV2&ccid=hgdl%2bymS&id=EF0D186785DE202EBBBC94541325F1B1A43D962E&q=geocarb+co2+vs+temp&simid=608032938038134308&selectedIndex=39&ajaxhist=0
The problem with the airborne fraction is that it isn’t only caused by the human emissions of any year but also by the net sink rate which depends of the total CO2 increase (pCO2 – pressure) in the atmosphere above the long-term steady state between ocean surface and atmosphere. Currently that is around 290 ppmv for the current average ocean surface temperature, which is slightly influenced by temperature (~16 ppmv/K).
That the AF is relative constant over the past 57 years is just coincidence as human emissions increased slightly quadratic over that period, a fourfold since 1959, but so did the increase in the atmosphere and thus the net sink rate and the AF remained more or less constant around 50%.
If human emissions would remain constant, the increase in the atmosphere would go assymptotic to a new value and the AF would reduce assymptotically down to zero the moment that the pCO2 in the atmosphere is high enough to push as much CO2 into the (deep) oceans (and vegetation) as humans emit.
For the current emissions of ~4.5 ppmv/year with the current e-fold decay rate of ~50 years, that would be at a pCO2 of 4.5/0.02 = 225 ppmv above the equilibrium of 290 ppmv or roughly over 500 ppmv.
For any different constant emission rate the same factor 0.02 applies…
There is not enough accessible fuel accessible to bring the level up to 500 ppm in 50 years. Things could change, but from ‘what is known’ and what could be accessed and burned (uselessly or not) the upper limit is about 540 ppm which would require a huge increase in coal combustion to the point of reaching ‘peak coal’ about 2070.
If, by then, there was a significant cooling event for a solar cycle or two, the oceans would absorb much more and sighing 500 would not be on the agenda.
Clearly, if such a small amount of .04 C warming would have been the temperature differential since 1979 had we slowed emissions since then, then perhaps our optimal climate has nothing to fear. Increasing the atmospheric trace gas CO2 40% from 280 ppm to 402 ppm would appear to be the least of our problems.
Either way, .04 C appears to be in the margin of error in the grand scheme of things. If climate is non linear dynamic and chaos is introduced into the equation, or lack of chaos, then that changes everything. This is the main problem with climate change predictability – everything changes every thing and there is no way to accurately predict a chaos event. Yet. The long term climate record shows that it plugs along in a particular direction due to predictable orbital and solar forcing etc, until it doesn’t and climate changes abruptly on a dime. What exactly causes that has to be some extreme external force on the climatic system to cause such rapid deterioration from the norm.
If we have a black swan event caused by chaotic “out of left field event” such as increased random severe vulcanism, then perhaps we miss a growing season or two. Imagine if the 1815 Mt. Tambora eruption happens in April 2017, and there was a year in the northern hemisphere with no summer. Any short term catastrophic cooling and we are in very big trouble. A little warming might just be a small insurance policy against that although in the long term for the last 2.5 million years we always wind up in an ice age sooner or later. With 7.3 billion people now on the planet, any disruption from our abnormally long period of optimum climate will be a game changer for the human race.
Easily counteracted by walking 120ft up a hill
Leo – thanks for putting things in perspective.
0.04c Globally? Really?
What we are seeing is not a de-carbonization of GDP, but a hydrogenation, as coal is being progressively substituted in share of energy produced, by natural gas. The energy content per atom of carbon is much higher for methane than coal due to the nature of the C-H bond versus the C-C bond.
As natural gas reaches its peak, it will be up to nuclear and renewables to reduce the share of coal and natural gas, if they are up to the task.
http://pubs.acs.org/subscribe/archive/ci/31/i01/figures/1557chen1.gif
I have often pointed that out, namely burning natural gas rather than coal is in itself decarbonisation.
The switch from coal to natural gas is real, but in my view is also just one of several factors. Higher share of GDP coming from low-energy-intensity sectors such as health care, switching from letters to emails, more efficient engines… rising efficiency is pretty much everywhere.
Based on the dis-proven assumption that atmospheric CO2 increases will cause the temperature to rise.
The evidence: rising atmospheric CO2, yet no correlated warming (The Pause).
This evidence suggests strongly that CO2 does not warm the atmosphere.
Hence, any efforts to make CO2 emissions more “efficient” is pointless. and irrelevant to reality.
Personally, I’m not prepared to capitulate to this ‘CO2 is warming’ premise.
“Hence, any efforts to make CO2 emissions more “efficient” is pointless. and irrelevant to reality.”
Pointless, not really. Controlling CO2 emissions is the way industry would become more efficient without out government intrusion. When governments gets involved and impose mandates and provide subsides free market pressures go out the window. Case in point Tesla Motor Co. Before Tesla received Co2 credits and government subsidies they had orders a year in advance. Now, we tax payer help the rich buy cars and solar panels.
OCW., Thanks for your response.
Pointless as related to climate.
Fuel efficiency has the side effect of lower CO2 emissions. However; lower CO2 is not the goal, fuel efficiency is the goal.
The natural gas boom has lowered CO2 emissions and makes the US look like a Kyoto player.
The truth is we’re just burning more gas because it’s cheap.
Dis-proven even before that; with not only “no” correlation, but REVERSE correlation, 450 million years ago, with TEN TIMES the CO2 in the atmosphere as we have today, and RISING (to 11 times what we have today), while the temperature went from “hot house” to “ice house” for millions of years. CO2 doesn’t “drive” ANYTHING. It’s all hypothetical BS.
Monckton has been banging a similar drum for years. His goes something like, if the world bankrupted itself we could manage to reduce global temperatures by 0.03 degrees C.
We keep talking here as if man is responsible for most of the atmospheric c02, which is rubbish. C02 stays in the atmosphere from 4 to 6 years. The idea it has never been above 400ppm is accepting horribly cherry picked ice core data along with a 70 year smoothing average applied to the data. Not to mention the failed models use 100 years if I am not mistaken. To get nice smooth c02 figures, when c02 measurements can Flux by 600ppm in a single day, is the ultimate base fabrication they start with. Almost all atmospheric c02 is due to the RESPONSE of oceans to warming..it’s time we stop playing their game about “safe” or “normal” co2 levels. See dr. TIM BALL, how and why the ipcc demonized c02.
ripatheism,
Sorry, Dr. Ball (and several others) are wrong on this: the residence time of CO2 is ~5 years, but that is the average time that a single molecule CO2 (whatever the origin) remains in the atmosphere, before being exchanged with a CO2 molecule from another reservoir. That doesn’t remove one gram of CO2 mass out of the atmosphere.
The e-fold adjustment time needed to remove any injection of extra CO2 mass (whatever the origin) above the dynamic equilibrium out of the atmosphere is ~51 years, or a half life time of ~35 years.
It is like the difference between the turnover of goods and capital in a factory and the gain (or loss) that the same factory makes. Knowing the turnover (residence time) doesn’t tell you anything about the gain or loss (adjustment time) of the same factory…
Ice cores indeed are smoothed averages, but that depend of the snow accumulation rate. The resolution is between 10 years (past 150 years) and 560 years (past 800,000 years). Any increase of 110 ppmv in 165 years would be visible in every ice core (no “models” involved, just direct measurements), be it with a lower amplitude.
600 ppmv change in a single day is what you can measure midst a forest, where many of the historical measurements were taken (and thus of little value). +/- 4 ppmv in a single day is what you measure away from sources and sinks like at Mauna Loa and +/- 1 ppmv in a single day is in (ice) deserts like the South Pole…
Your argument is that CO2 is somehow in “stasis” absent some “injection.” Since CO2 SOURCES AND SINKS OTHER THAN HUMAN CO2 EMISSIONS AREN’T EVEN BEING MEASURED, how do you know there isn’t an “injection,” or a “sink” accepting less, for whatever reason, first of all, and how do you know that any change in CO2 level has been caused exclusively or primarily by human CO2 emissions?! The short answer is, YOU DON’T.
I’ll repeat what I said to Nick Stokes above:
What caused CO2 levels to:
Increase by 2250ppm 550 million years ago?
Increase by 400ppm 450 million years ago?
Increase by 1000ppm 400 million years ago?
Increase by 1500ppm 250 million years ago?
Increase by 1000ppm 175 million years ago?
ALL before there WAS any human activity to blame it on?!
http://www.bing.com/images/search?view=detailV2&ccid=hgdl%2bymS&id=EF0D186785DE202EBBBC94541325F1B1A43D962E&q=geocarb+co2+vs+temp&simid=608032938038134308&selectedIndex=39&ajaxhist=0
AGW is not Science,
We are discussing CO2 levels in the past few million years, not 175-550 million years ago when the continents were at different places and most CO2 wasn’t -yet- disposed off in huge layers of chalk (not for nothing the later period is called the “Cretaceous”)…
Over the past 800,000 years there are direct, accurate CO2 measurements in ice core bubbles with a resolution of 10 years up to 560 years which show that the current 400 ppmv never occured in that period, all what happened is that CO2 followed temperature with ~16 ppmv/K which needed ~5000 year to reach 100 ppmv extra in warm periods at a maximum of around 300 ppmv.
Since ~1850 humans emitted over 200 ppmv CO2 in only 167 years, or average 1.2 ppmv/year, of which about half remained in the atmosphere, some 30 times faster than nature ever could do in 5000 years over the ice ages.
Thus please, if you want to discuss the Science of AGW, start with what is really known in the Science of today: that humans are responsible for almost all of the 110 ppmv CO2 increase over the past 167 years, with a small extra from the temperature increase.
That the result of the human caused CO2 increase is discutable, is a complete different question and certainly doesn’t disserve the (C) in (C)AGW.
It only shouldn’t be that because you (and I) don’t agree with the second question that one must reject everything that the other camp says, even where they are certainly right.
I have made a comprehensive overview why humans are the cause of most of the increase:
http://www.ferdinand-engelbeen.be/klimaat/co2_origin.html
If you disagree with one of its conclusions with good arguments, based on observations, we can have a discussion, but arguments like CO2 levels from hundreds of millions years ago have little value in the world of today…
AGW is not Science,
Since CO2 sources and sinks other than human co2 emissions aren’t even being measured
Never heard of a mass balance? Quite easy in this case:
increase in the atmosphere = human emissions + natural sources – natural sinks
4.5 GtC/year = 9 GtC/year + natural sources – natural sinks
natural souces – natural sinks = -4.5 GtC/year.
Over the past 57 years in every year natural sinks were larger than natural sources. Thus the contribution of all natural fluxes together to the CO2 increase in the atmosphere was zero, nothing, nada… No matter what the natural fuxes individually were, are or changed over the years. That is of zero interest for the mass balance…
(good, except for a small contribution of the temperature increase, which changed the equilibium base).
There was an ‘In Our Time’ broacast on Radio 4 last week talking about the PETM (Paleocene-Eocene Thermal Maximum) that occurred around 56 million years ago. It was stated that this period had two pulses of carbon injection into the atmosphere – the first causing some warming, which then caused a rapid release of previously frozen methane from the bottom of the oceans, causing a much bigger release of carbon. Over the 200000 year period it is claimed that global temperature rose by up to 8c. The point that was made was that man, since the industrial revolution, has already caused emissions of more than half of the total emitted during the PETM.
This seems to be widely cited as a model for what will happen today as a result of anthropogenic carbon emissions.
I don’t think I’ve seen much other discussion of the PETM and its relationship to what is happening today, and would like to be enlightened – if only so that I can answer those who might quote it at me as support for the AGW theory.
r woolaston, I have ‘a picture is worth a 1000 wds’ answer re PETM and it is also a beautiful corroboration of the ingenuity of geology’s proxy measures of the temperatures and climate of the period. About 10 years ago, in the Ekati diamond open pit mine in the Arctic Circle area of Northwest Territories in Canada, at a depth of 300m, redwood tree chunks were found enclosed in the diamond ore. These were not fossilized but rather were preserved as wood with sugary seams of pitch or sap and complete with the red color. They were dated at 53 million yrs ago! A California climate! Now I’m not current on where this was latitudinally with Continental Drift but I believe then it was already well north of today’s Cali.
Interestingly, diamond pipes come from material below the earth’s crust at a depth of near 200km. The volcanic magma intruded rapidly, starting at depth at 20km/hr, where it breaches the solid crust it accelerates up from 40km/hr and by the time it punches through the surface, it has reached 1200km/hr! This pipe blasted through the floor of a redwood forest leaving a gaping hole several hundred meters deep. The wood and volcanic rock would have blasted up through the clouds and then fallen back mainly into the hole. The last gasps of the event would fill in voids and resolidifying the pipe. How’s that for believing six impossible things before breakfast!
Google ‘redwood chunks found in Ekati Diamond mine’. Also go to
http://www.nrcan.gc.ca/sites/www.nrcan.gc.ca/files/mineralsmetals/files/pdf/expl-expl/Kimberlite-video/Kimberlite.swf
for the animation. It also shows the pipe being scraped by the glacier creating a mineral train that is followed up on prospecting.
Some ocean floor micro-organisms replaced some other ocean floor micro-organisms, ten million years after the K-T extinction event.
I am dubious that ALL the CO2 increase is man-made. CO2 rises naturally as the earth warms from cold periods. Some portion of these increases has to be coming from natural sources. As in, if humanity stopped all CO2 production there would still be an increase over time of CO2 at this point in earth’s history, until we get to the next cold spell.
marque2,
The long term equilibrium between the ocean surface and CO2 in the atmosphere is ~16 ppmv/K. With a maximum 1 K temperature increase since the LIA, that is thus 16 ppmv. Currently we are at 110 ppmv above that long term equilibrium, that is not natural, the more that humans emitted over 200 ppmv over the same period.
If we stopped all emissions, CO2 would go down, back to 290 ppmv, as that is the equilibrium for the current temperature, with a half life time of ~35 years.
Ferdinand,
Can you please refer us to a derivation of this 16 ppm?
In advance of that, some questions.
Are you doing a static modelling of a non-mixing ocean source of CO2, or a dynamic one that is constantly bringing water of different temperature to the surface you had at the start of the modelling?
For a quick analogy, it is the difference between lab experiments where –
1. Henry’s law constant is derived from a flask with a fixed volume of water adjacent to an atmosphere, when the temperature is changed once wrt the atmosphere; and
2. The water is continuously replenished from a tap forcing it through the flask at whatever temperature the tap water is wrt the atmosphere.
These scenarios assume that the atmosphere in each case is infinitely able to take in or give out CO2 and that it stays at constant temperature and constant partial pressure of CO2 while the water temperature is changed.
Are these scenarios appropriate for your method of estimation of ppm CO2 change per deg K?
What starting temperature for the water phase do you use?
Thanks Geoff.
Geoff,
The ~16 ppmv/K for seawater works as good for a static sample as for the total ocean-atmosphere system, be it that the steady state for the surface alone is reached within a few years, while the temperature and CO2 exchanges with the deep oceans needs centuries (as can be seen in the ~800 years lag during a deglaciation).
290 ppmv is based on the current (area weighted) average ocean surface temperature of ~15°C.
I have not worked out much myself, as most work was done by lots of people all over the world over the past centuries by sampling the oceans at several depths (like lots of data from a German research vessel in the 1930’s).
Standard underway maintenance free pCO2 measurement equipment nowadays is installed in commercial seaships where the pCO2 is continuously measured by spraying incoming seawater in air and measuring the pCO2 in the overlaying air. For the (small) difference in temperature between koeling water inlet (= in situ) and the measurement equipment is compensated for by following formula:
(pCO2)sw @ Tin situ = (pCO2)sw @ Teq x EXP[0.0423 x (Tin-situ – Teq)]
Which gives the above ~16 ppmv/K for temperatures around 15°C, which is the current average seawater surface temperature.
A nice description of the equipment and compensation formula is here:
http://www.ldeo.columbia.edu/res/pi/CO2/carbondioxide/text/LMG06_8_data_report.doc
Further about the dynamics of the deep ocean – atmosphere exchanges:
Deep ocean upwelling and sinks are variable over the seasons and over ENSO and other ocean cycles. That has a profound effect on the current year by year CO2 uptake, but most of it levels off in a few years to a few decades.
The main influence is over millennia between glacial and interglacial periods at a very small speed: about 0,02 ppmv/year over ~5,000 years and even slower when cooling towards a new ice age. So for short time periods (up to centuries) we may assume that the concentration of CO2 (+ derivatives) in the upwelling waters and the volume of upwelling waters in average is quite constant.
The main difference in CO2 exchanges then is in the seawater temperature at the surface: at the equatorial upwelling places warming of the CO2-rich upwelling waters releases a lot of CO2 and at the sink places near the poles the cold waters absorb a lot of CO2.
Independent of each other, the “thinning” of the δ13C level from human emissions and the rapid decay of the 14C level from the atomic bomb tests point to ~40 GtC/year CO2 moving between the equatorial upwelling waters and the polar sinks. Again, showing a rather constant flux over the past decades.
At the equator, the maximum pCO2 difference between ocean surface and atmosphere is ~350 μatm.
Near the poles (N.E. Atlantic) the maximum pCO2 difference between the atmosphere and the ocean surface is ~250 μatm. Both are good for the same 40 GtC/year source/sink flux at steady state. See:
http://www.pmel.noaa.gov/pubs/outstand/feel2331/exchange.shtml
If there is a sudden increase of 1 K everywhere at the full surface of all oceans, everywhere the pCO2 of the oceans will instantly increase with ~16 μatm. That changes the pCO2 difference with the atmosphere everywhere and thus the in/out fluxes. As the fluxes are directly proportional to the pCO2 difference between ocean surface and atmosphere:
For the equatorial upwelling:
40 GtC/year * (350 + 16) / 350 = 41.8 GtC/year
For the polar sinks:
40 GtC/year * (250 – 16) / 250 = 37.5 GtC/year
For the first year after the temperature jump, some 4.3 GtC (~2.1 ppmv) extra remains in the atmosphere. In the second year, the extra 2.1 ppmv (~= μatm) changes the pCO2 differences between atmosphere and ocean surface in opposite direction, which leads to a smaller increase in the atmosphere. When the increase in the atmosphere reaches 16 ppmv, the original pCO2 differences are restored and as consequence the original fluxes are restored too and when the start was at steady state, the steady state is reached again, at a higher CO2 level in the atmosphere. Exactly at the same ~16 ppmv/K as for a static sample.
In graph form:
http://www.ferdinand-engelbeen.be/klimaat/klim_img/upwelling_temp.jpg
Incisive and educational. Hopefully Scott Pruitt and William Happer will introduce just this type of thought into the rancid climate debate. It will come as a great shock to citizens that the debate was never over but rather hijacked, bound, and hidden in a dark place. Albert Gore Jr. recently re-released his book about an “assault on reason” He claims to be optimistic despite our hindering action on the current “climate crises” and something referred to as “dirty weather” Dirty weather folks. That’s the level of discourse Al wants to play at.
Carbon. Decarbonization. Aren’t we talking about CO2? Then why not say so? Why to we keep buying into the purposely misleading sloppy language of the warmists?
Because “carbon” sounds like soot, instead of an odorless, colorless trace gas that makes plants grow. As if carbon atoms could just fall off CO2 molecules when they are attached by very strong double bonds. Plants would be surprised at that since they put so much effort into breaking those bonds.
Thank you Bob Greene.
CO2 is CO2. carbon is carbon.
Another favorite of mine – Carbon Footprints.
Carbon footprints?? How about your carbon foot. and the carbon rest-of-you
Yeah, and what if you only have one leg?
That lonely leg and its attached foot would still belong to a carbon-based creature.
Right?
And why isn’t water vapour considered Hydrogen pollution? H2 is explosive and therefore dangerous to life on earth. It makes as much sense
All,
Carbon is used throughout the whole scientific world as it makes mass transfer balances possible.
CO2 is only CO2 in the atmosphere. In seawater it is 1% CO2, 90% bicarbonates and 9% carbonates. In plants it is a host of chemicals: sugars, starch, cellulose and many others…It is would be possible to calculate them all as “CO2 equivalents”, but looking for their carbon content is more straightforward…
The NYT article referenced in a past thread from yesterday: The greenhouse gases being released by human activity are often called “carbon emissions,” just for shorthand.” Scientifically Wrong Shorthand, of course, but I think journalists had too much trouble with the whole “carbon dioxide” thing, so they shortened it to “carbon”. It’s evidence of the complete lack of scientific understanding out there. Sometimes I think chemistry and physics have been totally elimated from schools and the Periodic Table declared nonessential.
Per IPCC AR5 Figure 6.1 prior to year 1750 atmospheric CO2 represented about 1.26% of the total biospheric carbon balance (589/46,713 Gts). After mankind’s WAG’d contributions (240 Gt), 67 % fossil fuel and cement – 33% land use changes, atmospheric CO2 increased to about 1.77% of the total biosphere carbon balance (829/46,713 Gts). This represents a shift of 0.51% from all the collected stores, ocean outgassing, carbonates, carbohydrates, etc. not just mankind (0.34%), to the atmosphere. A 0.51% rearrangement of 46,713 Gt of stores and 100s of Gt of annual fluxes doesn’t impress me as measurable let alone actionable, attributable, or significant.
Consider the entire picture, don’t just cherry pick atmospheric CO2.
Nick
http://ossfoundation.us/projects/environment/global-warming/myths/volcanoes-emit-more-co2-than-mankind
“Human activities release more than 130 times the amount of CO2 emitted
by volcanoes–the equivalent of more than 8,000 additional volcanoes like
Kilauea (Kilauea emits about 3.3 million tonnes/year)! (Gerlach et. al., 2002)”
Nick, do you believe this number?
When I was in school in the mid 90s, the environmental Chem book that I studied showed volcano and biomass CO2 contribution dwarfed human contribution. We were much more concerned with the destruction of the Ozone layer resulting from Halogenated molecules back then.
Doesn’t matter. IPCC’s WAGs (wild ass guesses) on the Gt numbers are +/- 3%, i.e. 1,000s of Gts. Nobody can say with any certainty where the 240 Gt 0.5% change in the atmosphere came from or which of several possible sources is responsible..
See, that’s the benefit of “settled science”: we don’t have to worry about 240 Gtons of stuff.
Next question…
Nick@ 2:219 PM It does matter. the numbers are “fake news”.
Nicholas,
As far as there is a (small) effect of CO2 on the radiation balance, only the CO2 increase in the atmosphere is important. It doesn’t make any difference how much CO2 increased in the oceans or the biosphere, the increase in the atmosphere is over 30%, mostly man-made… That is what counts, not the other increases.
Even if the effect is small and mostly beneficial (as I think), it doesn’t help the case against the alarmists if you try to minimise the impact of CO2 by arguments that don’t matter at all…
Jerry and Mick,
Global CO2 emissions are based on longer term measurements around mount Etna, Sicily, Italy, one of the most active volcanoes of the world, during and after eruptions:
http://www.nature.com/nature/journal/v351/n6325/abs/351387a0.html
You need some 1,000 active Etna’s to reach the same emissions as humans do today.
The Etna is a subduction volcano (where a plate, including carbonate sediments, glides under another plate) which emits in average 10 times the amount of deep magma volcanoes (like at Hawaii).
Further, biomass gets/releases CO2 bidirectional. If in balance, that doesn’t change the CO2 content of the atmosphere, neither do the oceans. Both are proven net CO2 sinks over the past 57 years, as the increase of DIC (total inorganic carbon) in the ocean surface shows and the oxygen balance for the biosphere; the earth is greening…
Nick and Ferdinand @ 4:11pm
If you use the ice core numbers and your numbers, the maths do not work.
Subtract the CO2 amount attributed to humans from the historical ice core
readings and plant life on earth would have already been dead.
“Volcanoes Emit more CO2 than Mankind
This is a pervasive myth that continues to circulate. The idea that volcanoes put out more CO2 than mankind through human industrial output is patently false. Volcanoes put out around 0.2 Gt (200 million tons of CO2). The facts are clear and measured. As of 2010, humans put out on average of around 27Gt (Twenty Seven ‘Gigatons’) of CO2 per year. That’s 2,700 million tons compared to natural cycles 200 million ton output.”
Jerry,
I don’t understand what you mean: what humans emitted is about 400 GtC as CO2 (~190 ppmv) since ~1850 (besides land use changes before and after the main industrial start). The increase in the atmosphere is about 240 GtC (~110 ppmv) above the historical (ice core) record. The rest of the 400 GtC is distributed over the oceans and vegetation.
Thus human emissions did increase the carbon content of all reservoirs. Without further emissions all extra CO2 would be distributed over all reservoirs and as the deep oceans are the largest one’s, the remaining increase would be less than 1% in all reservoirs for the 400 GtC released until now.
The only “problem” is that it takes more than one year to redistribute the yearly human emissions in the other reservoirs thus part of it (as mass, not the original molecules) remains in the atmosphere for a longer period. The observed half life time is ~35 years, quite linear over the past 57 years…
Ferdinand @ 12;51am
One of the many problems with the CO2 readings is the CH4 readings.
An example would be that USEPA and IPCC both list upland soil as a 30Tg
sink for CH4. It is not. Once it hits the atmosphere, CH4 rises. It does not
sink.
Simple test. On my property in Tennessee, over chestnut brown topsoil
I tested the atmosphere at 6′ for CO2. 404 ppm. I took a 14″ stainless
steel salad bowl, inverted it, put the CO2 meter under it, weighted the
bowl down with a 10 lb weight. Wind was 0-3 mph. I left it there for 12 hrs.
CO2 readings at the end to the period was 1394 ppm.
The researchers know that there is CH4 in the soil, the source for the
CO2 at the surface of the soil, so after some flawed testing, they
decided that it had to come from the atmosphere.
Years age, I came up with the hypothesis that all upland soil, soil not in a
flood plain, in the presence of adequate moisture, owes it’s richness to the
amount of natural gas upwelling through it.
I tested, digging through the topsoil, through any observable roots, worm
castings, erc. I inverted the bowl into which I had soldered a copper tube with
closed gas valve, covered the hole and 24 hours later, I tested for combustible
and found hydrocarbons. The amount of gas perking through the soil varies
greatly as indicated by soil depth and richness. The red clay around Atlanta,
Ga. almost none. The deep, rich soil in Kansas, a large amount. The amount
of gas perking through the topsoil determines the amount of CO2 which can
be generated by the microbes, which can be effected by frozen soil or too
much rain.
I know that the CH4 reading is off by at least 30Tg. I have seen no reading
that I consider credible for volcanic introduction of CO2 or CH4.
The estimates have changed according to agenda being pushed.
http://ossfoundation.us/projects/environment/global-warming/myths/volcanoes-emit-more-co2-than-mankind
The above citation claims that humans emit 130 times more CO2 than
volcanoes. If you deduct that human contribution from ice core readings,
then life on earth would have died long ago or never started.
Questions I have:
Do the underwater emission of volcanic CO2 and CH4 ever reach the atmosphere?
If not, how much of that CO2, or for that matter does any dissolved CO2 precipitate
from the oceans each year?
Under what conditions does any of the dissolved CO2 ever return to the
atmosphere or does all of it precipitate when the current pulls it to great
depth and it collects and concentrates?
Fortunately, subduction reprocesses the carbon for us, creating hydrocarbons
which then rise, continuing the process which has been operating since not
long after the internal fires of the earth were lite.
There are too many unknowns, both known and unknown, as Sect. Rumsfeld
liked to say, for the carbon balance to be accurate
http://carbon-budget.geologist-1011.net/
This article discusses some of the problems, but does not understand the major
method of reintroducing carbon to the surface.
Descending into the Grand Canyon, one can view millions of years of layers
of carbonates. If there were not a very efficient method of recycling it, the
earth would never have supported life.
All of IPCC’s numbers used in figure 6.1 and table 6.1 are just wild ass guesses pulled out of some PhD’s butt. Says so in the captions. That the atmospheric CO2 increase is caused only by man is an arbitrary conditional, an “assumption” to simplify the math, no actual physical proof. The caption to Figure 6.1 says natural variations were assumed to be constant 1750 to 2011. There seemed to be some doubts about that, but IPCC didn’t have/take time to address.
Mankind’s additional FF CO2 is trivial.
2 W/m^2 RF is trivial.
The models don’t work.
30 years worth of predictions are failures.
RGHE is as bogus as cold fusion and creation science.
0.34% due to fossil fuels.
Nick
Re: total biospheric carbon balance-How much precipitates from the oceans
each year/source and how much CO2 and CH4 do volcanoes introduce/yr
source?
In 1973 we had ‘Fahrverbot’ at weekends because of the ‘Oilprice schock’:
https://www.google.at/amp/amp.n-tv.de/politik/dossier/Deutschland-autofrei-article605647.html
Beginning 1990 there was desert storm:
https://www.google.at/search?client=ms-android-samsung&ei=XKTOWJ-aJMXR6ASviougCQ&q=desert+storm&oq=desert+&gs_l=mobile-gws-serp.
Absolute nonsense.
CO2 reduction is these days completely decoupled from GDP – GDP grows, CO2 declines.
See the evidence:
http://www.wri.org/blog/2016/04/roads-decoupling-21-countries-are-reducing-carbon-emissions-while-growing-gdp
UK now has reduced its CO2 to the 1894 level, thanks to shutting down coal power plants. UK economy unwrecked, no blackouts.
How’s life out there in fantasy land?
The only reason this has happened is that much of the manufacturing capacity we had is now shut down. However our consumption of manufactured goods continues to increase. Manufactured goods are now produced in high carbon economies (classified as ‘developing’ by the Paris conference) such as China. Therefore, if you look at the carbon produced as a result of our GDP, it has risen substantially. It is just not produced here.
Absolutely. The article Griff linked to has NO data on China or India and their emissions. Outsourcing manufacturing as a way to reduce emissions is a blantant deception and very, very unscientific. Makes great propaganda, though. Griff also fails to mention that China and India’s GDPs are going at many time the rate of the countries listed in the article.
But the US has shifted much less of its energy production to renewables and people here keep saying how much less its energy costs are than Germany – and yet I hear from your President that very many companies have shifted their operations to Mexico and China?
so shifting industry abroad is not linked to energy cost, or not entirely, is it?
Except in Germany of course, where the economy grows and CO2 levels increase. Why?
Because the green blob / climate establishment convinced Merkel and Co to pursue the “energiewende” which entailed using an obscene E500billion of taxpayer money to subsidize solar and wind and shutting down nuclear, so distorting energy markets that gas is uncompetitive, instead re-opening mothballed coal mines and bringing on line 18 coal fired plants to keep the lights on and prevent tens of thousands of high paying jobs from following those that have already been lost when German industry moved a big chunk of its operations to the US [where electricity costs are 30% of those in Germany].
Other than that there’s nothing much wrong with “green” energy policies [ 🙁 ], and water melon political illuminati in places as far apart as South Australia and Ontario, Canada are following this proven pathway to economic folly.
Griffy
I like you somewhat new “ABSOLUTE NONSENSE” meme.
The fact that you properly classify what you are about to say speaks well of your sense of humor.
“Griff March 19, 2017 at 8:56 am
UK now has reduced its CO2 to the 1894 level…”
How did they measure that in 1894 Griff?
Are you challenging this fact? Then produce your evidence
“Are you challenging this fact?”
Skanky, you self-evidently wouldn’t recognise a fact if it scuttled under your noisome, foetid bridge, jumped up, and sank its fangs into your scabrous, warty snout, and the same goes for truth.
You knowingly and with malice aforethought lie about climate science, you lie about economics, you lie about power generation and worst of all you lie to attempt to damage the professional credibility of scientists such as Dr. Crockford and Professor Curry, and you have the damn gall to insult the knowledge, understanding and professional acumen of the many expert posters on this blog who have more grasp of the subject in their little finger than you will ever acquire in your whole life, as much as anything because you persist in believing the lies you read in such propaganda swamps as the Guardian and Wikipedia.
In all you are thoroughly despicable, and were it not for your high amusement factor, I doubt any blog would entertain your mendacious drivel.
“UK now has reduced its CO2 to the 1894 level”
TOTAL UTTER BOLLOCKS!
Have you no pride whatsoever Skanky, you sad little creature?
Have you apologised to you-know-who the polar bear expert yet?
https://www.google.at/search?client=ms-android-samsung&q=iraq+saddam+Hussein+siege+of+Saudi+Arabia&spell=1&sa=X&ved=0
I was as opposed to cooling then as I later became to warming. One thing changed in the 1970s, statistics shifted from just studying averages to making simple trend analysis the fad: we still haven’t really got around to variation changes.
The Club of Rome used the simplest and most limited of data in the most archaic of computer models and coupled them with the simple trend analysis to produce “Limits to Growth.” Maurice Strong was the member of the Club of Rome who took all those simple ideas and built them into Agenda 21, the UNFCCC and the IPCC. The major difference with the cooling and warming trends was the use and misuse for a political agenda.
Thatcher started it in order to demonize CO2 to,promote nuclear power and reduce coal use things reducing the threat from her political nemesis, Arthur Scargillpresident for life of the coal miners union. Thatcher was the one who brought Sir John Houghton into the fray. Thatcher later recanted as she watched the exploitation of CO2 for another political agenda that expanded from coal to all fossil fuels.
The only ‘scientists’ directly involved in those early days were almost all bureaucratic scientists as Strong intended. The reality is it wouldn’t have mattered what a scientist said or did as a skeptic to what was being said and done. Once the political juggernaut was under way.science and scientists as skeptics were easily brushed aside. I won’t bother listing all the things that happened to me. Just one will suffice. They even got me fired as a monthly columnist for the farm magazine “Country Guide” after 17 years of explaining weather and climate in practical terms to people who are affected by the weather but also by government policy.
Sadly, the majority of scientists, whether trained in weather and climate or not went for the large amounts of funding and once on that train few ever got off.
People generally can’t, or won’t, go beyond what they are taught.
In the past, those scientist that did “go beyond” are the ones who are revered as being “ground breakers”.
Today the climate “ground breakers” in the US are coming face to face with the reality that “political science” isn’t really science. No more “green” to support it.
A return to science to support efforts to understand more of what little Man knows of our physical reality, rather than “science” being prostituted to support a desired political reality, is not welcomed by those who cash and/or sign the checks.
They are the ones who don’t care what it will cost “the children”.
“An increase from 396 to 405 is a rise of 2.27%. Now, due to CO2’s logarithmic effect, this is in fact equivalent to 3.6% of a doubling in CO2 concentrations, because 1.0227^31 = 2 and 1 / 31 = 0.0326”
Although it is unimportant in the context of your very good argument, the CO2 absorption and warming of the atmosphere DECREASES approximately logarithmically with increasing concentration. The 9 ppm increase/280ppm doubling gives 3.2%. This linear percentage is REDUCED by the logarithmic saturation effect.
Shucks: Here all along I had been thinking increased CO2 efficiency would provide for increased feed grain harvests and lumber sources. Sarc/2
So if natural variables continue to raise the earth’s temperature (as they have done for thousands of years ) that is OK as long as humans don’t have any effect . Is that basically the proposition ?
When natural variables conspire to once again cause global cooling that must be OK to because
no scientists propose that humans are now in charge of setting the earths thermostat or that pumping Co2 is a warming strategy recipe to counter cooling when it comes .
Conserving energy is a good thing on it’s own merit but pretending to micro manage the earths temperature by adjusting a trace gas isn’t even scientific fraud it’s a con job .
It is the rate at which human CO2 is changing the temps and the final extent of the temp rise which is the issue.
Humans make it hotter quicker and to a damaging extent… pace of change may be too rapid for adaption
Ah the rapid “pace of change”. Claimed anthropogenic temperature effects are only noticeable in anomaly terms. Actual temperature changes vastly greater than the anomaly change happen regularly on a daily basis and yet are adopted to easily. The idea that a *tiny* increment in temperature coming into effect over a *long* period of time is somehow too rapid to be adapted to is counterintuitive, to say the least. Where on earth has a climate so stable that a rise of 2-3C spread out over a *century* would represent rapid temperature change?
Even such a physically meaningless target as the global annual anomaly has year-to-year changes much steeper than the “rapid” pace of change attributed to anthropogenic forcing — yet what terrible consequences happen from that *much faster* change? If the slow-but-steady-CO2-forcing causes a pace of change “too rapid for adoption”, where are the bodies from the much larger changes happening over much smaller time?
The amount of carbon emitted per unit of energy has been declining globally at a steady pace since before Abraham Lincoln was elected president.
https://tierneylab.blogs.nytimes.com/2009/04/22/happy-earth-day/
Hubert Lamb, Director of CRU, Sep 8 1972: “We are past the best of the inter-glacial period which happened between 7,000 and 3,000 years ago… we are on a definite downhill course for the next 200 years….The last 20 years of this century will be progressively colder.”http://news.google.com/newspapers?nid=336&dat=19720908&id=AiwcAAAAIBAJ&sjid=0VsEAAAAIBAJ&pg=5244,2536610
John Firor, Excecutive Director of NCAR: “Temperatures have been high and steady, and steady has been more than high. Now it appears we’re going into a period where temperature will be low and variable, and variable will be more important than low.”
The CO2-intensity of GDP (or “CO2 efficiency” per the author) is not a reliable metric for true progress in reducing emissions for the USA (and likely other nations) for at least three reasons.
First, it follows the same trajectory as energy intensity across the arc of development of a nation. It rises as an agricultural economy become industrial, and it falls as a nation moves to become post-industrial, where much of its heavy industry has migrated overseas to developing nations. This is a natural phenomenon of development and globalization, and it really represents exported CO2 emissions rather than eliminated CO2 emissions. The U.S. carbon footprint is much higher if charged for the emissions of goods imported from China and the rest of the world.
The second factor at play that skews CO2 efficiency is the growth of the financial sector. In the USA, thjis sector, which was 3% of GDP in 1950 has grown to over 8% of USA today. Being essentially a giant money-skimming operation that extracts wealth from everything it touches, the money amassed in the financial sector really represents overhead cost to true producers rather than productivity itself. This sector should be excluded from GDP.
A third factor that drives the specious rise in CO2 efficiency is the doctoring of inflation rates (hedonic corrections, geometric weighting/chaining, changing basket of goods) that falsely trim about 4-5% from the official price inflation/GDP deflator number compared to empirical reality and how inflation was historically calculated before the mid 1980s in the USA. These manipulations artificially swell a real U.S. GDP which has been shrinking since 2000 (even including the financial sector) into a more politically-pleasing fantasy GDP with a 1-2% fudged annual growth rate.
If there was a more honest accounting of GDP, I believe the CO2 intensity and underlying energy intensity curves would be much flatter and show far less “progress” in increased efficiency.
Yes!!!! 10 out of 10. Climate science corruption is only one facet of the deception and distraction of the population required for the international Power Elite to maintain and extend control. Economic disinformation is a major leg of that strategy.
I agree but th n there is that very important metric… which is at odds with logic. That is reduce total emmisons to what they were in the past… and they somehow think they can fool us into thinking it is a job creator to do so.
There is no hope of leftists seeing what is logical to us who are able to see clearly as you do.
Here’s another contradiction to this article:
https://cleantechnica.com/2017/03/20/co2-emissions-flat-third-straight-year-still-decoupled-economic-growth-iea/
“CO2 Emissions Flat For Third Straight Year, Still Decoupled From Economic Growth, Says IEA”