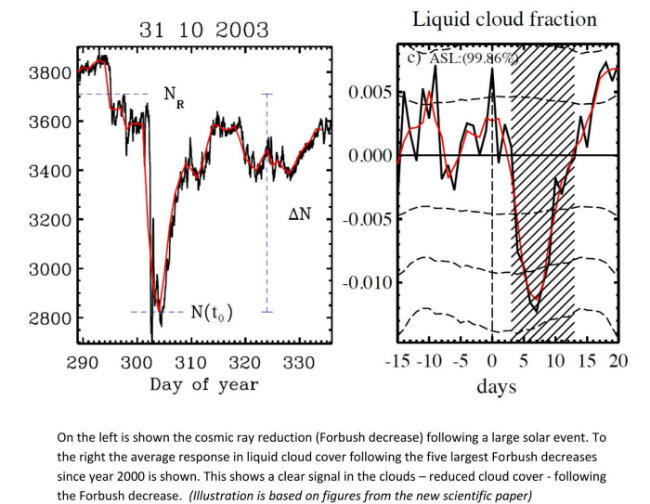
Solar variations affect the abundance of clouds in our atmosphere, a new study lead by DTU Space suggests. Large eruptions on the surface of the Sun can temporarily shield Earth from so-called cosmic rays which now appear to affect cloud formation. A team of scientists from the National Space Institute at the Technical University of Denmark (DTU Space) and the Racah Institute of Physics at the Hebrew University of Jerusalem has linked large solar eruptions to changes in Earth’s cloud cover in a study based on over 25 years of satellite observations.
The solar eruptions are known to shield Earth’s atmosphere from cosmic rays. However the new study, published in Journal of Geophysical Research: Space Physics, shows that the global cloud cover is simultaneously reduced, supporting the idea that cosmic rays are important for cloud formation. The eruptions cause a reduction in cloud fraction of about 2 percent corresponding to roughly a billion tonnes of liquid water disappearing from the atmosphere.
Since clouds are known to affect global temperatures on longer timescales, the present investigation represents an important step in the understanding of clouds and climate variability.
”Earth is under constant bombardment by particles from space called galactic cosmic rays. Violent eruptions at the Sun’s surface can blow these cosmic rays away from Earth for about a week. Our study has shown that when the cosmic rays are reduced in this way there is a corresponding reduction in Earth’s cloud cover. Since clouds are an important factor in controlling the temperature on Earth our results may have implications for climate change“, explains lead author on the study Jacob Svensmark of DTU.
Very energetic particles
“Since clouds are an important factor in controlling the temperature on Earth our results may have implications for climate change”
Galactic cosmic rays are very energetic particles originating mainly from super novae.
These particles generate electrically charged molecules – ions – in Earth’s atmosphere. Ions have been shown in the laboratory to enhance the formation of aerosols, which can serve as seeds for the formation of the cloud drops that make up a cloud. Whether this actually happens in the atmosphere, or only in the laboratory is a topic that has been investigated and debated for years.
When the large solar eruptions blow away the galactic cosmic rays before they reach Earth they cause a reduction in atmospheric ions of up to about 20 to -30 percent over the course of a week. So if ions affect cloud formation it should be possible to observe a decrease in cloud cover during events when the Sun blows away cosmic rays, and this is precisely what is done in this study.
The so-called ‘Forbush decreases’ of the cosmic rays have previously been linked to week-long changes in Earth’s cloud cover but the effect has been debated at length in the scientific literature.
The new study concludes that “there is a real impact of Forbush decreases on cloud microphysics” and that the results support the suggestion that “ions play a significant role in the life-cycle of clouds”.
Arriving at that conclusion was, however, a hard endeavor; Very few strong Forbush decreases occur and their effect on cloud formation is expected to be close to the limit of detection using global atmospheric observations measured by satellites and land based stations. Therefore it was of the greatest importance to select the strongest events for study since they had to have the most easily detected effect. Determining this strength required combining data from about 130 stations in combination with atmospheric modeling.
This new method resulted in a list of 26 events in the period of 1987-2007 ranked according to ionization. This ranked list was important for the detection of a signal, and may also shed some light on why previous studies have arrived at varied conclusions, since they have relied on events that were not necessarily ranked high on the list.
Possible long term effect
The effect from Forbush decreases on clouds is too brief to have any impact on long-term temperature changes.
However since clouds are affected by short term changes in galactic cosmic radiation, they may well also be affected by the slower change in Solar activity that happens on scales from tens to hundreds of years, and thus play a role in the radiation budget that determines the global temperature.
The Suns contribution to past and future climate change may thus be larger than merely the direct changes in radiation, concludes the scientists behind the new study.
Source: http://www.dtu.dk/english/News/Nyhed?id=b759b038-66d3-4328-bbdc-0b0a82371446
The full reference to the new paper is: J. Svensmark, M. B. Enghoff, N. J. Shaviv, and H. Svensmark, “The response of clouds and aerosols to cosmic ray decreases”, Journal of Geophysical Research – Space Physics, 2016, DOI: 10.1002/2016JA022689.
Click here or here to access the abstract and full scientific paper.
Related: (via the Hockey Schtick)
Solar physicist Dr. Leif Svalgaard has revised his reconstruction of sunspot observations over the past 400 years from 1611-2013. Plotting the “time integral” of sunspot numbers from Dr. Svalgaard’s data shows a significant increase in accumulated solar energy beginning during the 1700’s and continuing through and after the end of the Little Ice Age in ~1850. After a ~30 year hiatus, accumulated solar energy resumes a “hockey stick” rise for the remainder of the 20th century, followed by a decline beginning in 2004, all of which show remarkable correspondence to the HADCRU3 global temperature record:

“The most obvious way for warming to be caused naturally is for small, natural fluctuations in the circulation patterns of the atmosphere and ocean to result in a 1% or 2% decrease in global cloud cover. Clouds are the Earth’s sunshade, and if cloud cover changes for any reason, you have global warming — or global cooling.”
maybe the sun did it after all
Blasphemer!
No, the butler did it… (it’s always the butler that did it)
With the candlestick in the study?
Why study candlesticks, isn’t the science settled?
Even Cluedo has about 200 possible solutions. The new Cluedo, with Ms. Bash the Soda Syphon Salesman, may have more.
But with climate there are, per the souls of this parish, a large number of effects, more or less significant I am sure.
I suspect the interplay between these variables is, actually, not really known.
I had a link, once, I thought.
A sort of cloud-sourced list.
Auto
The science is settled, only the data is uncertain.
Eugene WR Gallun
good one, Mark, it took me a few reads to get it… ☺
George W did it. Obama said so right after he promised me that my medical expenses would go down.
Someone PLEASE take that graph above and add the CO2 graph to it and send it to Dr Abram http://joannenova.com.au/2016/08/experts-surprised-to-discover-what-skeptics-have-known-for-years-world-has-been-warming-for-200-years/ and this MSM IDIOT http://www.smh.com.au/environment/-gqz260.html
Those people are not idiots, they willingly deceptive.
Extremely deceptive. They are trying to blame man for millennial trends, not just the hockey stick blade. Not idiotic, but very foolish. But that’s Abrams.
====================
A real sunspots time-evolution has nothing to do the one shown here.
There is no doubt : they are fooling you.
Also what does Svensmark is not science… Everybody knows that (I hope).
Verbal diarrhoea. You are talking out of ton cul.. May I suggest a large dose of imodium
And don’t forget the toilet paper to wipe your chin.
You will discover with time that toncul say less stupidy than wuwt. Easy.
Sunspot evolution :
FLAT since 1950.
Decreasing since 2000.
What about global SURFACE air temperature ?
even decreasing since around 1990
Ah, what (insert scientist’s name you don’t agree with here) does is not science, and here is a wikipedia link to back me up — idiots everywhere.
Embrassez mon cul, s’il vous plait.
RWturner
Yes, for sunspots evolution, wikipedia is ok…
About Svensmark : you explain to me the details of the theory ? And provide me some quantification of the effects ? Without forgetting to explain why it’ relevant : sun is flat since 1950…
Toncul, do you have to keep on turning the gas up on the stove to heat a kettle of water? No one really knows how long it takes the sun to equilibriate…
It depends : After few minutes, it doesn’t warm up anymore, specially if the stove was initially not very warm.
In the last decade sun was at a minima, but ocean keep accumulating energy and surface temperature keep increasing. The kettle of water has been put in the fridge, but it’s still warming…
Tonar$e,
Svensmark’s science is so bad, that the Stanford Linear Accelerator Lab (SLAC) used to have a Web page on how GCRs form clouds, but of course it was taken down. Maybe Dr. Svalgaard of Stanford U. knows why.
[All: Stick to the disagreements about the science, not about the person. .mod]
Gabro,
you give me a summary of the results, in particular the part where they show something about clouds, and climate ? Also, do you think that if there were no galactic cosmic rays, there would be no clouds ? You should open some books.
Anyway, sun is flat since 1950 and decreases since two decades.
toncul,
You should review http://www.nature.com/nature/journal/v533/n7604/full/nature18271.html
It’s the latest result from the CERN CLOUD experiment. They found in the conditions they tested GCRs had little or no impact on cloud formation.
Mind you, in their paper http://www.nature.com/nature/journal/v533/n7604/full/nature17953.html they found GCRs had a major impact.
It all comes down to the chemical make of the atmosphere in the absence of GCRs.
“[All: Stick to the disagreements about the science, not about the person. .mod]”
yep, but what does Svensmark is not science. So how do we do?
[As above. If you believe you are right, stick to the science. Write about the science so you may convince others. If you cannot convince others who read your words, you may need more science as evidence.
Also, never blindly assume that what is “accepted” right now is right now. .mod]
I am sticking to the science.
Ton, your question is an obvious straw man, as even you should be able to see.
GCRs are not the only source of CCNs, obviously. But more of them demonstrably make more CCNs, hence more clouds. And they are more important relatively when there are fewer other sources of CCNs.
Have you really not bothered to study CERN’s experimental results re GCRs and CCNs? I guess not, since you assert without the least shred of evidence that Svensmark’s work is not science.
“[As above. If you believe you are right, stick to the science. Write about the science so you may convince others. If you cannot convince others who read your words, you may need more science as evidence.
Also, never blindly assume that what is “accepted” right now is right now. .mod]”
It’s already done : sun is [flat] since 1950 and decreases since two decades. If you are not convinced by that it is not a scientific issue anymore.
But we can keep going about science : the forcing that, according to you, is supposed to explain most of the climate change is presently decreasing, whereas the climate system is still accumulating energy, which we know from both thermometers measurements and indirectly from sea level rising.
gregfreemyer
I am sorry but there is nothing about clouds there. Just aerosol nucleation.
“But more of them demonstrably make more CCNs, hence more clouds.”
Give me a full quantification of that …
(and compare it to what you would get for the anthropogenic aerosol effect).
Whatever, sun is flat since 1950. So the effect is 0 since 1950, disregarding that CGCR variations are not enough to have any impact on clouds, whatever you think the sensitivity of cloud to CCNs is.
Solar activity has been up and down since 1950, as have alleged average global temperature and GCR flux. And low clouds have generally been correlated with GCRs.
“Solar activity has been up and down since 1950”
up and down, not up and up.
So you disagree with the plot shown by Anthony Watts ?
Do you think that plot is misleading ?
toncul
August 26, 2016 at 8:32 pm
Which plot, the sunspot integral?
That graph does indeed show increasing solar activity associated with alleged warming, as recreated by a suspect gatekeeper, although sunspots aren’t the only measure of solar activity.
If cooling accompanies the coming expected downturn in SSN, then we’ll know more about natural variability. But the gatekeepers will do all in their power to adjust any actual cooling out of existence, so corrupt has so-called “climate science” become.
“…surface temperature keep increasing.”
Your not talking about the current el niño spike are you? We’ve been in “pause” mode for well over a decade. So, no, surface temps have not kept increasing. I agree about OHC. If the ocean is warming faster than ever, then maybe that’s where all the heats going. If so, we’re using the wrong metric (surface temps) for agw…
And again, this “sun flat since 1950” nonsense is just that (nonsense)… SC21 & SC22 were two of the largest solar cycles of the 20th century. You don’t have to keep turning up the stove to keep heating up a pot of water, in fact you can even turn it down some. That’s just b.s. (bad science)…
afonzarelli
I am speaking about surface temperature, whatever the reason of the increase. GHG are not the only factor that affect temperature.
Take GISSTEMP or HadCRUT or other surface temperature index, do a regression over the last decades and you will see it’s increasing.
The question is : is the sun responsible of most of the warming since 1950 ? The answer is no. Because sun irradiance evolution is flat since 1950 and ocean modelling (it’s mainly the heat capacity that do the job here) tells us that most of the warming due to sun has occurred before 1950. You can disagree, because I used the terrible word “modelling” (even if we are just speaking about a big bucket of water). Well, show me it’s not the case with a simple, simplified calculation. Give me a physical explanation.
BUT don’t waste your time because you agree that OHC is increasing. In the last decades : Solar irradiance is decreasing whereas OHC increasing. Which means : climate system is accumulating energy and this is clearly not due to the sun (this is not surprising at all view that solar irradiance variations are small).
The end.
http://lasp.colorado.edu/lisird/tsi/historical_tsi.html
Your original comment (to me) said “the last decade” (not decades)… Look at the ucolorado graph. You can clearly see that SC21-23 are the three largest cycles in a row. (the highest level of solar input!) Again it’s a matter of threshold. You don’t have to keep turning up the stove to keep warming a pot of water. NO ONE KNOWS just how long it takes for equilibration of surface temps. (solar forcings being poorly understood) As for the oceans, that will take hundred of years. As long as SSTs are higher than equilibrium state temperatures then we will see ocean warming. In fact SSTs could drop significantly and the oceans will keep warming. Look, i’m not a “it’s the sun stupid” kind of guy. I don’t know what role the sun actually has in the big picture. (i don’t think the 30 year warming/cooling cycles are necessarily caused by the sun) I just think your putting out a flawed argument that currently has no basis.
Your graph is nice. You should have given it to Anthony Watts… I would ahve been more interested in a calculation.
The point is that solar irradiance has increased on average at the begining of the last century, and has decreased since 2 or 3 decades. Now we are back to the forcing of the begining of the last century. If there were only the sun, we would have reached the equilibrium corresponding to the present forcing (due the larger forcing more than 3 decades ago). Temperature would have start decreasing, and OHC too, or at least, it would not keep increasing as it does. Observation shows that both are presently increasing. Also, the OHC and temperature evolution over the seond half of the last century is not in agreement with the solar forcing evolution, with a huge increase, when solar stop increasing and start to go down.
Moreover, the variations of the solar forcing are so small in comparison with CO2 forcing, that I even don’t know why we are speaking about that.
toncul says
Observation shows that both are presently increasing
henry says
pray, do show me your OWN results that prove this?
here are my own
if anything, man made warming is supposed to affect minimum temperatures
there is no room in my equation for any AGW?
Wow what a completely false argument. It’s not about solar irradiance toncul.
Clue, “forbrush decrease following solar event”, as in solar events decrease cosmic rays which have effects on cloud and ocean circulation.
Regardless of flat irradiance since 1950. Solar activity has indeed fluctuated. So I have no idea what you are actually talking about
Also ocean models, they are awful, you cant make any claim off of ocean models because the oceans are so poorly understood.
https://wattsupwiththat.com/2016/08/25/svenmark-publishes-solar-activity-has-a-direct-impact-on-earths-cloud-cover/comment-page-1/#comment-2286685
https://wattsupwiththat.com/2016/08/25/svensmark-publishes-solar-activity-has-a-direct-impact-on-earths-cloud-cover/comment-page-1/#comment-2286685
Disregard the first link (forgot the s in svensmark…). Mike Jonas touches on a couple interesting points here. He has a very well articulated analogy about the pot on the stove. Below this comment (and svalgaard’s response) is a comment about how heat that enters the ocean is a bit different than surface in that it is retained— mike jonas 8/27 1:30 am.
Somewhat pressed for time here, so i’ll address your last point first… tsi is NOT the only solar forcing. Even if it were, it’s a bit different in that sun light penetrates the ocean’s surface. (therefor more energy would be retained and would more readily warm water) Warmer water would be less effective in cooling the atmosphere. Furthermore, warmer water would lead to more water vapor. AND there are the other solar forcings that are unique to the sun which are not always well understood, accounted for. There is enough correlation with the historical temperature record that bear witness to the power of the sun to influence climate…
Saying that there is an inertia (stove analogy) is not enough. Show that the one that you need to get a huge surface warming and and huge OHC increase and a huge sea level rising, when sun is not increasing anymore and decreasing back (from a very low value), is realistic. Also you should give the value of “other solar forcings” and their time evolution. In particular, make me dream with Svensmark.
Mark – Helsinki. GCRs follows sun variations. So what doesn’t work for the solar irradiance (in term of temporal variations), doesn’t work for GCR too. Anyway, GCR effect is zero, until afonzarelli show us the opposite with some nice calculations.
i think the “stove analogy” is quite apt… It was turned up on high for most of the twentieth century to get our temperature rise. And then it was turned down low to keep it there (“the pause”). Now, maybe this is happening or maybe it isn’t happening, but at least it makes sense that it could be happening that way. You’ve got to remember that we’re coming out of the LIA, when temps we’re much colder and solar activity much lower. So, a weak solar cycle for us is not really weak when you compare with hundreds of years ago. (to keep it in perspective, solar activity in the 20th century was the highest in 8,000 years!) That’s why this time period is so interesting. Even at a prolonged solar maximum (SC24) temps have been barely holding on, only buttressed of late by an el nino. What will the next solar minimum bring? ’08 bottomed out only to be salvaged by an el nino in 2010. We won’t have an el nino this time round and we’re coming of a weak cycle that for the most part left temps flat. So, it should be interesting one way or another…
i think what you’re missing here is the realization that everything is relative to the LIA. Think of the LIA as being our equilibrium state temperature. Everything since then has been above the equilibrium state. Temps in the LIA were about .8C below our recent “pause”. Everything that i’ve seen indicates that we’ve actually been about .7C above the equilibrium temperature. (eventually a new and higher equilibrium state being achieved) So until we drop back down .7C to the equilibrium temp then OHC will continue to increase, sea levels will continue to rise. And if the sun is still relatively active, then we shouldn’t expect to get back to equilibrium any time soon. The last time we were close to the equilibrium state was around the turn of the century (1900). This current cycle and probably the next are not quite as low as that in terms of ssn, and nowhere near as low in terms of tsi (as you can see from lisird)…
Toncul, here’s a graph of sea level rise. You can see where it was near zero just after the turn of the century. SC14 was THE weakest cycle in 200 years and the minimum that followed it bottomed out in 1913. (temp data shows the same thing with temps actually going lower than the equilibrium state temp for a few years) EVERYTHING since then has been above the equilibrium state. SC14 took us to equilibrium and all else has been above that equilibrium since. That means solar cycles have been stronger than SC14. Temps thus have been higher than the equilibrium state. And as you can see OHC/sea level rise has been above stasis. SC14, then, would be at “threshold” strength for a solar cycle…
afonzarelli : to keep it in perspective, solar activity in the 20th century was the highest in 8,000 years!)
No,that is not the case and the TSI curve you showed is wrong too. TSI before 1978 is ‘constructed’ from the sunspot number. Recent research has shown that the earlier version the the sunspot number are incorrectly calibrated. Solar activity the past 100 years has not been exceptionally high.
“Think of the LIA as being our equilibrium state temperature. ”
Why would I think that ? If insolation is normal, then go down, then back to normal, the climate system go back to equilibirum as fast as it deviates from this equilibrium. and you agree:
“The last time we were close to the equilibrium state was around the turn of the century (1900).”
That more or less the same for the increase and decrease during the last century (with a very low values during the last decade). No we’re close to 1900. The largest solar variations are so small in comparison with CO2 forcing (did I tell you that yet ?), that there is not so much left at the end, nothing in fact.
Also your stove analogy is bad, the way you think it : the heating plate (the effect works only for electricl plate) has also an inertia, same as the kettle. Here, the temperature of the heating plate is forced to decrease (sun decrease). And if we force it to decrease too much, then it’s cooler than the kettle and that’s the kettle that warm the plate (OHC has to decrease). Here in fact, we do not care of all that because the stove doesn’t warm efficiently. So we gonna have to find something else to warm up the water and prepare the tea.
toncul says

No we’re close to 1900. The largest solar variations are so small in comparison with CO2 forcing (did I tell you that yet ?),
henry says
no, it is more like 1929?
http://www.woodfortrees.org/graph/sidc-ssn/from:1972/to:2016/offset:10/trend/plot/sidc-ssn/from:1927/to:2016/plot/sidc-ssn/from:1927/to:1972/trend/plot/sidc-ssn/from:1927/to:2016/trend
I am not sure if you knew already – I suppose you could be one of those “willfully ignorant” characters that just toy with people on this site –
but just in case you are not –
here is my argument against any AGW, to give a summary of all my investigations into climate change starting ca. 2009/2010
Concerned to show that man made warming (AGW ) is correct and indeed happening, I thought that here [in Pretoria, South Africa} I could easily prove that. Namely the logic following from AGW theory is that more CO2 would trap heat on earth, hence we should find minimum temperature (T) rising pushing up the mean T. Here, in the winter months, we hardly have any rain but we have many people burning fossil fuels to keep warm at night. On any particular cold winter’s day that results in the town area being covered with a greyish layer of air, viewable on a high hill outside town in the early morning.
I figured that as the population increased over the past 40 years, the results of my analysis of the data [of a Pretoria weather station] must show minimum T rising, particularly in the winter months. Much to my surprise I found that the opposite was happening: minimum T here was falling, ….any month….I first thought that somebody must have made a mistake: the extra CO2 was cooling the atmosphere, ‘not warming it. As a chemist, that made sense to me as I knew that whilst there were absorptions of CO2 in the area of the spectrum where earth emits, there are also the areas of absorption in the 1-2 um and the 4-5 um range where the sun emits. Not convinced either way by my deliberations and discussions on a number of websites, I first looked at a number of weather stations around me, to give me an indication of what was happening:
The results puzzled me even more. Somebody [God/Nature] was throwing a ball at me…..The speed of cooling followed a certain pattern, best described by a quadratic function.
I carefully looked at my earth globe and decided on a particular sampling procedure to find out what, if any, the global result would be. Here is my final result on that:
Hence, looking at my final Rsquare on that, I figured out that there is no AGW, at least not measurable.
Arguing with me that 99% of all scientists disagree with me is useless. You cannot have an “election” about science.
You only need one man to get it right.
I hope you come right.
“So we gonna have to find something else to warm up the water and prepare the tea.”
And that’s what want to do Svensmark. He is trying to warm the water with a clothes pin and some people still believe he will do it.
I presented three papers at a symposium on Earth’s Near Space Environment, 18-21 February 1975, held at the National Physical Laboratory, New Delhi. [1] Effect of solar flares on lower tropospheric temperature & pressure {Indian J. Radio & Space Physics, 6:44-50,1977] and [2] Power spectral analysis of lower stratospheric meteorological data of H, T, u & v [6:51-59] and [3] Power spectral analysis of total & net radiation intensities [6:60-66]. The impact of solar flares occured within 24 hours of flare occurrence but based the existing system, thee impact changed. Radiation followed the sunspot cycle [11 and its multiples].
Dr. S. Jeevananda Reddy
The political dogma of CAGW is settled in the political established UNFCCC. That means that humans also drive the sun?
No, Santa, humans produce a lot of CO2. It’s the man-made CO2 that drives the sun. And that’s a FACT!
Some people just don’t get it 😉
Solar variations affect the abundance of clouds in our atmosphere, a new study lead by DTU Space suggests. Large eruptions on the surface of the Sun can temporarily shield Earth from so-called cosmic rays which now appear to affect cloud formation.
Which Leif does not agree with . We just had a discussion about this today. We shall see.
Yes, here’s the argument:
https://wattsupwiththat.com/2016/08/21/the-north-atlantic-ground-zero-of-global-cooling/comment-page-1/#comment-2285434
Here’s a video about Svensmark’s work:
It’s by these guys, I think:
http://mortensenfilm.dk/documentary
I just watched the whole movie…..very interesting….it make sense of this whole paper and all the comments seen below
..But Dr. Leif Svalgaard seems to be agreeing up above ?
Yes, Salvatore, that’s the glory of this (these) climate blog(s). Dr Svalgaard will show up to give us his take. We DO learn things with opposing view points…
Can’t wait to hear what our resident expert says, alfonzarelli, and, yes, I am being sarcastic.
Yeah, Jay, i don’t blame you… Looks like the good doctor not only has laid an egg, but he also sat on it and hatched it! I still learn a lot from the guy though.
The sunspot integral versus corresponding temperature changes has a strong correlation.
That is what the data shows but who cares about data that is what the AGW enthusiast would say.
I go by the data and this along the historical climatic data record show AGW theory is wrong and that this period of time in the climatic history of the earth is in no way unique.
Further global cooling has begun and this is going to continue as this prolonged solar minimum becomes more and more established.
If you combine the integral of SSN and the integral of ocean cycles, the correlation with temperature is .97
https://rclutz.wordpress.com/2016/06/22/quantifying-natural-climate-change/
This would also tend to indicate that the lack cloud coverage – or the use of averaged cloud effect in parametric or table-driven sections of the GCM’s are another major contributor to their inability to forecast or hindcast. Geophysical phenomenon are real and they matter.
This would also seem to require a review of the tropes-as-postulates about the feedback factor and it’s mechanisms. Do you think that work will actually be done?
“Arriving at that conclusion was, however, a hard endeavor; Very few strong Forbush decreases occur and their effect on cloud formation is expected to be close to the limit of detection using global atmospheric observations measured by satellites and land based stations. Therefore it was of the greatest importance to select the strongest events for study since they had to have the most easily detected effect. Determining this strength required combining data from about 130 stations in combination with atmospheric modeling.
This new method resulted in a list of 26 events in the period of 1987-2007 ranked according to ionization. This ranked list was important for the detection of a signal, and may also shed some light on why previous studies have arrived at varied conclusions, since they have relied on events that were not necessarily ranked high on the list.
Possible long term effect
The effect from Forbush decreases on clouds is too brief to have any impact on long-term temperature changes.”
$$$$$$$$$$$$$$$4
interesting. when I looked at Forbush events ( they are rather large compared to normal variations in GCR) I found…… NOTHING.
Turns out they needed a “new method” to find anything
atmospheric modelling???
Regardless the effect is temporary..
Like volcanos in a way.
Like weather
Steve,
This result shows that GCR flux affects cloud formation. Hence when the sun’s magnetic field reduces GCRs over longer periods, the climate will warm. The point isn’t just limited to temporary flare bursts.
I’d have thought this fact was obvious. So the effect is on earth’s climate, not just space WX.
The climate has warmed over the past several cycle, while CGRs have increased…
Yes, but it ultimately stopped warming, didn’t it?
Surely one cycle alone can’t rule. What happens if you graph GCRs vs. Global temps and include ocean temp oscillations.
Fonzie says,
“Yes, but it ultimately stopped warming, didn’t it?”
No, it didn’t.
http://www.woodfortrees.org/plot/gistemp/from:1985/plot/gistemp/from:1985/to:1998/trend/plot/gistemp/from:1998/trend/plot/uah/from:1985/plot/uah/from:1985/to:1998/trend/plot/uah/from:1998/trend
YES, IT DID STOP WARMING!!! For nearly two decades according to both your graphs. And then we hit the el nino spike, after which temps are headed back down where the were. Do you get a thrill by coming here and showing everybody how brain dead stupid you are? (OR are you just being stupid on purpose a la alinsky?)
So less input of energy in the climate system according to afonzarelli, but more input of energy says observations (ARGO, sea level observations). It doesn’ fit.
Also clouds form without CGCR…. It’s time to learn by opening some books.
Ton,
Time for you to read some actual scientific papers.
https://www2.acom.ucar.edu/sites/default/files/…/Kristjansson.pdf
If link doesn’t work, Google:
Effects of Galactic Cosmic Rays on the Atmosphere and Climate
Jón Egill Kristjánsson, Univ. Oslo
Toncul, solar activity is still high by historical standards. While the ocean is gaining heat, it’s not doing so faster and faster. SSTs have been flat for well over a decade, so ocean warming has been consistent. UKMO argo data had ocean temps decreasing until 2010 and then increasing after that (dovetailing with the solar cycle)…
Jeez Mosh, have to hand it to you – you’re an expert at just about anything aren’t you.
Particularly good at drive-by snide remarks at science that doesn’t fit your take on things climate.
Since it was published in JGR we have to assume that a few folks who have a considerably more in-depth understand of this than you have, had a hard look at this. “Skeptics” don’t have many pals to turn to in the climate establishment.
@tetris
August 26, 2016 at 1:55 am: No point in replying to Mosh nor Yush et al. Alinsky, yes indeed.
As I recall (and please correct me if I am wrong), when you looked at Forbush events, you specifically looked at grid locations in which there were no clouds. It isn’t surprising that a Forbush event would not increase cloud cover in those areas.
The sun and the cosmos can come out of the closet now.
Yeah, it’s almost as though we’ve become “solarphobic”…
Several years ago I noted a warming in TLT data when a strong CME occurs (but not always). It usually lasts for a week to 10 days before cooling takes place. The question I asked then is whether there had been any long term change in the numbers of CMEs. Never got an answer.
Looks like this is along the same lines.
The science from Dr. Svensmark is compelling and the cosmoclimatology theory is elegant !
Lets enumerate the science Dr. Svensmark has, a Hypothesis/Theory, multiple experiments including CLOUD, experimental resultant data (wow actual real data), the conclusion is made and whatever Lief say’s is irrelevant if he ignores the science/data Dr. Svensmark has published from his many experiments.
So there was a use for all the jet setting climate evangelists after all—-jet contrails in the absence of cosmic rays.
Plotting the “time integral” of sunspot numbers from Dr. Svalgaard’s data shows a significant increase in accumulated solar energy beginning during the 1700’s and continuing
1) the integral of positive numbers diverges towards infinity.
2) the integral of the difference between a time series and its mean is always zero
3) the integral of the difference between a time series and some value, depends on what that value is, which then makes it a free parameter. If you vary that parameter to fit some data, you are just doing curve fitting with no physics.
Huh? Does the curves apparently varying in synch mean there is no correlation? Svensmark’s model seems to be a possible mechanism, but I am missing what Dr Svallgaard is writing.
You vary the free parameter until you get something that looks good.
climate modeling in one sentence.
>>climate modeling in one sentence.
Oooh, nice one Pat.
I am stealing that one….
R
Number 2 is not true. Think of cosine wave. Its mean is zero but the integral of (cosine – mean) is a sine wave. A sine wave is not always zero.
The integral over a sine wave is zero over the whole wave
The integral of the anomaly over time is also zero, so long as the period of the integral matches the period of the anomaly.
The problem comes in integrating absolutes, when in reality you need to integrate the difference from the average.
if for example one was to calculate the average sunspots over the past 400 years, and integrate the difference between this average and the actual number of sunspots, there would likely be a strong correlation with the temperature anomaly.
As far as I can tell from the Figure, the integral is of the difference between the yearly values and the mean. This means that the integral value at the right-hand end of the Figure is zero [also at the left-hand side]. But the whole exercise is more nonsensical than I thought. Why should the climate system know about when we invented the telescope about 1610 [which is the starting point of the integration]? Why not start in 1700 [when the sunspot series becomes better known], or 1800 [when the data is reliable]?
This is what you get by carrying out those integrals:
http://www.leif.org/research/Sunspot-Group-Integrals.png
Note how all three integrals begin and end with zeroes.
Of course, all of them misses the warming up to 1945.
The whole thing is nonsense of purest carat.
How can the integral of a time sequence minus the mean value of that time series possibly be different from zero ??
The integral of a cosine wave over any integer cycles is zero. So is the mean of a cosine wave.
If you have a cosine wave plus a DC component, the integral of that composite waveform over an integral number of cycles is just the mean times th total interval.
G
>>The whole thing is nonsense of purest carat.
Not necessarily, Leif. There are superpositions of many feedback-waves in the saga that is our climate. And if you add a little PDO and AMO to your graph, you might get something approximating to the temperature record.
Just suggestin’.
Ralph
“The integral over a sine wave is zero over the whole wave” I know, but that is not what you said.
As usual Leif in denial of the data.
Even when it is his own data.
Pretty sure his problem was with how the data was used, not whether the underlying data used was correct.
Don’t get all heated up, Lief, it would take you some time to cool down.
@Dan – The plot is coherent, unlike your response(s). As the text indicates, it shows the relative contributions to GMST of the _outputs_ (in degC) of a simple coupled model whose inputs are TSI (w/m^2), CO2 (ppm) and aerosol concentration are converted to forcing via sub-models of the physical processes, In particular the TSI contribution is convolved (look it up) with an exponential time response which models the relaxation time of the ocean. A portion also being lagged in a separate process to model the time delay of the thermohaline circulation. An system characterized by an exponential time response is sometimes referred to as a leaky or dissipative integrator as opposed to the pure integrator Leif is objecting too. A pure time-integral has a Laplace transform A/s, while the dissipative version has a pole in the Laplacian frequency domain, i.e. Vo/Vi= A sp/(s+sp) where sp=-1/tau, the relaxation (or dissipation) time constant.
So whereas a pure integrator like in Leif’s plot above responds to an impulse with a step, a dissipative impulse response decays exponentially towards zero. This is why Leif’s point about the starting value is both correct and irrelevant. It is correct in that we don’t known where to start the integration. But if we knew the initial condition it would not matter where we start, which is to say its a boundary condition problem. However, this unknown initial condition (which is a constant at the output of the “integrator”) is equivalent to an impulse at the input (integrate an impulse and you get a step), and as mentioned above, the response to an impulse decays toward zero over time. Thus to first order the unknown boundary condition doesn’t matter as long as we throw away a few tau’s worth of data. Fortunately we have TSI data far enough back in time that the BC error can be assumed nero zero at the start of the instrumental period.
It is also not correct to simply integrate about the TSi mean, which is a dynamic value. Rather there is some equilibrium value above which the system gains energy and below which it loses energy. This is a model parameter that must be derived from the observed data.
Here are some of the modeled results
http://wp.me/a2xhN5-9M
http://wp.me/a2xhN5-9N
Note the AMO is still evident in the residual. If we simulate a tambora-sized event
http://wp.me/a2xhN5-9O
If you are interested in a paper descibing the method and results see https://montpeliermonologs.files.wordpress.com/2016/08/tsimodel.pdf
Hmmmm. I wish I understood this a little better. I’ve long mistrusted Leif’s integrating because it just seemed like something was wrong with it, but couldn’t put my finger on it from lack of knowledge and numeracy.
Leif? A response?
===========
But the ocean isn’t a pure integrator. It has a relaxation time constant (pole in the frequency domain) and it also has significant lag as subducted energy is decoupled from the atmosphere until it emerges years later at the poles. It’s true that we don’t know the initial storage condition but this is a transient error that relaxes toward zero. If you assume the system was at at low during the Dalton Minimum circa 1700, the initial condition transient error has 150 years or so do die out by the time the instrumental period rolls around.
Re “curve fitting” without physics:
1) The heat storage/Thermohaline circulation described above is a physical model. Like all models it has parameters that are unknown. Bayesian analysis can give us the spread of these parameters and tell us how much confidence we should but in the model
2) The time domain response is the convolution of the input with the system transfer function. This puts severe constraints on the degree of freedom in parameter selection. It is simply not true that any arbitrary input curve can be matched to a given observation by diddling the parameters.
The plot below shows the results of a plausible model. The lagged TSI (using the series you pointed me to in a previous post adjusted to forcing per the equation you referenced), Note that the TSI signal might account for the rise between 1900 and 1940, and the 1950s decline. Since 1960 the CO2 signal dominates.Admittedly the correlation pre-1900 is poor but so is the accuracy of both time series during that period and we could still be seeing remnents of the boundary condition error.
Hope you are doing well.
Another example of not understanding the difference between power and energy. Energy is the time-integral of power. Temperature divided by the effective thermal capacitance is energy. TSI is a forcing i.e. power. Plotting temperature and TSI on the same graph is like plotting your odometer reading and your speedometer reading on the same graph. It’s nonsense.
Perhaps you should read before commenting. To wit, “The lagged TSI (using the series you pointed me to in a previous post >>>adjusted to forcing <<< per the equation you referenced),
Jeff – Do you even know what a time-integral is? Here is a clue, it has nothing to do with lag. If you can be more specific, perhaps I can help you understand.
Dan – W/m2 x ocean surrface area (m^2) x time of irradiance = Joules, lots and lots and lots of Joules. Lighten up or find someone else to troll. I’m not your huckleberry.
Jeff – That is necessary but insufficient. It would be pretty close if you did that for each year and added them all up. But your graph doesn’t do that. It shows TSI (lagged) not the integral of TSI. The graph is nonsense.
The numerical integration is done correctly and combined with an approximation of the net of ocean cycles and the increase of water vapor at http://globalclimatedrivers2.blogspot.com . The result matches measured average global temperature 98% since before 1900.
Hi Dan – thank you for this post.
http://globalclimatedrivers2.blogspot.ca/
I have been too busy to duplicate your work, so must accept it at face value for now.
It appears your integral of solar activity, combined with a ~60 year ocean cycle, can duplicate average global temperature quite well. The recent “adjustments” to the surface temperature data make this more difficult. I only use satellite temperatures after ~1979,
In the shorter term, the Nino3.4 index appears to predict average global temperature ~4 months in the future, and does so quite well (except after major volcanoes that cause temporary cooling).
https://www.facebook.com/photo.php?fbid=1030751950335700&set=a.1012901982120697.1073741826.100002027142240&type=3&theater
What would tie it all together is a means of predicting El Nino behaviour, for example:
http://www.issibern.ch/teams/interplanetarydisturb/wp-content/uploads/2015/01/Asikainen_03_2014.pdf
Best, Allan
@Dan – See post above August 27, 2016 at 6:55 am
Allan – IMO your work is putting a finer point that my stuff glosses over with 5-year smoothing. Perhaps there is a way to merge the two.
Jeff – So where is your prediction for the average global temperature trend?
My prediction for the trend in 2015 using data through 1990 is 0.035 K cooler than the calculation of the trend using data through 2015. The graphs are there for all to examine.
Not much of a believer in trends, especially those of the time domain variety. I prefer to deal in probabilities. The two plots below show the probability of reaching the x-axis temperature anomaly at 2xCo2, The top graph is for a model derived from unaltered time series. The second plot shows the same model with denoised temperature data using the wavelet denoising described in the paper. The spread is the posterior parameter distribution from a bayesian MCMC-Hastings monte carlo.

FYI Dan – this is one reason why I’ve been busy this summer.
Best, Allan
http://www.highrivertimes.com/2016/08/25/aer-suspends-mazeppa-plant-operations-amid-concerns
AER SUSPENDS MAZEPPA PLANT OPERATIONS AMID CONCERNS
By Paul Krajewski
Saturday, August 27, 2016 5:33:46 MDT PM
Months before the Alberta Energy Regulator (AER) ordered the suspension of all operations at the Mazeppa sour gas processing plant on Aug. 9, it was a former company engineer who informed the regulator about serious safety concerns he had regarding the facility and infrastructure.
Allan MacRae, member of the Association of Professional Engineers and Geoscientists of Alberta (APEGA), reached out to the regulator about what he referred to as potentially “disastrous” safety risks the plant’s operation posed to the public and environment in the months leading up to the AER order.
In an email sent to the regulator’s senior executive on May 28, MacRae stated he had serious safety concerns about the plant that is owned and operated by Lexin Resources Ltd. and LR Processing Ltd.
In May, MacRae said he became aware of issues at the facility and its infrastructure and conducted his own week-long investigation using public records and verbal discussions to corroborate the allegations.
During the early 1990s, MacRae said he was the general manager of engineering for Canadian Occidental Petroleum Ltd., known today as Nexen. He noted the company owned and operated the Mazeppa plant until it was taken over by Compton Petroleum Corp. and, most recently, Lexin.
In a statement from the AER, the information MacRae provided was used in the regulator’s overall inspection and compliance assurance process.
In the initial email, MacRae stated Lexin and LR allegedly failed to pay surface lease rentals, which resulted in loss of access to sour gas wells. The firms also allegedly conducted infrequent injection of anti-corrosion chemicals to its gas pipeline gathering systems and provided inadequate financial resources for plant maintenance, he added.
From his understanding, MacRae said the plant handled sour gas up to 40 per cent hydrogen sulfide (H2S), the maximum amount permitted under AER regulations, with wells located within 2.4 kms of highly populated areas of Calgary.
He said sour gas is a naturally occurring substance that contains significant amounts of H2S and, if released to the atmosphere, could pose extreme health risks to the public and environment.
“As little as 0.1 per cent H2S is instantly fatal when inhaled,” he added.
As a result of his investigation, MacRae advised the AER he found standard maintenance was allegedly not being adequately performed at the facility and infrastructure, which he believed could result in an increased risk of H2S being released into the atmosphere.
“If a large release of H2S occurred and the wind direction was unfavourable, I believe there would be no time to evacuate the nearby communities and a major catastrophe could occur,” he said.
Even if the risk of H2S release was moderate, MacRae said the consequences could still be disastrous.
As a member of APEGA, MacRae said he is ethically obligated to report concerns related to public and environmental safety. For this reason, he informed the regulator of his findings.
As of Aug. 23, the AER reported in an email provided to the Times all but one pipeline associated to the Mazeppa plant had been depressurized, but gave no indication when it would be fully suspended as per AER shut-in requirements. These include each pipe being emptied, purged, isolated and left in a safe state.
Ryan Bartlett, AER public affairs advisor, said the regulator has worked with Lexin and LR to address a number of issues related to facility and infrastructure operations at the plant for several months.
Bartlett said the regulator performed an inspection in February and identified a number of deficiencies.
However, he noted Lexin failed to comply with AER requirements between February and June and was ordered to suspend all facility and infrastructure operations on Aug. 9.
“(This was done) to ensure the plant is in a safe state with no risk to the public or environment,” Bartlett said.
The AER order document from Aug. 9 stated Lexin and LR informed the regulator on June 29 that its sour gas release monitoring system was no longer operational and that if an incident or emergency occurred, the regulator would be responsible for managing the situation, not the firms in question.
In the AER order, the regulator also stated the firms terminated the majority of the plant’s staff on June 30 and left six employees to operate and manage the Mazeppa facility and infrastructure.
Bartlett said the AER continues to monitor and inspect plant operations regularly and prioritizes issues with potential impact to public and environmental safety.
Additionally, he said Lexin and LR have been ordered to provide a comprehensive plan about how the companies will respond to incidents and monitor ongoing operations.
If Lexin fails to comply with AER requirements, Bartlett said the regulator can order complete suspension or abandonment of other energy infrastructure, charge administrative penalties, institute legal proceedings or sanction upper management against working in the province.
“All licensees in Alberta are required to follow our requirements,” he said. “Our rules apply across the board.”
Lexin and its associated firms were reached out to by email and phone for a response multiple times. No answers were provided to the Times by publication date.
pkrajewski@postmedia.com
Allan – Good for you! Doing what Professional Engineers do.
Jeff – Thermalization explains why CO2 (or any other noncondensing ghg) has no significant effect on climate. So-called Climate Sensitivity is not significantly different from zero. Average global temperature does change with water vapor, however, and water vapor is currently increasing (and has been since it has been reported by NASA/RSS since 1988.
Increasing global average water vapor has a warming effect which is countering the on-going cooling effect of dwindling numbers of sunspots and declining average sea surface temperature (declining temperature phase of the net of ocean cycles).
dan says
and water vapor is currently increasing (and has been since it has been reported by NASA/RSS since 1988.
henry says
can you elaborate? why is it increasing? reports?
HenryP – Water vapor increase is discussed at http://globalclimatedrivers2.blogspot.com with links to RSS source data and Willis’ articles in WUWT. IMO WV increase should be self limiting (more warmer clouds radiating, higher albedo) but no sign of it being self limiting yet.
It’s nice to see mechanism here. This make s sense and adds depth.
It seems to me that this paper violates the acceptable speech standards of the #ExxonKnew AGs. Svensmark will likely be extradited and prosecuted for this. If he knows what’s good for him, he should head straight away to his local Ecuadorian embassy and seek asylum.
If Leif ever says the Sun matters, you know what that means… we’re DOOOOOOOOOMED! (All in fun, Dr. S.; wishing you’d update your solar activity plots! It’s been a long time since spring.)
The paper concludes that Forbush decreases have an effect on ions and suggests that ions play a significant role in the life-cycle of clouds, but the number of such decreases is very small [one per year on average] and each lasts only a few days, so the effect on climate is negligible
But that is the whole point of the argument. I do not see Svensmark saying that Forbush events have any impact on climate (in fact, they say that they do not). What they are doing is pointing out that you can see the impact of Forbush events on clouds.
Changes in solar activity less massive than Forbush events cannot be measured because our cloud observations are – quite simply – not good enough. However, once you have shown – as Sevensmark has done- that solar activity affects clouds then you have a mechanism for small changes in solar activity having an impact on clouds – even if we can’t yet measure this.
Is your suggestion that Forbush events are unique and that other changes in solar activity don’t change the level at which cosmic rays reach the upper atmosphere?
Is your suggestion that Forbush events are unique and that other changes in solar activity don’t change the level at which cosmic rays reach the upper atmosphere?
Forbush events are rare and short. The usual modulation of cosmic rays is done by the changing geometry of the solar wind: http://www.leif.org/research/HCS-Nature-1976.pdf
Bob: You nailed it. Leif actually created a strawman in this case. Well done.
Rob, if the solar cycle affected clouds in any meaninful way then we would see that cycle reflected in ICOADS and more recently ISCCP data. We don’t. Wrote about that extensively with data illustrations in the climate chapter of The Arts of Truth reviewed by Lindzen, and again in essay Cloudy Clouds in Blowing Smoke.
The 2010 Dessler paper actually shows clouds are variable, with a likely net feedback very close to zero, not significantly positive as he, CMIP3 and AR4, and CMIP5 and AR5 all have it. Faulty cloud parameterization. See also very poor model/observed cloud comparisons between sat and CMIP5 models for one cloud type in essay Models all the way Down. Only way models come close is if you smush them all together in some meaningless ensemble anomaly mean, because individually they are all way off.
The usual modulation of cosmic rays is done by the changing geometry of the solar wind
===========
exactly! so it the solar wind that primarily affects clouds and climate, not TSI, because TSI is relatively constant, while the solar wind is not.
The problem is that climate science has been looking in the wrong place. They have been looking at thermal radiation when they should have been looking at atmospheric ionization.
The geometry of the solar wind changes over the solar cycle [hence the variation of cosmic rays], but the variation repeats pretty much the same in every cycle, so there are no long-term changes.
Oh yes, time to bring up my clock again. The shape of the peak of cosmic rays alternates from sharp one eleven year cycle to flat the next. This gives two of one type of peak and one of the other in each phase of the PDO, with the next phase having one of one type of peak and two of the other.
This is a lower order effect, but how long has it had to entrain something in the oceans? I can’t calculate it, but I can see the scale.
========================
Leif let me see the peaks, then I heard the clock.
===================
[??? .mod]
The longer it’s had to entrain, the harder it will be to find. How long has the sun been alternating shapes of peaks like this, Leif?
=================
As long as the Sun has been around.
Entrained, little doubt, when the basins were configured differently, but carried along, carried along.
============
Given that the climate is a chaotic system, it isn’t even a theoretical possibility that we should be able to expect a single run to produce accurate results.
The first instinct would be to look for attractors but Lorenz pours cold water on that idea.
Thanks, Leif; I don’t think we’ll know this for awhile.
=========
Know what?
heh, mod, the ‘shapes of the peaks’ and the ‘clock of the oceanic cycles’. It’s no good if it has to be explained.
============
[Sorry about that … But we do read each comment. .mod]
Leif, to know if there is any validity to my hypothesis. We’ve been talking about this for a long time. Please, don’t play dumb.
There is a difference from one eleven year cycle to the next in the shape of the peak of cosmic rays. You’ve told me this yourself, and I understand that it is a lower order effect. This probably has some minute effect effect on cloud formation, and grouped in threes to a phase, sixes to a cycle of the PDO, for instance, it might explain the alternate cooling and warming phases of the oceanic cycles.
It has had billions of years to entrain. I hope it doesn’t take that long to disprove my hypothesis.
==========
and grouped in threes to a phase,
They come in groups of two, not three.
At the next solar minimum the GCRs will have a flat peak and intensity will be a few percent less that the last minimum. If the GCR effect itself is small, the flat/peaked effect is even smaller. I do not expect to see any effect above the noise.
But clearly there are long term changes in solar magnetism, as in the Maunder and Dalton Minima, and prior such low SSN intervals.
Solar activity now is close to Dalton minimum conditions. Is the climate?
Within the entrained oceanic cycle, they are grouped three to a phase and six to a cycle. One group of three is in the cooling phase and the other, different, group of three is in the warming phase. I thought you understood this. My apologies for not being more clear, now and in the past.
=================
They come in groups of two, which you can combine in any number of [mostly meaningless] ways. Whatever you do, there does not seem to be any measurable effect. A test of this is to look for a difference effect in cycles from max to max [cosmic ray cycles go from solar max to solar max] for the two possible cases [flat/peaked]. If there is any such effect you would have a 22-year cycle in climate, and none have been demonstrated [as with anything else, there are lots of claims of such cycles – but none compelling]. If there were a 22-yr cycle, then six cycles would be, say, [(low-high-low)-(high-low-high)] with combined effect [(low)-(high)], but no 22-yr exists, so why bother?
I agree we won’t see much effect from this tiny difference. I’m proposing a mechanism by which the oceanic cycles have been entrained to this tiny effect from the sun. Maybe we’ve been talking past each other all these years.
=============
Well, there is a 22 year cycle to the shapes of the peaks. And you have understood the clock and the fit to the oceanic cycle.
===============
I understand your 4:57 argument. We can but look some more, I guess. Curious, though, that there are 33 year events in climate and not 22 year ones.
===================
Still, it might have something to do with the timing of the effect, the shape. That would not necessarily be accounted for in your argument at 4:57. I think our difference might be that I’m suggesting a much smaller effect, entraining over eons, an effect not captured by your test.
===========
eons don’t do much for the current debate…
Yup, and yet the oceans lash to a beat.
============
LS: “The geometry of the solar wind changes over the solar cycle [hence the variation of cosmic rays], but the variation repeats pretty much the same in every cycle”
I thoroughly disagree.
Cosmic rays are an inverse proxy for sunspot cycles but not for the solar wind. Just look at the neutron rate through the mid 1970’s when the solar wind was very strong:
http://neutronm.bartol.udel.edu/listen/fig5.gif
Sigh. the cosmic ray variation has two components:
1) a major one due to the changing geometry [as I described in my link] of the solar wind
2) a smaller contribution from solar flares, CME, and other transients.
And compare the neutron count to the solar wind profile between the sunspot maxima of 1969 and 1980:
http://snag.gy/PrMAr.jpg
@ Rob
My thoughts exactly! And it is a bloody shame that the attackers miss the point of Svensmark and only go for the Forbush events. It just shows they know that Svensmark is right.
I hope I live to see the day that Svensmark gets his Noble Prize in Physics, The man is a genius.
And give him a Noble Peace Prize too for saving humanity from the horrors of manmade climate policies.
Leif wrote:
lsvalgaard on August 25, 2016 at 2:39 pm
The geometry of the solar wind changes over the solar cycle [hence the variation of cosmic rays], but the variation repeats pretty much the same in every cycle, so there are no long-term changes.
——–
This statement, I think, does not mean anything. When you say long term, that depends on the time scales. There are an almost infinite number of time scales, feedback and lag effects. The idea that cosmic rays affect clouds is known. To dismiss the affect as net zero with what you wrote assumes everything else is constant and known. Cloud cover is chaotic and affected by many things. If we know something can effect cloud cover in a certain direction it seems reasonable that ir must have an effect.
we know something can effect cloud cover in a certain direction it seems reasonable that it must have an effect.
We don’t KNOW that there is an effect. The observations [increasing cosmic rays, global warming instead of cooling] indicate that there is no effect of the kind claimed.
Good, thanks
lsvalgaard on August 26, 2016 wrote:
We don’t KNOW that there is an effect. The observations [increasing cosmic rays, global warming instead of cooling] indicate that there is no effect of the kind claimed.
—
Leif; thank you for taking the time to entertain me. I can see that we are saying different things. I’m not saying we can see the effect on global temperatures. We can only do a controlled experiment in the lab. We cannot do a controlled experiment in the skies –we do not know what the response is with and without the stimulus in the skies. I am also not saying that delta global temperatures can even be measured, at all, especially with regard to how cosmic rays affect temperature.
What I am saying is that we do know that cosmic rays affect cloud formation in the lab at least. I believe it is reasonable to assume effects in clouds in the skies based on empirical results in the lab. I would say that if cosmic rays affect cloud formation and cloud formation affects climate, then there could and or should be some effect on climate.
LS: “a major one due to the changing geometry [as I described in my link] of the solar wind”
Sigh, that is baloney as the charts I have posted show.
But solar activity can not possibly have a direct impact on climate…
All of the models tell us that CO2 is the only variable that matters, and their predictions have all be bang on accurate so far. Why just look at the ice free poles, and the 15 foot high rise in sea level that has swallowed up Manhattan, and of course yesterday I was nearly killed by the hottest day on record again not to mention the three hurricanes and two earthquakes that global warming caused in my neighborhood.
“But solar activity can not possibly have a direct impact on climate…
“All of the models tell us that CO2 is the only variable that matters, and their predictions have all been bang on accurate so far. Why just look at the ice-free poles, and the 15-foot-high rise in sea level that has swallowed up Manhattan, and of course yesterday I was nearly killed by the hottest day on record again – not to mention the three hurricanes and two earthquakes that global warming caused in my neighborhood.”
Nice. I particularly liked the, “…and of course yesterday I was nearly killed by the hottest day on record again…”
Thumbs up, and keep it up! ;^>
Brad Crawford
The IPCC position on the influence of the sun is pretty clear:
Ref: Fig AR5;WGI; TS-07
IPCC hypothesize virtually no direct or indirect influence from the sun on earths global temperature.
By their hypothesis mankind pulled the earth out of the little ice age – well before we really started to emit CO2 into the atmosphere – truly amazing.
The usual modulation of cosmic rays is done by the changing geometry of the solar wind
================
solar wind is nowhere in the IPCC chart. Instead they reference solar irradiance.
Which is proper as cosmic rays have nothing to do with the climate.
lsvalgaard That may be true but from I observe CO2 does not either. After all the CO2 crowd has failed most if not all of their predictions as to the effects of CO2.
“cosmic rays have nothing to do with the climate”
It doesn’t look like it, but that doesn’t rule out the solar wind.
If there only were any evidence of that, it would be nice, and validate a lot of my work on this back in the 1970. But alas, that is not the case.
“lsvalgaard That may be true but from I observe CO2 does not either. After all the CO2 crowd has failed most if not all of their predictions as to the effects of CO2.”
Then why bring it up? Dr S. said nothing about CO2.
lsvalgaard, can you please provide in brief summary the key factors as you see them that influenced/caused the climate to change from cold to warm from “Little Ice Age” to early 20th Century? Cheers. L
http://www.leif.org/research/Climate-Change-My-View.pdf
Thanks LS, much appreciated, good stuff… Cheers. L
“But alas, that is not the case.”
As far as you can see…
>>Leif
>>Which is proper as cosmic rays have nothing to do with the climate.
Which is not true, if Svensmark is correct and cosmic rays do have a direct effect on cloud cover. And while the normal sunspot cycle (and therefore cosmic ray flux) shows little medium-term variation, they MUST have varied considerably during the Maunder Minimum.
So there could well be sunspot-cosmic-ray influences on climate, during grand minima. And this is just one of many forcings and feedbacks that comprise the complex drama that is our climate. So don’t expect to draw a wavy line and find the complete answer just from solar influences.
R
And while the normal sunspot cycle (and therefore cosmic ray flux) shows little medium-term variation, they MUST have varied considerably during the Maunder Minimum.
That is just begging the question. There is some evidence that the Maunder minimum was not all that different as far as the Sun is concerned: http://www.leif.org/EOS/2011GL046658.pdf
“Therefore, the best estimate of magnetic activity, and presumably TSI, for the least-active Maunder Minimum phases appears to be provided by direct measurement in 2008-2009.”
The Maunder spots were ‘large, sparse, and primarily Southern Hemispheric’. That argues for something different going on in the sun.
============
I note that H2O (g) is not listed as a greenhouse gas on this table, except for a small stratospheric contribution. Yet the chart on my wall showing radiation absorbtion bands are rather wide for H2O.
That is because H2O is described as a feedback and not a direct greenhouse gas. This discards a huge amount of physics but of course it means that CO2 can be elevated into its wholly unearned position.
They neglect completely the vast energy storage capacity of the ocean. Small but positive effects accumulated over time can have a much larger effect than the direct warming the IPCC considered.
Anyhow, IPCC regard the energy accumulation on earth – the global warming – to be the sole responsibility of human activity. There is no room in United Nations theory for long term warming by natural causes. Just as if IPCC know, without direct measurements, what the “forcings” where like in the little ice age, ending in the preindustrial times around 1750. United Nations is blaming all climatic changes since the little ice age on mankind. Pretty absurd in my mind.
Could the cosmic cloud seeding be causing the increase in extreme rain events as well (thereby turbocharging Earth’s heat removal system)?
I ask because locally at least, we’ve been blowing through rain forecasts since mid June (sometimes getting up to 2 inches when the forecast called for a couple of showers at most, and also accompanied with some unusually large temperature drops compared to a normal event). On the flipside though, it’s created perhaps one of the greenest Summer periods in memory.
No. GCR from galactic supernovas don’t get focused on Kansas. And see comment below concerning event frequency and duration based on the paper itself.
It is the dramatic cool down (.5 C) from El Nino. All that water vapor from ocean evaporation has to return to the surface.
We now have a wonderful opportunity to see if what he proposes is true, although it will take quite a few years. We are coming into a period of few sunspots and a quieter Sun and we have the satellites in place to measure results.
So those of you who don’t believe in what Dr. Svensmark presents, please keep any denigrating comments to yourself. We don’t need them.
this is a big time paper….yet…I haven’t seen anything In the huff post, WaPo. Resiliance, Yahoo, mashable, Breaking Energy about it…..hmmmm…wonder if it could be they are biased?
Perhaps it is not such a big time paper, after all.
Denial to the end.
It’s certain warrants more exposure than a crack in the Antarctic ..that all these rags picked up on. The correlation is better than the co2 correlation which Munshi sees as spurious and doesn’t pass the Monte Carlo test. The co2 rate is purely linear….slightly exponential whereas temperature is obvious not linear. I don’t know how this stacks,up with which a statistical correlation but the fit seems much better than co2
Read my comment above.
and?
I don’t think so. See following comment for details.
yes it puts a nail in the coffin of GCR having ANY measureable effect on the long term secular trends
in climate.
[you yourself have said science is never a closed cased, so stop with the ridiculous coffin metaphors, you sound like Joe Romm -Anthony]
Meanwhile, the religious trends are very obvious.
If the sun can influence cloud formation (and I really think it does over and above just emitting light), then couldn’t a ground based system generate ions in the right layers of the atmosphere to produce clouds? Kind of like treating cancer, you would have several beams that intersect at a specific spot. That would make an interesting experiment if even possible.
Produce high level clouds to reduce heat, and low level clouds to produce rain.
Of course, I wouldn’t want to be the bird that flew through the beam….
Meanwhile, yet another study that helps to explain the up and down nature of temperature without invoking ‘nasty deadly polluting CO2’ as the main culprit.
It is the sun and the evidence is mounting and by the way global cooling has begun.
“global cooling has begun”
That’s a silly statement. You don’t have any clue, and neither does anyone else.
The clue is in the ocean and I expect we’re about to see it. ARGO’s on a plateau, perhaps very slightly tilted. What’s next? We’ll see.
=============
No, Kim. With respect, it’s just jumping at squiggles, and a non-existent global temperature.
It’s not a silly statement. You’re the one who doesn’t have a clue, J.A.
“Large eruptions on the surface of the Sun can temporarily shield Earth from so-called cosmic rays which now appear to affect cloud formation.”
It seems that they always have. It’s just that now the Warmists are likely going to have to deal with it.
The fact that Earth has been warming while the Sun has been cooling certainly helps.
http://www.woodfortrees.org/plot/gistemp/from:1972/scale:200/plot/gistemp/from:1972/scale:200/trend/plot/sidc-ssn/from:1972/plot/sidc-ssn/from:1972/trend/plot/esrl-co2/from:1972/offset:-320
But, at best, you are counting your chickens before they hatch.
Read the paper. There are only 26 FD events. The strength ranking is very mathematical, but the underlying logic is weak, so whether the ranking is ‘real’ is open to question. The matching to clouds involves some semi arbitrary lags, and the end statistics are pretty weak. A Monte Carlo bootstrap does not give you a true statistical significance about the actual observed GCR/cloud data. It estimates a significance for a model of the data. So interesting, but not compelling. Especially as there are many more abundant cloud condensation nuclei sources. Turpines and isoprenes from coniferous and nonconiferous forests, respectively. Dimethylsulfide from ocean algae. Many more of those condensation nuclei in the atmosphere than from GCR, imo.
Little to do with climate even if Svensmark has made his case. 26 FD events in 16 years, with a statistically weak effect lasting about a week. ~26 weeks out of 16 * 52 = 832. Nothing happening concerning GCR and clouds the other 97% of the time that climate is still doing its thing with clouds.
ristvan,
“Nothing happening concerning GCR and clouds the other 97% of the time that climate is still doing its thing with clouds.”
Huh? Wouldn’t things “concerning GCR and clouds” be happening all the time? . . And wouldn’t small changes in total cover/mix of clouds, be essentially impossible to detect/measure at this point in time?
(I tire of people speaking in absolutes, when their title is not God ; )
And wouldn’t small changes in total cover/mix of clouds, be essentially impossible to detect/measure at this point in time?
If they are, then we cannot honestly claim that those impossible to measure changes show that GCRs are the main driver of observed climate variation, can we?
Of course not, Isvalgaard, but neither can we rightly speak of GCRs not being a significant component in climate variation . . can we?
Yes we can, because there is no real evidence for that. The past several solar cycles, the sun has become quieter and cosmic rays have increased, which should have cooled the climate. Instead it has warmed. So, no evidence of a significant GCR influence.
It would be neutral lol apparently, just saying I find it funny…
“The past several solar cycles, the sun has become quieter and cosmic rays have increased, which should have cooled the climate. Instead it has warmed.”
Several? It seems like two to me . . Should have cooled? What if there are other significant components and/or time delay aspects? The “control knob” concept is kinda simplistic as I see these matters . .
Cycles 21, 22, 23, and 24.
PS~ I utterly reject the idea that you can “rightly speak of GCRs not being a significant component in climate variation”, period. You are not God (I’m pretty sure ; )
to my mind it makes as much sense as Co2 being the main driver of climate.
Earth may have warmed during Cycles 21 & 22. The next two, not so much.
last decade the warmest ever…
http://www.climatecentral.org/gallery/graphics/10-warmest-years-globally
JK, there is no discernable GCR effect outside the FDs. In this new paper by him. My comment stands. Your logic fails.
Only in faked, totally bogus, adjusted, cooked book “surface data”.
Check me if wrong, but IMO in the UAH satellite data, the decade 1998-2007 was warmer than the interval 2008-2016, so far. This El Nino year might change that, but a La Nina appears to be setting up.
Going from memory here, so again, if wrong, please correct me.
UAH had 2014 as third warmest (or maybe 6th?), but replaced it with 2015 as third warmest in the satellite record, while 1998 remained hottest. If this year surpass 1998, then even in one of the satellite records, we’d have a new winner. But 2017 probably won’t be.
Which, now that I think on it further, means I should have included Cycle 23 as warming, even though falling from its early (1997-98) height, as it appears overall warmer than Cycle 22.
ristvan,
“JK, there is no discernable GCR effect outside the FDs.”
If an effect is “discernable” due to a reduction at times in the effective agents (GCRs in this case), then it seems to me the effect itself must be going on when the reduction is not occurring . . I don’t understand what the flaw in that logic is . . Perhaps I’m misunderstanding something about this stuff, but otherwise, I feel my statements stand . .
lsvalgaard, cycles 21, 22 and 23 were larger than cycle 20, smaller than 19; they were comparable to 18 and 17; and larger than any back to cycle 11. Since 1930, only the current one, 24, has been distinctly low — that, and the falloff from 23. I don’t expect the serious cooling quite yet.
Cycle 25 will probably not be smaller than 24: http://www.leif.org/research/Prediction-of-Solar-Cycles.pdf
LS: “The past several solar cycles, the sun has become quieter and cosmic rays have increased, which should have cooled the climate. Instead it has warmed.”
In previous solar minima, negative North Atlantic Oscillation increased, which would drive a warm AMO. That would initially give an accelerated rise in the global mean surface temperature, like there was from 1995-2005, followed by a long pause 😉
Dr Svalgaard:
You write:
“The maximum effect does not last a whole week, so any impact is at least three times smaller than what you claim”
I assume what you mean by this is “any impact is at most one third the size…..”
After all, one cant get less than one time less than any quantity.
Precision in the use of language, especially when attempting to communicate arithmetic concepts is important.
“three times less?
geez.
so any impact is at least three times smaller than what you claim
It could be four times smaller…but at least three times. Perfectly clear and understandable
https://www.ahdictionary.com/word/search.html?q=time
6. b. times Used to indicate the number of instances by which something is multiplied or divided: This tree is three times taller than that one. My library is many times smaller than hers.
The beauty of the English language [that I have come to love] is the wonderful flexibility and lack of respect for [silly] rules peddled by small minds.
There’s too much obsession with what GCRs and clouds might be doing to the atmospheric temperatures. What about what they are doing to the ocean temperatures.
================
>>Leif
>>The past several solar cycles, the sun has become quieter and
>>cosmic rays have increased, which should have cooled the climate.
Try adding the PDO and AMO cycles into the equation, before being too confident with your statements, Leif. And the reduction in solar cycles does not really take hold until 24.
R
And the reduction in solar cycles does not really take hold until 24.
http://www.leif.org/research/SC21-to-24.png
Ristvan,
26 large FD events over 16 years is 1.6 per year.
They last about a week which is 1.9% of a year.
Each of these caused a reduction in atmospheric ions of up to 20 to 30%
This equates to an annualized impact on atmospheric ions of 0.75% which is a significant impact.
Svensmark has proven in laboratory tests, and now through real world observations, that variations in cosmic rays cause variations in cloud cover. Specifically, he has now shown that solar eruptions cause variations in cosmic rays which cause changes in cloud cover.
If the FD effect on cloud cover lasts a week, I presume you would now accept that, at the very least, changes in solar eruptions do directly affect the weather! Thirty years of such changes would make it a climate change?
Don’t show you bias so blatantly. It is not 16 years, but 20 years, The maximum effect does not last a whole week, so any impact is at least three times smaller than what you claim. And you have not shown that a small fraction of a percent is in any way ‘significant’.
Isvalgaard,
To accuse someone of bias is an ad hominem attack. You then make the assertion that the effect is trivial. All you need is an appeal to authority and you have the trifecta!
Did you take into account medium and small FD events? The truth is that nobody knows what the temperature impact would be of that much reduction of atmospheric ions – or double that much – or half that much. Yet you seem certain it is trivial – I am not.
To accuse someone of bias is an ad hominem attack.
Bias is something that shows itself.
You then make the assertion that the effect is trivial. The truth is that nobody knows what the temperature impact would be of that much reduction of atmospheric ions – or double that much – or half that much. Yet you seem certain it is trivial – I am not.
The null-hypothesis must be that there is no effect. It is up to he who claims that the effect is significant to actually show [with calculation, numbers, evidence, …] that it is. Not just to say that it is.
The Last decade would expected to be the warmest still with a slowdown in the warming. Oceans have 1,000 times more stored heat than the atmosphere……..if this effect is small it can lead only to a very gradual slowdown in the warming as the great inertia from what was a previously bigger imbalance can take a couple of decades to slowly turn….as stored heat in the oceans grdually belches out…….like we’ve just seen with the recent Èł Niño.
This does not mean global cooling or even that GCR’s have a significant effect. Just that if its small but exists, you won’t find it jumping out because the new imbalance, if there is one, will be blended in slowly and challenging to separate from ocean cycles and other factors, like the additional increase in CO2.
Mike, you’re assuming that the heat won’t just stay down there. There is a temperature gradient in the ocean and the ocean should keep warming until a new equilibrium state is established.
It’s kinda silly to look for the effect in atmospheric temperatures, and argue about it, when the action is in the ocean temperatures. That’s the proposed mechanism for clouds and GCRs.
==================
Phase lags and complex systems… “Harder to pick than a broken nose” 🙂
ristvan August 25, 2016 at 2:04 pm
ristvan my friend, baby steps. What Doc Svensmark is doing is new. Records only go so far. Is he right or wrong?I do not know not enough observations and a lack of proper equipment. Some of which has to be yet designed and built. Excuse, imagined first. Right now Doc Svensmark and his merry band are proposing a alternative possibility to CAGW. Good for them.
I agree don’t treat it as fact, but do not dismiss it because it is a work in progress.
I have the greatest respect for Doc lsvalgaard and understand that professional rivalries can play a role.
The question is who is holding the Brontosaurus head.
Lastly on a different subject the Karl paper. I have been told that the agw folks had a problem with ship temperature readings, and thus are adjusting the buoys to match suspected errors.
Have they used modern comparisons with the SS John W Brown? It is a intact Liberty Ship that runs tours on the eastern seaboard. Its intake values for temp measurements should be the same as the 1940s.
Next what do you know of the Defender Engines used in smaller ships? Coast Guard vessels. Some produced by Scott 7000+ by Hudson. The Hudson engines did not have sea intake it was all internal. If their data base uses these ships ( they would have 4 to 6 engines for power plants) they have a problem.
sorry off topic its just been bothering me
michael
MM, where to begin? You want to win the climate war against warmunists, or win your own personal little skirmish? Ponder that long and hard. On old Liberty ship on one existing route using one old defender engine says NOTHING about the world. Nothing at all.
Svensmark is a skirmish, as pointed out above by event timing and duration. The big climate battles are model veracity, climate sensitivity, failed warmunist past ‘projections’, and renewables intermittency. NUTS, as General McCauliffe said at the Bulge Battle.
Nicely U Trimmed Sense 2 4.
====================
?
try again
michael
This is wrong .
Please ignore ” Mike the Morlock August 25, 2016 at 6:17 pm”
I was looking for feed back.
The ship I referenced is a museum ship. rebuilt to spec.
20,000 lite tonnes I think. My point is how can you use all of these different ships for measuring temperature without even knowing the power plants.??? The Defender and other Scott engines were Gas powered not oil and ganged to gather in Coast guard and maybe LST and LSP type ships all ocean going Are the included in temperature data bases? I Know not. Toss in lend Lease.
What I am trying to say is Using ship data is bad idea and does anyone have information as to the engineering spec.of ships of the times? I am outside my level of incompetence. Not my area.
michael
Mike,
I have been a ship’s engineer during a few years a long time ago (1965-1968). Cooling water inlet was monitored constantly, especially for the banana ships which needed a lot of exact cooling (11 +/- 0.5 °C) to prevent ripening at one side and “freezing” on the other side. In that period bucket measuring of seawater surface temperature was probably done too, but I am not sure, as that was done by the deck officers. The data were sent to the meteorological service together with wind speed, cloudiness, types of clouds,…
In the early days, there were only bucket measurements, even these changed with the type of bucket (more or less isolated or not at all). Motor inlet temperatures also differs from the bucket temperatures for the simple reason that the temperature of the upper surface and a few meters down at the motor inlet may differ with several degrees…
Even satellite measurements of the sea surface is not that easy: satellites measure the “skin” temperature, that is of the upper fraction of a mm, which can be several °C hotter on a sunny day and cooler at night than in the rest of the upper meter of water…
That all needs corrections to make the different data sources more or less comparable, which in general are quite arbitrarily for the far past.
The newest “correction” by Thomas Karl is of a different order and obviously introduced to kill the “pause”…
Like the kind of small minds who repeatedly refer to the period of time since 1850 as “ever”
Dr Svalgaard?
Way I see it is that according to Leif, the Sun could simply disappear from the sky and it wouldn’t make the slightest bit of difference to us!
Sun could simply disappear…it wouldn’t make the slightest bit of difference
==========
some solar scientists might have to change jobs.
Would it be a problem??
“Way I see it is that according to Leif, the Sun could simply disappear from the sky and it wouldn’t make the slightest bit of difference to us!”
I would say that makes you, at best, pretty obtuse. At worse, willfully ignorant.
(or maybe sarcastic?)
not for at least 8 minutes…lol
I’ve looked at clouds from both sides now.
From up and down and still somehow
It’s cloud’s illusions I recall
I really don’t know clouds at all.
Joni Mitchell.
When I read “Svensmark publishes” my immediate thought was “Pippa Passes”.
I think I have seen the light at the end of the tunnel and after a careful spectral analysis, I’m pretty sure it’s not a locomotive. 🙂
commieBob
“Pippa Passes” — Had to look that one up. Didn’t read it, read a little about it. Think I will skip it. If Pippa stands in for a poet then the premise is that a poet spreads (or at least preaches) morality as he passes through the world making the world a better place.
You know of any poets who are making the world a better place? You do get a lot of left-wing holier than thou babble smearing people who are far more moral than the poets.
Eugene WR Gallun
This girl gets one day a year off. She spends it walking through the country singing. As a result, things happen that she is totally unaware of.
You can read anything you want into poetry. I prefer to think of Pippa as Lorenz’s butterfly flapping her wings and causing a bunch of stuff plus a snow storm in Detroit (which, for some inexplicable reason, Browning omits to mention). Interesting coincidence … my Lit 100 professor became a raging drunk the same semester I took his class.
I know of one. Abai_Qunanbaiuli (1845 – 1904) is pretty much the national poet of Kazakhstan. His major work is The Book of Words. In it he excoriates his countrymen for being vain, lazy, ignorant, racist, and stupid and he exhorts them to get their asses in gear. His simple message takes a mere 45 chapters.
Did he improve the people of Kazakhstan? Perhaps. In any event, he said things that had to be said and the people loved him and did not string him up.
Wasn’t moshe crowing about his looking at the last Forbush Event. I wonder what he said then.
===============
They used ISCCP, which classifies clouds at 3 levels. I used AIRS which gives cloud cover at 26 pressure levels.
For the STRONGEST event ever ,, in 2003.. they found a 2% decrease in Cloud fraction over a couple
days.
Basically.. in 26 years of data they pick the most extreme events — 26 of them.. and the Most impactful
only shows a 2% decrease in CF.
The events I looked at were all after 2004.. so I could also look at CRN data ( temperature and solar irradiance )
I found nothing.
AIRS does go back to 2002, so I could go back and see if the singular event in oct 2003 shows up
Thanks, moshe for the follow-up. I got a safe bet; the effect is subtle. Sidebet on oceanic overturning rather than direct cloud effect for the climatic result.
==============
In a paper describing the experiment at CERN, Kirby showed this Figure [left-hand part]:
http://www.leif.org/research/Kirby-Flaw-GCR-14C.png
It was supposed to show how the cosmic ray flux [blue curve] over the past 2000 years tracks the temperature [the red curve from the 18O changes]. The match looks pretty good, but is totally fake. If the climate responds to the GCR flux it should respond to the ACTUAL flux. The actual flux depends strongly on the geomagnetic field. The right-hand part shows the actual, real GCR flux [red curve] and the flux from which the geomagnetic influence has been removed [to show the pure solar effect]. Using the real, actual flux removes the nice [spurious] correlation.
Leif needs to stop torturing the data to try to make it come out the way he wants it to come out.
This is to the point of ridiculous but it is entertaining but nothing more.
[You’re] wrong Leif on all counts.
You need to stop your unfounded and desperate ravings. If this were my blog you would be banned.
Yes I’m thinking about it, Salvatore has been pretty rude. It think for now we’ll just put his comments to a status of requiring approval.
But it’s not your blog…
(it’s anthony’s…)
Leif’s right-hand graph lacks any time-scale, but still shows strong high-frequency coherence between red and blue curves. Does this imply that the low-frequency coherence evident in the left-hand graph is largely an artifact of the geomagnetic field?
It, obviously cover the same time span as the left-hand part.
Does this imply that the low-frequency coherence evident in the left-hand graph is largely an artifact of the geomagnetic field?
It is an artifact of removing the influence of the geomagnetic field.
some of the high-frequency stuff is due to the influence of climate on the observed GCR flux.
OK, teaching moment; how does climate effect the observed GCR flux?
==========
By changing the atmospheric circulation.
Much gracious.
===========
lsvalgaard August 25, 2016 at 4:42 pm
By changing the atmospheric circulation.
HOW?
Sort of the wrong question. What the question should be is: if the circulation of the atmosphere changes what will be the effect on the observed GCR archives? The residence time for CO2 in the atmosphere and biosphere and oceans is long [perhaps 40-50 years] so to extract the solar signal we need to model the uptake of the reservoirs and that involves assumptions about the movement of air parcels with CO2. For 10Be where the residence time is much shorter [perhaps 2 years] the situation is easier, yet the problem there is that 10Be found in ice cores is not generated there, but at lower latitudes [lot more area down there] and is transported by atmospheric circulation to the polar regions and deposited there. So again, the climate plays a role. It is estimated that more than half of the GCR signal is of climatic origin. This is, of course, a bit controversial, so suffices it to say that there is considerable uncertainty on this issue. We badly need an ice core from Mars [or the Moon].
Hmmm, observed or proxied? Thanks for the further discussion and the admission of controversy.
===========
If the considerable low-frequency coherence is truly “an artifact of removing the influence of the geomagnetic field,” then by analytic logic the geomagnetic field must be unrelated to the climate [del 18O] signal. Yet we’re told here that changes in the atmospheric circulation, certainly an integral part of climate change, effect the observed GCR flux. Inasmuch as spurious coherence is hard to come by in a geophysical setting, this seems a circuitous, not a compelling, explanation.
Svalgaard writes: ” if the circulation of the atmosphere changes …”
Could you describe the change? What in the circulation is changing and in what sense would that influence the GCR archives? Thx
Please go on. This is a sensitive uncertainty.
==========
How do we validate the proxies, uncertain of past climate as we are?
=============
lsvalgaard
August 25, 2016 at 7:30 pm
Unfortunately, a Martian ice core retrieval isn’t in the cards any time soon. Will probably have to await a manned mission, at best in the 2030s.
http://www.cnbc.com/2016/04/02/nasas-bolden-mars-mission-is-closer-than-ever.html
As you probably know, Purdue scientists planned a robotic ice core mission back in the 1970s:
http://www.wired.com/2013/10/mars-polar-ice-sample-return-1977-1978/
G. I don’t see why that robot, updated, isn’t something all parties could get behind, perhaps even a private one. It seems key to me, to settle something important and uncertain.
==============
One has to laugh at those who are in denial of the data which shows in no uncertain terms the connection between solar and climate and the secondary GCR effects upon the climate.
Well done Leif.
“Large eruptions on the surface of the Sun can temporarily shield Earth from so-called cosmic rays which now appear to affect cloud formation.”
The direction of the Suns polarities [-n +s] “shield” Earth from so-called cosmic rays.
Leif speak for yourself . I am simply looking at the data which supports my views and not your views.
Now if future data should show that I am wrong I will accept that fact but for now the data is supporting my assertions. That is the reality for now.
I am simply looking at the data which supports my views
That is called confirmation bias: only looking at what supports your view.
wrong.
[actually, Dr. Svalgaard is correct here about confirmation bias -Anthony]
“Confirmation bias, also called confirmatory bias or myside bias, is the tendency to search for, interpret, favor, and recall information in a way that confirms one’s preexisting beliefs or hypotheses”
https://en.wikipedia.org/wiki/Confirmation_bias
Ain’t that the same definition that applies to you, lsvalgaard?
Study the data and make up your own mind.
I’m in the process of studying some people who have studied the data, lsvalgaard, and I just asked one of them a question ; )
Better stick with the data instead of playing armchair psychologist …
hmm . . I seem to be doing OK, thanks for the tip, though ; )
JK, I don’t think anyone on Earth has searched as hard as Leif has for a sun climate connection. That’s why he subjects himself to the abuse of the unwashed; he’s looking everywhere for one. Now I’ll heave meself out of this upholstery and get me hat.
==================
kim,
Either the potential for conformation bias i relevant to Lief . . or he is not a mere human, if you catch my drift. Therefore, it is hypocrisy for him to flatly accuse another of it, and not answer yes to my question, it seems to me.
If a person with . . problems accepting the potential for their own bias studies things for decades, it might be a futile effort to some extent anyway, I suggest.
Not necessarily, Anthony, not if you misread his meaning . . *I am simply looking at the data . . which supports my views and not your views.*
Readers, please consider carefully.
Salvatore Del Prete writes;
“Leif speak for yourself . I am simply looking at the data which supports my views and not your views.
Now if future data should show that I am wrong I will accept that fact but for now the data is supporting my assertions. That is the reality for now.”
And lsvalgaard generates a snipped quote and reaction to that;
” I am simply looking at the data which supports my views
That is called confirmation bias: only looking at what supports your view.”
….
I suggest a bit of caution is called for . . ’cause that ain’t fair, in my eyes.
You should be looking for information that discredits your findings. Good science is about proving yourself wrong.
Svensmark certainly provides clear evidence for the effect of Forbush events upon cloud cover on the high-frequency time-scales of weather systems. But the claimed “remarkable correspondence to the HADCRU3 global temperature record” of the time-integral of Leif’s SSN series simply doesn’t stand up under cross-spectrum analysis. General lack of coherence at these lower frequencies is evident even to the naked eye.
Yes it does.
Svensmark has provided experimental evidence on the behaviour of ions, nothing else.
And nothing new!
The time integral of solar activity plus ocean oscillations [which are also driven by solar activity] can explain 95% of climate change over the past 400 years.
Exactly that is what the data says.
I’ve got mechanism posted above which might explain the sun-oceanic cycle connection. It proposes a tiny effect from the sun but a long time to entrain the phenomenon in the oceanic basins.
==========
Do the warmer and cooler masses of water moving through the cycles synchronize occasionally with fluctuations in external inputs?
What the warmists here are are in a row about is there is a distinct possibility that there is a chink in their armor that co2 is the main driver for temperatures because there is no natural cause. This clearly shows that there may be a natural explanation for the last centuries temperature increase
On this particular occasion, Leif Svalgaard and Rud Istvan are both wrong. Well, disingenuous at best.
Leif says “the number of such decreases is very small [one per year on average] and each lasts only a few days, so the effect on climate is negligible . Rud says “26 FD events in 16 years, with a statistically weak effect lasting about a week. ~26 weeks out of 16 * 52 = 832. Nothing happening concerning GCR and clouds the other 97% of the time “.
The DTU article says “The effect from Forbush decreases on clouds is too brief to have any impact on long-term temperature changes.“. So for both Leif and Rud to dismiss the findings on the grounds that Forbush Decreases have very little effect on climate is ridiculous : the paper makes no such claim.
So what is going on, and what are the real findings of the paper? The answer is that something more subtle is going on. The key quote is “The Suns contribution to past and future climate change may thus be larger than merely the direct changes in radiation “. All of the “climate” models and all of the IPCC reports recognise no possible solar contribution to global temperature change other than by direct radiation. This Svensmark paper blows them out of the water. The challenge now is to work out just what the solar impact really is. We can be fairly confident that Leif and Rud are reasonably correct in pointing out that there is no measurable climate effect from the 11-year solar cycle. But that is now not good enough. There is clearly the possibility of other solar effects on climate, and it is up to the real scientists to find them or dismiss them.
The task is not easy, because the effects do appear to be quite subtle, and at all times it is necessary to recognise that Earth’s climate is a complex non-linear system. So linear ways of thinking may be inadequate.
I’ll throw in a possible “starter”. Leif dismisses the “integration of sunspot anomaly over time as “nonsensical”. If you try to treat it as a meaningful number, then he is probably right. But it is actually an interesting concept which throws up an interesting pattern – and no matter how you do it, you get to see a correlation with the global temperature over the last century. The integration is simply a way of making solar variations over time more easily visible. The integration itself is probably of little direct value, but the pattern it throws up is very interesting indeed and appears to be very relevant. And there could be a relationship to cloud cover too, thus adding to the possible value of this new Svensmark paper:. See https://www.newscientist.com/article/dn5048-earthshine-fall-heats-global-warming-debate/ New Scientist 27 May 2004 “A new study of earthshine, the sunlight reflected back onto the Moon from our planet, suggests that falling cloud cover could explain the warming of the Earth’s lower atmosphere seen over the last 20 years.“
It looks like the dots are all starting to join up!
the paper makes no such claim
So, let everybody here proclaim that this latest paper does not show a GCR/Climate link, since not even the authors claim that.
The paper clearly show solar /climate links.
Not according to Svensmark
Well, I’ve proposed above a link with the oceanic cycles, a matter of overturning perhaps rather than direct cloud effect.
Very much more subtle than much of what is being discussed here today, which almost seems quibbling.
===========
Leif dismisses the “integration of sunspot anomaly over time as “nonsensical”
It is nonsense because no matter which interval you choose to do the integral over, the integral will always start at zero and end at zero, thus never show any trend.
A new study of earthshine, the sunlight reflected back onto the Moon from our planet, suggests that falling cloud cover could explain the warming of the Earth’s lower atmosphere seen over the last 20 years.
Over the past 20 years [from 2004] solar activity has gone down, GCRs have gone up [which according to Svensmark should mean cooling] nad the Earth has warmed. Just the opposite of the Svensmark claim.
According to my studies solar activity should have had a net warming effect on global temperatures which it most likely did ,although ENSO had the biggest impacts.
over last 20 years to clarify
“Over the past 20 years [from 2004] solar activity has gone down, GCRs have gone up [which according to Svensmark should mean cooling] nad the Earth has warmed. Just the opposite of the Svensmark claim.”
Math is hard ( I’m not sure, but in my gut I feel that “from 2004” is about 12 years at the time of your post.
One thing I’m certain of is that adjustments to the temperature data set during that time have been upward while the changes to data from the 1930’s has been downward.
Is CO2 responsible for all of the periods that were warmer than the present? If not, explain what was..
20 years before 2004 plus the 12 years since.
SC21 & SC22 were two of the 4 biggest solar cycles of the 20th century. During that time period GCRs would then have been relatively low, hence WARMING. SC23 & SC24, on the other hand, were weaker thus GCRs would have been relatively high, hence NO WARMING…
*(granted, correlation does not necessarily mean causation)
Yet there WAS warming.
Thus, it is not “just the opposite of the svenmark claim”…
Svalgaard, ever heard of “the pause”? (good grief)…
The pause which means no cooling…
Right, but i hope you can agree that “warming” is different than “no warming”…
Leif
You said no cooling, what if it is just a part of the climate variation puzzle? I don’t think dr S is saying it is the main driver of climate, what I get is that you can’t just dismiss the sun as a variable in the equation. Yes, he hasn’t provide it is a variable but he I think has established that it is worth more study.
worth more study
The general issue of climate change is always worth more study. The specific Svensmark study smacks a bit of desperation, and we have probably not heard the last of this. When other people looked at FDs they didn’t find any effect. Replication of findings are important.
Leif – your two arguments are incorrect.
1. “It is nonsense because no matter which interval you choose to do the [sunspot] integral over, the integral will always start at zero and end at zero, thus never show any trend.“. Starting and ending at zero is unimportant, it’s the pattern you get between them that is of interest, and the integral is certainly not zero all the way. Consider this: scientists often use de-trended data to observe a pattern, and detrended data never shows any trend.
2. “Over the past 20 years [from 2004] solar activity has gone down, GCRs have gone up [which according to Svensmark should mean cooling] nad the Earth has warmed. Just the opposite of the Svensmark claim.“. I’m afraid your maths is a bit deficient here. Let me illustrate with an example: I turn a gas cooker up full, and place a large pot of cold water on it. I also immediately start slowly turning the cooker down and continue to do so for a considerable length of time yet at all times there is still a fair amount of flame For the entire life of the pot on the cooker, the gas activity is going down yet for the whole of that period the water temperature is going up.
In summary, that’s what the sunspot integral is about. It gives a pattern which represents variations in total solar input over time. You can’t read an absolute amount from it and you can’t read a trend from it because some parameters are unknown, but you can see relative highs and lows. As the example of the pot of water shows, the integral is a better way of looking at solar input than just sunspot nunber or TSI, because it is likely to bear a closer relationship to actual temperature.
In summary, that’s what the sunspot integral is about. It gives a pattern which represents variations in total solar input over time
The ordinary sunspot number gives an even better pattern. You see, the integral assumes that all that variation is retained, but it is not. What comes in must go out.
The integrals show that the ‘input’ decreased from 1880 to 1950 while in fact solar activity increased during that time:
http://www.leif.org/research/Sunspot-Group-Integrals.png
The red curve shows a decrease form 1790 to 1950, while solar activity actually increased over that time.
The integrals are junk.
Leif – If no variation was retained, you would use ordinary sunspot number. If all variation was retained then you would use an integral. Since land does not retain any variation for any meaningful time, the ordinary sunspot number should give the closer representation for the land. Since the oceans retain a lot of the variation for a reasonable time, an integral should give the closer representation for the oceans. If the oceans are thought to be dominant in global temperature over decade+ timescales, then it makes sense to look at integrals when investigating global temperature. It is still necessary to know what you are looking at, because no-one yet knows what parameters to use for the integral. It is all complicated further by Earth’s climate being complex and non-linear, so no one factor can necessarily be seen in any given set of Earth data.
Junk? I think you are too locked into your ideas. To my mind, “interesting” would be a better term to use, as it demands no commitment either way.
OK, there’s been a lot of discussion about the influence of GCR on Cloud formation… Can I ask what is the influence of GCR on other factors? eg. what happens when GCR’s hit (1) Ocean water particles, (2) Soil, (3) plants…. Anyone with information re’ this perchance?
“Over the past 20 years [from 2004] solar activity has gone down, GCRs have gone up”
But if the response is not time aligned but rather significantly lagged (e.g. by deep water circulation to the poles) then it’s not today’s direct effect that matters but rather what occurred twenty or thirty years ago.
MJ, you have a problem with my math derived from the paper? State it. Else explain the paper fact that the GCR detectible impact is about 3% of the observed time. Fail.
Rud, I have no problem with your maths as such. The problem is with what you applied the maths to. You applied it to the Forbush Decreases, yet the paper said explicitly: ““The effect from Forbush decreases on clouds is too brief to have any impact on long-term temperature changes.“. The point is that the paper’s findings are more subtle, and more finesse is needed to unserstand them and to test them in the real world.
Also another open question/s re’ GCR’s – (A) what change in wavelength/energy state do they undergo when they hit (1) cloud nuclei, (2) Ocean water molecules, (3) solid surfaces such as soil, plants… & then (B), dependent on (A) what happens then? Does remnant energy get re-radiated back out of the “System” (ie. into space) in whatever new form it may have (wavelength/energy state) and if so how much? eg. A major mechanism in Glasshouse/Greenhouse heating is that Sunlight radiation (“White light” containing a certain mix of radiation of different wavelengths) enters through the glass in one form, hits whatever is inside the Glasshouse, is partially absorbed, partially re-radiated, partially reflected depending on the wavelength/energy state, and partially changes state/wavelength (especially including the re-raditation of longer wave Infrared (aka “Heat”) which is trapped inside the system) and only a remnant is reflected back outside the system… Presumably some similar effect operates wrt forms of Radiation other than Sunlight? Would be interested if anyone has any info wrt GCR wrt this??
Despite the name, GCRs are not (electro-magnetic) radiation in nature. They are particles.
Thanks gregfreemyer, much appreciated…. So does the original question apply, wrt what happens when they hit Ocean, soil or other physical objects vs. ionizing atmospheric particles?? Or are the effects (presumably if any) too insignificant to be worth looking at?
My understanding is:
– GCRs are rare, but each particle is very energetic (near the speed of light), thus the need to conduct the CERN CLOUD experiment in conjunction with a particle accelerator.
– The energy density is exceedingly low, so the global incoming energy in insignificant.
– They interact with the upper atmosphere, so very few make it to the surface to interact with water/land.
– Each GCR collision in the upper atmosphere creates multiple byproducts that continue towards the surface at high (relativistic) speeds, those byproducts in turn have further collisions in a cascade effect.
– Some of the collisions kick electrons loose, thus the resulting accelerated atoms are ions rapidly moving towards the surface.
– Svensmark’s hypothesis is those ions act as a catalyst to magnify the effects of small aerosols growing to the point they become CCNs (cloud condensing nuclei) and thus increasing the rate of cloud formation.
-The CERN CLOUD experiment has verified this magnification (10-100x) in a non-sulfuric acid polluted atmosphere. Thus despite Svalgaard’s statements I believe that “GCRs impact climate” is close to proven in the pre-fossil fuel burning era (100’s of millions of years that ended around 1850). (I’ve tried to read all the comments in this post and I’ve seen no informed rebuttal to that statement.)
– The current paper focuses on finding support for Svensmark’s hypothesis in a sulfuric acid polluted atmosphere.
fyi: approx 75 years ago particle accelerators didn’t exist. particle physicists studied GCR collision byproducts in an effort to detect elementary particles other than electrons, neutrons, and protons. They succeeded. I believe they often used balloons to get their experiments higher into the atmosphere.
hardly a very likely scenario
maybe it is the GCR coming from the sun that did it…??
https://wattsupwiththat.com/2016/08/25/svensmark-publishes-solar-activity-has-a-direct-impact-on-earths-cloud-cover/#comment-2287555
My comment contained 90% factual information / well established science from 75 or so years ago plus the latest findings (May 20916) from the CERN CLOUD experiment. No hypothesis. So I have no idea what part of it you consider an unlikely scenario.
see my comment to toncul posted a few minutes ago
unless you can say that my results are not incompatible with GCR / Svensmark theory?
HenryP,
As I’ve noted in several of my comments to this blog post.
The argument MUST be bifurcated. That is the findings to date of the CERN CLOUD experiment.
===
For a non-sulfuric acid polluted atmosphere (ie. pre-industrialization):
CERN’s CLOUD experiment is finding good support for the mechanism Svensmark proposes. None of your posts that I’ve seen address the pre-industrial age, so there can be no conflict.
For the current industrial age with sulfuric acid pollution:
CERN has not yet found a mechanism by which GCRs are significant. Maybe Svensmark (or others) will succeed at showing his hypothesis is relevant to the industrial age, but for now his proposed mechanism is lacking in lab reproducibility as far as I know.
===
This Forbush Decrease correlation paper is interesting for spikes, but as others have said there is no 20th century data to show clouds/climate are affected meaningfully by GCR levels. After all GCR intensity follows the 11-year solar cycle, so satellite measurements of global cloud coverage should have no trouble finding the same cycle. They don’t.
fyi: one of your comments said:
=> lower solar field strengths
=> more of the most energetic particles leaving the sun
GCRs don’t come from the sun (if that is what you’re implying). They are believed to come from exploding stars as I recall.
Dear gregfreemyer – once again, very much appreciated!
The SLAC site used to have a good treatment of GCRs and CCNs, but the thought police took it down.
Now it’s up to college students to conduct actual observational science instead of playing government-funded, politically-motivated computer games:
http://www.jes2s.com/may2014/cosmic_rays.html
JESS, April 2014 Volume 3, Issue 2
Correlation Between the Percent Cloud Cover and the Cosmic Ray Flux
S. Seth Roffé1*, Liza Baskin2, and John Valente2
Student1, Teacher2: Marine Academy of Science and Technology, Highlands, NJ
*Corresponding author: ssroffe@gmail.com
PDF
Abstract
Cosmic rays are constantly bombarding the upper atmosphere, decaying into an array of particles in a shower called the hadronic shower. The very last particle that decays from a cosmic ray is the muon. Cosmic rays can be indirectly detected by using a detector that utilizes scintillator panels and photomultiplier tubes to detect the muons. The purpose of the experiment was to determine a correlation between the amount of cosmic rays detected and the percentage of cloud cover. The amount of cosmic rays detected was divided into five categories: one counter event, two counter events, three counter events, four counter events, and the total amount of muon triggers. Data was taken in Sandy Hook, New Jersey. There was a statistically significant (p < 0.01) positive correlation between one counter event, four counter events, the total amount of muon triggers, and percent cloud cover. There was a statistically significant (p < 0.05) positive correlation between two counter events and three counter events, and percent cloud cover. The findings of this study suggest that there is a relationship between cosmic rays and the climate and thus may affect climate change.
One bright day in the middle of the night,
Two dead boys got up to fight.
Back to back they faced each other,
drew their swords and shot each other.
A deaf policeman heard the noise
and ran to save the two dead boys.
If you don’t believe this lie is true,
ask the blind man, he saw it, too.
Remarkably apt.
=========
Kim, that PB Shelley knew a thing or two about ‘Clouds’ –
I am the daughter of Earth and Water,
And the nursling of the Sky;
I pass through the pores of the ocean and shores;
I change, but I cannot die.
For after the rain when with never a stain
The pavilion of Heaven is bare,
And the winds and sunbeams with their convex gleams
Build up the blue dome of air,
I silently laugh at my own cenotaph,
And out of the caverns of rain,
Like a child from the womb, like a ghost from the tomb,
I arise and unbuild it again.
Heh, I had trouble with the second to last line, and then I thought of a cumulonimbus.
==============
The night was dark and stormy,
The Billy Goat was blind,
He backed into a Barbed Wire Fence
And hurt his…. Never Mind….
Since LSE trend is not determined by values at interval end-points alone, this is a stunning analytic miscomprehension of the behavior of integrated data.
Are you confusing “Integral” with “integrated”?? and I thought all the stupid went home for the night lol
Nope, still here. Explain this please. I’ll try.
==========
Shut up Kim lol
heh, I’ve learned enough for one day. Gotta go hear Roy ‘In Dreams’.
===========
Sparks, Integral has multiple meanings in math.
ie. The integral of 2x is x^2. The integral portion of 3 1/4 sunspots is 3 sunspots. My assumption (like the others) that the first definition is somehow meant, but I totally don’t understand the graph.
For the analytically challenged, here’s an elementary demonstration of the issue:
DATA: 0, 1, 2, 3
Centered DATA: -1.5, -0.5, 0.5, 1.5
Running SUM: -1.5, -2.0 -1.5, 0
Clearly, the integrated, centered data (represented by the running sum) terminates at zero, but has a non-zero trend through the data interval.
Both the PDO and AMO have cycles that are curiously close to the suns 11 year cycle, what more proof does one need that the SUN and it varying magnetic field is a major player in earths climate?
http://woodfortrees.org/plot/sidc-ssn/from:1900/fourier/magnitude/normalise/to:100/plot/esrl-amo/from:1900/fourier/magnitude/normalise/to:100/plot/jisao-pdo/from:1900/fourier/magnitude/normalise/to:100
Many do not believe at looking the data or if they do and the data does not agree with what they think it should be they will then go to any lengths to dismiss the data. This is what we clearly witnessed today.
Try to explain the phase shift on this one…
http://www.woodfortrees.org/graph/esrl-amo/from:1880/mean:13/plot/sidc-ssn/from:1880/normalise
ulriclyons August 25, 2016 at 6:26 pm
Try to explain the phase shift on this one…
http://www.woodfortrees.org/graph/esrl-amo/from:1880/mean:13/plot/sidc-ssn/from:1880/normalise
________________________________
Wow…have you ever checked to see how many volcanoes and tectonic shifts are going on under dare?
But wow what a phase shift..
On another note..
The rise in solar cycle over the last hundred years had a kumulative effect on temperature rise. Been akkumulating for years. We shouldn’t expect the temperature to drop fast over a single low amplitude solar cycle now should we…
Or expect immediate cloud effects.
GCR and clouds still interesting. Have to get back to this. GCR have a Gyro radius around the interstellar magnetic field, an electron volt intensity and a density gradient.
. GCR have a Gyro radius around the interstellar magnetic field
Not when in the Heliosphere or near the Earth, so not relevant for the topic.
Yes, Carla, too many people posting assertions on this site fail to acknowledge the doubtless significant (& just as hard to quantify) role of “phase lag” in many of the processes involved… The complexity of the systems we are trying to understand is so great (as no doubt are the “Unknowns that we don’t even know that we don’t know :-)) that anyone asserting “Black & White” statements immediately raises my internal “Skeptometer”!
“You need to stop your unfounded and desperate ravings. If this were my blog you would be banned”.Maybe time to put Mosh = English lit degree and Leif = ROM ect on the list LOL
I think Leif’s native language isn’t English and he is still able to construct and engage in discussion, Mosh is an alien immigrant from the planet “freezmaballsoff” who wants to assure everyone that we’ll be nice ‘n warm.
You are right about that, but I actually do speak some 7 languages. Among them English for some 65 years… Probably longer than most commenters here.
[The mods bet most of our English writers can misspell your name faster than you can though. 8<) .mod]
Just playing devil’s advocate, but isn’t HADCRUT basically the same spuriously adjusted garbage as GISS and BEST? If so, we constantly rail against them for being unscientific junk, yet we’re okay with them when they seem to agree with GCR impact on cloud formation? I’m sorry, but I don’t think we can have it both ways.
Now if the correlation holds against RSS and UAH, then we might actually have something.
http://www.woodfortrees.org/graph/plot/uah/from:1978/plot/hadcrut4gl/from:1978/scale:0.9/offset:-0.25
“Just playing devil’s advocate, but isn’t HADCRUT basically the same spuriously adjusted garbage as GISS and BEST? If so, we constantly rail against them for being unscientific junk, yet we’re okay with them when they seem to agree with GCR impact on cloud formation? I’m sorry, but I don’t think we can have it both ways.”
I think you hit the nail right on the head. Comparing your data to bastardized NASA and NOAA surface termperature charts is ridiculous. If you get a match, what do you have? Answer: Garbage.
‘I speak some 7 languages’. I know a guy who can speak 10 languages…..but he can’t say an intelligent word in any of them.
You can tell a man by the acquaintances he keeps.You are in good and fitting company it seems.
Scientific Fact!! I’m going to bed good night folks.
Any mention of the type(s) of clouds that are reduced – cirrus, ocean stratus, tropical cumulus, etc? I imagine that the data is too coarse to allow that type of analysis but it’s an important question. Thanks.
[Your] plot doesn’t show what you suggest it shows.
Also, to be correct, you should average the same way both temperature and the other quantity whatever it is.
Also what is important is solar irradiance.
ISR 341.00 W/m^2
Reflected by
Clouds and atmosphere 79.00 W/m^2
Surface 23.00 W/m^2
Net Q/A Into ToT 239.00 W/m^2 (Top of Troposphere, 15 km, 6.8 C/km lapse rate)
Balancing Q/A Out of ToT 239.00 W/m^2
Lapse dT to 15 km 102.00 C
Surface 288.00 K
ToT Temo 186.00 K
U = Q/A / dT
U 2.34
Cloud albedo increases 10%
Clouds and atmosphere 86.90 W/m^2
Surface 23.00 W/m^2
Net Q/A Into ToT 231.10 W/m^2
Balancing Q/A Out of ToT 231.10 W/m^2
dT = Q/A / U
dT 98.63 C
ToT Temp 186.00 K
Surface Temp 284.63 K
Surface Temp Change: -3.37 C
Not esoteric enough?
“The eruptions cause a reduction in cloud fraction of about 2 percent corresponding to roughly a billion tonnes of liquid water disappearing from the atmosphere.”
The water in the atmosphere would not disappear. It would just remain in vapor phase. Something that is invisible can’t disappear.
I believe that’s why it says “liquid water” disappearing. Gaseous water has very different properties in regards to up and down radiation.
I don’t think this paper is meaningless at all.
It “seems” to me that all of the discussion and debate on the blog is treating the GCR/Cloud – Temperature relationship as if there is no OCEAN out there modifying things. A “small” change in clouds may not show up very significantly, if at all with regards to immediate temperature changes that can be plotted in graphs and analyzed in order to generate a statistic, but that does not mean that there is no contribution to ocean heat content, which over time begins to impact longer term temperature trends.
The Forbush events are just the mechanism acting in extreme. Further, there is NO CLAIM that I see that GCRs are “THE only mechanism” .. or even the main mechanism of slight [0.1C changes over 10 years] in “global temperarture”.
Finally, several have made reference to the signal doesn’t rise above the noise. Well, heck, neither do the Temperature Reconstructions. Thus, the comparisons and analyses are “junk” being compared to “junk”!!! For that matter, I don’t believe we can measure …. repeat “measure” the global temperature at a level that reaches any certainty at all. We have several temp products, and they don’t even agree at levels that rise above the noise.
That all said, …. the jury is still out on the impact the sun has on changes in the climate. This paper does not prove it, but there is also no evidence …. claimed or otherwise, that eliminates it from “reality” … only from mathmatical models, witch goes back to comparing “junk” to more “junk”.
Like
Dr. Deanster – I agree re oceans. It is pointless looking for climate signals in surface atmosphere over land, because land does not hold heat. You can see that from inland locations where the temperature can drop 10-20 deg C overnight (and it’s clearly because the land is losing its heat overnight, not because cold air is coming in from somewhere else).
Looking a little further at oceans: Clouds interfere with both inward and outward radiation. Their effect on total net radiation at the ocean surface is about zero, but they decrease the proportion of inward radiation that is SW. My understanding is that SW penetrates quite well into the ocean but LW does not, so the effect of clouds over the ocean is likely to be net cooling. (I’m not sure what the equation at the surface for LW looks like, but I don’t think it invalidates that statement). So on say decadal or higher timescales there is scope for a changing cloud cover to influence global temperature. Jacob Svensmark’s paper now shows us that solar activity can influence cloud cover. The implication is clear. Solar activity may influence climate in other ways than just direct TSI.
IPCC AR5 credits clouds with -20 W/m^2 RF. That’s net cooling.
That’s right, the Oceans temperature is the main climate driver, and the Suns output over long time scales changes the ocean temperature as well as circulation patterns. The last two solar cycles have seen substantially reduced activity and the North Atlantic seems to have responded to this trend. The Southern Oceans however are much larger and have a longer term thermal inertia.
Hmmm…solar enthusiasts seem unruffled by and give a pass to the word “…may…” in the conclusion statement. So would that mean that CO2 proponents who bring forth research that also includes “…may…” in their conclusion will now get a pass as well?
The present study brings nothing new to the table and provides no evidence for their conclusion, only speculation. Yawn.
The word “may” is only allowed when it is convenient for “skeptics.”
Alinsky 101: blame others for that which you do yourself
Looks pretty conclusive to anybody with open eyes.
You and Leif finked out.
How about other sources of cloud seeding?
Like dust?
From the article;
“The eruptions cause a reduction in cloud fraction of about 2 percent corresponding to roughly a billion tonnes of liquid water disappearing from the atmosphere.”
That indicates that cosmic rays are an influence on cloud formation, but not necessarily a large one.
Also from the article;
“The effect from Forbush decreases on clouds is too brief to have any impact on long-term temperature changes.”
Also from the article: “The effect from Forbush decreases on clouds is too brief to have any impact on long-term temperature changes.”
Also known as ‘climate’
True
Yes, the fact remains that total global cloud cover has reduced long term during the satellite data era, whatever the cause, and that must have played a part in the surface temperature trend in the region of the planet where insolation is greatest (mostly oceans) and consequentially the global average surface temperature trend:
http://www.climate4you.com/images/HadCRUT3%20and%20TropicalCloudCoverISCCP.gif
Tropical (15oN-15oS) total cloud cover (green) according to the International Satellite Cloud Climatology Project (ISCCP)
Yes, the fact remains that total global cloud cover has reduced long term during the satellite data era,
As solar activity has decreased and therefore cosmic ray flux has increased, Svensmark’s hypothesis predicts an increase in cloud cover [and a decrease in temperature]. As your graph shows, observations show just the opposite. This, in my book, shows that the hypothesis is a failure.
Understanding clouds, oceanic heat uptake and oceanic circulation in 3D is the key to the understanding of the climate of a water world.
Interesting, Chris… During a period of relatively high solar activity (SC22) clouds decrease. And during a period of relatively low solar activity (SC23) clouds stay constant. It would be interesting to see the data for SC24.
Yup, Richard; someone’s going to put it together. I’ve my eye on Bob.
=========
Or it’s a plot of tropical deforestation.
Leif, that argument of yours is incorrect. See my earlier comment
https://wattsupwiththat.com/2016/08/25/svensmark-publishes-solar-activity-has-a-direct-impact-on-earths-cloud-cover/comment-page-1/#comment-2286685
A true pioneer in science. I emailed Dr Svensmark YEARS ago to turn him on to WUWT and his millions of admirers here. I was graciously surprised to find a lovely and classy reply to my email with his warm apprecialtion towards the crew here @ WUWT and especially Mr Watts.
GO TEAM! Here is to blinding us all with SCIENCE!
(Three cheers for the good guys!)
Thank you all so much!
Sincerely,
Your brother always,
Tom
I haven’t made it through all the comments, but I saw no references to Sulfuric Acid?
My understanding of the recent CERN CLOUD experiment is that we need to evaluate GCRs impact on climate in a bifurcated way:
– Previous to sulfuric acid pollution from fossil fuel burning
– 20th century conditions with sulfuric acid pollution from fossil fuel burning.
Without sulfuric acid pollution, and in the absence of GCRs, they have not found a significant source of CCNs and thus a low level of clouds coverage would be expected during low GCR conditions. During high GCR conditions the biogenic vapors are magnified into CCNs 10-100x and thus cloud coverage is significantly increased..] Thus in pre-industrial times climate was likely strongly driven by GCRs.
As I understand it, per the CLOUD experiment results: in the 20th century, the sulfuric acid pollution interacted with the biogenic vapors to generate sufficient CCNs even in the absence of GCRs. Thus in the 20th centruy, GCRs were likely a minor driver of climate at best.
The question I haven’t seen addressed is what is happening with sulfuric acid pollution. Is it dropping sufficiently to make GCRs once again significant to climate?
Is the 21st century pause caused because of drops in sulfuric acid pollution?
Was the 20th century warming driven primarily by sulfuric acid polution and not CO2?
See my comment. There are very large sources of biological ccns. Turpenes, isoprenes, and dimethylsulfide from conifers, nonconifers, and marine alge respectively. Globally much greater than either GCR or SO2.
ristvan,
I think you’re relying on the findings of CERN CLOUD papers “Ion-induced nucleation of pure biogenic particles” and “The role of low-volatility organic compounds in initial particle growth in the atmosphere”
http://www.nature.com/nature/journal/v533/n7604/full/nature17953.html
http://www.nature.com/nature/journal/v533/n7604/full/nature18271.html
Those are also the paper I was talking about.
The first paper studies biogenic vapors in the ABSENCE of sulfuric acid.
The second paper is similar, but it focus on an atmosphere WITH sulfuric acid.
RE: The pre-industrial era without sulfuric acid pollution
The paper “Ion-induced nucleation of pure biogenic particles” references Ions, but it clearly states the ions in question are a related to GCRs, so the paper could have just as easily been titled “GCR–induced nucleation of pure biogenic particles”.
From the abstract:
“Here we present evidence for the formation of aerosol particles from highly oxidized biogenic vapours in the absence of sulfuric acid in a large chamber under atmospheric conditions.”
If that is the only sentence of the abstract you read, then your logic works.
But the end of the abstract says:
“We find that ions from Galactic cosmic rays increase the nucleation rate by one to two orders of magnitude compared with neutral nucleation. Our experimental findings are supported by quantum chemical calculations of the cluster binding energies of representative HOMs. Ion-induced nucleation of pure organic particles constitutes a potentially widespread source of aerosol particles in terrestrial environments with low sulfuric acid pollution.”
So there finding is that in the pre-industrial age when sulfuric acid pollution was non-existent the process went
– Biological sources (including trees) put out biogenic vapors
– GCR induced activity increases their effectiveness at forming aerosols by a factor between 10 and 100.
– The aerosols in turn are the building blocks of clouds
Thus the best experiment related to CCNs (the CERN CLOUD experiment) contradicts your statements. In fact that paper seems to strongly support the Svensmark hypothesis that GCRs affect climate in the pre-industrial era (going back half a billion years to when trees evolved?
RE: The 20th century where sulfuric acid pollution was a reality
The paper “The role of low-volatility organic compounds in initial particle growth in the atmosphere” shows that the CLOUD experimenters varied the density of sulfuric acid and the density of HOMs (organic compounds). They repeated the experiment both with and without GCR induced ions present.
They found that over a range of 4 orders of magnitude, the density of sulfuric acid had no impact. They did find the density of HOMs did impact growth rates of CCNs, and thus the more organic vapors present the more cloud formation should take place.
They found that GCR induced ions had no effect in these experiments with typical 20th century sulfuric acid pollution levels present.
========
Thus my first comment still holds.
Per the CLOUD results the Svensmark hypothesis needs to be evaluated in the absence of sulfuric acid pollution, and in the presence of that pollution.
It seems very likely that Svensmark’s hypothesis will be proven true in the absence of sulfuric acid pollution.
For the 20th century situation where sulfuric acid pollution is present there was no support for Svensmark’s hypothesis.
But in the latest Svensmark paper he find support EXCLUSIVELY in wet clouds. How does that relate to the CLOUD experiment results? Did the test the same situation, or did the CLOUD experiment only address non-wet clouds?
Hoping for knowledgeable answers,
Thanks
Leif – A quick question. Are graphs like the one I have linked to below just BS? I first came across the notion that sunspots have a weather influence back in my graduate school days in an economic history class. In the mid-1800’s there was work correlating wheat prices to sunspots. The reason Supply/Demand graphs have quantity on the horizontal axis is that agricultural output was considered the independent variable and prices adjusted to clear the market. I found the sunspot theory interesting, but.. Today, time series models dominate the study of macro-economic theory. Structural economic models have had little success in predicting business cycle dynamics.
Thanks
http://a-sceptical-mind.com/wp-content/uploads/2010/01/Cosmic-rays-ice-ages.jpg
n. Are graphs like the one I have linked to below just BS?
They are highly uncertain and speculative. Pretending they are not is BS.
How constant is the galactic cosmic ray flux over long (millennia) periods of time?
How constant is the galactic cosmic ray flux over long (millennia) periods of time?
The galactic cosmic ray flux is very constant over millennia. But the flux that reaches the atmosphere is not, because it depends on the screening by the Earth magnetic field, which changes a lot with time. Even goes away at times.
Mr. Svalgaard, I suppose you studied a possible influence of the Earth magnetic field on the Climate as well. Could you tell us whether you’ve found something interesting / important to know?
As long as it’s not ‘BS’… RE: Beryllium-10, 10be can come from the planets in our own solar system.
No Sparks, it cannot.
10be can be produced in Earth’s atmosphere from radiation of planets.
No, 10Be is produced by Galactic Cosmic Rays.
Radiation drawn in from the so-called “gas giants” by the sun at solar minimum is more than enough to explan 10be on earth, regardless of climate. what is your opinion Leif?
‘Opinion’ dosn’t count here. Facts do. And the fact is that 10Be is created by by rather high energy Galactic Cosmic Rays. Not by ‘Jupiter Rays’. End of discussion.
“Jupiter rays”?? You know I’m correct! how does Jupiter know to draw in Galactic Cosmic Rays? How does the sun know?
Leif, high energy Galactic Cosmic Rays are produced in a galaxy far far away. Apparently! just saying.
Galactic Cosmic Rays [creating 10Be] are produced in out Galaxy.
[“In and outside” of the galaxy? Or “Inside our galaxy”? .mod]
The planets that orbit all this “Galactic Cosmic Rays” produce more radiation.
As I said: end of discussion.
The planets produce more radiation than the galactic background does.
Sparks, GCRs are near light speed particles that have mass that can tear apart basic matter upon impact. Radiation is photons which at best have the energy to kick out an electron every now and then.
Can we keep the discussion on high-energy physics and how it does cause the creation of high-energy ions in the atmosphere and how those high energy ions might impact CCN formation, which affects clouds, which affects climate.
Leif, I’ve read all your comments (I believe). I believe they all rely on 20th century data. In my opinion the CERN CLOUD experiment results support fairly strongly that the Svensmark hypothesis was operational prior to fossil-fuel burning becoming common (ie. before the industrial age). That would mean the hypothesis appears to be operational for 100’s of millions of years ending around 1850. Do you have any rebuttal to that statement? (i.e using 19th century and older data.)
https://home.cern/about/updates/2016/05/cloud-shows-pre-industrial-skies-cloudier-we-thought
“CLOUD has also found that ions from galactic cosmic rays strongly enhance the production rate of pure biogenic particles – by a factor 10-100 compared with particles without ions. This suggests that cosmic rays may have played a more important role in aerosol and cloud formation in pre-industrial times than in today’s polluted atmosphere.”
http://www.nature.com/nature/journal/v533/n7604/full/nature17953.html
“We find that ions from Galactic cosmic rays increase the nucleation rate by one to two orders of magnitude compared with neutral nucleation. Our experimental findings are supported by quantum chemical calculations of the cluster binding energies of representative HOMs. Ion-induced nucleation of pure organic particles constitutes a potentially widespread source of aerosol particles in terrestrial environments with low sulfuric acid pollution.”
That would mean the hypothesis appears to be operational for 100’s of millions of years ending around 1850.
We don’t really have reliable data for those 100’s of millions of years, let alone the last few hundred before 1850, so it must all just be conjecture or beliefs, not much science.
>>That would mean the hypothesis appears to be operational for 100’s of millions of years ending around 1850.
>We don’t really have reliable data for those 100’s of millions of years, let alone the last few hundred before 1850, so it must all just be conjecture or beliefs, not much science.
I assume that lack of basic science knowledge is why a budget over $6B Euros was put in place to cover the 2008-2016 CLOUD experiment :
http://cordis.europa.eu/project/rcn/88279_en.html
http://cordis.europa.eu/project/rcn/104657_en.html
They have recreated in the lab pre-1850’s conditions and found GCRs are an important amplification factor in seeding clouds with CCNs.
Seems something worthy of paying attention to.
I assume that lack of basic science knowledge is why a budget over $6B Euros was put in place to cover the 2008-2016 CLOUD experiment :
Perhaps you are off by three orders of magnitude…
>> I assume that lack of basic science knowledge is why a budget over $6B Euros was put in place to cover the 2008-2016 CLOUD experiment :
> Perhaps you are off by three orders of magnitude…
I did mis-read it. Probably confirmation bias on my part (ie. $6M Euros seems too small to be right.)
Surely that $6M Euros doesn’t cover the actual experiment. I wonder what CERN’s contribution was?
I will get back to you gregfreemyer enjoyed your insight of stupid, but for now I’ll leave you with this.
https://youtu.be/IFUjwj_RB5o
Sparks, My funding quotation error doesn’t change the fact that the CERN CLOUD experiment is widely recognized as the best experiment out there attempting to investigate GCR effects on cloud formation, and so far they have shown the proposed mechanism is real (in the absence of sulfuric acid pollution).
So please do address the science.
All energy in our solar system [- +] is dragged toward the sun whether it’s from a Planet or the rest of the universe, it is still energy travelling from A to B.
There is evidence of fluctuation in GCR flux over millions of years, at least, thanks to 60Fe records in deep-sea, ferromanganese crust, and variation in the production rate of stable, cosmogenic radionuclides, such as 21Ne, and radioisotopes with different half-lives, such as our old friend 10Be, 26Al and 53Mn.
Equating such variation with climatic and evolutionary events on earth however is difficult, although attempts have been made. For instance, GCRs might have been relatively more important as cloud condensation nuclei during the Cretaceous, when biological CCN production was low, thanks to amazingly hot oceans.
For instance, GCRs might have been relatively more important as cloud condensation nuclei during the Cretaceous, when biological CCN production was low, thanks to amazingly hot oceans.
So apparently, the effect of GCRs was not cooling the Earth much back then…
They would have cooled the earth by making more clouds, but not enough to counteract the effects of highly active seafloor spreading and the other phenomena then of the lithosphere on the atmosphere and biosphere. Earth at that time had no permanent ice and cold-blooded reptiles live at high latitudes.
GCRs can’t go it alone, but they can have big effects at the margins.
not enough to counteract the effects of highly active seafloor spreading
Such as much more CO2?
There was more CO2 in the Cretaceous, but not nearly enough to account for the observed or inferred heat. Running GCMs for the mid-Cretaceous needs an ECS of something like 6.0 even to get close, and then still can’t explain the equanimity, ie lack of difference between the equator and poles.
That’s why paleoclimatologists have turned to clouds. The GCMs don’t take sufficient stock of them. But when you assume less cloud cover due to lower biological CCN production in the hot oceans, Cretaceous climate can be better modeled. CO2 was an effect of higher temperatures, not the primary cause.
However, if you crudely apply the best estimates for average CO2 and average temperature over the whole Period, you get an ECS under 2.0. Mean CO2 for the whole, long Period is estimated to have been around 1700 ppm, with GASTA some four degrees higher than now (18 v 14 degrees C). So more than two doublings from the present 400 ppm “forced” only four degrees gain, ignoring all the more important other variables.
The fit is even worse for other geological periods.
One of the cloud “experiments” via modeling, from 2008:
https://chriscolose.wordpress.com/2008/04/13/the-uncloudy-cretaceous/
Original Science article requires subscription, but abstract is available on line. I was unable to download a .pdf of the it.
The Cretaceous actually started out cooler than the Mesozoic average, because there was an Ice House interval at the Jurassic-Cretaceous boundary. Ice sheets didn’t form as in the other Ice House phases, which occur at about 150 million year intervals, because of the prevailing warmth.
But later in the Early Cretaceous Epoch and in the beginning of the Late Cretaceous, earth was as hot as at any time during the Phanerozoic. Toward the end of Late Cretaceous, climate cooled again, but not as much as at the end of the Late Jurassic.
During the mid-Cretaceous (which should have its own epoch, but doesn’t), the oceans invaded the land to such an extent that an inland sea stretched from the Gulf of Mexico to the Arctic Ocean. Naturally, CO2 came out of solution in such hot water, but, as noted, the atmospheric increase was more an effect of the climate than a cause.
i do not understand the logic of this:
“The solar eruptions are known to shield Earth’s atmosphere from cosmic rays. However the new study, published in Journal of Geophysical Research: Space Physics, shows that the global cloud cover is simultaneously reduced, supporting the idea that cosmic rays are important for cloud formation. The eruptions cause a reduction in cloud fraction of about 2 percent corresponding to roughly a billion tonnes of liquid water disappearing from the atmosphere.”
because failure to nucleate water vapor does not imply a reduction of water vapor
because if clouds cause cooling and there are no clouds then it should be warmer – and warmer means more water vapor can be held in the atmosphere and warmer means more water vapor is generated, too.
Fog??
Prof. Brian Cox, I can sense that the time for your apologies to senator Malcolm Roberts and Australian ABC’s QandA audience is coming. Can you sense it, too?
So you haven’t read Leif’s posts then?
I haven’t overread them either. Forbush events barely affect atmospheric temperatures. How GCRs affect ocean temperatures and climate is unknown, but ‘barely’ shows a mechanism. Hark for’ard!
===============
I can’t access the paper – the Dropbox connection keeps being “reset while the page was loading”. Anyone got a better link?
https://dl.dropboxusercontent.com/u/51188502/Forbush_long_JGR_rev3_nored.pdf worked fine for me
Well, thanks for the link, but the connection got dropped for me again. I’ll put it down as one of the web’s wonders, and wait ’til it turns up somewhere else.
Those Svensmark Effect-based climate models might still turn out to be close to the mark.
http://i.imgur.com/jOLMXcP.gif
By the end of 2021 I’ll know if my prediction was seriously off-track or still in the right ballpark.
By 2030 we will have a more accurate assessment of how much solar activity affects climate on decadal scales.
After reading the comments on this blog it became painfully clear that there is absolutely zero chance that 97% of scientists could even agree on what day it is , much less the driving causes of climate change.
Make that 97.99%. Tell everyone else to do the same.
Cosmic rays don’t affect cloud formation, they affect vapor albedo. Sunlight generating thermal energy in water masses that evaporate affects cloud formation.
Vapor isn’t a cloud, it is a vapor. So yes, cosmic rays increase albedo from water vapor but they do not make clouds. I see it all the time down in Florida. Same clouds whether I can see the blue or not.
This is a failure in translation that’s being used as an argumentation point.
Can’t help it, that sounds pretty confused to me. Sorry.
The strongest ionization is over the polar circles, and not over the equator.
http://sol.spacenvironment.net/nairas/Dose_Rates.html
The strongest ionization is in lower stratosphere (about 15 km).
The strongest impact GCR refers to changes in temperature in the lower stratosphere.
http://www.cpc.ncep.noaa.gov/products/stratosphere/strat_a_f/gif_files/gfs_toz_sh_f00.png
Here is a visible influence of Earth’s magnetic field.
http://www.cpc.ncep.noaa.gov/products/stratosphere/strat_a_f/gif_files/gfs_z05_sh_f00.png
GCR has a big impact on climate change, because ozone accumulates in the high latitudes and there runs ionization GCR.
http://www.ospo.noaa.gov/data/soundings/atovs/profiles/RODF_RT_20_noaa19_D1_t1.png
Does it not make a difference whether the clouds are formed during the day(cooling) or formed at night (warming) and at what altitude ? Just curious…..
Or maybe we are just missing a very big piece of the puzzle….For example…
“UCI physicists confirm possible discovery of fifth force of nature”
https://news.uci.edu/research/uci-physicists-confirm-possible-discovery-of-fifth-force-of-nature/
The current state of science on clouds:
“I’ve looked at clouds from both sides now
From up and down and still somehow
It’s cloud illusions I recall
I really don’t know clouds at all”
From the song, “Both Sides Now”
“Rows and flows of angel hair And ice cream castles in the airAnd feather canyons everywhere, I’ve looked at clouds that way.”
From the same song. Also fits some of this discussion quite well, though I am finding it enjoyable in any event.
As I have pointed out there are many factors that determine global cloud coverage it is not just galactic cosmic rays therefore unless the values for GCR reach high threshold values for a sustained period of time it will be hard to see a correlation.
The same can be said when the sun is in it’s normal 11 year so called sunspot cycle very hard to see the solar/climate connections.
Some that try in vain to say a solar/climate connection does not exist try to isolate a given solar parameter versus the climate as an x change in one will equal an x change in the other and treat it as if it is in isolation which is misleading.
As far as the data in my opinion it proves that the current climate is in no way unique ,it shows each and every time there is a prolonged solar minimum period the global temperature response is down and vice versa .
I have laid out the extreme solar parameters which I think will bring global temperatures down which up to today since the ending of the Dalton Minimum have not taken place except for a brief period of time between years 2008-2010, therefore we did not have any cooling or any other notable solar effects versus the climate through out that entire time period, which I have said time and time again would be the case. The solar effects are there however, but normal climate noise obscures them to the point where no real pattern can be discerned.
Once my solar values are reached and sustained which I have posted many times only then will the solar/climate connections start to show up in a more obvious way. At that point the solar effects should be able to rise beyond the normal climate noise which is in the climatic system.
I expect this is happening now ,and I think this time the duration of the low average value solar parameters I have called for moving forward will be long enough so that a more definite solar/climate connection will start to be realized.
We should find out as we move ahead.
lsvalgaard
August 25, 2016 at 3:36 pm
“The past several solar cycles, the sun has become quieter and cosmic rays have increased, which should have cooled the climate. Instead it has warmed. So, no evidence of a significant GCR influence.
~~~~~~~~~~~~~~~~~~~~~~~
When Leif says “it has warmed”, he means the mathematical abstraction called “global average temperature” built from cooked books involving Orwellian adjustments to past records shows recent warming, being the post-modernist socially-constructed version of “warming,” in which the total volume of ice observed in a system can increase even while the mythical system-average temperature rises at an alarming rate.
In fact, the weather associated with the onset of the deep solar minimum sent climatologists and their huge flock of media representatives into a bipolar frenzy, as anyone with a memory that extends further into the past than the most recent news cycle would know.
Astronomy Picture of the Day
September 24, 2008
Why has the Sun been so quiet recently? No one is sure. Our Sun has shown few active regions — that house even fewer associated sunspots — for over a year now, and such a period of relative calm is quite unusual.
==============
A First! Snow Falls in Baghdad
By CHRISTOPHER CHESTER (AP)
Jan 11, 2008
==============
Arctic blast brings London earliest snow for 70 years
Mark Prigg (Evening Standard)
Oct 10, 2008
It is a sight not seen in the capital since 1934.
Londoners today woke up to the earliest snow cover for more than 70 years as a freezing blast of wind from the Arctic hit the capital.
==============
Spokane, Washington., residents cope with record snow
By NICHOLAS K. GERANIOS (AP)
Jan 7, 2009
SPOKANE, Wash. (AP) – More than 6 feet of snow in the past three weeks has left Spokane residents frustrated. Tempers are so frayed that a man was arrested for shooting at a snow plow operator.
==============
The day the sea froze: Temperatures plunge to MINUS 12C and forecasters say it won’t warm up until Sunday
Daily Mail
Jan 8, 2009
Temperatures plunged so low yesterday that the sea actually began to freeze as Arctic conditions continued to grip the UK.
In the exclusive enclave of Sandbanks in Poole, Dorset, a half-mile stretch along the shoreline reaching about 20 yards out to sea is covered in ice.
==============
Beijing’s Heaviest Snow in 54 Years Strands Thousand
Bloomberg News
Nov 12, 2009
[…] In Beijing, snowfall is the heaviest since weather data began in 1955, according to the administration’s Web site.
============
Heavy snow continues as temperatures set to plunge minus 20C
Herald, Scotland
Jan 6, 2010
Heavy snow has brought more chaos to parts of Scotland amid warnings that temperatures could plunge to minus 20C this weekend.
The prolonged Arctic blast is now the worst cold spell seen in Scotland for almost 50 years, according to the First Minister.
============
Quiet sun puts Europe on ice
New Scientist
May 4, 2010
===========
‘Polar vortex’ grips the US in coldest temperatures in decades
Telegraph.UK
Jan 04, 2014
The United States is spending the first days of 2014 in the grips of record-breaking cold and snow as freezing Arctic winds sweep across the country.
===========
Niagara Falls frozen: tourists flock to see icy spectacle
Guardian
January 13, 2014
===========
Scientists: Don’t make “extreme cold” centerpiece of global warming argument
WaPo
February 20, 2014
===========
Historical Great Lakes Ice Cover
NCDC/NOAA
March 2, 2014
===========
Niagara Falls comes to a halt AGAIN
DailyMail
March 4, 2014
===========
Great Lakes covered in record-shattering amount of ice this late in spring
WaPo
April 23, 2014
===========
US weather in pictures: ‘Polar vortex’ brings big freeze to North America
Telegraph UK
Aug 13, 2014
===========
Stunning satellite images show [Arctic] summer ice cap is thicker and covers 1.7million square kilometres more than 2 years ago…despite Al Gore’s prediction it would be ice-free by now
DailyMail
August 31, 2014
===========
Antarctic Sea Ice Reaches New Record Maximum
NASA
October 7
===========
Cold winters have been caused by global warming: new research
Climate sceptics often claim that recent icy winters show that global warming is not happening. New research suggests the opposite is true.
Telegraph.UK
Oct 27, 2014
===========
Earliest ice on record appears on Great Lakes
CBC,
Nov 24, 2014
===========
Fall snow cover in Northern Hemisphere was most extensive on record, even with temperatures at high mark
WaPo
December 4, 2014
“Global average temperature” is a fiction that only serves a propaganda purpose.
Khwarizmi, weather is just ‘weather’, local and temporal, how extreme and unusual it can be. ‘Climate’ is about a 30 year mean.
‘Climate is about a 30 year mean’. This old chestnut keeps popping up whenever one speaks of a solar related cooling. Oddly, it hardly ever gets mentioned when the warmists talk about the hottest ever day/month/year…..Sigh.
Jay Hope August 27, 2016 at 9:44 am “‘Climate is about a 30 year mean’.(…) Oddly, it hardly ever gets mentioned when the warmists talk about the hottest ever day/month/year…..’ ”
Jay Hope you are right. 9 Out of 10 ten ‘alarming’ media messages are not about climate but about weather events. We all should say it every time, over and over again: “Weather isn’t the same as climate”. Media would diminish the number of alarming messages with at least 90%, I guess. Changing ‘weather’ for ‘climate’ is one of the main mechanisms of Media (and politicians) to keep the alarming idea alive.
So let’s control ourselves and others in speaking about climate only when it really is climate. And it is only climate, when it is about an average over at least a period of 30 years. Look at the definitions of well known institutes:
NOAA
http://cpo.noaa.gov/AboutCPO/Glossary.aspx
The average of weather over at least a 30-year period. Note that the climate taken over different periods of time (30 years. 1000 years) may be different. The old saying is climate is what we expect and weather is what we get.
NASA
http://www.nasa.gov/mission_pages/noaa-n/climate/climate_weather.html
What Climate Means
In short, climate is the description of the long-term pattern of weather in a particular area.
Some scientists define climate as the average weather for a particular region and time period, usually taken over 30-years. It’s really an average pattern of weather for a particular region.
WMO
http://www.wmo.int/pages/prog/wcp/ccl/faqs.php
What is Climate?
Climate, sometimes understood as the “average weather,” is defined as the measurement of the mean and variability of relevant quantities of certain variables (such as temperature, precipitation or wind) over a period of time, ranging from months to thousands or millions of years.
The classical period is 30 years, as defined by the World Meteorological Organization (WMO). Climate in a wider sense is the state, including a statistical description, of the climate system.
KNMI – the Netherlands
http://www.sciamachy-validation.org/klimaatmaatwerk/KEW/data/index.html
Enkele definities
Wat is klimaat? Het klimaat van een bepaald gebied is het gemiddelde weer, dus het gemiddelde over langere tijd van de meteorologische grootheden zoals temperatuur, neerslag, vochtigheid, zonneschijn en wind, inclusief de extremen. Vaak wordt een periode van 30 jaar gebruikt om een klimaat te beschrijven.
Translation:
(Some definitions
What is climate? The climate of a specific area is the average weather, so the average over a longer period of the meteorological parameters like temperature, precipitation, humidity, sunshine and wind, inclusive the extremes. Often a period of 30 years is used to describe a climate.)
Deutsche Wetterdienst (German Meteoservice)
http://www.dwd.de/DE/service/lexikon/Functions/glossar.html?lv2=101334&lv3=101462
(….) Im allgemeinen wird ein Zeitraum von 30 Jahren zugrunde gelegt, die sog. Normalperiode, es sind aber durchaus auch kürzere Zeitabschnitte gebräuchlich.
Translation:
((….) Generally a period of 30 years is used, the so named normal period, but surely there have been shorter periods used.)
Britannica:
https://www.britannica.com/science/climate-meteorology
The best modern definitions of climate regard it as constituting the total experience ofweather and atmospheric behaviour over a number of years in a given region. Climate is not just the “average weather” (an obsolete, and always inadequate, definition). It should include not only the average values of the climatic elements that prevail at different times but also their extreme ranges and variability and the frequency of various occurrences. Just as one year differs from another, decades and centuries are found to differ from one another by a smaller, but sometimes significant, amount. Climate is therefore time-dependent, and climatic values or indexes should not be quoted without specifying what years they refer to.
WIKIPEDIA
https://en.wikipedia.org/wiki/Weather_and_climate
There is often confusion between weather and climate. Weather is the condition of the atmosphere at a particular place over a short period of time, whereas climate refers to the weather pattern of a place over a long period, long enough to yield meaningful averages.[1][2]
https://en.wikipedia.org/wiki/Climate
“Climate is the statistics (usually, mean or variability) of weather, usually over a 30-year interval.”
A 25% decrease in cosmic ray intensity results in roughly 1% decrease in cloudiness. A 1% change in cloudiness corresponds to a 0.5% change in radiation reaching the surface (for an albedo of 0.33) which leads to 0.4C temperature change, in this case an increase.
So … would it follow that a 0.1% decrease in cloudiness, over a 10 year period would result in the same 0.4C temperature change ….. just stretched out over a longer period of time??
I ask this because as with all the “math-a-ma-goo” approaches to everything science, the unpredictable influences of unknown factors always plays a role .. and hence, why in areas like “climate”, none of the models ever match. I know the “ASSumption” is that the radiation balance equation will seek equillibrium, blah blah blah, and that the 0.1% increase will lead to a 0.1% decrease in outgoing radiation, but I’m not sure that this is the case given that 70% of that 0.1% increase is going to penetrate the ocean and not surface for years.
I agree ED.
During a solar eclipse, the moon shields part of the earth from solar radiation. So wouldn’t this study have a direct bearing on the issue being discussed. GK
http://www.universetoday.com/130455/citizen-scientists-help-crack-300-year-old-mystery-eclipse-wind/
What effect does the sun and clouds have on temperature?….
…when you know temperatures and temperature history have been jiggered to the point of nonsense
It seems logical that solar cycles play a significant role in long-term global climate cycles.
The Little Ice Age lasted from 1280~1850, which corresponds to four Grand Solar Minimum events: Wolf (1280~1350), Sporer (1450~1550), Maunder (1645~1715) and Dalton (1790~1820).
When theses GSMs ended, so did the Little Ice Age.
The Modern Warming Period also closely follows to the strongest 63-yr string (1933~1996) of solar cycles in 11,400 years.
When these strong solar cycles ended in 1996, so did the global warming trend (excluding the recent strong El Niño), despite 30% of all manmade CO2 emissions since 1750 being made over just the last 20 years:
http://www.woodfortrees.org/plot/rss/from:1996.6/to:2015.7/plot/rss/from:1996.6/to:2015.7/trend/plot/esrl-co2/from:1996.6/to:2015.7/normalise/trend/plot/esrl-co2/from:1996.6/to:2015.7/normalise
CAGW’s global warming projections vs. reality are already 2 standard deviations off, and with: the coming cold La Niña cycle, the PDO already in its 30-yr cool cycle, the AMO starting its 30-year cool cycle around 2019, the current solar cycle at near zero sunspots by 2018, and the weakest solar cycle since 1790 starting in 2022, by 2021, the global warming hiatus should hit 25 years of duration and the disparity between CAGW projections will likely exceed 3 standard deviations, which is the point where CAGW becomes even a bigger joke than it already is.
CAGW is dead… In 5~7 years, it will be laughed at and ridiculed.
The eccentricity of the orbit swings TSI a total of 90 W/m^2. Add the precession of Malinkovitch and CAGW vanishes in the haze.
SAMURAI, great comment… If what we’re in for is anything like what we saw back in ’08 then this could get interesting. Seeing how we just had our el nino, it’s not likely that there will be another one to bail us out when we hit bottom at the next solar minimum (as did happen in 2010). So, pull up your arm chair and get your popcorn ready, cause this could be quite a show…
read that 7 years ago
7 years ago, there were only12 years of a little over one standard deviation of divergence.
Now there are close to 20 years of over two standard deviations of divergence, which is technically sufficient criteria for hypothetical disconfirmation.
In 5~7 there will be over 25 years of over 3 standard deviations of divergence….
See a pattern developing?
Any serious and virtuous scientist will have to concede CAGW is a bust by 2021~2023 with that level of both duration of divergence…
…LOL……299 gold stars.. ;o)
[The mods wonder: What is the error bar and trend line on that 299 gold star award? .mod]
…+ / -1….97 out of 100 times… ? Trend line is definitely up but I can’t show you my work….because you might find something wrong with it !! ….. ;o)
Let’s see the changes in GCR in South.
http://neutronm.bartol.udel.edu/realtime/southpole.html
In the south as in the north there are waves in stratosphere, that affect the polar vortex.
http://www.cpc.ncep.noaa.gov/products/stratosphere/strat-trop/gif_files/time_pres_WAVE1_MEAN_JAS_SH_2016.png
http://www.cpc.ncep.noaa.gov/products/intraseasonal/temp10anim.gif
How does this affect the weather? Here you can see.
http://www.cpc.ncep.noaa.gov/products/stratosphere/strat-trop/gif_files/time_pres_HGT_ANOM_JAS_SH_2016.png
In 2009, during the very low solar activity were observed strongest sudden warming of the stratosphere.
http://adsabs.harvard.edu/abs/2009AGUFM.A21C0202D
“The warming affected the upper stratosphere (~ 40-45 km) first, and then propagated rapidly from the upper to the lower stratosphere.”
I am so glad to see so many of us agree on the solar/climate connection.
AND, Salvatore, nice to see that svalgaard is taking a nap. He tends to stunt the discussion, sucking up all the oxygen in the room. I don’t think you were rude up top. No, more like righteous indignation. He tends to bring it upon himself with his obtusely shallow argumentation. Too bad anthony has him all wrapped up in bubble wrap, only makes him worse. BUT, it is anthony’s blog and blogs are monarchies not democracies. (if we don’t like it we can get our own blog…)
That is how he is but it does not matter what matters is what the climate does going forward and why.
Sunspot time-integral plus net of all ocean cycles plus effect of water vapor increase provides a 98% match to measurements 1895-2015 at http://globalclimatedrivers2.blogspot.com Water vapor increase is countering the temperature decline that would otherwise by occurring and might also be contributing to recent flooding.
It might be arguable whether it is cosmic rays or solar wind or both but it is definitely sunspots.
off topic…anyone have a good reburt to this paper? http://multi-science.atypon.com/doi/abs/10.1260/0958-305X.26.3.417
No rebuttal is possible, unless you can challenge the proxy data.
Whatever actual warming has occurred since 1916 is well within normal, natural limits, especially coming out of the LIA, which ended in the 19th century. Thus, the null hypothesis cannot be rejected.
There is nothing going on with earth’s climate about which to worry. So far, one more molecule of plant food per 10,000 molecules of dry air has been a good thing.
Thanks !
I am ambivalent about the effects of cosmic rays / clouds and here’s why. Cloud formation is a thermodynamically reversible process, that is, if you differentially reverse the process that caused the cloud to form, it will dissipate. This implies that there can be no change in the energy balance at cloud level as a result of the cloud’s formation. Before formation shortwave traverses the cloud level going downward. After formation, shortwave is reflected upward and longwave is reflected downward. Any discussion?
http://imnh.isu.edu/digitalatlas/clima/imaging/clddev.htm
“Cloud development is linked closely with the concept of stability, i.e., the tendency of air to rise. Although several factors determine whether or not clouds will form, the stability of the atmosphere is far and away the single greatest indicator of cloud formation………”
A luminous photosphere of energy radiates from our sun in all directions out across the cosmos. When that sphere expands to the average orbital distance to the earth its dispersed luminous surface emits a power flux of 1,360 to 1,368 W/m^2. But the earth does not orbit in a nice average circle, but in an ellipse with perihelion being closer and aphelion being farther. So how much difference does that make?
At perihelion (closer) the power flux is 1,413 W/m^2. At aphelion (farther) the power flux is 1,323 W/m^2. The total annual range/change/fluctuation is 90 W/m^2. Yes, 90 W/m^2.
According to IPCC AR5 the radiative forcing added to the atmosphere by the CO2 increase in the 261 years between 1750 and 2011 is 2 W/m^2. Yes, 2 W/m^2.
So if an annual 90 W/m^2 fluctuation does not cause catastrophic climatic consequences what possible reason have we to believe that 2 W/m^2 will?
Nicholas Schroeder, when did Earth reach last time 1,413 W/m^2 and when 1,323 W/m^2? Thanks for the answer.
Wim Röst
Measured maximum solar TOA levels are 5 January (every year) at 1408 Watts/m^2 and the minimum are at 1316 on 5 July (every year).
It follows a near-sinsuoid curve (within a 0.5 watt/m^2), which is available below in Excel format for DOY = day-of-year if you want it.
TOA =1362.36 + 46.142*(COS(0.0167299*(DOY)+0.03150896))
Theory holds that the yearly total remains the same, so the +/- change from the yearly average of 1362 can be ignored, and the average 1362 watts/m^2 at TOA should be used for everything, as if it were constant.
That’s not true, but that’s what those who believe in a flat-earth 1/4 TSI average TOA radiation level believe/use in their averages.
Whether their results are accurate or not depends on what you are attempting to simulate, and how accurate you are trying to make the simulation.
It’s math, geometry. Sphere = 4 pl r2. Divide the solar luminosity over the area of the sphere at aphelion distance and then at perihelion distance and those values pop out. I think it’s like the baro pressure on the local weather station, “corrected” to sea level. Or averaged.
It’s the power flux of the sun’s luminous sphere, what the earth receives.
A sphere of r has 4 times the surface area of a disc of r. The incoming flux is perpendicular to the earth’s cross sectional area. So divide 1,368 by 4 = 342. These popular diagrams do no consider day or night or seasons. Pie simple models.
“Theory holds that the yearly total remains the same, so the +/- change from the yearly average of 1362 can be used for everything.”
RACookPE1978, thanks for the answer. In respect to ‘climate’ (averaged 30 year period) the interannual changes are the most interesting, I expect. What about changes in W/m2 thanks to the Milankovitch cycles?
RACookPE1978
Thanks, I didn’t realize there was data to back up the calcs, I was just seeing where the numbers went. So what does this data tell us?
Let’s say that winter is when the tilted axis points the NH away from the sun and summer is when the tilted axis points the NH towards the sun. From the data it appears that currently NH winter coincides more or less with the aphelion, closer to the sun. So the power flux is set on hot, but the away tilt is set on cold so they counteract each other. Same with summer. The NH is tilted towards the sun and hotter, but is at perihelion and colder. So the colder perihelion is offset by the warmer tilt.
In 5,500 years +/- the earth will have precessed to the point that summer/winter will occur around the equinoxes, not the solstices and the power flux will be much less and equal summer to winter. In 11,000 years winter and summer will be opposite what they are now and the fluxes and tilts will double up not contradict. All of that is bound to change the atmospheric heating and climate.
So that’s what Milankovitch is all about. Why didn’t somebody just say so?
(NschroederPE1983)
Nicholas Schroeder August 27, 2016 at 7:04 am
“Let’s say that winter is when the tilted axis points the NH away from the sun and summer is when the tilted axis points the NH towards the sun.”
WR: Nicholas, I read the above sentence in this way: “Let’s say that a cool period develops when the tilted axis points the NH away from the sun and that we get a warming period when the tilted axis points the NH during the NH-summer (July) towards the sun”. Am I right that this is what you mean?
The data RACookPE1978 gave at 7:21 pm says, that the sun sends right now the maximum energy when the South Pole (!) is pointed to the sun: “5-Jan 1408 Watts/m^2“. And the minimum solar right now is when it is summertime on the NH (July) – 1316 Watts/m^2. Which reminds me to the lowering trend of the Holocene temperatures, after the Holocene Optimum.
We know that we need maximum solar at the NH (!), at 65N in July to get a maximum warming effect of the Earth. And not a maximum solar at the SH as is happening right now in January. You are writing “In 11,000 years winter and summer will be opposite”. So, 11.000 years from now the NH and the Earth will warm again at the maximum. Like they must have done 11.000 years ago, at the end of the last glacial………
Do I understand you well? In that case – and when you are right – you are completely right in saying: “Why didn’t somebody just say so?”
(P.S. Perhaps it is difficult for some people to realize that the last period of ‘out of the Little Ice Age warming’ is only a minor part of the total ‘downward Holocene trend’ of the last 6000+ years. But realising that we have to look at a 10.000 – 20.000 year time scale, inclusive a possible time lag of a couple of thousands years changes the whole perspective. This means that the Earth (if nothing would have been changed – CO2) would continue it’s cooling trend for some more thousands of years, as the Holocene Optimum was only 5000-9000 years ago, as far as I remember. So another 6000-2000 years of cooling would be in front of us, apart from eventual CO2 effects)
Hallo Wim
I think we don’t have to look so far back
nobody I know will be alive 2000-6000 years from now
rather keep the discussion for the past few hundred years and hundred years from now…
http://www.nonlinear-processes-in-geophysics.net//index.html
google: persistence of the Gleissberg
and see what you get
http://www.nonlin-processes-geophys.net/17/585/2010/npg-17-585-2010.html
[I think I gave the wrong link in my previous comment]
It is miraculous if we can abrupt this downward trend. So what do we do? Hypnotize the populace into refusing the miracle.
==============
Not many Olympic events come down to two dueling Danes, however, relatively junior Dr. Svensmark v. the senior Dr. Svalgaard.
This is all a lot of looking under the lamppost. The key is in the oceans, and it’s dark out there. Meanwhile, the drunk tries to explain his alcohol level to the cop without knowing how much he’s drunk nor how his liver works.
==================
“””Possible long term effect
The effect from Forbush decreases on clouds is too brief to have any impact on long-term temperature changes.
However since clouds are affected by short term changes in galactic cosmic radiation, they may well also be affected by the slower change in Solar activity that happens on scales from tens to hundreds of years, and thus play a role in the radiation budget that determines the global temperature.
The Suns contribution to past and future climate change may thus be larger than merely the direct changes in radiation, concludes the scientists behind the new study.”””
Fluxing around with the radiation budget them thar GALACTIC cosmic rays.
________________________________
lsvalgaard August 25, 2016 at 8:19 pm
. GCR have a Gyro radius around the interstellar magnetic field
Not when in the Heliosphere or near the Earth, so not relevant for the topic.
________________________________
Better take a closer look Dr. S., cause I’m only just skimming, cause I’m tired.
Please do note from whence these particles are coming IN from….
Measurement of the radial density gradient of cosmic ray in the
heliosphere by the GRAPES-3 experiment
http://tevpa2012.tifr.res.in/publications/journal/Radialdensity-Kojima.pdf
H. Kojima a,b, H.M. Antia b,c S.R. Dugad b,c , S.K. Gupta b,c,⇑, Y. Hayashi b,d,
P. Jagadeesan b,c, A. Jain b,c, S. Kawakami b,d, P.K. Mohanty b,c,
T. Nonaka b,d, A. Oshima b,e, B.S. Rao b,c, S. Shibata b,e,
Accepted 2 July 2014
The GRAPES-3 Collaboration
Introduction
“”These particles gyrate around the IMF but the presence of irregularities
in the IMF scatters them away from a regular gyro motion.
Also these IMF irregularities impact the convection of charged particles
by mediating the interaction of the solar wind with the
incoming cosmic rays. The overall impact of this phenomena is diffusion
and convection of the particles from the heliospheric boundary
towards the Sun. However, this diffusive motion of particles is
influenced by the gradient and curvature drifts in the IMF [1–3].
The solar modulation in the heliosphere results in streaming of
particles that produces an anisotropy in the flux of galactic cosmic
rays.””
Two major components in GCR reaching Earth’s Atmosphere
“” This streaming may be decomposed into two major components,
first one in the ecliptic plane and the second perpendicular
to this plane. The galactic cosmic rays entering the Earth’s atmosphere
produce a number of secondary particles. However, among
the secondary particles, neutrons and muons reach the ground level
and may be studied by the detectors placed on the surface of the
Earth. The streaming in the ecliptic plane can be recorded by ground
based detectors as a diurnal variation in the counting rate, super
posed on a larger isotropic component. The streaming of primary
cosmic rays responsible for this variation is known as the Solar Diurnal
Anisotropy [1].””
The effect of the towards and away sector of the solar IMF on GCR propogation into Earth’s atmosphere.
“”On the other hand, the streaming perpendicular
to the ecliptic plane in the north–south direction is observed as a
sidereal diurnal variation by the ground based detectors [4]…””
“”..Therefore, a muon telescope observes a maximum counting rate
at 18 h local sidereal time, if the streaming is downward (north–
south) and at 6 h local sidereal time if the streaming is upward
(south–north). Since Gr points radially outward this streaming process
reverses its direction whenever the polarity of the IMF changes.
The region of the heliosphere where the IMF is directed toward the
Sun, is called the Toward or TW sector, and the streaming is downwards
(north–south). Similarly, when the IMF is directed away from
the Sun, it is termed the Away or AW sector and the streaming is
upwards (south–north). Therefore, the muon telescopes located in
the northern hemisphere of the Earth detect a maximum rate at
6 h in the AW sectors and at 18 h in the TW sectors, in local sidereal
time. This streaming as mentioned earlier is referred as the Swinson
flow….””
Finding where the seeding of clouds occurs from the propagation of GCR into Earth’s atmosphere, has its degrees of difficulty.
Question though… if an electric field generates a magnetic field as in the magnetosphere, how does the lower amplitude solar cycle affect Earth’s electric field and magnetosphere?
I am not referring to the magnetic field generated at the dynamo regions. But its outer extension called magnetosphere.
And if the magnetosphere weakens due to a lower amplitude solar cycle, wouldn’t the records also be fluxed up indicating a higher solar value, but in reality a weaker magnetosphere?
Good night
Carla, the data supports a solar/climate connection and that this period of time in the climate is not unique.
Your bias is so strong that you get things wrong.
The GCRs gyrate around the Interplanetary Magnetic Field [IMF], not the Interstellar Magnetic Field.
Sigh.
The current research is as evidenced by this article is in support of a solar climate connection and there are many and all I have to do is be correct on one of them . Just one.
In addition the data shows this to be so.
We will be finding out because I expect my low average solar parameters will be the norm as we move forward (which is needed ) and I expect a global temperature response which will be down in response to this. It has started by the way.
What controls the climate ? The amount of energy coming into the earth versus leaving. The sun controls this through primary and secondary effects.
Solar if extreme enough is going to change the energy balance by influencing the terrestrial items that determine albedo through secondary effects. In addition the slight decrease in solar irradiance a primary effect will add to this along with an increase in MAJOR volcanic activity, another solar secondary effect. All of this will change the energy balance and thus the climate.
The geo magnetic field weakening compounding the solar effects.
The GHG effect I exclude not because it is not real but because shows it follows the temperature does not lead it so the strength of the GHG effect must be in response to the climate rather then the other way around.
Every single prolonged solar minimum has been associated with a global temperature decline to one degree or another overall without exception.
lsvalgaard August 27, 2016 at 6:31 pm
You still do not the difference between the IMF and the IMF. The cosmic rays in the solar susyem gyrate around the IMF not around the IMF, as I said, but which you objected to.
__________________________________________
Cosmic Ray History and its Implications for Galactic Magnetic
Fields
Ellen G. Zweibel1
http://cds.cern.ch/record/598725/files/0212559.pdf
Page 2
The leading theories of cosmic ray acceleration and confinement depend on the strength
of the magnetic field. In this paper we use this dependence to estimate the minimum magnetic
field at which a population of relativistic cosmic rays with energy density comparable
to the present Galactic population can be accelerated and confined. We find that a field
several orders of magnitude weaker than the present Galactic field is sufficent for both acceleration
and confinement, provided that the coherence length of the field exceeds the cosmic
ray gyroradius.
Note that we use the solar magnetic field to constrain the galactic field. Not the other way around. The interstellar magnetic field has no influence on the sun because of the super sine solar wind. Try to get it.
lsvalgaard August 27, 2016 at 7:23 am
Your bias is so strong that you get things wrong.
The GCRs gyrate around the Interplanetary Magnetic Field [IMF], not the Interstellar Magnetic Field.
Sigh.
—————————————————-
“”These particles gyrate around the IMF but the presence of irregularities
in the IMF scatters them away from a regular gyro motion.”””
Doc, I know the difference between the two acronyms:
IMF = Interplanetary Magnetic Field (solar)
ISMF = Intersterlllar Magnetic Field (galactic and other sources in ISM)
GCR are contained by the ISMF if the gyroradius is larger than the magnetic field such as the IMF, then they refer to gyrating around them?
Apparently the GCR are disruptive in the INTERPLANETARY space environment as well as the INTERSTELLAR environment. So also must be disruptive in the planetary atmospheric environment.
Don’t make me copy and paste the disruptions to the magnetic fields here…lol
But I will later, got to get some domestic stuff done.
Gotta leave this teaser though, before I go..
Amplification of magnetic fields
Upstream and downstream of shocks
Cosmic ray driven dynamo
Carla if you have the time tell us why you think the climate changes and how it might change going forward.
I am interested.
Cosmic rays in solar system
By: Tiva Sharifi
Earth Weather
In the lower atmosphere,
*Muons ionize the gas molecules.
*A positive ion is created
*The released electron is captured (creation negative ion or recombination)
*The ionization and recombination effect is balanced
the negative ions are more mobile which results in an electric field (100 V/m).
Thunderstorm
*Separation of positive and negative ions forms an electric field.
*Discharge (lightening) happens if the electric field is high enough.
*Cosmic rays have a direct influence on earth weather
C 14, the most famous cosmogenic radionuclide
*A correlation between solar activity, climate variables (especially temperature) and C activity.
low number of sunspots, higher activity of C 14 and colder climate.
*The weak solar field allows more GCR protons to reach the earth results in the higher content of C 14 .
https://www.google.com/url?sa=t&rct=j&q=&esrc=s&source=web&cd=4&cad=rja&uact=8&ved=0ahUKEwiT6v3-geLOAhXEGh4KHX0FA7oQFgg1MAM&url=http%3A%2F%2Fwww.tp.umu.se%2Fspace%2FProj_10%2FTiva_S-present-10.ppt&usg=AFQjCNEgE1s_CUupkQCLkyQLQfIQY8tVww&bvm=bv.131286987,d.dmo
Me thinks, I need to know more about the effects of GCR on Earth’s electric field and magnetosphere.
ren August 26, 2016 at 3:30 am
The strongest ionization is over the polar circles, and not over the equator.
——————————————-
Yes, I believe that is true due to the magnetic field cutoff. The magnetic fields around the polar regions physically are more vertical allowing unimpeded access at those locations, (open door) for energetic particles. There are also magnetic field null points around the planet. (open door)
Polar regions exibit strong variations in the pressure gradients due to several factors including the one you are usually showing us.
A sub study for someone might be to locate the weaker regions of Earth’s magnetic field, polar regions, null points and anomalies and compare to atmospheric pressure changes in and around those weaker regions
.
Bearing in mind solar wind streams, CME’s or Earth passing through a solar sector crossing of the HCS. Whether the Interplanetary Magnetic Field IMF is orientated towards the sun or away from the sun.
You still do not the difference between the IMF and the IMF. The cosmic rays in the solar susyem gyrate around the IMF not around the IMF, as I said, but which you objected to.
lsvalgaard August 27, 2016 at 6:31 pm
The cosmic rays in the solar susyem gyrate around the IMF not around the IMF, as I said, but which you objected to
—————————————————–
Not if the GCR gyroradius exceeds the field length.
Solar field lengths are puny compared to Galactic fields in LENGTH.
Containment provided that the field length is longer than the gyroradius of a GCR and that depends on energy level of the GCR.
See below…
Cosmic Ray History and its Implications for Galactic Magnetic
Fields
Ellen G. Zweibel1
http://cds.cern.ch/record/598725/files/0212559.pdf
Page 2
provided that the coherence length of the field exceeds the cosmic
ray gyroradius.
There is also reacceleration of GCR locally due to bumps or CIR corotating interaction regions in the heliocurrent sheet. They affect ionization in those regions, mess with magnetic fields too. Regardless of whether it is solar or not. They mess with galactic scale fields and Ol sol well.. toot toot
As for a toward or away solar field, only shifts the location position of incoming GCR within the polar regions of Earth. toot toot again..
It is only fairly recent that we started measuring the higher energy ranges of the GCR so not much history above certain threshold.
provided that the coherence length of the field exceeds the cosmic ray gyroradius.
You have no idea what you are talking about. The gyroradius depends [inversely] on the local magnetic field, so in the solar system [the heliosphere], the cosmic rays are gyrating around the local solar wind magnetic field, not the interstellar field. If the field changes rapidly, the gyration will be erratic and the particle will be accelerated. But this does not change the fact that the path of a cosmic ray within the heliosphere depends on the local [solar] magnetic field and not on the interstellar [galactic field]. As usual: the interstellar field or conditions have no influence whatsoever in side the heliosphere. I am amazed at the willingness with which you deceive yourself. Luckily, the rest of us are [hopefully] not so prone to your self-delusions.
http://hockeyschtick.blogspot.com/2016/08/bombshell-new-study-confirms-solar.html
This is in reference to this article which speaks strongly of a solar climate connection in addition to showing supportive data that being the sunspot integral climate correlation.
On last point which is the weakening geo magnetic field will compound this.
this is an old argument…..
what came first: the chicken or the egg
all cooling as observed by myself,
currently at ca. -0.015K/annum,
is apparently working its way from the higher latitudes down to the lower latitudes,
but it does that by forming more clouds…
namely, as the T differential between the equator and poles are rising, you will get more condensation at the lower latitudes. The lower latitudes receive comparatively much more radiation per m2 , hence the initial cooling effect is now amplified by the increase in cloud cover at the lower latitudes….
a natural consequence of all this is that there will be [somewhat] less moisture available to make clouds at the higher latitudes.
hence I predict a 1930’s type of drought for the great plains of America in a few years from now…..
to prove the point that this is indeed what is happening:
“A Weather Cycle as observed in the Nile Flood cycle, Max rain followed by Min rain, appears discernible with maximums at 1750, 1860, 1950 and minimums at 1670, 1800, 1900 and a minimum at 1990 predicted. The range in meters between a plentiful flood and a drought flood seems minor in the numbers but real in consequence….” end quote
[the quote is from Arnold’s paper in 1985 just before they started with the CO2 nonsense. The 1990 turned out to be 1995, as calculated from my results]
Still intriguing to me is the NASA study showing correlation between Nile River levels and aurorae boreales. Riddle me that one.
===============
Hi Kim
All I understand from nuclear fusion [on earth] is that they still battle to contain the energy…
apparently they cannot create a magnetic field strong enough to contain the explosion of energy.
It therefore makes sense to me to believe that the lower solar polar magnetic field strengths mean that more of the most energetic particles can escape from the sun forming said aurorae
[and also more ozone, peroxides and N-oxides – this is how your life is protected against the [current] very horrific sun.
Hence, earth is cooling when the sun “hots” up.
Would ‘arrive from the sun’ be more apt? You broach, for me, new thoughts on albedo.
=============
you could say: arrive from the sun
contrary to what Pam has said, in climate science: don’t trust anyone but yourself.
I even don’t trust the satellite data anymore [what versions are we on now?], as I think there is no detection material on earth that can withstand the sun’s most energetic particles [if not protected by an atmosphere]
I am sure you will find a steadily increasing albedo from 1995 onward but information on this is scarce. The latest data I saw only went up to 2007 and I am sure it was here on WUWT that I read about it.
let me know if you find anything out about that
Iooked again
found this report
http://phys.org/news/2016-05-variability-earth-years.html
note the upward trend since 2010
read the report and note that it mentions my concerns of nothing staying unchanged in space in the burning sun
so they already doubt their own data….
our best bet to finding a guide on cooling or warming is the ice…..
total ice NH and SH will be my standard
Start with the Sun
And move on out….
Space Station #5
Sammy Hagar (Montrose)
“The eruptions cause a reduction in cloud fraction of about 2 percent corresponding to roughly a billion tonnes of liquid water disappearing from the atmosphere.” Does this mean that the water leaves in the form of precipitation? If so, then there should be a measurable downstream (sic!) effect of rainfall correlating with solar activity.
heh, de Nile.
=========
Hallo Jan
ja, actually we do have more rainfall in Africa at the time of lower solar activity
https://wattsupwiththat.com/2016/08/25/svensmark-publishes-solar-activity-has-a-direct-impact-on-earths-cloud-cover/#comment-2287305
Upon reading the paper, the curious part to me was this.
They claimed to see a change in cloud water vapor from the Forbush Decreases (FDs). They list 26 of these, and give their intensity as a percentage of the change in ions from solar max to solar min. Here’s the curious part.
There is only one FD which is larger than the sunspot-related change from solar max to min. All the other FDs are smaller, with an average over all of them of 53% of the swing due to the ~11-year sunspot cycle.
So they’re trying to convince me that they can see a signal HALF THE SIZE of the solar sunspot-related signal in the clouds … but they cannot see a signal of twice that size?
Sorry, not buying it. If a signal half the size of the sunspot signal is detectable, surely a sunspot signal should be detectable. For example, they claim that the FDs make a significant change in aerosols. But since the sunspot signal is twice that size, we should see twice that change over an 11-year sunspot cycle … but as far as I know, we don’t.
w.
Take the time. These Furbeash are brief.
============
A pulse much more easily seen than a slow roll. Look, I’m not arguing we can see anything useful in the atmosphere. Willie Sutton goes to sea or was it he? Please, look in the oceans for the answers.
==============
you must look at the oceans, to find currents and flows and earthly forces [such as the turning of the iron core] that cause cycling on its own
but whichever way you look at it
at the end of the day it is the amount of energy coming through the atmosphere that heats the oceans…
here is the paradox
=> lower solar field strengths
=> more of the most energetic particles leaving the sun
=> more ozone, peroxides, N-oxides formed TOA
=> more UV deflected to space
=> less UV in the oceans
Oh, yeah. The quote from Hockeyschtick:
I’m sorry, but the “time integral” of any string of data depends on a tunable parameter, which is the zero point. By simply picking different zero points you can use the exact same data to show either an increase or a decrease.
This renders the claim that the integral “shows a significant increase in accumulated solar energy” totally meaningless. Using a different zero point, you could use the same data to show a significant decrease in solar energy.
As a result, the trend of the “time integral” is meaningless. Not slightly wrong. Not fixably wrong. Meaningless.
w.
The longer a hotter than average sun shines on the surface of the earth, the warmer will the average temperature be, compared to less radiation for less time. And even more so if there are fewer clouds blocking the incoming radiation, but more water vapor slowing the outgoing radiation.
Wrong Wilis.
Salvatore, thank you for your usual penetrating, insightful, and well researched and documented analysis of my purported errors …
w.
He just said you’re wrong! (scratches chin and busts out laughing) thanks Willis there’s beer everywhere now. I’m sick of this sht lol 😛
In a natural, teleconnected, multi-variable climate system composed of multiple dependent and independent relationships, confounding variables are at every corner. Most amateur climate investigators looking for a cause de jour, do not control for confounding variables in their conjecture. Some even throw them in yet propose that some other variable in the string is their pet cause, such as with those that use ocean parameters in addition to solar parameters. Why? Because ocean parameters go along way in making their prediction come true. The dead giveaway is when the conjecture includes something little causing something big by way of an ill-defined amplification device. Buyers beware.
Sure, amplification without runaway is a key, but look at the power of the ocean to amplify and the power of the oscillations to damp. Ill defined? Sure. Seller’s aware.
=============
Many clear-cut relationships appear meaningless to those who fail to grasp the abstract aspects of mathematics.
Salvatore Del Prete August 27, 2016 at 9:31 am
Carla if you have the time tell us why you think the climate changes and how it might change going forward.
I am interested
——————————————————————
You have a list of contributing factors SDP.
I don’t disagree completely with those.
So many contributing variables as to why the climate changes.
I do think any rise in any gas or energetic particles for whatever reason has an effect on heating and or cooling.
Like Pamela says, oceans are heat sinks or something like that. In ocean warming, undersea volcanoes, earthquakes, tectonic motions and giant black smokers are under rated as to their contribution to Ocean heat.
Earth Rotation speed in circulation processes including escaping heat to higher altitudes and out to space, tectonic motion, forward and back.
Hemispheric Polar vortex strength in downwelling cold, and its effect on driving cold air out of its respective hemisphere, pushing warmer air up into the opposite hemisphere. Northern hemisphere winter pushing colder air down and pushing warmer air even further southward.
Opposite for Southern hemisphere winter.
See example of the north ward extent of warmer air and what has contributed to driving it northward
https://earth.nullschool.net/#current/wind/isobaric/250hPa/overlay=temp/equirectangular=-97.54,-1.15,256/loc=-90.530,-0.357
Solar wind speed and density. CME’s, solar wind streams from coronal holes, heliocurrent sheet crossings anything that injects heated particles into the system, which inflates the atmosphere.
Fewer and fewer of the above solar particle injections mean more and more lowering of the Earth’s upper atmosphere. Radiation belt variations and its proximity to Earth at the equator.
Changes to Earth’s Ionospheric dynamo, electric field, equatorial electro jets EEJ, counter EEJ and magnetosphere.
Increasing and decreasing GCR effects on electric fields, generation of lightening, ionization rates and CCN cloud condensation nuclei..
And more that affects climate.
Location location location in the galaxy. Not going there today.
Prediction for the future.
More heat escape and dissipation of long term akkumulated heat in Earth’s atmosphere and Oceans, if
the solar cycle stays as is or declines further.
Increase in GCR and further shrinking of the heliosphere if solar output declines further.
Heliospheric northern hemisphere anomaly (more shrinkage and GCR penetration north) if the Northern solar polar field remains lower than the southern solar polar field.
Heliospheric reconnection occuring on the interstellar downwind side, in the heliotail of the solar system and Dr. S., will have to eat his hat. lol (refer to particle enhance of focusing cone.)
Planet will cool but we wont see an ice age. (from the original Linsky report on “Cloud Tripping the Milkyway”)
Might have left a few things out.
Spotted a new article on the Radiation Belts.
Bring it on in a minute or two or….
It is visible in the the zone Jetstream significant amount of ozone. This is a direct connection to the stratosphere and the troposphere above the polar circles.
http://www.ospo.noaa.gov/data/mirs/mirs_images/n19_temp_200mb_asc.png
Excellent and you do know what you are talking about.
Abstract
In this work we study links between low cloud anomalies (LCA) at middle latitudes of the Northern and Southern hemispheres and galactic cosmic ray (GCR) variations used as a proxy of solar variability on the decadal time scale. It was shown that these links are not direct, but realized through GCR/solar activity phenomena influence on the development of extratropical baric systems (cyclones and troughs) which form cloud field. The violation of a positive correlation between LCA and GCR intensity which was observed in the 1980s–1990s occurred simultaneously in the Northern and Southern hemispheres in the early 2000s and coincided with the sign reversal of GCR effects on troposphere circulation. It was suggested that a possible reason for the correlation reversal between cyclonic activity at middle latitudes and GCR fluxes is the change of the stratospheric polar vortex intensity which influences significantly the troposphere-stratosphere coupling. The evidences for a noticeable weakening of the polar vortices in the Arctic and Antarctic stratosphere in the early 2000s are provided. The results obtained suggest an important role of the polar vortex evolution as a reason for a temporal variability of solar activity effects on the lower atmosphere.
http://www.sciencedirect.com/science/article/pii/S1364682616300979
Hi Ren,
Seems that our thoughts about the polar regions being preferred locations for GCR entry has a glitch.
Note the comparison below between Pole and California for increases in GCR.
Cosmic Rays are Intensifying
For the past year, neutron monitors around the Arctic Circle have sensed an increasing intensity of cosmic rays. Polar latitudes are a good place to make such measurements, because Earth’s magnetic field funnels and concentrates cosmic radiation there. Turns out, Earth’s poles aren’t the only place cosmic rays are intensifying. Spaceweather.com and the students of Earth to Sky Calculus have been launching helium balloons to the stratosphere to measure radiation, and they find the same trend over California:
http://spaceweather.com/images2016/27jan16/cosmicrays_mar15_jan16.png?
In the plot, neutron monitor measurements from the University of Oulu Cosmic Ray Station are traced in red; gamma-ray/X-ray measurements over California are denoted in gray. The agreement between the two curves is remarkable. It means that the intensification of cosmic rays is making itself felt not only over the poles, but also over lower latitudes where Earth’s magnetic field provides a greater degree of protection against deep space radiation.
Cosmic rays, which are accelerated toward Earth by distant supernova explosions and other violent events, are an important form of space weather. They can seed clouds, trigger lightning, and penetrate commercial airplanes.
———————————————————————————————————————
Updated: Aug. 27, 2016 // Next Flight: Sept. 2, 2016
Approximately once a week, Spaceweather.com and the students of Earth to Sky Calculus fly space weather balloons to the stratosphere over California. These balloons are equipped with radiation sensors that detect cosmic rays, a surprisingly “down to Earth” form of space weather. Cosmic rays can seed clouds, trigger lightning, and penetrate commercial airplanes. Our latest measurements show that cosmic rays are intensifying, with an increase of almost 13% since 2105:
http://www.spaceweather.com/cosmicrays/stratosphere_14aug16.png?
Why are cosmic rays increasing? The main reason is the sun. Solar activity helps push deep space cosmic rays out of the solar system. Lately, however, solar activity has been low. More cosmic rays have been able to penetrate the inner solar system. As the current solar cycle ebbs, we can expect cosmic rays to continue intensifying for years to come.
http://www.spaceweather.com/
Aug. 15, 2016
NASA’s Van Allen Probes Catch Rare Glimpse of Supercharged Radiation Belt
http://www.nasa.gov/feature/goddard/2016/nasas-van-allen-probes-catch-rare-glimpse-of-supercharged-radiation-belt
…”””welling and shrinking in response to such events and solar radiation, the Van Allen belts are highly dynamic structures within our planet’s magnetosphere. Sometimes, changing conditions in near-Earth space can energize electrons in these ever-changing regions. Scientists don’t yet know whether energization events driven by interplanetary shocks are common. Regardless, the effects of interplanetary shocks are highly localized events – meaning if a spacecraft is not precisely in the right place when a shock hits, it won’t register the event at all. In this case, only one of the Van Allen Probes was in the proper position, deep within the magnetosphere – but it was able to send back key information.
GIF of accelerated electrons circulating in the Van Allen Radiation Belts
Artist concept of accelerated electrons circulating in Earth’s Van Allen radiation belts.
Credits: NASA’s Goddard Space Flight Center; Tom Bridgman, animator
The spacecraft measured a sudden pulse of electrons energized to extreme speeds – nearly as fast as the speed of light – as the shock slammed the outer radiation belt. This population of electrons was short-lived, and their energy dissipated within minutes. But five days later, long after other processes from the storm had died down, the Van Allen Probes detected an increased number of even higher energy electrons. Such an increase so much later is a testament to the unique energization processes following the storm.
“The shock injected – meaning it pushed – electrons from outer regions of the magnetosphere deep inside the belt, and in that process, the electrons gained energy,” said Shri Kanekal, the deputy mission scientist for the Van Allen Probes at Goddard and the leading author of a paper on these results.”””…
…”””Additionally, the degree of electron energization depends on the process that energizes them. One can liken the process of shock acceleration, as observed by the Van Allen Probe, to pushing a swing.
“Think of ‘pushing’ as the phenomenon that’s increasing the energy,” Kanekal said. “The more you push a swing, the higher it goes.” And the faster electrons will move after a shock.
In this case, those extra pushes likely led to the second peak in high-energy electrons. While electromagnetic waves from the shock lingered in the magnetosphere, they continued to raise the electrons’ energy. The stronger the storm, the longer such waves persist. Following the March 2015 storm, resulting electromagnetic waves lasted several days. The result: a peak in electron energy measured by the Van Allen Probe five days later.”””…
Question???
Sunspots have a preferred location on the solar surface, Hale boundary is it Dr. S.? Near the equator and near the Hale Boundary?
Does the preferred location on solar surface also prefer being on the downwind side (heliotail side) when sunspots begin forming?
The downwind/upwind situation has nothing to do with solar activity, because of the supersonic solar wind.
You willful ignorance is a sad reflection of the state of lack of scientific literacy
[Regrettably, but trimmed nonetheless. .mod]
Ignorance! just saying
Sparks August 28, 2016 at 8:43 p____________
This buds for you
“””Id love to spit some beechnut in that dudes eye.. “””
“””Cause were those ol boys raised on shot gun…”””
https://youtu.be/3cQNkIrg-Tk
Willful ignorance is a non sequitur. If ignorance is present it cannot be willful.
You just gave a good example of it. Not wanting to see the truth…
It could have been arbitrary.
Safe space and trigger warnings needed?? hahaha
Leif,
“You just gave a good example of it. Not wanting to see the truth…” Back at you. As Pontius Pilate said, what is “truth”? Willful offensiveness, however, is possible and quite common.
One always have to be on the offensive when confronted with people not wanted to see the truth or consider the evidence or simply nitpicking.
It is more challenging to show someone how stupid they are in a kind and gentle manner. Like I do.
They often don’t get it no matter how kind you are.
With this, I will agree.
Carla is a perfect example of this. See e.g. her latest comment.
And these people are not stupid. Often they are extremely clever, yet still as wrong as can be. The phenomenon is sometimes described as pathological science [ http://www.columbia.edu/cu/21stC/issue-3.4/turro.html ]. The lack of trying one’s best to find faults in one’s belief or trying to falsify one’s interpretation is a telling characteristic of this type of thinking. There are several [well-known] characters on this blog falling in this category. No amount of education, explanation, or guidance will change their self-delusion, regardless of how gentle or kind you are [rather the opposite, I’m afraid].
This gives evidence that we human beings are within our technological capability to control the earths water cycle through atmospheric ionization and one day end floods and droughts.
/sarcasm
Sparks August 29, 2016 at 1:31 pm
Safe space and trigger warnings needed?? hahaha
———————————————–
Chew on this for awhile Sparks.
Galactic Cosmic Rays come in a wide spectrum of energy levels.
kilo, mega, giga, tera, peta, exa, zetta and yotta.
In regions of interstellar space where two interstellar clouds are colliding the GCR also plays a role.
And if you think that they could not have an effect inside the heliosphere, read on.
At higher energy levels they are a major driver of astrophysical processes.
Cosmic ray propagation and interactions in the Galaxy
V.N.Zirakashvili
Nuclear Physics B Proceedings Supplement 00 (2014) 1–6
4. Galactic wind driven by cosmic rays
CR influence on the Galaxy is not reduced to generation of Alfvenic turbulence.
CR energy density is ´comparable with the gas and magnetic energy densities
in the Galactic disk. It is expected that the propagation region of CRs is significantly
broader than the Galactic disk. If so the dynamical effects of CRs will be stronger
in the Galactic halo where gas density and pressure are lower. It is possible
that CR pressure gradient drives outflow from the Galactic disk and
from the Galaxy – a so called Galactic wind [24, 25, 26, 27].
The expected geometry of the wind flow is shown in Fig.2. Galactic
wind flows along the surface S . The frozen magnetic field B is tangent to this surface.
At large distances from the Galaxy the field is almost azimuthal due to rotation
of the Galaxy. This azimuthal configuration results in the better confinement of
high-energy cosmic rays.
For illustration we show the results of the Galactic wind calculations [30] in Fig.3.
The damping of Alfven´ waves produced by CR streaming instability results in
the strong gas heating in the Galactic halo. At low heights this heating is balanced
by radiative cooling of the gas. However at large heights the gas number density
is low and the cooling is not effective.
As a result the gas temperature is of the order of one million degrees
at large heights. It is interesting that such a halo of the hot gas with a similar
density profile is indeed observed now via measurements of OVII line absorption
[28].
Damping of Alfven waves = gas heating
Large heights= hotter temperatures
Where else do we find this..
By the way, here is the firing order spark.
1 warning 2 left shoulder 3 right shoulder 4 complete the triangle
@Ulric
Any comment from you on this?
http://oi64.tinypic.com/5yxjyu.jpg
Turns out, Earth’s poles aren’t the only place cosmic rays are intensifying. Spaceweather.com and the students of Earth to Sky Calculus have been launching helium balloons to the stratosphere to measure radiation, and they find the same trend over California:
http://spaceweather.com/images2016/27jan16/cosmicrays_mar15_jan16.png
In the plot, neutron monitor measurements from the University of Oulu Cosmic Ray Station are traced in red; gamma-ray/X-ray measurements over California are denoted in gray. The agreement between the two curves is remarkable. It means that the intensification of cosmic rays is making itself felt not only over the poles, but also over lower latitudes where Earth’s magnetic field provides a greater degree of protection against deep space radiation.
And no one finds this peculiar in any way, concerning propagation of GCR and magnetic fields?
Hi Carla
I do want to point to the fact that this corresponds with the sun being VERY quiet during same period
And no one finds this peculiar in any way, concerning propagation of GCR and magnetic fields?
No, this is well-understood and not peculiar in any way.
Thanks to the Moderator that deleted Sparks post,
Sparks August 28, 2016 at 8:43 pm.
The thought of him holding me down, so that so and so could slap my ass was not well received on my end.
Carla, I apologize that this happened, some people have no filter, however, “Sparks” has been added to the WUWT filter, and he won’t be able to make such crass and ugly statements here again.
Thanks Anthony.
lsvalgaard August 30, 2016 at 7:59 am
And no one finds this peculiar in any way, concerning propagation of GCR and magnetic fields?
No, this is well-understood and not peculiar in any way
————————————————-
We expect more GCR penetration over the polar regions due to magnetic field cut off rigidity and vertical profile of the field in those regions. We expect more penetration of GCR over the S. Atlantic Anomaly and in magnetic field null point regions.
If it is not the energy range of the GCR, how can the penetration be equal at lower latitudes where the Earth’s magnetic field is stronger?
http://spaceweather.com/images2016/27jan16/cosmicrays_mar15_jan16.png
Carla,
I’m totally confused by why Earth’s magnetism is a point of discussion. The mechanics of the process as I understand it are:
GCRs from other stars / galaxies multiple light years away and are continuously headed towards our solar system. Many on those are aimed near the sun and left to their own momentum will go through the plane of the inner planets. But most GCRs are high speed charged particles / atomic nuclei. As those charged particles start to interact with the sun’s magnetic field (out past Pluto) their path starts to bend them away from the sun. (Standard physics of moving electric charges in a magnetic field).
When the sun in inactive, like now, the magnetic field at the distance of the outer planets (and beyond) is weak and the GCRs maintain momentum/course and some hit the earth.
When the sun is active, like in the middle of the 11-year cycle solar cycle, the GCRs are curved (pushed) away from the sun and less of them come within the range of the inner planets, thus less impact earth. This effect is easily seen in the GCR counters.
Note the scale of the curve is an arc with a radius of 10’s or 100’s of millions of miles.
If you’re proposing something related to earth’s magnetic field, then its news to me and worthy of a bigger explanation than 2 or 3 sentences.
Again, remember these are near lightspeed particles, so that have relativistic momentums. That means it either takes a huge amount of force to affect their path, or a huge amount of distance over which to work.
I have a very hard time believing earth’s magnetic field is strong enough to significantly effect charged particles moving at relativistic speeds.
earth’s magnetic field is strong enough to significantly effect charged particles moving at relativistic speeds.
For one, the Earth’s field is much stronger than the sun’s field. typically by a factor of a million. The curve of the ‘arc’ depends inversely on the field strength, so is a million times smaller near the Earth.
When the sun is active, like in the middle of the 11-year cycle solar cycle, the GCRs are curved (pushed) away from the sun and less of them come within the range of the inner planets, thus less impact earth.
It is not really the activity of the Sun that is the main reason for the modulation of cosmic rays. I showed 40 years ago [ http://www.leif.org/research/HCS-Nature-1976.pdf ] that the geometry of the Heliospheric Current Sheet is the major driver of the modulation:
http://www.leif.org/research/Cosmic-Ray-Modulation.png
See also slide 16 of http://www.leif.org/research/On-Becoming-a-Scientist.pdf
The heliospheric current sheet separates parts of the solar wind with oppositely directed magnetic field. It is that abrupt change of the direction that deflects the cosmic rays.
how can the penetration be equal at lower latitudes where the Earth’s magnetic field is stronger?
It is not. What is equal is the percentage change.
gregfreemyer August 30, 2016 at 9:24 am
..””If you’re proposing something related to earth’s magnetic field, then its news to me and worthy of a bigger explanation than 2 or 3 sentences.””..
——————————————————–
More on the Earth’s magnetic field weakening to follow.
This latest ‘Earth to Sky Calculus’ result, was released over on spaceweather.com yesterday I think.
http://www.spaceweather.com/cosmicrays/stratosphere_14aug16.png
Cosmic rays, which are accelerated toward Earth by distant supernova explosions and other violent events, are an important form of space weather. They can seed clouds, trigger lightning, and penetrate commercial airplanes. Furthermore, there are studies ( #1, #2, #3, #4) linking cosmic rays with cardiac arrhythmias and sudden cardiac death in the general population.
Why are cosmic rays intensifying? The main reason is the sun. Solar storm clouds such as coronal mass ejections (CMEs) sweep aside cosmic rays when they pass by Earth. During Solar Maximum, CMEs are abundant and cosmic rays are held at bay. Now, however, the solar cycle is swinging toward Solar Minimum, allowing cosmic rays to return. Another reason could be the weakening of Earth’s magnetic field, which helps protect us from deep-space radiation.
There’s a new section of our website where you can monitor cosmic rays in the atmosphere………….
My bold above for emphasis.
The main reason is the sun. Solar storm clouds such as coronal mass ejections (CMEs) sweep aside cosmic rays when they pass by Earth. During Solar Maximum, CMEs are abundant and cosmic rays are held at bay.
As I showed four decades ago, although solar stoms do have an effect, the main reason for the solar cycle variation of cosmic rays is not solar storms, but the changing geometry of the magnetic field in the heliosphere. http://www.leif.org/research/Cosmic-Ray-Modulation.png
Given the LHC magnets are 100,000 as powerful as the earth’s field and bend relativistic charged particles on a 4km radius arc, that leads me to assume the relativistic GCRs path curved by earth’s field would be on on 400,000 km radius arc.
Am I close? How far out does the earth’s magnetic field start bending the path of the GCRs?
About where you guessed it, but as the Earth’s field get stronger and stronger as the cosmic ray gets closer and closer, the bending rapidly increases and can become so strong that the particle is reflected away from the Earth. This is all well-known, essentially as described by Stoermer back in 1904 [before cosmic rays were even discovered].
Interesting times.
…””A new study by the European Space Agency’s constellation of Swarm satellites reveals that changes may be happening even faster than previously thought. In this map, blue depicts where Earth’s magnetic field is weak and red shows regions where it is strong:
http://wpc.50e6.edgecastcdn.net/8050E6/mmedia-http/download/public/videos/2016/05/030/orig-1605_030_AR_EN.mp4
Data from Swarm, combined with observations from the CHAMP and Ørsted satellites, show clearly that the field has weakened by about 3.5% at high latitudes over North America, while it has strengthened about 2% over Asia. The region where the field is at its weakest – the South Atlantic Anomaly – has moved steadily westward and weakened further by about 2%. These changes have occured over the relatively brief period between 1999 and mid-2016.
Earth’s magnetic field protects us from solar storms and cosmic rays. Less magnetism means more radiation can penetrate our planet’s atmosphere. Indeed, high altitude balloons launched by Spaceweather.com routinely detect increasing levels of cosmic rays over California. Perhaps the ebbing magnetic field over North America contributes to that trend…”’
http://news.spaceweather.com/earths-magnetic-field-is-changing/
——————————————————-
lsvalgaard August 30, 2016 at 10:50 am
… geometry of the Heliospheric Current Sheet is the major driver of the modulation:
The heliospheric current sheet separates parts of the solar wind with oppositely directed magnetic field. It is that abrupt change of the direction that deflects the cosmic rays.
——————————————————–
I think that there is more happening than that Dr. S., not saying you are wrong, just more stuff going on than that.
There is a range of energy levels involved that we always seem to overlook, too.
Something I have read recently about GCR electric fields and magnetic fields.
See if I can find it.
I think that there is more happening than that Dr. S., not saying you are wrong, just more stuff going on than that.
No, there is nothing else going on. The modulation of cosmic rays is well-understood and is as I have described.
ulriclyons August 25, 2016 at 6:26 pm
Try to explain the phase shift on this one…
http://www.woodfortrees.org/graph/esrl-amo/from:1880/mean:13/plot/sidc-ssn/from:1880/normalise
______________________________
I can’t explain the phase shift Ulric. But, coincidentally over the same time period as the Atlantic Multidecadal Oscillation (AMO) phase shift. This and that (see below) is occurring.
APRIL 8, 2016
NASA Study Solves Two Mysteries About Wobbling Earth
A Sharp Turn to the East
..”’Around the year 2000, Earth’s spin axis took an abrupt turn toward the east and is now drifting almost twice as fast as before, at a rate of almost 7 inches (17 centimeters) a year. “It’s no longer moving toward Hudson Bay, but instead toward the British Isles,” said Adhikari. “That’s a massive swing.” Adhikari and Ivins set out to explain this unexpected change.
Scientists have suggested that the loss of mass from Greenland and Antarctica’s rapidly melting ice sheet could be causing the eastward shift of the spin axis. The JPL scientists assessed this idea using observations from the NASA/German Aerospace Center Gravity Recovery and Climate Experiment (GRACE) satellites, which provide a monthly record of changes in mass around Earth. Those changes are largely caused by movements of water through everyday processes such as accumulating snowpack and groundwater depletion. They calculated how much mass was involved in water cycling between Earth’s land areas and its oceans from 2003 to 2015, and the extent to which the mass losses and gains pulled and pushed on the spin axis…”’
http://www.jpl.nasa.gov/news/news.php?feature=6332
Also note from the Magnetic field article I posted above concerning the same time period.
..”’These changes have occured over the relatively brief period between 1999 and mid-2016.
Note to me.
From wiki-The Atlantic Multidecadal Oscillation (AMO) is an ocean current that is thought to affect the sea surface temperature of the North Atlantic Ocean based on different modes on multidecadal timescales.
In the case of the ocean to take into attention cycles of the moon.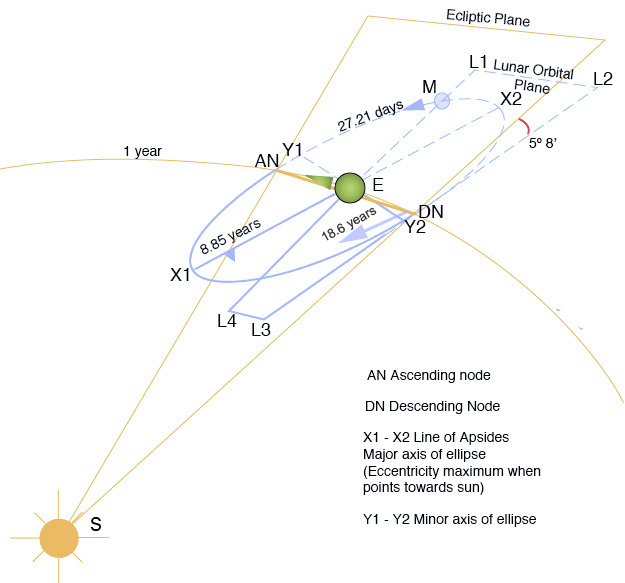
Every 18.6 years, the angle between the moon’s orbit and the earth’s equator reaches a maximum of 28°36′ (the sum of the Earth’s inclination 23°27′ and the Moon’s inclination 5°09′). This is called major lunar standstill. Around this time, the moon’s latitude will vary from −28°36′ to +28°36′. 9.3 years later, the angle between the moon’s orbit and the earth’s equator reaches its minimum, 18°20′. This is called a minor lunar standstill.
the lunar influence causes more \ or less “mixing” of the warmer waters with cooler waters
in turn this would either delay or advance the Gleissberg either way
but, at the end of the day, what comes in is what counts…
https://wattsupwiththat.com/2016/08/25/svensmark-publishes-solar-activity-has-a-direct-impact-on-earths-cloud-cover/#comment-2289147
what do you think of my comment there?
This is also the same period of time that we see the most dramatic changes in the Solar Polar Magnetic Field decreases. More so in the North Solar Polar Field.
http://wso.stanford.edu/gifs/north.gif
http://wso.stanford.edu/gifs/south.gif
Interesting times indeed…
I hope you can see that you can draw quadratics, hyperbola north and parabola south, that would represent the average field strengths?