By Christopher Monckton of Brenchley
I do apologize for not having replied sooner to my friend the irrepressible, irascible, highly improbable but always fascinating Willis Eschenbach, who on August 15 had commented on a brace of earlier postings by me on the vexed question of climate sensitivity.
The delay is because my lovely wife and I are on a two-week trip to the thrusting new Scotland of the ghastly totalitarians who call themselves the Scottish National Party. We had left our beloved Scotland five years ago when we had sensed the advance of the legalists – as the early Chinese philosophers would have called today’s totalitarians. We are what the Chinese would have called Confucians – in today’s money, libertarians.
How said it is to see the Scotland we left just five years ago in such rampant and almost entirely unreported decline. Even in Perth, our old and once prosperous county town, the thriving shops have largely gone, to be replaced by dismal bingo-halls, desperate charity shops and boarded-up windows.
The cottage where we were unwise enough to lodge during our first week’s visit cost us well north of $1000 for the week, and the wretches who let it to us did not provide free electricity or even logs for the fire. The place was filthy; the oven unusable; the wood-burning stove so clogged with clag that one could not see through the glass to where the fire within would have been if there had been any logs; the gutters not maintained; the water not even basically filtered to remove the lumps of peat that turned my white shirts brown. And the internet? They said that if we stood in the kitchen corner we might occasionally get a flicker of a signal. Well, we didn’t get one.
In Paris last December, while playing the piano for the late and much missed Bob Carter in the swank foyer of the grandest of grand hotels on the Champs-Elysees, I mentioned to him that we were by no means the only ones who had left Scotland. Had I been younger, I said, I’d have stood and fought. As it was, a tide of talent and brains and wealth was pouring southward; businesses were closing down all over the boarded-up shop; the oil price had collapsed; and everyone who was anyone was getting out.
Bob said, “Monckton, you’re exaggerating. And I’m going to prove it.” He got out his cellphone and telephoned a friend in Aberdeen who employed 400 people there. “Is it true,” he asked, “that there is an unreported exodus from Scotland?”
“I can’t speak for the whole of Scotland,” said Bob’s friend, “But I will say this. I and all 400 of my employees are leaving just as soon as we can get out.”
Which explains why there was no internet. The notion of providing a service has now largely vanished from Scotland. Inferentially, the signal from furth of Shangri-La did not reach our corner of the damp cottage kitchen because the Amalgamated Union of Semaphore Flag-Wavers and Mountain-Top Beacon Fettlers was on strike. Again.
So to Willis’ posting.
Willis thought I was wrong (Wrong? Moi?) about the value of the pre-feedback climate-sensitivity parameter, widely known in the climate literature (see e.g. Roe, 2009) as λ0.
Misleadingly, Willis refers to this “Planck parameter” as a “feedback”. Properly understood, it is nothing of the kind: for, as the equation that I had illustrated in my previous postings demonstrated, its role in determining climate sensitivity – and that was the role in which I had cast it – is manifestly distinct from that of any true feedback.
Willis says: “The Planck feedback is how much the outgoing long-wave radiation of the globe increases per degree of increased temperature.” It is much better understood the other way about, for the models use its reciprocal, the Planck parameter, to convert Watts per square meter of long-wave radiation change (i.e., of forcing) to Kelvin of temperature change (i.e., climate sensitivity). See the interesting discussion in Roe (2009) on this point.
The Planck parameter, which I shall accordingly denominate hereafter in Kelvin of temperature change per Watt per square meter of radiative flux-density change, occurs twice in the official climate-sensitivity equation.
First, at the pre-feedback stage, the Planck parameter is the constant of proportionality that converts any change in long-wave radiation as a result of a radiative forcing such as atmospheric CO2 enrichment into a corresponding change in temperature.
Secondly, the Planck parameter acts in exactly the same way on temperature feedbacks. Feedbacks are denominated in Watts per square meter per Kelvin of temperature change arising from the original, direct forcing. The product of the Planck parameter (in purple) and the sum of these feedbacks (in bright blue) is the unitless temperature-feedback factor f (in pink) in my illuminated presentation of the official climate-sensitivity equation.
The value of the Planck parameter is, therefore, of paramount importance. And Willis, who is prone to rush to the data (which, to be fair, are usually not a bad place to start), rushed to the data and determined the value of the Planck parameter not as the 0.313 Kelvin per Watt per square meter that I (supported by IPCC and dozens of scientific papers and models I could name) had asserted, but a mere 0.2 Kelvin per Watt per square meter.
How come this discrepancy?
Simple. Willis, in his posting, made the same mistake that I had myself made in the very first article I had written on climate sensitivity, which had appeared ten years ago all over the front page of the Weekend section of the London Sunday Telegraph and had been so popular with readers that it crashed the Telegraph website for the first and only time in its history, attracting the then-unheard-of hit-rate of 127,000 hits in two hours at midnight on a Sunday morning. By that metric, it was the most popular article the Telegraph group had ever published.

Fig. 1 The official climate-sensitivity equation. Pre-feedback sensitivity ΔT0 = λ0 ΔF. Post-feedback sensitivity ΔT is the product of ΔT0 and the post-feedback gain factor G. By a suitable choice of the feedback sum, the equation can model transient or equilibrium climate sensitivity.
The mistake that Willis (and, at that time, I) had made was to perform the calculation to determine the Planck sensitivity at the Earth’s surface and not, as it should be performed for climate-sensitivity studies, at the Planck emission surface, whose mean pressure altitude is about 300 hPa up in the mid-troposphere.
The Planck emission surface is, by definition, the locus of all points of least altitude at which incoming and outgoing radiation are equal in the atmospheric columns that may be thought of as subsisting above all points on the Earth’s surface.
This strange surface is the surface from which satellites perceive outgoing radiation from the Earth to emanate. It is – again by definition – one optical depth down into the atmosphere as seen from above.
And it is at this emission surface, and not at the Earth’s hard-deck surface, that the Planck parameter falls to be determined.
Here is how it is done. There is really very little argument about the value of the Planck parameter, for its derivation is so very straightforward.
Begin with the data (Willis will like that bit). The SORCE/TIM data show that the mean total solar irradiance is about 1361 Watts per square meter, and all datasets are within a few Watts per square meter of this value, so I shall use the SORCE/TIM value.
The Earth presents a disk-shaped cross-section to the incoming radiation, but its surface is a rotating sphere. So it is necessary to divide the total solar irradiance by 4, which is the ratio of the surface area of a sphere to that of a disk of equal radius.
Next, one must allow for albedo. The Earth (or, in particular, the clouds, which account for some 97% of its albedo) reflect about 30% of all incoming solar radiation harmlessly straight back into space. So the mean flux density at the Earth’s emission altitude is 1361 (1 – 0.3) / 4 = 238.2 Watts per square meter.
Now it is time to determine the mean emission temperature represented by that radiation of 238.2 Watts per square meter. This is done by using one of the very few proven results in the generally slippery subject of climatology – the fundamental equation of radiative transfer.
The equation states that the radiative flux at the emission surface of a celestial body is equal to the product of just three values: the emissivity of that surface, the Stefan-Boltzmann constant and the fourth power of temperature.
Since we know the radiation at the Earth’s emission surface, and we know that after allowance for albedo the emissivity of that surface is unity, and we know the Stefan-Boltzmann constant is reassuringly constant at 0.000000056704 Watts per square meter per Kelvin to the fourth power, it is a simple matter to deduce the one unknown quantity in the equation: the Earth’s emission temperature, which turns out to be 254.6 Kelvin, or around 34 Kelvin cooler than the hard-deck surface where we live and move and have our being.
To find out the relationship between any change in radiative flux density at the emission surface and any consequent change in the temperature at that surface, it is necessary only to take the first derivative of the fundamental equation of radiative transfer.
It is not always appreciated that, provided that one expresses the derivative in terms of both temperature and flux density, the relation between radiation change and temperature change is linear, even though the derivative comes from a fourth-power relation.
Here is the math:
![]() K W–1 m2.
K W–1 m2.
One final adjustment is needed, and, to verify IPCC’s value, some years ago I obtained from John Christy a datafile containing 30 years’ temperature-anomaly data for the mid-troposphere. Using these data (Willis would be pleased again), I was able to determine the Hölder coefficient from the integration of latitudinal values for λ0 using equialtitudinal latitudinal frusta, for are not frusta that are equaialtitudinal also conveniently equiareal? [Hint: yes, they are].
The bottom line: the product of the Hölder coefficient 7/6 (which allows for the fact that a sum of latitudinally-derived fourth powers, for instance, is not the same as the fourth power of a sum) and the first differential obtained by taking the derivative above gives a very good approximation to the current value of the Planck parameter λ0, namely 0.313 K W–1 m2.
Phew!
Can the value of the Planck parameter vary? Yes, if insolation varies, and yes, if albedo varies. But, since the solar “constant” is near-invariant, and since the albedo is unlikely to change much even if major ice losses eventually occur, lambda-zero will continue to be at or close to 0.313 K W–1 m2 for the foreseeable future.
With respect, therefore, Willis was infelicitous in referring to the Planck parameter as a “feedback”, for it is unlike any true feedback; he was incorrect (as I had once been) in attempting to determine it at the hard-deck surface rather than the emission surface of the Earth; he was accordingly incorrect (as I had once been) in determining its value to be of order 0.2 Kelvin per Watt per square meter; he was incorrect in imagining the Planck parameter to be non-linear (I knew enough calculus not to fall for that one); and he was incorrect in imagining that its value had been determined without regard to latitudinal non-linearities (I do more homework than I usually show in these columns for general family entertainment).
Apart from that, Mrs Lincoln, how did you enjoy the play?
But let us end with a richly-deserved compliment to Willis. Like me, he is largely an autodidact. Like me, he makes mistakes. And this time I am in no position to crow: for the mistakes he has made are the mistakes I had once made myself.
Above all, like me he is interested enough to ask questions – usually very good questions – and to do his very best to find the answers. To him, as to me, science is a matter not of belief but of diligent, disciplined inquiry. It is this passionate curiosity that unites us, and marks us out from the totalitarian true-believers who are wrecking Scotland and have done their best to wreck science too. To them, and not to him, I award the accolade “Thick as two short Plancks”.
“How said it is to see the Scotland we left just five years ago i ”
Should that be “SAD” Sir Monckton ?
Brilliant! A typo! We can hereby declare the entire analysis null and void.
… and don’t you just love it when the pedant makes an error of his own.
Lord M, Marcus, not Sir.
Yup! Let’s declare Monckton’s analysis null and void.
That’s Lord Monckton. Specifically Viscount Monckton (the 3rd of Brenchly).
Sir is for Knighthoods.
Gotta give credit where credit is due.
G
Maybe I misspelled Brenchhley ??
G
Above my pay grade, but always a pleasure.
As defined here, “Planck’s Parameter” is a feedback, Lord Clownschtick von Brenchley. It is not a complicated concept.
Climate sensitivity analysis treats the earth as a control volume or control mass, and if an increase in input directly causes an increase of a certain type of output, that is a feedback by definition. Willis actually gets credit for having been confused about this concept in the past but getting it right this time.
MS, nope. The feedbacks are mainly clouds and water vapor affecting what CO2 would do by itself absent them. The literature CO2 only derivations range from 1.1 (TAR) to 1.2 (AR4 and Lindzen). Here, 1.16C for the Planck result absent feedbacks, using the delta forcing generally accepted as 3.7w/m2 and generally accepted lambda0 of 0.31.
Matt Skaggs: As defined here, “Planck’s Parameter” is a feedback,
I was taught that a “feedback” was a response that altered the input. Is there some debate about that, or variation among intellectual groups?
That is the standard definition. Unless one’s goal is to just confuse the subject.
Agree fully – a feedback is some portion of the output FEDBACK to the input.
An output as a result of an input is defined by the transfer function. One can then take some of the output and FEED IT BACK, adjusted by a FEEDBACK gain (hopefully negative), to the input.
Basic control engineering. Maybe they don’t teach that anymore.
Mr Marler has hit the nauil on the head. A feedback is indeed the transfer of some fraction of the output of a dynamical system so that it is fed back to the input, either augmenting or attenuating the original amplification that may have been present. In that key sense, the Planck “feedback” is manifestly not a feedback. Furthermore, as the illustration in the head posting shows, the Planck parameter has a role manifestly and in multiple respects distinct from a true feedback.
I have long learned, when studying the slippery subject that is climatology, to become alert when someone uses a term like “Planck feedback” for an operator that is so obviously not a feedback and that so obviously has a role in many material ways distinct from any feedback. I have been using these pointers for years to feel my way towards where the errors lurk in the models. For it may be that there are some who know what the errors are, and they are anxious for reasons of power or profit to conceal them. If so, they will take certain steps to assist in the concealment, and, by following those steps, one is guided towards what they are concealing. Watch this space.
Mr Skaggs is, as usual, wrong. Though the reciprocal of the Planck parameter is often described as a “feedback”, it is better understood as the constant of proportionality that relates changes in radiative flux to changes in temperature in the absence of feedbacks.
It is also self-evident that the Planck parameter, as presented in the head posting, is denominated in Kelvin of temperature change per Watt per square meter of radiative forcing, whereas temperature feedbacks in the climate are (whether or not they should be) denominated in Watts per square meter per Kelvin of the temperature change that caused them.
Furthermore, the Planck parameter has a role quite distinct from that of a true temperature feedback. For this reason, it is treated differently from true feedbacks (see e.g. IPCC, 2013, fig. 9.43a, where the feedbacks are summed without the Planck “feedback”.
Also, just look at the climate-sensitivity equation illustrated in full technicolor in the head
posting. The true feedbacks (in bright blue) are summed, but the Planck parameter, far from being added to them as though it were a feedback, is instead multiplied by their sum to obtain what passes in IPCC’s analysis for the feedback factor. Also, the Planck parameter, but not any of the feedbacks, is multiplied by the initial forcing to generate the initial or pre-feedback temperature change.
For all these reasons, it is better to consider the Planck parameter is part of the reference frame of the climate object than as a feedback, which is why I said that calling it a “feedback” is infelicitous. See Roe (2009) for a discussion on this very point.
There is, however, a concerted campaign in some quarters to try to confuse the public as much as possible so as to conceal the numerous methodological defects that have led to the absurd exaggerations of the computer models for just a little bit longer.
Well, the sands of time are running out. Watch this space.
“Climate sensitivity analysis treats the earth as a control volume or control mass, and if an increase in input directly causes an increase of a certain type of output, that is a feedback by definition.”
Not on my planet, Mr. Skaggs ; ) that’s just a response . . Feedback involves an output effecting input.
Increased sound entering a microphone causing increased sound coming out of a speaker, is a response . . If the speaker’s output feeds sound back into the mike, you get feedback.
“There is, however, a concerted campaign in some quarters to try to confuse the public as much as possible…”
Exactly.
You have in the past; probably on several occasions, said that the best way to address the CAGW discussion was to employ their own methodology in showing where they are in error. The IPCC that is, and I have always taken your use of “”.. official climate-sensitivity equation. ..”” as a starting point , that the warmists adhere to, rather than your own preferred explanation of the climate.
I have also been very reluctant to embrace the use of classical feedback system methodology to analyze climate variability, after spending much of my 56 year career in industry designing not a few electronic amplifier systems employing feedback.
The electronic field is the area where feedback systems have been most extensively studies and analyzed, but other fields such as mechanics, and chemistry have some quite similar situations.
The electronic feedback ” amplifier “, or even non-feedback amplifiers have some fairly simple rules of conduct.
We can consider an amplifier system to be a four terminal or two port black box, with a single input port comprising terminals 1 and 2 to which a signal from some source is applied, and a single output port comprising terminals 3 and 4 which are commonly connected to a load component . Very often, terminals 2 and 3 are considered to be common and refer to them as “ground” or some such label, so I have labeled the four terminals of the black box in CCW order.
So we can think of terminal 1 as the primary input terminal, and terminal 4 as the primary output terminal.
In such circuits, signals can be either voltage signals or current signals, but are actually both, and are linked by an impedance which in general will be complex, perhaps consisting of Resistive, Capacitive, and Inductive elements.
At the input port, we would have an input voltage V12 and an input current I12 and the ratio V12 / I12 would be the input impedance Z12.
At the output port, we will have V43 and I43 as the output voltage and current respectively, and V43 / I43 would be the load impedance Z43.
So the black box innards will convert the input V12 to an output V43 with a voltage gain ratio Av given by V43 / V12. Also the box converts the input current I12 to an output current I43 that flows in the load impedance, with now a current gain Ai given by I43 /I12.
Now this is true regardless of whether the system has any feedback at all .
With the relevant black box model described above, a little simple algebra gives us the universal (electronic) amplifier relation: Av.Z12 = Ai. Z43 or more commonly written as :
Av.Zin = Ai Zl where Zin is Z12 and Zl (load) is Z43.
So regardless of the design of the black box innards, the final result obeys this simple relationship.
Now on paper, we would tend to regard the above parameters as fixed values independent of signal levels, but in actual practice they will differ from that assumption and designers seek to minimize any negative effects of such non- ideality.
When we start adding feedback AROUND the above black box, we discover some additional complexities.
The output from the black box is not simply a voltage, but is both a voltage and a current presumably locked in embrace by the load impedance Zl or Z43.
We could sample either the output voltage V43 or the output current I43 to obtain a proportional feedback signal, and we could combine that with the input signal either as a voltage or as a current.
I won’t burden you with all the gory details; but as a consequence of the multiple possibilities for the feedback, it will be found that both the resultant voltage gain and the resultant current gain (Avv and Aii) will be changed, as will the effective input impedance of the composite amplifier and also the output impedance, and those changes will be quite different for the different types of feedback. We can make the input impedance higher or lower depending on the feedback type, and similarly with the output impedance of the black box.
Well it takes too much space to describe (in words) all of the complexities of feedback amplifiers; but suffice it to say, that what I just described here, is infinitely simpler than the earth climate system, which certainly has many more inputs and many more outputs and very few known solid relationships between all of those variable and parameters.
So the fact IPCC has enshrined the equation which LMofB has expounded on here, one should not presume that the global climate is anywhere near as simple as IPCC thinks, and which Christopher has detailed for us here.
I for one have not even been able to discern what is a real signal and what is any kind of a forward gain.
It seems to me that if we consider TSI to be an input signal, we know that the majority of that energy goes into “hiding” in the deep oceans to come back to haunt us at some later time; but is that a feedback or is it simply a time delay or phase shift in the “forward gain” of the system .
How much of it goes into hiding determines how much is left to give relatively prompt variations in the climate variables.
Personally, I think IPCC is barking up the wrong tree, and LMofB’s detailed analysis clarifies why I think IPCC is not dealing with anything even remotely akin to a real simple feedback amplifier.
G
Takes too many words to describe what one picture can show clearly. Sorry about that.
George E. Smith’s characteristically interesting comment has a bearing on some work I am doing at present on temperature feedbacks and their handling in the climate models. If he would get in touch via monckton [at] mail.com, I may be able to rope him in and get his expert assistance.
That does not sound like feedback to me. Feedback implies that the output of a system modifies the input in either a positive or negative manner. Your definition is lacking. But you ad homme Monckton, then proceed to beclown yourself.
+1 for using be- prefix. You are a pretty linguistically entertaining lot, even if getting the meaning of feedback is difficult. Never before I knew be- is probably cognate to ambi- in ambivalent, and comes from PIE *ambhi. Wow.
Well, Robert, I saw no ad hominim in his response. He merely said Skaggs was wrong. And then explained his position. Legitimate argumentation, imo.
Oops, I misread your comment, Robert. I thought you were referring to Monckton as the source of the “ad homme”. My abject apologies, sir.
You missed the missing comma, JimB! Easily done.
His L0rdship’s response did contain an “ad homme.” I have noted (with regret) a growing trend in this type of response which adds nothing of value and detracts from the veracity and cogency of any comment being made. I wish that all (including his L)rdship and other contributors such as Willis) would cut out this unfortunate habit, and stick to the facts.
His L0rdship said:
We (and this includes his L0rdship) do not know how many decisions, comments, expressions of opinion Mr Skaggs makes each year (or over the course of his life to date) so it is impossible to know whether more than 50% of these are wrong,
It may be possible to check each comment he has posted on this site and make an evaluation of which if any are wrong, materially or otherwise. But this would be a very difficult task not least because of the uncertainty in this area and the deficient data sets upon which this “science” is based.
The comment <b.as usual was an “ad homme,” it was unnecessary being mere surplusage and, in my opinion, would have been best omitted from his L0rdship’s response. Let the thrust of argument speak for itself.
We can all form a view on what is the proper meaning of feedback, whether the nomenclature is being incorrectly used, and if so what bearing this has. Sometimes sloppy wording has no impact but at other times it can be very significant, and at the very minimum it often suggests a lack of understanding or a cavalier attitude to the application of precise facts that have the potential to lead to error elsewhere in reasoning and/or in application.
PS for what it is worth, I consider that the expression feedback is often being incorrectly used.
Mr Verney should know that there are various trolls who surface again and again here to make silly points in the hope of confusing the argument – a hope that will shortly and permanently prove vain. To clarify matters for those who are not so regular here, when one of these trolls dive-bombs the site with a silly comment I point out that that troll is, as usual, wrong, for the troll in question,, like all of his ilk, is not interested in getting anything right: merely in preserving a Party Line that will soon become irrevocably, laughably unsustainable.
richard verney,
Would your objection have been short circuited, so to speak, had Mr. Monckton added a few words to his . . rebuff, such as;
*Mr Skaggs is, as usual it seems to me, wrong.* ?
“if an increase in input directly causes an increase of a certain type of output, that is a feedback by definition”
I would love to know what book you got that definition from.
According to this definition, the only thing that isn’t a feedback, is something that has no affect at all.
“if an increase in input directly causes an increase of a certain type of output, that is a feedback by definition”
That’s not feedback.
That’s the definition of a standard amplifier, iirc?
That is not a feedback. A “feed” “back” must feed…. back. An input causes an output which causes a modulation of the input. What you have described is simple cause and effect. You push down on the gas pedal, you accelerate, wind and mechanical resistance increases- the acceleration relative to fuel consumption increase and power output declines.
Not so.
A feedback takes a signal that depends on the OUTPUT (of a system) and uses that to modify the INPUT to the system.
The forward gain of the system is NOT altered by feedback; the effective input signal IS, and that effective input is still magnified by the original forward gain of the system.
In properly designed feedback systems, the final real output for a given real input, is largely independent of the forward gain and is determined almost solely by the feedback.
And since the forward gain is effectively removed as the determining factor, then it does not need to be a constant or even a linear function of the signal level.
The real input signal to the climate system is the 1362 W/m^2 of the TSI.
The effective output of the system is the “climate ” whatever climate is supposed to be.
It seems as if the measure of earth’s climate is simply a temperature; well actually a temperature anomaly, and nobody knows just where that was measured.
G
So you have it exactly backwards.
@Matt Skaggs
“It is not a complicated concept.”
No, it isn’t. So why is it so confusing for some. An input results in an output. If part of that output becomes an input (which results in another contribution to output) then it is called a feedback. No need to try to make it sound all fancy. Not rocket science.
” if an increase in input directly causes an increase of a certain type of output, that is a feedback by definition”
No, it is absolutely nothing of the sort, you patronising, abusive little fellow.
You don’t actually know what a feedback is, do you?
Congratulations on the most spectacular show of pig ignorance I’ve seen for some time.
Very nice derivation of lambda0. The importance of the ERL (the emissive surface around 300 hPa, aka effective radiating level) is a source of much confusion. The saturation argument. Salby’s opacity equivalent mistake. Convection versus radiation.
Not to mention your nice previous posts using this value and the equation to calculate sensitivity near the middle of the range using IPCC AR5 values (Lewis and Curry 2014) and Bjorn Smith’s newer more constrained aerosol value (Lewis 2015). Range 1.5-1.8. Your result ~1.6.
CMIP5 median 3.2, mean 3.4; another way to show the models are observationally wrong. They disagree with one another on absolute temp by +/- 3C even hindcasting; so they dont get cricial water phase transitions right. They diverge since 2000 from satellite and balloon temperatures by a factor of more than 2 globally (pause) and a factor of almost 4 for the tropical troposphere (the missing hot spot). Unavoidable parameterization inherently imbeds the attribution problem seen by comparing virtual identical warming ~1920-1945 to ~ 1975-2000. Even AR4 said the former period could not be attributed mostly to CO2; there wasn’t enough of a rise. But the latter period was attributed mostly to CO2–wrong. Now coming back to haunt the warmunists as Mother Nature continues to refuse to cooperate with them.
Mr Istvan is very kind. I thought it was worthwhile to explain the derivation of lambda-zero in some detail, because it is one of the very few quantities on which we can broadly agree with the Thermageddonites (most of whom, however, have no idea that it even exists, let alone what its value is).
It is becoming apparent that not only the direct forcing from CO2 but also the temperature feedbacks have been much exaggerated in the models – and especially the top-end feedbacks that lead to disproportionate and silly predictions of warming up to 10 K per CO2 doubling (see, e.g., Murphy, 2008).
During my sojourn in Scotland (I’m now in Rob Roy’s cottage, where, splendidly, the hot water works, though the place has not been cleaned since Rob Roy’s time), I’ve been studying the official representation of feedbacks. An interesting and very large error in the official methodology has come to light. Watch this space.
You have more reach than my three ebooks, especially The Arts of Truth climate chapter vetted by Lindzen himself (a rather personally humiliating experience recounted in th blogosphere elsewhere) and Blowing Smoke on energy and climate, with a wonderful foreword from Judith Curry.
Your posts are brilliant. Even our prior minor (archived for posterity) tussle over at Judith’s when your irreducible equation first published (I mathematically reduced it further, but she could not publish the math so I had to supply a .pdf version, but still reached your same general climate conclusion anyways so what the hey…).
Highest regards, Lord Monckton. We shall soldier on together.
With all due respect, English translation of ristvan’s comment:
“…time for the bad guys to do another temp adjustment…”.
JC, lets hope they do. You take screen shots and catch the miscreants. Then we can ‘hangem high’. About time.
@Rud Istvan
August 22, 2016 at 1:03 pm: well, Rud,if you keep trying to down Prof. Salby, an actual Atmospheric Physicist, you owe it to science to state a proper case. Our current Trolls can only delight in your so far empty words re Salby who deserves far better from us. And they will repeat them forever…..
Brett, see my more detailed comments on Salby’s latest Youtube lecture over at Judith Curry’s Climate Etc. concerning his opacity error. No need to repeat here just for you. And another commenter totally took apart his basic carbon sinks/sources math. Just algebra plus one derivative theorem from calculus.
Salby is wrong. He misstates the GHE, his facts about GHGs pre and post 2000 are wrong, he misunderstands 14C bomb spike residency time ( individual molecules not the same as net concentration PPM), and his source/sink math is shonky. All indefensible. Get over it already.
And as usual i learned at least one new word! :>)
Milord,
Should Scotland vote to leave the UK in order to remain in the EU, England can expect hungry refugees crossing the Border, just as Venezuelans now stream into Colombia from their socialist paradise in search of food.
Having oil can’t rescue socialism nor save its victims. Maybe the Germans will send food parcels to their fellow European Unionists in need, but there must be a limit to such charity.
Scottish National Socialist Party rule would produce productive refugees to match those who fled the Third Reich, or more, proportionally.
What became of your Classical Cottage project in the Highlands?
Soon oats and sheeps’ stomachs will be in short supply. Buy haggis futures now!
Garbro
“Having oil can’t rescue socialism nor save its victims” – yes, but it can make the slave masters very rich.
Few in Scotland will get rich on today’s oil prices. Aberdeen is even more devastated than most other cities in Scotland. Even Union Street, which rivaled Princes Street in Edinburgh as Scotland’s grandest shopping street when we used to live in the county, now has boarded-up shops here and there, and the surrounding area is undergoing a sharp and uncomfortable decline following the collapse in oil prices.
There is a certain amount of shale gas under the central belt of Scotland, but naturally the National Socialist Workers’ Party of Scotland is implacably imposed to enriching Scotland’s people by extracting it.
No doubt Hugo’s cronies have salted away their oil loot in the Caymans and Switzerland, for after the slaves rise up in revolt.
Scotland’s SNP is both socialist and nationalist. Speaking historically, that is not a good combination.
The British will not abandon Scotland even if a few Scots do.
There are political storms and then there are tea-cups.
Lord Monckton.
It’s a sad observation Scotland is in serious decline. I have travel the length and breadth many times, but no more. The world is getting more verboten, smaller and more restrictive. The bucket list is becoming a thimble by comparison. Without a doubt my care free and extensive traveling adventures are long gone.
As for the rest I agree with Bloke down the pub
Above my pay grade, but always a pleasure.
Scotland is no longer worth visiting, The lunatics in charge are intent on covering all the mountains with useless wind turbines so that they can proudly proclaim that they have 100% renewable electricity. To think that Scotland used to be famous for producing top-notch engineers.
I’ve traveled most of the world repeatedly and the West coast of Scotland is an all time favorite. Love the people, food, accommodation and Islay scotch. Not necessarily in that order. Sitting in a Bowmar waterside pub with a plate of Scallops caught just off shore and a glass of Lagavulin 16, well it can’t get much better.
I do think their politics are suicidal but can’t really judge since there’s a witch running for president in my own country.
It’s pretty bad when even the libertarian is saying a carbon tax might be a good thing. Libertarian AND tax???
You are more upbeat than I. My list includes all of Europe.
There are plenty of vacant lots available in Detroit and quite a lot of fixer upper houses or shell structures. The real sadness is the percentage of people who can’t find the common denominator of the two areas.
It is this assumption of a constant albedo that I question, and may be at the root of Willis’s variation in the lambda-zero. At any given point on the earth, it’s albedo changes by the hour, if not the minute. For the earth as a whole, maybe it averages out to a constant value — ceteris paribus
But if we assume a changing temperature of the earth, even regionally, then the constancy of albedo is much in question.
As an aside, I am astounded at continued use of “30%” for the albedo of the earth, a most critical parameter in the system of equations. One, maybe two significant figures. Then we worry about the output of the equations to 4 or 5 significant figures? Something is very wrong.
Is the albedo of the earth 3.000(+/- 0.002)E-01 (4 significant figures). If so, I’d like to see a link to the supporting data. Or is it “about 30%” which is (generously) two semi-significant figures?
Actually, the Earth’s albedo is measured in various ways by satellites and it doesn’t seem to vary by very much. An interesting paper from 2011 explains one reason why. Some 97% of the Earth’s albedo is reflection from clouds, and only 3% is surface albedo.
I agree that it would be better to obtain a more precise value, but for present purposed 0.3 will do.
Yes. An even ‘weirder’ observational result: NH and SH maintain observationally about the same albedo!! We dunno why, only that it is. Major paper maybe three years back. Webster was a co-author.
Well then, I repeat my objection. If 97% of albedo comes from clouds, and the formation of clouds is a function of temperature, in particular ocean surface temperature,
(a glitch caused an unintended submit of the above…)
If 97% of albedo comes from clouds, and the formation of clouds is a function of temperature, in particular ocean surface temperature, then if we argue that an Increase in CO2 will cause SOME warming, It must follow that there will be more clouds and a greater level of albedo.
From Willis’s look at the data, the amount of cloud formation is a non-linear relation to surface temperature.
It would be worth reading Callendar (1938), who has a brief but clear account of the various counterbalancing mechanisms that keep the climate system stable, one thing offsetting another.
And, in a short essay, one cannot consider every possible variation, so, since albedo does not seem to change much, I choose to treat it as near-invariant under modern conditions. Of course, anyone is free to do the calculations on any other basis.
Monckton of Brenchley – in your interesting article, you say “the Planck parameter is the constant of proportionality that converts any change in long-wave radiation as a result of a radiative forcing such as atmospheric CO2 enrichment into a corresponding change in temperature“. So I’m not convinced that you need to assume constant albedo – a changing albedo may change the radiative forcing but I don’t see that it necessarily changes the “proportionality”. ie, if it change the radiative forcing then it would presumably change temperature too, in line with the (constant) Planck parameter.
Monckton of Brenchley – I now note that your “emission surface” is at 300hPa, so isn’t it well above virtually all clouds? In which case, should you be adjusting the flux density at all for albedo?
Mr Jonas may like to know that a variation in albedo would cause a variation in the value of lambda-zero, which is dependent upon it.
And, if he reads the careful definition of the emission surface in the head posting, he will see why the cancelation of short-wave radiation by albedo is justifiable – and, therefore, why it is standard practice.
I should make it plain that the derivation of lambda-zero in the head posting is mainstream climate science and any disagreements with it should be addressed not to me but to the IPCC secretariat.
Monckton of Brenchleu – I’m trying to understand what you are saying, rather than disagreeing with it, and there are some things that don’t add up in my rather limited brain.
“The Planck emission surface is, by definition, the locus of all points of least altitude at which incoming and outgoing radiation are equal in the atmospheric columns that may be thought of as subsisting above all points on the Earth’s surface.“. The Planck emission surface appears to be higher than virtually all clouds. At points above clouds, there is more outgoing SW radiation because it is reflected by clouds and less outgoing LW radiation because it is impeded by clouds. The primary net effect – if there is one – on the Planck emission surface would be a change of altitude. NB. The Planck emission surface is purely conceptual, it can move without there being any physical movement.
“Pre-feedback sensitivity ΔT0 = λ0 ΔF. [The Planck sensitivity calculation] should be performed for climate-sensitivity studies, at the Planck emission surface“. This now seems to me to be a very curious calculation, because (again, to my simple mind) the major variation re clouds is likely to be caused by movement of the emission surface to a place with a different temperature, rather than a change of temperature caused by radiation variations at a fairly fixed emission surface. In other words, when cloud cover changes the Planck emission surface moves, so ΔT0 is not a measure of the warming effect of radiation.
And if there is no net effect from clouds, then no adjustment for clouds would be needed.
It seems that what you are really saying is that the Planck sensitivity calculation has to be made for some notional constant cloud cover, rather than that cloud cover actually is constant. The IPCC secretariat is unlikely to be useful in resolving this, because they assume that clouds are just a feedback (“Large uncertainties remain about how clouds might respond to global climate change.” – IPCC AR4 TS6.4.2).
It is stated here that 1) ~97% of Earth’s albedo comes from clouds (which is more than I would initially think), and that 2) Earth’s albedo appears to change very little, which is then tantamount to saying that the global cloud cover fraction is remarkably stable.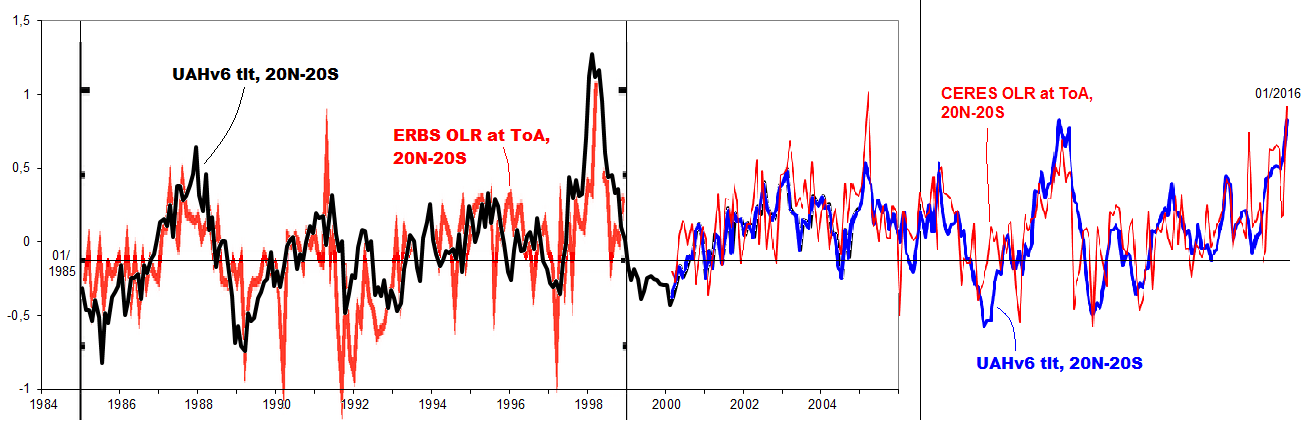


However, this second claim seems based only on data spanning from the last part of the 90s till today, a period within which there has basically been no (tropospheric) warming.
More interesting then to check with data stretching back to times when there actually was proper (tropospheric) warming occurring, like say from the mid 80s to ~2000.
What do we have? We have ERBS data. We have direct ISCCP cloud data and indirect ISCCP flux data (FD), derived from (among other inputs) the cloud data. We have HIRS data. And then we have TLT data (UAH and RSS).
What does the data show?
continued …
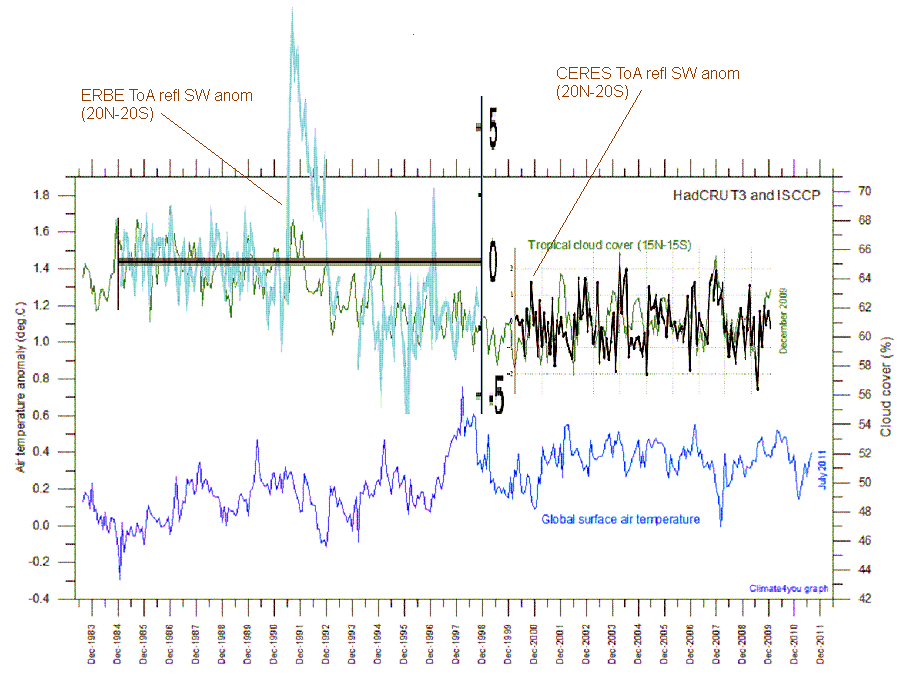

It’s all evidently due to a substantial decrease in cloud cover from the last part of the 80s to about 2000. Earth’s albedo, significantly in the tropics, went down. At the same time, there has been no observable “enhancement” of any “radiative GHE” since at least 1984-85. More ASR, not less OLR, is the direct cause of the radiative imbalance at the ToA. The Sun, not CO2. And with that, the case is pretty much closed …
Thanks Kristian. That is exactly what I have been saying for several years now. The sun changes cloud cover by altering the gradient of tropopause height between equator and poles which shows up as a change in jet stream behaviour.
Don’t thank me, Stephen. ‘Thank’ the data …
It’s right to thank you because most don’t read the data let alone reproduce it.
Kristian and others are apparently surprised by LMof B’s assertion that 97% of albedo comes from clouds (I agree with that).
Part of the reason for their misunderestimation is their lack of understanding of ” Albedo “.
Albedo is a SINGLE number (variable) that simply states the total fraction of the incident TOA TSI (about 1362 W/m^2) which is returned directly to space, by processes of reflection or refraction and scattering UNMODIFIED by those processes as to frequency or wavelength; save that those processes may not be spectrally flat (constant) over the entire incident solar spectrum.
In other words, the effective REFLECTANCE may not be a constant over all solar wavelengths.
Absorption followed by re-emission processes such as by GHGs or other materials is specifically EXCLUDED from Albedo.
ALBEDO is NOT a reflection coefficient of some random surface or volume. It is ONE NUMBER for the entire planet.
So please stop using “Albedo” as a synonym for “reflection coefficient”. it is NOT.
G
Stephen Rasey – I agree with you that albedo is not constant, but I can’t tell from your wording how you relate albedo to temperature ie, which is cause and which is effect. I think it is highly likely that temperature varies in reaction to albedo – significantly over multi-year timescales if not primarily.
See https://www.newscientist.com/article/dn5048-earthshine-fall-heats-global-warming-debate/
and http://www.spacearchive.info/news-2004-05-27-cit.htm
New Scientist 27 May 2004 “A new study of earthshine, the sunlight reflected back onto the Moon from our planet, suggests that falling cloud cover could explain the warming of the Earth’s lower atmosphere seen over the last 20 years.“.
For New Scientist, that’s a pretty impressive statement, even if they do go on to try to discredit it.
@Mike Jonas
In the terms of the subject model, the assumption is that albedo is constant within the precision of other factors. Also in terms of the model, the albedo is an parent input that determines “Mean Flux Density”
But I am challenging the assumption that albedo is constant and that it is particularly insensitive to surface temperature. Willis’s studies of the TERRA data set and the buoys strongly imply that cloud cover, and by inference albedo, are strongly and non-linearly dependent upon surface temperature. I agree with that.
Therefore, in the context of a climate model with increasing global temperatures, I feel that an assumption of a constant albedo highly questionable.
If indeed 20+ years of measurement of the albedo has shown it to be approximately constant, we still have this nasty “Pause” to consider. Either:
1. the Albedo does not change with temperature (which flies in the face of hourly measurements) or,
2. a measured albedo that turns out to be constant confirms the Pause.
FWIW, Dr Spencer is of the mindset that it is small changes in cloud cover associated with the PDO that cause most of our warming (and cooling). Hans Von Storch is also on the record saying that one reason that the models perform so poorly is that they don’t model cloud formation very well. (and then there is Svenmark)…
@ Mike Jonas
August 22, 2016 at 2:11 pm: Our studies of solar system tropospheric clouds eg Venus-Earth etc., lead us to think they are more an effect than an agent of T. Why? Optical Depth maybe, but most folks haven’t started thinking on these things yet.
Brett Keane – I’m interested. Do you have further details? Willis has explained frequently how tropical storms (and hence presumably clouds) can be a response to SST, so clearly clouds can respond to T. However, on other timescales and in other ways and places it seems extremely likely to me that the major effect is the other way, ie. of clouds on T. I need to do more investigation one day (I’m travelling etc for the next couple of months) so some detailed information would be helpful. TIA.
To a quick approximation, the Earth’s surface temperature should be proportional to the fourth root of the ratio of its emission coefficient divided by its albedo. A 1% change in this ratio (as from albedo) would correspond to a 1.34 deg F change. Think about this: All the temperature changes we are arguing about can be fiddled by changes in natural parameters that we do not know to any better accuracy.
So the planetary albedo is constant?
Remember that Vangelis called his 1976 studio album Albedo 0.39?
Curiouser and curiouser said Alice.
I mind that simply the total absorptivity=emissivity spectrum is not presented as measured . Then the albedo with respect to the Sun’s spectrum can be calculated by a simple dot product . And extending that to a spectral map over the sphere in an APL such as 4th.CoSy is a matter of just a few more succinct expressions .
I do appreciate having recently seen , sorry I don’t have time to more than browse much of these posts these days , Christopher discuss the difference between averaging temperatures over areas and the temperature corresponding to averaging energy densities . Hopefully I’ll find time to go back and read that in detail . It is fundamental .
Christopher Monckton of Brenchley, thank you for the essay.
What do you think is the sensitivity estimate for the Earth surface?
In answer to Mr Marler, climate sensitivity at CO2 doubling will be about 0.8-1.3 K. See Monckton of Brenchley (2015ab) in the Science Bulletin of the Chinese Academy of Sciences for a discussion.
My current researches suggest that high-end sensitivities, in particular, arise from a fundamental error that has lurked at the heart of the models for 30 years. So I expect a little warming from doubled CO2, but certainly not a lot. And I hope that I shall soon be in a position to prove it.
I luv u
Thank you sir.
My son and daughter in law are returning from 2 weeks in Scotland. It will be interesting to learn of their experience.
My lovely wife and I visited Helensburgh on the north bank of the Clyde today. It was once a fine Victorian town with terraces of noble merchants’ houses on the hill looking out across the estuary where the world’s ships were once built. But the town center now has many boarded-up shops and a number of low-rent retail outlets. This seems to be the pattern wherever we go.
Before long the National Socialist Workers’ Party of Scotland will be unable to conceal the depth of its own financial ineptitude. It had based its pre-independence-referendum calculations on the assumption that oil would be $100 a barrel. Er, no.
And even then there’s a huge black hole in Scotland’s accounts. The totalitarian centralization of the police farce has halved the number of bobbies on the beat and crime is soaring. Every hilltop seems to have a forest of wretched windmills on it. Our great birds are being smashed out of the sky and will soon all be gone, but the urban mob don’t care. Kill everything to save the planet: that’s their motto. Well, it won’t do. People are beginning, just beginning, to notice how shoddy the totalitarians’ manifesto is, and how much shoddier their record in office.
The head bureaucrat of the EU would not even meet Ms Fish when she called a couple of weeks ago. The National Socialists have had their day, and Scotland is visibly the poorer for it.
It takes time to run down all the industries and the hope. What follows is excuses and the hunt for other people’s money. Greece is not such a bad analogy. The desperation phase lends itself to a carbon tax at multiple levels as another angle on resources. All of the income taxes, sales taxes, and VAT taxes got their start in bad times and the need for large blocks of new money. Each new tax started as a play on the wealthy or faceless corporations and not the middle class. Financial trading taxes and carbon taxes fit the bill for another few decades of power play. Taxing the internal combustion engine is too tempting for them on the carbon side.
There is a more fundamental problem. By definition, fossil fuel TRR is finite. It will deplete. And in Scotland, has. Save for untapped possible fracked shales using new US invented technology. Scotland’s choice to wither and die, or modernize.
Thank you sir. I am re-reading “That Hideous Strength” and find that Lewis really caught a glimmer of how bad things can get under the rule of the sciencey veneer over laying the statists of any sort.
How about a wind-powered distillery, producing an eco-friendly green windskey?
While I certainly will defer to Lord Monckton, Brits, Scots and others more familiar with Scotland than I, my son and I visited Scotland the last 10 days of June this year and had a wonderfully enjoyable and enriching time. We stayed in Edinburgh, Inverness, Fort William, Oban, and Glasgow, touring the cities and surrounding environs, and visited the Glengoyne, Deanston, Oban, and Auchentosan distilleries ( of course sampling numerous single-malts). The people, sometimes a bit reserved at first, were lovely and the landscape was breathtaking. Having only been to Scotland once before as part of a cruise around Great Britain, I cannot compare the current condition of Scotland to the past however, if what has been said about the decline of the country is true, I consider my son and I to be fortunate to have visited when we did and can only fervently hope that the decline of Scotland can be reversed by competent government, which unfortunately seems seriously lacking in North America, Europe, and elsewhere.
Did you visit a little town called Peebles near Edinburgh?
“Can the value of the Planck parameter vary? Yes, if insolation varies, and yes, if albedo varies.”
There is an overlay of muddle in this account. The Planck parameter is correctly described as the product of the emissivity, S-B constant, and a function of emission temperature. The insolation and albedo governing the incoming solar flux, which then, at equilibrium, balance the outgoing IR flux, to which the Planck argument is applied. They do in the end affect the emission temperature, but it is only through that quantity that they bear on the Planck sensitivity.
I have to again note the mislabelling of the equation with ΔT=… as the “official equation”. The original version quoted, and also used by Willis, had ΔTeq=… That does have a reasonable claim to be the official definition of equilibrium sensitivity, using equilibrium temperature. The vertion with ΔT=… is a Monckton morph, and has no claim to official status. And it makes no sense; if T is not equilibrium, there is no reason to expect the ratio of T to F to be a constant of any kind.
Mr Stokes continues to be confused. The pre-feedback warming occurs in picoseconds; the principal feedbacks occur in days to years; but ocean heat uptake somewhat delays the emergence of equilibrium warming.
A little elementary mathematics will perhaps assist Mr Stokes. If the system gain factor G is unity, as it is if feedbacks have not yet acted, or if they are net-zero (which is possible, given the thermostatic properties of the climate object), then pre-feedback and post-feedback sensitivity will be equal.
If they system gain factor has any value other than unity, then feedbacks will have acted to some extent, or perhaps completely. One can use the equation to simulate the evolution of the temperature response over time by selecting any appropriate value for G, from 1 when feedbacks have not acted to any appropriate higher (or lower) value thereafter.
The equation is no less the official equation for that.
“A little elementary mathematics will perhaps assist”
The maths is even more elementary. You want the coefficient terms on the right to be constant. They are just feedback factors; no time dependence is assumed. The equation is just
ΔT = K ΔF
where ΔF is the constant applied flux (eg instantaneous CO2 doubling). But if ΔT is time-varying, while oceans etc are warming in response, then K can’t be a constant. It would be time varying too. K only makes sense as a fixed number if you wait till the transient effects on T have settled – ie at equilibrium.
However Lord Monckton, how can you treat a heterogenous mix of gasses all at different energy levels as a “Surface”. The temperature of a fluid is defined by an average of its individual components. The real temperature of the gas being a (poisson?) distribution of individual molecular kinetic energies about a mean.
I would also like to point out that your feedback equations ignore time – that is wrong, this cannot be expressed correctly in a scalar equation, attempts to do this in electronics creates oscillators. In reality Ci is COMPLEX as the various feedbacks all have different transfer functions and in this case, unlike a carefully designed electronic circuit the various feedbacks are NOT independent or even linear (for example consider what happens over ocean as the temperature exceeds about 33 degrees), that means you CAN’T SUM THEM. It’s no wonder climate science had a lot of trouble forcing the models to be stable!
I would also ask for a comment.
Climate science also treats the logarithm as if it will continue forever never saturating (despite the limits of the atmosphere I might note – Anthropogenic CO2 does not add anything, it merely replaces O2 with CO2) and attribute this to the thickening of the spectral lines as CONCENTRATION INCREASES. But if bandwidth is considered to be due to the distribution of doppler shifts in a real gas leading to again a distribution of apparent frequencies about a mean depending on velocity and direction of travel WRT to the observer (satellite) then it is clear that emission bandwidth is not a product of gas CONCENTRATION but a product of gas TEMPERATURE, and the corollary of that is that as you depart from the mean emission frequency toward the tails, the IR must come from lower (warmer) parts of the atmosphere. This means the emission layer is not physical at all, it is a contrivance that needs to be tested, and the IR trapping effect WILL SATURATE. I believe this is a huge model mistake.
A very small challenge – a demonstration if you will
I would also ask that you do the following math, break up the feedbacks based on the literature (or physics) into two classes, negative and positive, apply the feedbacks separately (even with the inappropriate scalar model) negative feedbacks first then calculate the positive feedback loop gain required to move form the negative feedback applied state to the final IPCC proposed value (Gain of 3.3) come back and tell us the loop gain required to do that.
Bobl, you can teach yourself the answer to your question qualitatively, without any fancy math at all. One way is to read my essay Sensitive Uncertainty in ebook Blowing Smoke. Another way would be google. Your questions reflect true even qualitative ignorance of GHE and relevant issues. Why should Monckton provide you with remedial math education? Educate yourself. It is easy. And for you, qualitative suffices.
Ristvan,
I don’t need “remedial Math” or your rudeness. Nothing I have said is in fact provably wrong (Qualitatively or Quantitatively). Let’s put it this way, say I had a positive feedback in the climate but it had a 5.5 year delay, what would be the net result of that on the climate? Oops, the effect of the delay would be to destructively cancel the oscillation due to the 11 year sunspot cycle, turning a positive feedback into a negative one, so delay/phase DOES MATTER.
With regard to the heterogeneous gas mixture that is our atmosphere, what I have said is as I understand it correct, different frequencies toward the tail of the emission band come from different effective levels in the atmosphere, the question is – is it appropriate to average this to a single layer at a single height, I don’t think so.
I know the answer already to part 3 already, but Lord M does not. I want him to discover it and add it to his repertoire.
Now Lord Monckton has said that he stays with the official equation because it makes it easier to break cAGW than to propose a large change to it, but IMHO simply reordering the feedbacks and breaking them into two components is not a huge change, and when you do that you find that the loop gain required of the positive feedback component is impossibly high. The value of that positive feedback component loop gain gives an estimate for the peak gain in the characteristic. This is very close to the bode singularity which would cause temperature instability, In a climate where temperature is dead-set constant to 1 part in 300 such high loop gains are impossible.
“””””….. The temperature of a fluid is defined by an average of its individual components. The real temperature of the gas being a (poisson?) …..”””””
Actually it’s a Maxwell-Boltzmann distribution, but the difference does not radically alter the content of your post bobl. And supposably the mean KE is kT/2 per degree of freedom; k being Boltzmann’s Constant and T the thermodynamic Temperature.
Depending on the gas molecule, there will be at least three degrees of freedom (x,y,z) (Ar monoatomic) but maybe five for binary molecules like N2, O2, H2, for two rotations perpendicular to the dumbbell axis. I guess they presume that the moment of inertia about the dumbbell axis is negligibly small since the nucleus contains nearly all of the mass, and is a near point object. So unless it can spin on the dumbbell axis at some blithering speed, there’s no energy stored there.
G
What fraction of a day is T in equilibrium?
The “official equation” says that if you apply a constant flux F, that will yield a proportional change in temperature. To use it, you need to decide what that means. The temperature is a global average, and obviously must also be a time average. It is the temperature at which the applied flux is balancd by the outgoing, and there is no longer heat being absorbed in heating oceans etc.
That is the million dollar question. The Stefan-Boltzmann constant is an equilibrium constant. I’ve never heard of anyone trying to apply it under non-equilibrium conditions. A similar problem occurs in chemistry. Most of the major constants are for equilibria. The chemical engineers have devoted many volumes to how to apply that to non-equilibrium reactions with varying degrees of success that often turn out to be ‘effective’ parameters. Presumably climate scientists are doing the same thing. Making more assumptions without any explanations.
Nick
Equilibrium never has nor never will be reach so you can keep wishing.
In answer to Philohippous and to the mathematically challenged Stokes, if there are no feedbacks then the climate-sensitivity parameter is multiplied by the radiative forcing to yield the pre-feedback temperature change. If feedbacks have all fully acted, the equation gives final or equilibrium climate sensitivity. For all feedback values in between, the equation gives temperature change over any desired timescale. It really isn’t difficult.
” For all feedback values in between, the equation gives temperature change over any desired timescale.”
There seems to be some notion here that the feedbacks are applied in some time-sequential way. They aren’t; they apply from the beginning of the change. There is no timescale information in the “official equation” above. The feedbacks c_i listed just have numerical values, and with λ0, they combine arithmetically to give
ΔT = K ΔF
for some constant K (ECS). ΔF is the prescribed initial flux change, so there is no wriggle room there. The formula gives a unique ΔT. Nothing about desired timescale. Just one number, which is the equilibrium temperature. What else could it be, with no time scale?
Nick is making a great point, the scalar representation of the climate equation makes the assumption that all the feedbacks are scalar, and occur instantly ( That is they are non-causal ) such a construct in the real world is unrealisable (although you CAN do it in the imaginary environment of a computer). Climastrologists claim that the relevant feedback parameter is derived from the models ( that is the models estimate feedback rather than the feedback being a parameter of the model) and thus they claim that the feedback “Just is” because the models say so, however when you subject this to analysis the impossibly high loop gain for the positive feedback component suggests that the models are wildly wrong, in the real world feedbacks have non linear time delays and are often highly temperature dependent and non-linear. The idea that all those variable feedbacks would always sum to a dimensionless number (without time/temperature dependency is for all practical purposes) impossible, yet that is what they effectively claim.
C_i is actually a function of time, temperature, and humidity so the equation should be
λ0 ΔF ( 1-Σf(T,t,H)i )^-1
Excuse the missing subscript formatting (i) but hopefully you get what I mean
“Climastrologists claim that the relevant feedback parameter is derived from the models ( that is the models estimate feedback rather than the feedback being a parameter of the model) and thus they claim that the feedback “Just is” because the models say so”
Actually, climate scientists don’t talk about feedback nearly as much as folks at WUWT. And they don’t talk about the time of onset of feedbacks when talking about ECS, as in the “official equation”. The reason is simple; that concept is of diffrence between states. There is no information input about timing. The concept of equilibrium assumes that any transience in development of feedbacks will have been resolved in comparing the states.
Nick,
Exactly, but in a chaotic non linear open system like the climate, the path one takes to get from one state to the next is vitally important. It is wrong to calculate it this way, it’s exaclty akin to assuming you will have an amplifier of X Gain judging only fro the DC conditions of the amplifier. One might THINK one can predict the future state, but given the reactive elements (time delays) in the feedbacks along the way from state A to State B anything can happen.
This is an improper way to model a dynamic system.
Well one very seldom encounters a real equilibrium situation relating to earth climate or even things that closely approximate black body radiation behavior.
The Stefan-Boltzmann equation applies to a closed system where the BB object is in Thermal equilibrium with the radiation. This pre-supposes that the entire closed system is isothermal; everything at ONE Temperature greater than zero kelvin.
If the system is open, and radiation can escape from the BB with it remaining at the same fixed Temperature, then such an object must radiate a Planck black body spectrum fitting the Planck Radiation Law, and also the Stefan-Boltzmann total radiation appropriate to that Temperature.
A grey body with a less than 1.00 emissivity radiates a spectrum with the Planck spectrum as an upper bound (at all wavelengths.).
So the radiating black body, in the open system must be losing energy, so ther must be some other energy source that is maintaining the iso-thermal Temperature, so the system cannot be in thermal equilibrium.
Well the earth is anything but an iso-thermal system so its external radiation spectrum above TOA cannot be a black body spectrum, but it can be a conglomerate of separate regions each radiating a near BB spectrum appropriate to their own local Temperatures.
So using the measured far field external spectrum of the earth to calculate an effective radiating Temperature is simply a farce.
For a start, you have a high frequency solar spectrum due to earth albedo, which should have a roughly 6,000 K bb spectrum and an LWIR spectrum from each region of the earth that has a local Temperature determining that spectrum.
Various regions of the earth surface can have Temperatures from perhaps -95 deg. C up to perhaps +65 deg. C, which is 178 K to 338 K (+0.15).which is a ratio of 1.898, so T^4 ratio is 12.98.
Also at those extremes of the Temperature range, the BB spectral peak wavelength will shift from about 16.33 microns at the coldest spots, down to 8.60 microns for the hottest surfaces, compared to 10.1 microns for the 288 K global average Temperature.
So in addition to the hottest deserts radiating nearly twice the rate of the global average surface, their spectrum peaks at 8.60 microns which is well inside the atmospheric window, and even below the ozone absorption peak, while for the earth’s coldest regions the radiative emittance is less than one sixth of the global average, and it peaks at 16.33 microns which is longer that the center of the CO2 bend mode band, so CO2 blockage of surface LWIR is very efficient in the polar regions further slowing down their radiative cooling effect.
A very good experiment for anyone to perform; maybe at a4-H club outing, is to take a nice two inch magnifying glass, that you can demonstrate in use to focus the sun on a piece of paper until it ignites.
Then try the same experiment with a two stop neutral density photographic filter in front of the lens, which will cut the real TSI of 1362 W/m&2 down to the official Trenberth 342 w/m^2, and now use that to set the paper on fire.
Then you should try adding a 2 inch square 3mm thick Schott RG-695 dark red sharp cut filter which will remove virtually all of the visible spectrum, and leave the near IR of the soalr spectrum where water starts to absorb solar near IR. Now try to start the fire with the IR (some call it “heat” (noun)) from the solar spectrum at 342 w/m^2 ersatz TIR.
Edmunds Scientific can sell you all of those items for a few dollars. I already have a complete set of calibrated Schott Color glass filters, so I already have the stuff.
Then try and convince yourselves that IPCC and GCMs are real models of planet earth climate and can predict the future.
G
Nick, where do you think it is getting too hot for humans, wildlife and plants to live, today vs. 40 years ago?
The models have always said that most warming will occur at night, in winter, in higher latitudes. Which is to say, O2-aided global warming would be beneficial, as proposed by Arrhenius over a century ago, with respect to humans living in Scandinavia, at any rate.
During the MWP, Greenalnd hosted successful agriculture, and Yorkshire accommodated a wine industry. Not so much today.
Last year an overzealous artifact collector was prosecuted for removing a 1000-year-old Native American bow from the receding glacier line in California, which had been buried by ice earlier. But native bowhunters were not hunting prey roaming on the icepack, in all probability. Ergo, the edge of the icepack was higher 1000 years ago than up until our lifetime.
Nick, where do you live? Is it too hot. For the sake of your children and grandchildren, are you moving up to the Northwest Territories, or Nunivut or Alaska? If not, you are not translating your scientific-mathematical knowledge into practical decisions.
Thirty-four years ago, on an Air New Zealand flight to the U.S. in late April, I met a Canadian who was flying home after spending a 3 month sojourn in the Southern Hemisphere, exchanging a cold Northern Winter for a Southern Summer. Since then I’ve met dozens of “snowbirds” who strike out from Canada and northern-tier U.S. states to winter in Arizona and Florida, and return home to the north in spring, just like real birds.
When this phenomenon ends, I’ll believe that AGW is something real and necessary to stop.
Sorry, O2-aided
Sorry CO2-aided.
The bow was only introduced into California in the fairly recent past – not more than about 1,500 BP. The glacial ice the bow was found in is thus probably attributable to the Little Ice Age (Matthes advance in the Sierra). Unfortunately, the doc yanked the bow out of its context so there are problems understanding the significance of the find. I searched, but since the verdict was only reported this month as near as I can tell, it will be some time before we see anything more, IF we see anything at all.
I am so pleased that great minds are working hard on this wicked corruption on my behalf. The mathematics are beyond my understanding, but my years in business have taught me to know when I’m being sold a pup.
I wish I could offer more to the debate. Thanks to all at WUWT for improving my knowledge.
Albedo varies enough to cause the climate changes we have observed.
Wavy jet stream tracks which occur when the sun is less active produce more clouds than straighter jet stream tracks which occur when the sun is more active.
Clouds form best when air masses of different characteristics mix together and that happens along the jet stream tracks so the longer and wavier thay are the higher the global albedo and the less solar energy enters the ocreans.
Stephen I find myself in complete agreement with you in contrast to this article which is on the wrong path as far as trying to link climate sensitivity as a means test to determine if AGW theory has any validity. We know the answer to this question is no, therefore to keep looking at this issue is a waste of time.
What is the correct path to determine why the climate may change is what will influence the albedo of the earth to change enough to have a climate impact. I will send more on my next two post.
Can someone please give a 50-wods-or-less explanation of why Scotland wants to succeed from the UK? is it:
1. After 413 years, Scotland still hates the English?
2. Scotland thinks they will get more free goodies from Brussels than England?
3. EU has promised to outlaw cold, damp winters?
4. The smoldering 1776 revolutionary spirit has finally burst into flame?
5. Scotland is embarrassed to cash English welfare checks? Upon further review, I withdraw this as a possible reason…
6. Righteous anger that Scottish welfare checks have not grown as fast as the amount of money being earned in London?
7. Some/all of the above?
Scotland doesn’t want to secede as shown by the last referendum but some do wish to do so because they want power in a personal fiefdom. The previous price of oil and gas was a major temptation and some have not yet realised that an independent Scotland would soon become an impoverished northern outpost.
Other than that, all of the above.
Scotland did however vote to stay in the EU, which could set up another secession vote. If Germany can outbid England to buy Scottish votes, the UK could yet split up, with Scotland and its Ulster plantations divorcing Great Britain to shack up with continental Europe and Ireland in a menage a beaucoup.
Correction to Gabro
Scotland did not vote to stay in the EU. It voted for UK to stay in EU. There’s a big difference.
Andy,
Scotland voted for the UK to stay in the EU, but now that England and Wales disagreed with them, the SNP predictably wants a new referendum. Thus to the party leadership, anyway, and at least in one poll, the majority of Scots, do link the two votes.
If the UK wants out of the EU, then it appears Scots voters want out of the UK.
Gabro: “it appears Scots voters want out of the UK.”
Unfortunately for Wee Krankie and her extremely noisy Nationalsozialistische Schottische Arbeiterpartei, the EU have made it very clear that they have no interest in recruiting yet another state with a negative economy that will need substantial subsidies to survive, but both Spain and Belgium, both of which have secessionist movements themselves (the Catalans and Walloons) have announced that they will certainly veto any such attempt.
So she’s just blowing smoke out of her fundament.
Incidentally, I noticed this morning that Scotland’s income from North Sea Oil has fallen by 97% to a princely £60 million, and ScotzNatz’s infatuation for destroying the most beautiful scenery in the British Isles by infesting it with bird mincers and the concomitant pylons and substations has severely damaged the tourist industry has not helped their economy in the slightest.
So in fact the majority of Scots, who are a very sensible group of people and well aware of matters of economics, have no interest whatsoever in leaving the UK.
Scotland doesn’t want to secede from the UK. They had a referendum and voted to remain in the UK. The Scottish Nationalist Party’s dilemma is that they know that the outcome of another referendum would be the same. Which is a problem when your party’s fundamental policy is for another referendum. So they’re caught between despising “the English” for not granting such a referendum, while at the same time fervently hoping one is NOT granted.
Clear?
Another referendum might end with the same result, but the UK’s pro-Brexit vote could change that. London, Scotland and Northern Ireland want to stay. The rest of England and Wales want to go.
A very similar pattern to what we in Canada saw with Quebec! Call their bluff and the fire goes right out of them. If you want to go, GO!
Excellent!
“smoldering 1776”
I think you mean 1745.
The English kicked my family out of Scotland around 1670. I long since have forgiven them.
The Scottish people voted to stay part of Great Britain, despite the SNP leadership who are the ones who want it and will be the only winners.
Now, after Brexit the question is moot. The Scottish people will be truly barking if they vote to leave Great Britain (assuming another opportunity) as they will not be allowed to join the EU. This will require unanimous support from all existing members and Spain have already said no and will continue to say no or risk the loss of the Catalan region in a similar situation. Not likely in my opinion.
I cannot see a way for Brexit to take place leaving Scotland remaining in the EU.
SteveT
Here’s your 50 words or less: Scotland does not want to secede from the UK and recently voted not to do so, because Scots are canny enough to know that without the English subsidies their nation would again be as bankrupt as it was when Scotland petitioned to join the Union.
Much as I said one minute before you 🙂
Stephen,
You were first, but used 62 words by my quick count ;o)
The 55% who voted ‘No’ understood that an independent Scotland would be Greece without the sun or ECB support. It’s sad that 45% of a country that invented so much can no longer add up.
I can find no evidence for this. This appears to be nothing more than an opinion based on some patchy anecdotal evidence.
If albedo were to change by a small amount, the value of lambda-zero would have to change. So far, though, albedo has changed little, if at all. Until it does change, imagining that it may change, and imagining how much it may change, is speculation. For present purposes, therefore, albedo is held fixed, but the head posting fairly notes that if albedo changes then the value of the Planck parameter changes.
Mr Finn cannot have looked very hard. Instead of assuming there is no evidence without actually looking for it, he should emulate the late Professor Bob Carter, who, when I told him of the collapse and emigration the National Socialist Workers’ Party of Scotland was causing, picked up his cellphone and telephoned a friend in Aberdeen who employs 400 people. Was Monckton exaggerating, he asked. His friend said he could not speak for the rest of Scotland, but he himself and his 400 employees were getting out just as soon as they could.
Just try driving around almost any country town. The decline is visible, and heartbreaking.
Are you a Scotsman, or living there? Or is your comment based on “patchy anecdotal evidence”?
John Finn: “I can find no evidence for this. This appears to be nothing more than an opinion based on some patchy anecdotal evidence.”
Really.
Try this for starters.
Scotland’s North Sea oil revenues plunge 96pc in a year
http://www.telegraph.co.uk/business/2016/08/24/scotlands-north-sea-oil-revenues-plunge-96pc-in-a-year/
Look harder.
I suppose no one talks about the Irish tax model because they know it’s too late for that from a debt standpoint and it implies no capacity for power plays and goodies anyway. That kind of stalemate leaves only out-migration as the answer.
Monckton of Brenchley
August 22, 2016 at 2:04 pm; Not so in the Highlands and most of the land, just the self-bankrupted Lowland Merchant Lords (Darien etc.?) No end in sight even yet to the consequences.
ALBEDO IS THE GAME AS OPPOSED TO CO2 TRAPPING LONG WAVE HEAT RADIATION.
This is what is going to determine the future course of the climate.
The most important factors determining albedo are clouds, snow coverage, and sea ice coverage.
If these factors change albedo will change and hence the climate.
…an oft-neglected possibility, I agree.
Thank you Salvatore.
THIS IS THE PATH OF STUDY TO DETERMINE CLIMATE CHANGE.
PROVE ME WRONG.
The climate in the big picture is controlled by Milankovitch Cycles, Land Ocean arrangements, with Solar Activity and the Geo Magnetic Field Strength of the earth superimposed upon this.
These factors then exert influences on the terrestrial items on the earth that determine the climate.
Terrestrial Items
Atmospheric Circulation
Sea Surface Temperatures
Global Cloud Coverage
Global Snow Coverage
Global Sea Ice Coverage
Enso
Volcanic Activity
All of this gives an x climate over x time. The historical climatic record supports this.
That is WHAT likely makes the climate change, NOT the scam they promote which is AGW.
The historical climatic record showing this period of time in the climate is in no way unique while changes in CO2 concentrations having no correlation in leading to resultant climate changes.
Now how the cooling evolves will have to be monitored. Of course going from an El Nino condition to an La Nina condition is going to cause an initial cooling.
For clues that if solar is involved the depth of the cooling will have to be monitored and if the cooling is accompanied by the terrestrial items I have mentioned above.
Each one of those terrestrial items having been shown to be linked to Milankovitch Cycles Land Ocean Arrangements in the big slow moving picture while solar and geo magnetic variability being factors that can change these terrestrial items on a much smaller time scale.
The solar parameters needed are
Solar Wind sub 350 km/sec.
AP index 5 or lower
EUV LIGHT 100 units or less
COSMIC RAY COUNTS – 6500 or greater
SOLAR IRRADIANCE – off by .15% or greater.
SOLAR FLUX SUB 90
All very attainable going forward and being compounded by a weakening geo magnetic which if attained with sufficient duration of time will translate into bringing the terrestrial items that control our climate to values which will cause the climate to cool gradually if not in a sharp drop off if certain thresholds should be meant.
The path of study to determine climate change:
Extraterrestrials are in control of it.
Prove me wrong.
Dr. Spencer you said you agreed in the earlier post. I say what I say because I believe right or wrong that the GHG effect is a result of the climate more then being the cause of it.
That is what the historical climatic data shows as far as I can see.
Dr. S., you don’t really believe that, do you? (☺)
Dr. Spenser –
they say they aren’t.
Why would they lie?
nope its unicorns
or maybe factor X from the sun
no wait its natural variability
@ Roy Spencer
August 22, 2016 at 2:32 pm: Maxwell used the above-mentioned Poisson when he pre-proved you wrong, no need of ET. However, if he does wish to phone back…..
Roy Spencer,
can you tell us more about your theory on the role of Extraterrestrials in global warming.
It sounds very interesting.
Thank you
Extra-Terrestrials are prohibited from controlling ALL of earth’s climate at the same time.
They get control of it some places some times, and something pops out of whack some place else.
I think it must be Heisenberg that controls the climate. Well that seems as likely as any other cause I have heard of.
And I’ll believe that until proven false.
G
All the terrestrial items I mentioned in the above having an albedo impact and or the balance of radiation reaching and leaving the earth.
And all superseded in capacity and effect by the slow, slow turnover of deep ocean waters. Hundreds of times the heat capacity of the atmosphere and unveiling themselves on hundred or thousand year time scales. The surface temperature anomalies we exorcise ourselves over are equivalent to the two and three foot waves on the surface of the ocean. We are the ants in this system.
It is unwise for Mr del Prete to say that the only thing that matters is changing albedo, when there is not much evidence for a significant enough change in albedo to make a difference to climate sensitivity.
Besides, the topic of the head posting is how lambda-zero is – like it or not – determined. It is determined as I say it is, and not as my good friend Willis Eschenbach says it is.
Thinking of Earth as if it would be a black/gray body is wrong. That mythical surface does not exist, not that mythical surface temperature. Neither the emission spectrum of a black/gray body. Ex falso, quodlibet.
Are you saying the Earth does not have an infrared emissivity in the 0.9-1.0 range? What is that observation based upon?…because the IR emissivity of many materials, natural and manmade, have been measured with laboratory instruments and are widely available.
I’m saying what I’m saying. Earth is not a black body. No thermal equilibrium. Neither is a gray body. The emission spectrum is very far from a spectrum corresponding to such an idealized body. Ex falso, quodlibet.
blackbody is not required for thermal equilibrium. And gray body usually just means emitting at less than unit emissivity. Most terrestrial surfaces emit somewhere between 0.9 and 0.95 emissivity or so. If the assumed emissivity is off by a few percent it makes essentially no difference to discussions of climate sensitivity, or other climate change issues. I don’t know why people bring it up.
“blackbody is not required for thermal equilibrium” I did not say that. It’s a little bit the other way around 🙂 And gray body means much more than that. It means like a black body, with the relaxed emissivity thingy. Not fulfilled for Earth. It has various emissivity values in various places, which more, vary in time… and more, depend on frequency and so on. It’s very far from the picture of a black/gray body. Easily observable from the actual emission spectrum of Earth, too, so the black/gray body assumption is empirically falsified. Climastrology is plagued by averaging intensive quantities and it’s very easily provable that using the averages lead to incorrect physical results, except very few simple (and not fulfilled by Earth) coincidences. The albedo was also mentioned in the above post, an albedo given by clouds… just try a computation with half a planet with albedo 1 and half 0, that is, the average of 0.5 for albedo. Do first with 0.5 average over the whole surface, then consider 1 on the night side and 0 for the day side. Then turn around and consider 1 for the day side and 0 for the night side. Have a surprise. If you get the same result for all cases, you did something very wrong.
And the spectral emissivity need only be roughly constant over that range of the LWIR spectrum that is significant in total spectrum radiative power; AT THAT EMISSION TEMPERATURE.
That means the 98% that lies between one half the spectral peak wavelength and eight times the spectral peak wavelength of the Planck formula spectral radiant emittance.
Maybe we should use the 97% of total power as that seems to be the only accepted value for credibility.
G
PS for the earth the range of interest would be about 5.0 microns to 80.0 microns at 288 K Temperature.
We know black bodies cannot exist. But some pretty damn close approximations do exist.
Earth is not one of those ‘close approximations’.
“””””…..
Adrian Roman
August 24, 2016 at 1:12 pm
Earth is not one of those ‘close approximations’. …..”””””
Never said it was. But I can pick up an (online) catalog and buy a Copper Freeze (ersatz) Black Body source, which will track Planck as close as anyone on this planet can measure.
G
NO real Physical material can absorb 100.000….% of even one single wavelength of electromagnetic radiation, or band of wavelengths, let alone do it for all EM radiation from zero frequency up to zero wavelength. BB is a complete fiction, yet one of the crown jewels of modern Physics.
I hope you know what ignoratio elenchi means.
“””””…..
Adrian Roman
August 25, 2016 at 1:12 pm
I hope you know what ignoratio elenchi means. ……”””””
I hope you know what Tena koe means.
g
Not the first emigration from Scotland. My ancestors include McBride, McDonald and McBain. That seems to be where I get my engineering instincts to the extent such things might be in DNA or culture.
My father left Scotland in 1921, at the age of 17, virtually forced out by lack of education – his one year of secondary schooling the limit his widowed mother could afford – and subsequent lack of opportunity. As he had an uncle who was farming in New Zealand, that’s where he was sent.
Over the next two decades he worked as a farmhand and a builder’s labourer, accumulating along the way enough kit and expertise to call himself a carpenter. Manpowered to Auckland in the 1940s to work on the naval base being readied for the Yanks, he settled there when hostilities ended and prospered, through hard work and intelligence, in the post-war house-building boom.
Some time in the 1960s or ’70s, maybe later, as we were sharing a dram or two, he told me of his one shot at decent employment when he was a young fella. Good at mathematics and above-average at technical drawing, he’d heard of an opening with a firm of architects in Largs, about fifteen miles from his village of West Kilbride. Scrubbed and polished and wearing his best suit, he’d set off for an interview on a borrowed bicycle, giving himself what he thought was plenty of time for the journey. Unfortunately, the bike was little better than a wreck and had the unpleasant habit of shedding its chain at regular intervals. The upshot was that he arrived late in Largs, his hands, face and clothes smeared with grease and in no fit state to present his case.
As he was telling this tale of woe, the old man’s emotions, kicked along by Johnnie Walker, came into play. The lost opportunity, being forced from his homeland, a life that he may have led – all this and more I could see swirling around in his mind. It was sad to behold.
Or it would have been except that dawning on me was the realisation that my existence had depended on that shaky bike and its failing chain. And even if he had managed to sire me wherever he’d ended up, there was on the one hand Scotland and on the other New Zealand. Scotland or New Zealand? New Zealand or Scotland? Is that even a valid question? Might as well ask, Morris Minor or Ferrari? Gabardine raincoat or Armani suit? Uncluttered, sun-drenched, sandy beaches or the Firth of Clyde? Rugby or soccer?
As my father descended into melancholy, I was figuring out if it was possible to find the bike lender and organise a case of Glenlivet to be delivered instantly with an annual top-up in perpetuity.
To my credit, though, I did have the good grace to pat the old guy on the shoulder and tell him, “Tough break, Dad.”
Scotland does have the advantage however of being in the Northern Hemisphere, along with 90% of humanity.
Hmm. Maybe “advantage” is the wrong word.
Whither Willis? I’m in awe of his mathematical expertise. Now, let’s see if we are in awe of his character. Let’s give Willis a few days. Let him work through things. He may (or may not) reach the same conclusion, given this exposition. I don’t think there is anything “attacking” or out of place in the Brenchly response. A good point by point either defense of Willis position, or “modification” and change to agreement with the good Lord’s work. (Little joke there.) Will tell the tale. In either case I expect neither gentleman to make like a MANN, but both of the gentlemen to be REAL MEN!
HerrMann of Pennsylvania is not as Mathematically adept as either Willis or Lord Monckton of Brenchley, and as such, I expect if HerrMann is still teaching classes at the State Penn, then he will plagiarize the above article for his lectures. But since HerrMann is rather bad at “ciphering,” he is not likely to to actually try to explain how Plank’s variable is used in this model.
Guys, guys, will you please ease-off knocking Scotland.
We really DON’T hate the English (Javert Chip). Anybody who says this is allowing themselves to be influenced by the nosiest, empty vessels.
Scotland was asked to leave the UK in 2014 and the result was to stay in the UK. Scots voted differently from England in the Brexit vote, but why not leave it to the SNP to kid themselves that this is some kind of a mandate for a re-run of the independence referendum.
Twice now, Scots have voted for the status quo. If the SNP fool themselves into holding another referendum, it will not be unwelcome: referendum-weary Scots will vote again for the status quo, and likely with a bigger margin.
Monckton, there are many cottages in Scotland serving the hillwalking community. I venture you arrived at the cottage with different expectations to the usual occupants. Hillwalkers are likely to be groups who are happy to bed-down in sleeping bags under anything with a roof and an open fire. A group will share costs, and this probably holds up the hire costs, especially at the height of the tourist season.
You paid the going rate – that’s just the market. I wouldn’t have expected you to complain about the operation of the market.
If you want cheap and clean, go for a chain like Premier Inn. They are everywhere these days.
Perth has suffered from the internet shopping revolution, just like most provincial towns who don’t have the size to support a nice summertime shopping experience. Sadly, you’ll need to stick to the urban centres of Edinburgh or Glasgow if you want plenty of choice of shops.
That said, there are some really great rural shopping experiences to be had in Scotland, if you know where to look. There is very posh country-style shopping at House Of Bruar, nestled in beautiful Blair Atholl. But beware, posh country shopping is for the well off, so don’t go there if you are likely to come away girning about prices.
If your still in Scotland this weekend, why not go to the Blair Horse Trials for a great experience. But it’s posh, so be sure to bring your wallet and put your wife in charge of the spending.
Correction: “not be unwelcome” = “not be welcome”
Polls differ as to the effect of the Brexit vote on current Scottish independence support:
http://www.telegraph.co.uk/news/2016/06/26/scottish-independence-has-nearly-60-per-cent-support-poll-finds/
http://www.theguardian.com/politics/2016/jul/30/no-real-shift-towards-scottish-independence-since-brexit-vote-poll
Whether Scots would vote as they tell pollsters they will is another matter.
Just as long as the Scottish National Socialist Workers’ Party doesn’t nationalize the whisky industry.
and “you’re still”…
Thank you Lord M (rap street name). A great understandable explanation.
This whole climate thing is fascinating from the math to the physics. You, Willis, Bob Tisdale, Tim Ball, Eric Worrell, Anthony and many others write great essays with great explanations.
Here, Here!
Agree, thank you Lord Monckton.
You mean “Hear, hear”?
Geoff
A fascinating discussion. I am particularly impressed that Mr. Monckton does not simply does not simply drop an article and leave but stays and engages with readers. I often learn as much from the discussion is from the original article.
I’m also interested to see some exchanges which on the surface appear to be strong disagreements but turn out to be only modest differences. Stephen Rasey is concerned about the value of the albedo parameter. I am as well. I think Mr. Monckton initially dismissed the concern for good reason — the point of the essay is to note that the calculation of the Planck parameter should not be done at the Earth’s surface but at the Planck emission surface. That important point does not turn on whether the albedo is .3 or .25 or .35. Of course, the specific value of the parameter will be a function of the albedo, but the core point that one must do the calculation at the emission surface is not changed. I’m happy to see that Mr. Monckton did return to this point; namely that a good value of the albedo would be useful to have.
However, once that point is settled, we can move on and address two other points raised by Mr. Rasey. The first point is that it is troubling to calculate values of parameters to several decimal places when one of the key inputs is known to roughly one place after the decimal point. I’m sure someone must have studied this in some detail but my very cursory review produce a troubling large range of values. I am not at all troubled that the albedo of the earth varies from spot to spot and may even be different this week than last week. As long as there is no secular trend (hold on to address the second point in a moment) it can vary in time and place without causing damage to the formulas. It still would be nice to have a more precise value.
The second important point is that if modestly increasing temperature of the earth translates into changing cloud cover, and cloud cover is the major determinant of albedo, one must do some studies to find out whether there is a secular trend. This turns out not to be trivial (assuming one can project the change in aggregate clouds) as the albedo of clouds is a function of the type of cloud so it may matter, not just what happens to the aggregate amount of clouds but the type of clouds created. I know there are some studies looking at cloud creation but at the moment I don’t recall whether they identified the change in albedo from the change in clouds.
Phil if you look at my earlier post I show how a secular trend in albedo could come about with solar changes as the back drop for this.
In answer to the other Phil, the rule I follow for precision is that the precision of the final desired quantity – in the present instance, equilibrium sensitivity – should be presented as equivalent to the precision of the least-precise term that was used in the process of determining it. For this reason, equilibrium sensitivity is usually expressed to the nearest tenth of a degree.
More than “nice”. It is fundamental that your result is only as accurate as the least significant factor.
I went to Scotland once.
Lord Monckton can take longer than even Willis in getting to the point, and I’m burnt out be the time he has.
Is burn out proof of warming?
squirts ink a monktopus does
[yet that ink doth not become an obscuring cloud, but reveals instead a clarity and a purpose. .mod]
Nice discussion.
Thank you Lord Monckton. Very educational as always. I have two handwritten pages of notes from your post and I will will refer to them often. I very much appreciate your careful explanation of the equation. Well done!
It’s a pleasure to describe these concepts from time to time in some detail so that as many people as possible can understand the actually rather insubstantial basis on which climate sensitivity is determined. Though the value of the Planck parameter as determined or used by the models is correct, there is a lot else that is wrong with the way climate sensitivity is determined, which is the chief reason why the world continues to warm at a rate far slower than the models had predicted.
The luminous sphere that is the surface of the sun radiates 6.320E7 W/m^2 perpendicular to the surface in all directions per S-B, luminosity, surface temperature, geometry.
When that sphere expands to the orbital radius of earth (or other planet) because of the increased spherical surface over which the initial luminosity is spread, the power flux decreases to 1,368 W/m^2 radiating perpendicular to the sun’s luminous surface in all directions.
At the earth’s orbital distance the arc of the luminous sphere that intersects the earth is essentially a flat plane so the radiating 1,368 W/m^2 strikes the earth perpendicular to its cross sectional area.
If that same energy were spread evenly in a perpendicular fashion over the entire spherical top of earth’s atmosphere (100 km per NASA) it would be 1,368/4 or 342 W/m^2. (1,360/4 = 340) (The area of a sphere of radius r is 4 times the area of a disc of radius r.)
At apehelion, farther, the values become 1,323 & 331 W/m^2. At perihelion, closer, the values become 1,415 & 351 W/m^2. In other words, because of the eccentricity of the orbit TSI fluctuates +/- 45 W/m^2, a total 90 W/m^2 swing. Compare that to CO2’s 2 W/m^2 RF or RCP’s 8.5 W/m^2.
These popular graphics (Trenberth et al 2011jcli24) are NOT true heat or energy balances. A watt is a power unit, energy over time, i.e. 3.412 Btu/eng h or 3.6 kJ/SI h. These graphics do NOT consider night or day or seasons or tropospheric thickness, they are simple models (yep.) attempting to illustrate where and how the power enters and leaves/balances which NASA defines as the ToA of 100 km.
This is neither wrong nor right, but people have to understand what and how these graphics work.
So 342 enters ToA, 100 is reflected straight away by the albedo, 242 proceed to be absorbed by BOTH the atmosphere and the surface, 80 by the atmosphere, 160 by the surface. The surface upwells as follows: 17 by convection, 80 by evapotranspiration, 63 by LWIR. The surface and atmospheric power fluxes rejoin at the surface of the troposphere, 9 to 17 km.
A surface at 15 C, 288 K, radiating 390 W/m^2 is incorrect. This assumes that 100% of the ISR is remitted only by radiation and at the surface and essentially double counts the power flux the way a bookkeeper incorrectly enters a number twice. When conduction and convection are possible, S-B BB does not work.
S-B applies only to the power flux NOT moved by conduction and convection and handled by LWIR. The surface of the sun and earth ToA face a vacuum w/ no convection or conduction so S-B works.
BTW if you search “debunking greenhouse theory” there will be several sites that share my views although I think I do better job of clearly explaining it.
Nicholas,
You say: A surface at 15 C, 288 K, radiating 390 W/m^2 is incorrect. This assumes that 100% of the ISR is remitted only by radiation and at the surface and essentially double counts the power flux the way a bookkeeper incorrectly enters a number twice.
…and: BTW if you search “debunking greenhouse theory” there will be several sites that share my views although I think I do better job of clearly explaining it.
I am afraid you are misguided on both counts.
(1) A surface at 15C, 288K does indeed assert an upward radiative energy potential of around 396W/m^2 (Trenberth et. a. 2009) but not a flow. This is because it is offset by the atmosphere which asserts a downward radiative energy potential of around 333W/m^2. The net upward radiative energy flow from the earth’s surface is the difference between the two, namely a mere 63W/m^2.
The remaining upward energy flows are indeed thermals (17W/m^2) and evapo-transpiration (80W/m^2), making a total upward transfer from the earth’s surface of 161W/m^2, almost exactly in balance with Trenberth’s figure for the Sun’s incoming radiative energy flow absorbed by the earth’s surface.
You have fallen into the same misconception as all the “debunking greenhouse theory” sites that you suggest our readers should study.
Cosserat, you say:
And this is exactly why the DEGREE of IR activity in a massive atmosphere doesn’t matter to the surface mean temp. Once the atmosphere is radiatively active, that means atmospheric circulation will become and stay operative, and at that point, making the atmosphere *more* radiatively active won’t matter to the T_s.
Why? Because there’s a general HEAT balance between in and out at the surface, NOT a general radiative balance between in and out. Yes, IR-absorbing atmospheric constituents do indeed reduce the radiative heat loss of the surface at some given mean temp. But this doesn’t mean they reduce the TOTAL heat loss of the surface. The radiative heat loss, as long as the atmosphere is radiatively active, is a matter of the temperature DIFFERENCE between the surface and the relevant air layers above, not of the absolute temperature of the surface alone. It wouldn’t be a problem for the surface radiative heat loss per se to remain at 52-53 W/m^2 on average (Stephens et al., 2012) even at a mean temp of, say, 100K rather than 289K. As long as the atmosphere above were accordingly colder. However, convection/evaporation wouldn’t work very well at 100K. With an average solar input to the surface of ~165 W/m^2 and an average radiative output from the surface of ~53 W/m^2, that leaves 112 W/m^2 to be shed by non-radiative heat transfer mechanisms before we can reach a surface heat balance. In order to get there, the surface would have to become seriously warmer on average. But, as you’ll notice, not because of a reduced radiative heat loss. It is, after all, held at 52-53 W/m^2. It’s rather because of the way too low initial mean sfc temp.
We see this principle in action very well in the real world, only somewhat inverted, when comparing dry tropical regions and wet tropical regions. For instance, if we pick the Sahara-Sahel region (20-14N, 15W-36E, semi-arid) and the Congo region (5N-6S, 10-27E, very humid) in tropical Africa, we see a couple of very interesting things.
First, the two regions in question absorb – at the surface – basically the same amount of solar heat over the course of one year, on average ~175 W/m^2 (CERES EBAF). And since we know that the annual temperature in both areas is pretty much constant over time, we can safely assume that the surface is in a relative steady state both places, that is, as much heat goes OUT as what comes IN during a full year.
However, the tropospheric column lying on top of the solar-heated Sahara-Sahel surface, contains A LOT less water than the similar column over the Congo. Both in the form of water vapour and of clouds. (The CO2 content can be assumed to be the same in both columns.) What does this entail? Well, there should be A LOT more atmospheric “back radiation” to the surface in the Congo than in Sahara-Sahel. Even relative to air temperature.
According to CERES EBAF, this is also the case. In the Sahara-Sahel region, the mean DWLWIR ‘flux’ to the surface is ~375 W/m^2. In the Congo it’s at least 405 W/m^2. That’s 30 W/m^2 extra. So, the same average input from the Sun in both regions, ~175 W/m^2, but 30 W/m^2 more back down from the atmosphere in the Congo. So total radiative input to the surface in the Sahara-Sahel: [175+375=] 550 W/m^2, and in the Congo: [175+405=] 580 W/m^2.
So where’s the hotter surface? Well, like we said, both areas is in a dynamic heat balance, so the average annual heat input AND heat output are both 175 W/m^2 in Sahara-Sahel as well as in the Congo.
Then, what’s the surface radiative heat loss (‘net LW’) in the Sahara-Sahel region? 95-100 W/m^2. In the Congo? 50-55 W/m^2. That’s a 45 W/m^2 difference. What does this tell us? It tells us several things:
1) The much higher degree of tropospheric IR activity over the Congo (from much more H2O) reduces the radiative heat loss from the solar-heated surface by A LOT.
2) However, this doesn’t reduce the TOTAL surface heat loss. It simply means that more of the total heat loss needs to derive from NON-radiative mechanisms in the Congo.
So, to the clincher: Does this fact, that the highly IR active atmosphere on top of the solar-heated surface in the Congo reduces its radiative heat loss so much more than in the (equally solar-heated) Sahara-Sahel, where the atmosphere is much less IR active, thus forcing the surface to rid itself of much more of its total heat via OTHER mechanisms, cause the average T_s in the Congo to become significantly higher at equilibrium than in the Sahara-Sahel?
No. Not at all. Because 3) The numbers above also tell us that the Sahara-Sahel surface is in fact hotter on average than the Congo surface. By several degrees.
Isn’t that funny? Equal solar heating. Much more effective radiative cooling. And still a higher T_avg.
Where’s the progressive “radiative GHE” to be found in all this? The real-world evidence that if we merely have more IR active constituents in an atmospheric column, then the surface underneath will have to be warmer on average, pretty much by physical necessity …
https://ceres-tool.larc.nasa.gov/ord-tool/jsp/EBAFSFCSelection.jsp
The 333 downwelling downwells from an area that is -40 C +/- or so and T^4 means S-B is quite small, nowhere near 333 plus the emissivity of the atmospheric gases is low (Nasif et al) because density is low. The 390 upwelling and 333 downwelling are imaginary handwavium.
Kristian, you are mystified by the fact that as you put it:
“””””….. Isn’t that funny? Equal solar heating. Much more effective radiative cooling. And still a higher T_avg. …..”””””
The reason for the much more effective radiative cooling is NOT a consequence of the higher T avg, it is because of the very much higher T peak during the hottest hours of the mid day sun, which can get up to almost double the average total radiant emittance of the earth.
It is the HOT tropics that cool the earth; NOT the frozen Polar Regions, which can be as low as one sixth of the cooling rate of the average.
G
Smith, you say:
I’m not “mystified” at all. I’m just pointing out how this result directly contradicts an ultimately radiative (“GHE”) explanation of the T_avg.
Nobody ever said it was. Read what I write, Smith.
No, it isn’t. That approach only works on celestial bodies without any atmosphere at all, like the Moon.
The reason why the radiative part of the surface cooling budget in the Sahara-Sahel region (but NOT the total) is so much larger (so much more ‘effective’) than in the Congo, is simply – as I explained – because the air column on top of the solar-heated surface contains A LOT less water (WV, clouds), that is, the overall IR-absorbing abilities of the air layers above the surface is MUCH weaker.
But does this fact, that the radiant heat loss (the radiative cooling) of the surface is so much more intense thereby make the surface T_avg lower in the Sahara-Sahel than in the Congo? (Remember, both regions have about the same average solar input at the surface, so no difference in overall heating.) No, evidently it doesn’t. Quite the contrary.
Already addressed here:
https://wattsupwiththat.com/2016/08/20/putting-it-on-the-line/#comment-2282526
Part 2
340 W/m^2 ISR arrive at the ToA (100 km per NASA), 100 W/m^2 are reflected straight away leaving 240 W/m^2 continuing on to be absorbed by the atmosphere (80 W/m^2) and surface (160 W/m^2). In order to maintain the existing thermal equilibrium and atmospheric temperature (not really required) 240 W/m^2 must leave the ToA. Leaving the surface at 1.5 m (IPCC Glossary) are: thermals, 17 W/m^2; evapotranspiration, 80 W/m^2; LWIR, 63 W/m^2 sub-totaling 160 W/m^2 plus the atmosphere’s 80 W/m^2 making a grand total of 240 W/m^2 OLR at ToA.
When more energy leaves ToA than enters it, the atmosphere will cool down. When less energy leaves the ToA than enters it, the atmosphere will heat up. The GHE theory postulates that GHGs impede/trap/store the flow of heat reducing the amount leaving the ToA and as a consequence the atmosphere will heat up. Actually if the energy moving through to the ToA goes down, say from 240 to 238 W/m^2, the atmosphere will cool per Q/A = U * dT. The same condition could also be due to increased albedo decreasing heat to the atmosphere & surface or ocean absorbing energy.
The S-B ideal BB temperature corresponding to ToA 240 W/m^2 OLR is 255 K or -18 C. This ToA “surface” value is compared to a surface “surface” at 1.5 m temperature of 288 K, 15 C, 390 W/m^2. The 33 C higher 1.5 m temperature is allegedly attributed to/explained by the GHE theory.
BTW the S-B ideal BB radiation equation applies only in a vacuum. For an object to radiate 100% of its energy per S-B there can be no conduction or convection, i.e. no molecules or a vacuum. The upwelling calculation of 15 C, 288 K, 390 W/m^2 only applies/works in vacuum.
Comparing ToA values to 1.5 m values is an incorrect comparison.
The S-B BB ToA “surface” temperature of 255 K should be compared to the ToA observed “surface” temperature of 193 K, -80 C, not the 1.5 m above land “surface” temperature of 288 K, 15 C. The – 62 C difference is explained by the earth’s effective emissivity. The ratio of the ToA observed “surface” temperature (^4) at 100 km to the S-B BB temperature (^4) equals an emissivity of .328. Emissivity is not the same as albedo.
Because the +33 C comparison between ToA “surface” 255 K and 1.5 m “surface” 288 K is invalid the perceived need for a GHE theory/explanation results in an invalid non-solution to a non-problem.
References:
ACS Climate Change Toolkit
Trenberth et. al. 2011 “Atmospheric Moisture Transports …….” Figure 10, IPCC AR5 Annex III
http://earthobservatory.nasa.gov/IOTD/view.php?id=7373
http://principia-scientific.org/the-stefan-boltzmann-law-at-a-non-vacuum-interface-misuse-by-global-warming-alarmists/
Nicholas,
You are doing the handwavium. And you are monstrously over-complicating your argument with your second submission, which I shall not address. Re. your first submission…
(1) The upward radiative potential from the earth’s surface MUST be 396W/m^2. This value conforms via the S-B law to its empirically determined mean surface temperature of 15C (288K).
(2) The downward radiative potential from the atmosphere is formed from the aggregation of ALL the radiative potentials of ALL the radiative gases at ALL levels and temperatures, each asserting their individual radiative potentials according to the S-B law.
(3) We know that the aggregate value of the downward radiative potential MUST be around 333W/m^2 because this corresponds to an upward radiative energy flow of 396-333=63W/m^2. And this is exactly the amount needed, along with the other two non-radiative upward energy flows (thermals 17W/m^2 and evapo-transpiration 80W/m^2) to balance the Sun’s incoming radiative energy flow of 160W/m^2 that we know is absorbed by the earth’s surface.
No hand waving.
No complexity.
No mystery.
Just the standard rules of radiation physics.
Yes, Cosserat. I have no problem with this. I also refer to the “UWLWIR” and “DWLWIR fluxes” as radiative potentials. Because that’s what they are. Mathematical radiative expressions of temperature/emissivity. Only in themselves realisable when faced directly with surroundings at or close to absolute zero. As already Stefan himself pointed out when working out the ^4 temp-emission relationship back in the 19th century. The actual, detectable bulk (macroscopic) movement of radiative energy is ONLY upwards, from the warmer surface to the cooler atmosphere AND the much colder space outside.
The problem I have with all this is only when people start claiming that the “DWLWIR flux” is not just a radiative temperature potential, but rather a separate, thermodynamically independent flux of energy from a cool atmosphere to a warm surface that helps cause (that is, raise) the surface temperature, right alongside the solar flux. As if the two were thermodynamically equal … AS IF they were both equivalent HEAT FLUXES to the surface. When only the solar flux is.
Kristian,
How are you, my old sparring partner?!
Your comment above is good news indeed. The distinction between a radiative potential and a radiative flow is quite lost on most climate-skeptical blog commentators. (And, of course, climate alarmists are lost in their own world and wouldn’t know one end of a radiative potential from the other…)
In several years of making this point (and its logical consequences) I have never before received such a clear positive response. Thank you.
I think I can throw some light on why the concept of downwelling or back radiation is so prevalent. In the sphere of modern academic physics, statistical thermodynamics reigns supreme (as it should). All bodies with temperatures in excess of 0K emit photons. Thus in the Trenberth diagram, the 333W/m^2 downward radiation figure and the 396W/m^2 upward radiation figure represent photon streams. This is OK providing that it is clearly understood that the opposing streams offset one another. We can accept this ‘photonic’ interpretation with equanimity because, with such a rule in place, the net transfer of energy is always from the hotter to the cooler body. And if the photon streams in both directions are exactly equal, both bodies are equally hot and there is no net transfer of energy – which accords with common sense.
Christopher,
…
“How said it is to see the Scotland we left just five years ago in such rampant….”
…
Should be:
…
“How sad it is to see the Scotland we left just five years ago in such rampant….”
Yes, I noticed that, but…
☺
of crosue said and sad are two diffirnet wrods
phenomenal?
what??? it was 10 letters!
bnigo
@EJ “bnigo”
good one 🙂 Fooled me.
clipe —
Great post and quite interesting.
But some of the ease of understanding comes from the rules of grammar being followed and the “logic of the sense” being conveyed. Spelling is not our only clue to meaning.
And what about this word? — atinsidtabseshiltemnraainsim — which should be an easy one if you are old enough to have watched the Sixty Four Thousand Dollar Question many years ago. The shear length of the word gives it away.
Being inexperienced readers, I have no doubt that children would find your post much harder to read.
Eugene WR Gallun
@Eugene, Yes, EJ’s “bnigo” found me out…agewise.
Rleftt
Take clipes whole paragraph, exclude ‘The Power of the Human Mind’. ( because it is so obvious or should be?)
See if they can read it.
tells you a lot about someone.
I once did this with a paragraph and it was amazing that the person was so confused and couldn’t understand one sentence, let alone just a few words.
spuerclalafrgialeisitcepxealladsohsih
EJ — Sweet Mary, there you go popin’ off. –Eugene WR Gallun
Eugene,
“Sheer” not “shear” please.
You lose cred with bad spelling in wordsmith comments.
Geoff
Then again, Beau, “said” may have been an attempt at Scottish vernacular and is actually a misspelling of “saird” – as in “it’s a verra, verra saird time”.
saird?
http://www.dsl.ac.uk/entry/dost/savourit
Bit of poetic licence, clipe. And you have to vigorously roll your rrrrs.
As Marilyn Monroe did in Some Like It Hot.
aoubt the paomnnehal pweor of the hmuan mnidThis isn’t really a direct reply to what you or Willis have said.
More of a comment on WUWT and its posters and commentators.
WUWT is a forum where people can speak and (most of the) others will listen and consider.
(I think that type of attitude has something to with “science” and “freedom” but sometimes it’s hard to tell these days.)
so the cooling is about to begin.
As to the question of proper use of the “feedback” nomenclature, it helps to recognize that to a great extent it’s more a matter of viewpoint rather than of substance.
That Gerard Roe, whom Lord Monckton is wont to cite, may have had a vague sense of this fact may be inferred from his section entitled “The Importance of the Reference System” between his Equations 16 and 17.
While I think that Mr. Eschenbach’s position on feedback nomenclature is superior because it stands up better to fine time resolutions, either view is serviceable at coarser resolutions.
In a sense it’s a matter of the level of abstraction used in the analysis, as I explain in connection with Fig. 6 here: https://wattsupwiththat.com/2015/04/01/some-updates-to-the-monckton-et-al-irreducibly-simple-climate-model/.
But your wise men don’t know how it feels to be thick as a brick…
@ Merrick
August 22, 2016 at 5:26 pm: if only they had seen and then considered how a frost open to blue sky but shaded from sun, can last all day even. In the sun, frost inches away is gone before lunch. GHE, wherefore art thou?
Christopher Monckton,
Your use of the term “climate object’ is interesting to talk about all by itself. How would “climate object” be different than EAS (Earth Atmosphere System)?
John
In reply to Mr Whitman, in mathematics we describe even the most abstract concepts as “objects” so that we can assign properties to them.
Monckton —
You are a master of an elusive style that I would call “droll accuracy”.
Eugene WR Gallun
Eugene WR Gallun on August 22, 2016 at 6:42 pm
– – – – – – –
Eugene WR Gallun,
Indirection argumentation is an effective technique when skillfully blended with direct argumentation. It causes a sophistication such as Monckton’s essays can often have.
John
John Whitman —
Huh?? Is that what i said??
Eugene WR Gallun
Eugene WR Gallun,
No, it is not what you said. I did not say it is what you said. But, we are both addressing the subject of Monckton’s style. N’est ce pas?
John
John whitman
“N’est ce pas?” Is that French? What has France got to do with Monckton? He is an English lord.
Eugene WR Gallun
But all Classically-educated lords speak and read French, albeit, in Chaucer’s telling phrase, “after the school of Stratford-atte-Bow”.
What a fascinating read!
However, I’m still left wondering whether any of this is relavent. Why? Because what if the truth is that the entire system is continuously actively balanced? Does this equation allow for a “no change over time” condition? Does that mean that some of these variables, that we know exist from physics, have to go to 1 in order for the actual data to fit? Or do equations like this force us to ONLY consider molecules like CO2 as the “cause” of an imbalance? My, perhaps naive, intuition keeps nagging at me that both the abosrbance and emission of radiative energy on our blue ball can not be reduced to such a simplistic constant equation. Neither weather (short term) nor climate (long term) can be reduced to such a simplistic equation when all of the phenomena that regulate the earth’s climate are not yet fully understood. IMHO both the radiation being absorbed and the radiation being emitted (regardless of the average altitude) is like that of a flickering candle. They are NOT CONSTANT. At any given location and at any given time radiation being absorbed is DYNAMIC and in addition it also must be a given that the radiation being emitted is dynamic. . .. . . and the “altitude” at which it is being emitted is dynamic. Don’t very large storms covering large very large swaths of the earths surface fairly glow in the IR spectrum, wherever there are clouds, as a direct result of huge radiative energy dumps caused by water’s phase changes? Is that not why we can take pictures of large huricanes from the dark side of the planet in the infrared spectrum? And if we were to observe a movie (add time to the equation) of this radiative energy picture, would we not see the IR ‘glow’ from clouds modulating with time? And would we not see clear down through to the earth surface where no water vapor is present and much higher where thunder clouds have formed? And does not each tiny droplet of water that has condensed from water vapor in a cloud continue to absorb IR radiation and store it in the liquid crystal layer on its surface to create many, many, many surface charges that are later released in one HUGE spike in radiation (lighting strike). I suspect that when the significant role that water plays, as the Grand Regulator, is finally fully understood and mathematically added to this equation, it will finally become evident just how much of an insignificant “feedback” CO2 plays and just how continuously and actively balanced our blue planet’s radiative picture is.
I deeply respect your analytical mind. So my questions Lord Monkton are these: 1) Would it not follow closer to the truth to integrate the radiative energy balance over time? (rather than be seduced into thinking of it as a single simple equation with un-changing constants?) 2) If so, then does not water’s storing and then releasing of energy (absorbing IR and then emitting back to space somewhere else) need to also be included in this equation some how? Have you ever thought about some way to include the role that water plays in this equation? and What do you think about Dr. Gerald Pollack’s theories about the role of water in clouds and in energy transport and apparent radiative balance?
In answer to Don V, the art of mathematics is to find the easiest way to get a sufficiently well-resolved and precise answer. The simple climate-sensitivity equation illustrated in the head posting is remarkably effective in reproducing the climate-sensitivity predictions of even very complex models, precisely because it reduces the interactions between the key parameters to the simplest form, allowing their values to be tweaked at will to allow for the passage of time, for instance.
As for water vapor, it is taken into account in the equation as the largest of the temperature feedbacks whose sum is represented in blue in the illustration.
Finally, I am not familiar with Dr Pollack’s work.
Water is limited solely to the task of making clouds. Water in clouds, has no other role than just to make clouds.
g
Christopher, forget about the climate sensitivity and its contorted representations. It has no physical meaning. Has it not occurred to you that current observations of radiant energy set its value firmly to zero? If not, lets walk it through. This fact follows from the existence of hiatuses in global temperature records. The first of these hiatuses occurred in the eighties and nineties. During the 18 years from 1979 to 1997 global temperature did not change. This fact is shown as figure 15 in my book “What Warming.” Unfortunately IPCC has decided to cover up this hiatus with a non-existent warning, a scientific crime. Although the warming stopped during the hiatus, the Keeling curve shows that growth of atmospheric carbon dioxide did not. But this is impossible according to the Arrhenius greenhouse theory, still used by the IPCC. According to Arrhenius, values of atmospheric carbon dioxide and of global temperature must always change in parallel. This did not happen and that invalidates the use of Arrhenius theory for having made this false prediction.In the hiatus region, you can now find two temperature segments that are both flat and horizontal. Lay them on top of one another and there is no space between them. And this lack of spare between them is proof that the so-called climate sensitivity is zero. When I brought up this hiatus in a paper tat appeared in WUWT in October of last year a little snutnose called Bob Tisdale had the temerity to accuse me of faking these observations. That is a libel and should be disciplined by Anthony Watts. Below is how NASA described this temperature segment in 1997:
“….Unlike the surface based temperatures, global temperature measurements of the earth’s lower atmosphere obtained from satellites reveal no definitive warming trend over the past two decades. The slight trend that is in the data actually appears to be downward. The largest fluctuations in the satellite temperature data are not from any man-made activity, but from natural phenomena such as large volcanic eruptions from Mt. Pinatubo, and from El Nino. So the programs which model global warming in a computer say the temperature of the Earth’s lower atmosphere should be going up markedly, but actual measurements of the temperature of the lower atmosphere reveal no such pronounced activity.”
In addition to the hiatus of the eighties and nineties we recently had another hiatus in the first part of the twenty-first century. It ended in 2012 when the temperature rise of the El Nino of 2016 began to develop. You can use the earlier parts of this period to draw the same conclusion we already obtained, namely that climate sensitivity is zero. This persistent belief in warming comes from the original belief in carbon dioxide greenhouse effect which IPCC blames for AGW. It has never been proven and is false. Hansen knew this and attempted to prove the truth of the greenhouse effect by presenting a hundred year warming curve to the Senate in 1988. Checking his work in Congressional Record I found that this warming curve did not last 100 years like he said. Not sufficient for me to believe in AGW.
In response to Mr Arrak, it is not possible to assume from the length of the Great Pause from 1997-2015 that climate sensitivity is zero. It is possible, for instance, that the additional heat generated by the excitation-deexcitation collisions in the atmosphere is being taken up into the ocean, whence it may someday emerge. However, since the heat capacity of the ocean is very large indeed, and since the ARGO bathythermographs show the ocean warming not from the top down but from the lower strata up, with little or no warming at the surface, it may simply be that the direct forcing from CO2 has been overstated, and perhaps greatly overstated. The feedbacks are certainly overstated.
The feedbacks are certainly overstated.
The positive feedbacks are certainly overstated.
The negative feedbacks are seldom acknowledged.
Actually, even IPCC accepts that the lapse-rate feedback is negative. See e.g. AR5, fig. 9.43a.
My dear Monnckton, you are confused about the “Great Pause from 1997-2015.” It does not exist. Forget the excitation-deexcitation collisions in the atmosphere, forget the Argo, forget the forcing from CO, and forget the heat capacity of the ocean, they are all irrelevant. Whoever named it the Great Pause did not understand that he was fusing three disjoint temperature regions into an imaginary unity. Look again at my figure 15. Even a child can understand that the towering super El Nino of 1998 and that flat region in the beginning of a new century do not belong together. First. the super El Nino of 1998 is sui generis. It started in 1997 and was gone by 1999. Its peak was twice as high as those of the five El Ninos that preceded it,and its base was much narrower. Together, this spells a much higher velocity of arrival and departure as compared to the the other five peaks. It is possible to regard these five as produced by a regular side to side oscillation of Pacific water involving trade winds and the equatorial counter-current. But the the super El Nino itself must have a different origin, perhaps a branch of the south equatorial current or leakage from the Indian Ocean. Be that as it may be, it is followed by a rapid step warming that starts from a La Nina -like bottom in 1999 and in three years raises global temperature by a third of a degree Celsius. It is quite certain that this warming cannot be greenhouse warming because according to the Keeling curve there was no increase of atmospheric carbon dioxide in 1999. It is likely that its warmth is inherited from the large amount of warm water left over from the super El Nino as it departed. The effect of this warm water was to raise all temperatures that followed by a third of a degree Celsius above the base line of the eighties and nineties. This has led to numerous observations of “warmer than ever” temperatures in the twenty-first century. Hansen was the first one to notice that nine out of ten record high temperatures all occurred in the first decade of the twenty-first century. His conclusion was to ascribe it all to the greenhouse effect without checking whether this was possible (it wasn’t). The beginning of the twenty-first century warm period was reasonably smooth and it was possible to regard it as a hiatus region. But soon irregularities came in, including a La Nina in 2008 and an El Nino in 2010. And by 2012 the temperature started to rise towards a new El Nino peak in 2016. Taking account of all this it became clear that long range temperature was on a down-slope of cooling. This is not surprising if we consider that the chunk of warm water that created this feature can no longer be replenished because its source – the super Ell Nino of 1998 – is no linger available. Which leaves us wondering what will happen when the current El Nino of 2016 has run its course. It is easy to say that once the inherited warmth is dissipated the previous baseline ought to be restored. But it is hard to say when.
models are never sufficient
Monckton,
You said, “Next, one must allow for albedo. The Earth (or, in particular, the clouds, which account for some 97% of its albedo) reflect about 30% of all incoming solar radiation harmlessly straight back into space.”
I have seen that 30% value bandied about in numerous articles, but the CRC Handbook of Chemistry and Physics (88th ed.) lists a value of 36.7% I question your statement of 97% of the albedo being the result of clouds because Venus, which is shrouded in clouds, has an albedo of 65% (CRC, 88th ed.) I’ve never seen an orbital image of Earth where it looks close to being 97% cloud covered. Because much of the Earthshine that is reflected back towards the sun is from clouds, your statement may be correct. Maybe this is semantics, because I believe that albedo is the wrong parameter to use anyway. It is, at best, a lower-bound on the total reflectivity of the Earth. Water on the surface reflects by specular reflection, not diffuse reflectance, and is not captured by Earthshine on a backdrop of the moon. Even snow and vegetation, which reflect approximately diffusely, typically have a strong forward scattering lobe that is overlooked in estimating total reflectivity.
[Different chemical? SO2 over an opaque Venusian atmosphere? H2O in a clear earth atmosphere. .mod]
Mr Spencer should understand that the albedo of the Earth is not 97% but 30%, and that 97% of that 30% is from clouds, according to a 2011 paper I read a couple of years ago (I should have taken a copy but didn’t).
One can eyeball a picture of the Earth from space and see that just about all the light returned from the image is reflectance from clouds.
Monckton of Brenchley says
It is unwise for Mr del Prete to say that the only thing that matters is changing albedo, when there is not much evidence for a significant enough change in albedo to make a difference to climate sensitivity.
My Reply
Monckton of Brenchley you are clueless when it comes to why and how the climate may change. Your focus of study is wrong and your statement that there is not much evidence a change in albedo can not change climate sensitivity is based on your opinion which is also wrong.
A change of albedo of .5 of a percent is all that is needed to have major climatic impacts.
Your line of study when it comes to the climate does nothing to explain why the earth has transitioned from glacial to inter-glacial conditions and why abrupt climatic changes occur sometimes in decades.
This whole article is a waste of time when it comes to why /how the climate may change especially if one like myself does not believe the GHG gas effect drives the climate but rather it is the other way around.
I do not think you have ever looked at or studied the historical climatic record.
Dr. Spencer knows the albedo of the earth is 30% approximately but that changes.
What governs the climate is one simple basic fact which is total energy coming into the earth versus total energy leaving the earth and what may effect that balance.
Monckton is not addressing this not really.
Question what determines climate sensitivity in your opinion Monckton, and what factors do you think impact or change climate sensitivity ?
Monckton,
For all your vaunted reputation, you apparently have a reading comprehension problem. I did NOT say that the Earth had an albedo of 97%!!! Instead, I questioned the 30% value and I cited the value of 36.7% found in the CRC Handbook.
I disagree with your assessment of “just about all the light returned from the image is reflected from clouds.” It is true that, when present, clouds are very bright and reflect a substantial amount of light back towards the sun, but everything else can be seen clearly as well, except what is under the clouds. What the clouds contribute is the difference between their reflectance and the reflectance of the surficial materials they are covering. The albedo of the moon is about 12% (with dark ultramafic rocks) and Mars is about 15%. By analogy, areas such as the Sahara Desert and Mojave Desert should be at least 15% because they are richer in white quartz sands and generally lack the ubiquitous iron oxide coating of the Red Planet. In contrast, if we lived on a cloudless Waterworld (ala Kevin Kostner) it would only have an albedo of about 2%, although its total reflectivity would be higher.
However, you missed my point. That is, water especially, and also diffuse reflectors such as vegetation and soil, reflect light in a forward direction into space along with their approximately uniform diffuse reflection in all directions. That is not captured by albedo estimates derived from Earthshine, nor do satellites looking down from a position approximately in line with the sun record this reflected light.
For the MODerator,
while water droplets and sulfuric acid have slightly different indices of refraction, which will affect the reflection to some extent, I don’t expect that it will be substantial because there is an upper-bound of 100% and water clouds are highly reflective. I believe that water droplets are more highly reflective because the extinction coefficient for water is lower than for sulfuric acid. That being the case, I would expect that Earth would have an albedo equal to or greater than Venus if Monckton’s claim that 97% of the albedo was created by water clouds.
Mr Spencer had earlier written that he had never seen a picture of the Earth in which it was 97% cloud-covered. A necessary implication of that statement is that he was speculating on whether the Earth’s albedo might be 97%. In fact, the Earth’s albedo is of order 30%; that is the value the models use; other values for various purposes are also available; and Mr Spencer can help himself to any that he prefers.
The central fact remains that lambda-zero is at present determined by reference to emission temperature and not surface temperature; that it is determined on the basis that today’s albedo is of order 0.3; that accordingly the value of lambda-zero is 0.312 or thereby; that that is the value the models and the IPCC use; and that if Mr Spencer wishes to complain about any of these facts (as he should, for there is a lot wrong with the concept of lambda-zero) then he should address his complaint not to me but to the IPCC secretariat.
He did NOT say that clouds give 97% coverage of earth. He did say that 97% of earth’s albedo (it only has one) is due to clouds. NASANOA says that average earth cloud coverage is about 60%, and that is not solid dense cloud like Venus.
When you look at the earth from the moon, it is quite apparent that the “blue planet” is more white than blue, and the condensed surface contribution is only 3%.
The blue planet is actually a black planet, as the deep oceans are black not blue, when viewed away from scattered sunlight. But the reflection coefficient of the oceans is only 2% normally and about 3% for a full hemisphere reflectance, so the oceans contribute virtually nothing to earth’s albedo. The apparent blue oceans in extra-terrestrial photographs are simply blue sky, which in sunlight looks quite the same looking down as looking up. You can’t actually see the sea surface from a plane at 36,000 feet.
G
Christopher, thanks for your post. I’m in a forest working off of a cell phone and I already lost this twice so it will be short.
You say:
Being fond of definitions, I wanted to see the “by definition” you referred to. So I entered “Planck emission surface” into google, and to my great surprise I found it’s a very rare thing, a “googlewhack”.
And what is a googlewhack when it is at home? Well, it’s a phrase of three words or more that google can only find on one single, sad, solitary web page. And which web page did google find it on?
Why … this very web page.
So not only is there no definition of the term anywhere on the web, but as far as google knows, you’re the only man to ever use the term.
Which, of course, makes me very nervous. When a man claims something is true “by definition” and there is no definition … well, I start to wonder.
So where is the definition of this term that you are the only man to ever use on the web?
More later,
w.
I am taking the sentence you quote as a definition. He wants to exclude heat transport by convection or by rain etc. Still, such a surface will emit much less heat over polar regions than over the equator, it will vary between day and night, over oceans, deserts, jungles, and mountains, and I have a serious problem associating a temperature with it.
Mr Eschenbach should try to use a little imagination if he is a search-engine scientist. Try “characteristic emission level” or “emission temperature” or “Planck temperature”, or read the reference cited in the head posting, Roe (2009), where it is made quite explicit that the reference sensitivity parameter is determined not by reference to surface temperature but by reference to emission temperature.
Monckton of Brenchley August 23, 2016 at 1:13 pm Edit
Lord Monckton, with all due respect, that is nonsense. You know very well that you should just use the correct agreed-upon terminology, then we could understand your meaning and not have these dumb discussions.
“Planck emission surface” was your term. You were quite specific about the words, you used them more than once, and you said that by definition that term meant something. So I looked, and I couldn’t even find the term, much less the definition.
Now you say I should have known that the term was … well … let me call the term “lordship specific”. And you advise I should have just kept trying until … until what? How was I supposed to know when I found the right answer? You are the only man on the planet using the term, and you expect us to magically know what it means? I think this aristocracy thing might be going to your head.
You see, I was foolish enough to believe that you knew what you were talking about. That’s why I looked for your term. But apparently, you get to use any term you want, and we’re supposed to guess what the hell you are talking about.
Sorry, Lord Monckton, but I gave up your nasty little “go google it and if you can’t find it shame on you” game long ago. I will not guess which terms you are talking about, nor will I use google to try to figure you out. I don’t go on a snipe hunt for any man. You see, I’ve tried that with other people. I used to go out on a google run, I’d beat the bushes and finally find something similar, and I’d come back and say “were you talking about ‘Planck level'”, only to be told, “Wrong, go look again”.
So I gave it up. I won’t do it. You want to talk with me, you better tell me exactly what you mean, because I’m not going on a snipe hunt for your meaning.
SO: If you are the scientist you claim to be, and the scientist I for one believe you can be, how about you figure out the right terms first, and stop using your own personal idiosyncratic terms and expecting us to guess your meaning? I will not play your stupid “guess what my words mean” game. If you wish to continue the discussion, how about you simply use terms that are understood and used by everyone else? You have a very unusual distinction, one almost no man has—you were the one and only person on the internet using the term “Planck emission surface” … and you expect everyone to simply guess what you mean by it?
Not gonna happen. Science is not about forcing people to guess at your meaning. You want to discuss science, please use terms that people understand. And if you say that something means something “by definition”, let me suggest that have a link to the definition handy. I say this because definitions are a crucial part of science, I’ll want to look at it, and I would not like to embarrass you again.
Which brings me back to the start. You’ve attacked me for my claimed inadequacies … but you didn’t answer the question. So I’ll ask again:
IS THERE A DEFINITION SOMEWHERE, ANYWHERE, FOR THE TERM “PLANCK EMISSION SURFACE”?
And if not … why did you say there was one, and more to the point, what are you talking about?
Regards,
w.
Mr Eschenbach continues to strain at gnats. He may be unfamiliar with the long-established best practice of providing a definition for an object that does not yet have its own standard nomenclature. The Planck emission surface is one such. It goes by a variety of names. I gave it a name, just as others have done, and, in accordance with best practice, I provided a definition.
It remains the fact – and no amount of wriggling by Mr Eschenbach can conceal that fact – that he attempted, erroneously, to determine lambda-zero (which also goes by a variety of names) by reference to surface temperature and not by reference to emission temperature. A simple admission that he was wrong would be best practice in scientific discourse, rather than focusing uselessly on semantics.
If I had used the term “Planck emission surface” without defining it, Mr Eschenbach might have had a point. But I defined it, and even used the words “by definition” to make it clear that I was making a definition.
Now, Mr Eschenbach may prefer some other definition, in which case he can address himself to the IPCC and ask them to transfer their calculations of lambda-zero to the hard-deck surface.
“The Earth presents a disk-shaped cross-section to the incoming radiation, but its surface is a rotating sphere. So it is necessary to divide the total solar irradiance by 4, which is the ratio of the surface area of a sphere to that of a disk of equal radius.”
–
Is there a problem with taking an average input for a rotating sphere when it is only a hemisphere receiving the input?
The meter directly under the sun gets a lot more energy to dissipate than one at the edge.
When you throw around T to 4th power loss it does not seem like a straight averaging to me.
I too share concerns when one is dealing with T to the 4th power.
All over this disc is different albedo different absorption and emissivity. The temperature profile varies significantly all over this disc and this potentially poses problems when dealing with a function to the fourth power.
There is only ONE albedo for the earth, and that is somewhere around 0.360. I see 0.350 stated quite often.
“Albedo” is NOT “Reflectance” or Reflection Coefficient.
And in fact most of the cloud contribution to that single albedo number is a consequence of simple refraction (multiple times) by roughly spherical cloud droplets of water or ice crystals. Water only has 2-3% reflectance.
G
This is also a question mark for me. That divide by 4 seems non-physical. The earth is heated by the full power of the sun on one side, whilst the other side is radiating into space. The side being heated is effectively a double cosine integration for lat/long over a hemisphere, or does that not matter?
On a cloudless day at the equator with the sun overhead there is enough energy to potentially heat the surface to just under 88 degC, even including albedo = 0.3. If it were cloudless and the albedo 0 the potential maximum surface temperature would peak at about 120 degC.
The temperature based on average flux is surely not the same as the average of the T^4 temperature based on the actual flux, integrated by double cosine over the hemisphere?
What am I misunderstanding?
Thinkingscientist has a point, and the way that the official determination of climate sensitivity deals with his point is by performing latitudinal mean calculations to allow for differences in mean insolation per square meter when determining the value of the reference sensitivity parameter lambda-zero. He will find the term for the Hoelder inequality coefficient in the calculations.
ThinkingScientist August 23, 2016 at 7:25 am
This is also a question mark for me. That divide by 4 seems non-physical. The earth is heated by the full power of the sun on one side, whilst the other side is radiating into space. The side being heated is effectively a double cosine integration for lat/long over a hemisphere, or does that not matter?
Exactly, do the double integral over a hemisphere and you’ll see exactly where the factor of 0.25 comes from!
You are misunderstanding that climate science is a safe haven for otherwise unemployable statisticians, who don’t seem to realize that they are the only things in the whole universe that are even aware of an average, or respond to information about an average.
The real universe acts in real time and does everything immediately; meaning, as soon as it can happen it does happen, and if it doesn’t happen it is because it CAN’T happen so it doesn’t.
Nothing physical in the universe responds in any way to the average value of anything.
And averages are calculated after the fact from presumably real numbers, which are samples of some continuous function, and there is NO assurance that the average computed from those samples is the true average of the original continuous function.
Only if the discrete sampled values comply with the Nyquist criterion, can the true average of a continuous function be computed.
TSI is 1362 Wm^-2 thereabouts, not 342, and that is the “Forcing” that the illuminated portion of the earth feels, and can heat the surface to perhaps +60 deg. C during the day.
342 can’t get the planet beyond 252 K or thereabouts. The number is floating around somewhere on the web.
G
For Christopher and others debating the term “Planck feedback”, a quick look on Google Scholar finds more that 200 peer-reviewed climate science papers that use that exact term. So regardless of whether it is correct, it is used extensively by professionals in the field and its meaning is well understood.
In other words, if it is right it is right, and if it is wrong, it is so wide-spread that it is a “term of art”, a particular usage of words in a field that is not technically correct but is widely used and accepted nonetheless. These are common in all fields.
As such, Christopher, your insistence that I’m wrong for using the term is bogus. Not only have you quoted other scientists in the past who were using the term WITHOUT BUSTING THEM FOR USING IT, but it is used all over the place by dozens and dozens and dozens of climate scientists.
So I have to conclude your questioning whether I’m using proper terminology is just a red herring. AFTER you bust all of those other scientists and tell them that they are wrong, after you bring the patented Hammer of Moncton down on Brian Soden and Anthony Brocolli and dozens and dozens of other arch-criminals, then and only then you’ll come to me on your list, and you can smite me mightily.
And until then? How about you stop the sideshow and just discuss the science? We know what we are referring to whether it is called a feedback or a parameter, so what difference does it make?
w.
Your comment at 11:37 is priceless, although I do not consider that LOrd M0nckton was suggesting that his definition was true by definition, but rather he was asserting how he defined the expression he was using (of course by implication one might consider that L0rd M0nckton was inferring that it was an accepted definition in common usage).
I agree with you that semantics are often a side show but at the very least a lack of precision may convey a lack of understanding or a sloppiness to reasoning and/or application which could carry consequence, But at the end of the day, I share your view that
although perhaps I would have said I want to know and understand what it is (whatever it be called) what if anything it does, and how large is any effect in the real world conditions of planet Earth.
“How about you stop the sideshow”
A monktopus squirts ink.
your patience is admirable.
“In other words, if it is right it is right, and if it is wrong, it is so wide-spread that it is a “term of art”, a particular usage of words in a field that is not technically correct but is widely used and accepted nonetheless. These are common in all fields’
I recently had a similar discusssion with the bright lights at Goddards about the definition of “ice free”
A clue bird says..
when folks dont want to lose on the science they focus on semantics..
Mr Mosher, as usual, sheds more heat than light. I had suggested in the head posting, mildly enough, that to call the reference sensitivity parameter a “feedback” was infelicitous. I don’t care how many people call it that; it is infelicitious, because it suggests that the reference sensitivity parameter is a feedback, when – as the most cursory glance at the official sensitivity equation will reveal – its role in that equation is manifestly and materially distinct from that of any feedback.
The thrust of the head posting, however, was that Mr Eschenbach was in error (as I had been ten years ago until the great Dick Lindzen kindly put me straight) in assuming that the reference sensitivity parameter falls to be determined by reference to surface rather than emission-altitude temperature.
Is Mr Mosher implying that Mr Eschenbach was right? If so, then climate sensitivity falls very sharply.
It would be better if Mr Eschenbach followed the rule of citing what he actually disagreed with in my posting rather than making up his own straw man from it and tilting at that. What I said, mildly enough, was that his use of the term “Planck feedback” for what is better understood as part of the reference frame within which climate sensitivity is calculated was infelicitous. That there are many others who call what is rather obviously not a feedback a “feedback” is no justification for the use of a term that is calculated to mislead.
The main point of the head posting is that Mr Eschenbach is wrong to attempt to determine the reference sensitivity parameter by reference to the Earth’s surface temperature rather than by reference to its Planck emission temperature. On that, he must surely now admit that he was incorrect. See e.g. Roe (2009), and just about any presentation by Dick Lindzen on climate sensitivity, or any of the climate models (not everything they do is wrong).
I found this lovely interchange in the comments to the IPCC WGI AR5 Second Order Draft.
COMMENT:
RESPONSE:
And yes, the IPCC does indeed call it “Planck feedback” and they do indeed discuss it in Section 9.7.2 under that name, viz: …
So it appears that Lord Moncton tried out his ‘It’s not a feedback’ claim on the IPCC, and they said sorry, wrong.
HOWEVER, as I said, this semantical question is a red herring. I don’t care what it is called, I want to understand what it is and does and how big it is.
w.
Mr Eschenbach seems to know less about the mathematics of climate sensitivity than I had suspected. He may like to read Roe (2009) on the question of how the reference sensitivity parameter is conventionally determined, and on why it is better considered not as a feedback – for it does not act in any recognizable way as part of any feedback loop and its role, if he will only look at the official climate-sensitivity equation, is manifestly distinct from that of any feedback.
As for the IPCC, it is indeed most reluctant to describe how the reference sensitivity parameter lambda-zero is determined. It would much rather keep everyone in ignorance, for it turns out to be hiding something. Using the term “Planck feedback” for what is rather obviously not a feedback is part of what is either a wilful or a herd-instinct sowing of confusion.
It was when I realized that the term “Planck feedback” was being used as a method of confusing the argument that I began to look at what might be hidden behind it. More in due course. Watch this space.
In the meantime, if Mr Eschenbach is unfamiliar with the Planck radiance of a planetary body, I suggest that, rather than making inept use of search engines, he should find a good elementary textbook of astrophysics. But, if he is a search-engine scientist, then let him google “Planck emission”, “emission level”, “characteristic-emission level” etc., and, when he discovers it, he can study it before making the monstrously anti-scientific implication that because he cannot find my name for it it is not a recognized concept.
Like it or not, he is in frank, grave and persisting error in persisting in wanting to determine the reference sensitivity parameter at the Earth’s surface rather than at the Planck emission surface as meticulously defined in the head posting. One who is reduced to futile semantics rather than tackling the substance of a scientific argument does neither himself nor science any favors.
Monckton of Brenchley August 23, 2016 at 1:01 pm
Oh, please. You used a very specific term and claimed it had a meaning “by definition”. I went to look for the definition, and not only could I not find it, I couldn’t find the term itself. How is that my fault?
And no, your Lordship, I’m not ever going to try to guess what you mean. I’m sorry, but trying to guess what goes on in another scientists head is a game for losers.
And now, you encourage me to google more random terms … why? Are you hoping I’ll come across your bogus term?
Lord Monckton, the fact that you do not use understandable terms DOES NOT MAKE IT MY PROBLEM! Nor does it mean I have to guess at your meaning.
So I ask again, as I have asked before:
IS THERE A DEFINITION SOMEWHERE, ANYWHERE, FOR YOUR CHOSEN TERM “PLANCK EMISSION SURFACE”?
And if not … why did you say there was one, and more to the point, could you give us a clear definition of just what you mean by your unknown bogus terminology that nobody but you uses? You keep whining about my state of knowledge … but that doesn’t answer the question, it just distracts the easily fooled.
w.
Mr Eschenbach, who continues to wriggle unbecomingly like a stick pig rather than conceding that lambda-zero is determined by reference to emission temperature and not by reference to surface temperature, will find a more than usually precise definition of the term “Planck emission surface” in the head posting. If he would like further details, he may like to refer to the numerous excellent presentations by the great Dick Lindzen on the subject: for instance, the term “characteristic-emission level” is his phrase for what I have called the “Planck emission surface”.
And of course it is not a real surface, as a careful reading of the head posting would reveal to Mr Eschenbach. For it is the locus of all points at or above the hard-deck surface at which incoming and outgoing radiation are equal.
Mr Eschenbach seems to think that there is no point at or above the Earth’s surface at which, in steady state, the incoming and outgoing radiation are equal. In that event, he seems to be coming perilously close to repealing the laws of thermodynamics. For, all other things being equal, one would expect the Earth either to emit as muc radiation as it receives or either to heat up or cool down.
Monckton of Brenchley August 24, 2016 at 12:16 pm
So now you are lowering yourself to a cheap ad hominem attack? There’s a Lord in England who once listed all those kinds of bogus attacks and logical errors and condemned them roundly … oh, wait, that was you! And now you are descending into mudslinging? How the aristocracy has fallen from its own guidelines. Medico, cura te ipsum!
I have your definition, in fact three of them. The problem is that they don’t agree with each other. So I wanted a real definition, like in a glossary or other reference work.
I have only your word for it that you are talking about the same thing as Lindzen, and if your definitions are correct, you are not talking about the same thing.
Ah, my bad. I didn’t realize you were including solar radiation in the equation, as this is the first time it has come up. Prior to that you were talking about IR. So when you said “the incoming and outgoing radiation is equal”, I thought you were talking about IR, when actually you were talking abut incoming solar only, not incoming IR, and outgoing IR. You could have just said that. But now that we have that settled, we have three separate definitions from you:
1. The Planck emission surface is, by definition, the locus of all points of least altitude at which incoming [solar] and outgoing [IR] radiation are equal …
2. This strange surface is the surface from which satellites perceive outgoing radiation from the Earth to emanate …
3. It is – again by definition – one optical depth down into the atmosphere as seen from above …
Unfortunately, those don’t all agree. For example, the satellites perceive outgoing radiation from a) the surface itself, b) the atmosphere, and c) the top of the clouds. According to your definition 1, all of these points must perforce lie on the Planck emission surface. But there is no requirement that at the tops of the clouds the downwelling solar MUST equal the upwelling IR, in fact it’s highly unlikely. So those two definitions disagree.
Also, your definitions assuredly don’t agree with the normal definition of the effective radiation level. The normal definition is that the ERL is 1) an AVERAGE, and 2) different for different longwave frequencies.
In addition, there are areas of the planet where incoming solar and outgoing IR are NEVER in balance at any altitude. So one of your three definitions doesn’t cover the whole planet.
Finally, the definition you have given is NOT for an average. Instead it is for a surface containing all points meeting certain conditions, which is as far from an average as you can get. That defines an actual variable surface. Nor does it contain any discussion of what frequencies you are referring to.
And THAT is why I wanted you to define just what you are talking about, because as far as I can see, it is NOT what Dick Lindzen is talking about. He has defined an average. You’ve defined a surface.
So perhaps you could elucidate the following.
1) According to Dick Lindzen, the “characteristic emission level” is a global average. You say it is not an average, it is a surface of varying height all over the world. Please clarify.
2) The satellites see down one optical depth, by definition … however, this depth varies in both space and time. Sometimes it is well above Dick Lindzen’s “characteristic emission level”, and sometimes it is under that. Dick’s “characteristic emission level” on the other hand, is an average which is stable as long as the forcing is unchanged. Please clarify.
3) At any given instant, some photons from the earth’s surface go unimpeded into space, through what is called the “atmospheric window”. According to you, their Planck emission surface is at the planetary surface. At the same time and place, other photons are intercepted at a variety of heights by a variety of GHGs … so we have a variety of what you call “Planck emission surfaces”. Which one are you talking about?
4) You say that the Planck emission surface is the altitude at which downwelling solar equals upwelling IR. HOWEVER, for about 2% of the world’s surface, this is never true. As you might imagine, these are cold areas where the surface temperature is below the blackbody temperature of the incoming solar radiation. And as a result, the upwelling IR can never match the downwelling solar radiation.
And on a monthly basis, in some months, above as much as 39% of the planet the upwelling IR and downwelling solar aren’t ever equal no matter what altitude you look at. Please clarify what happens to your “Planck emission surface” in those areas. Does it disappear? Does it become the planetary surface? Does it go to infinity?
You see what I mean about your various definitions not agreeing with each other? Over any given location there is always a level which is one optical depth from outer space at any given frequency. But there is NOT always a level where upwelling IR is equal to downwelling solar … so those two definitions simply cannot both be true.
Finally, you say that:
“There is really very little argument about the value of the Planck parameter, for its derivation is so very straightforward.”
However, in fact there is significant argument about how to calculate the value of the Planck parameter, and even about the definition of the Planck parameter. Easterbrook, for example, recognizes two Planck parameters to be used in different situations, ksfc and kcel. Kimoto spends an entire paper discussing different arguments for different values for the parameter. And Lucia Liljegren has written a very strong argument arguing that you and Kimoto are both wrong … and she’s ten times the mathematician that I am.
So it is simply not true that “there is little argument about the value of the Planck parameter”. That’s just you trying to end the discussion before it has even begun by claiming in effect that ‘the debate is over’ … sound familiar? It should, it is a common trick of the climate alarmists … in my experience, when a debater claims “the debate is over” or “there is little argument” or “there is little opposition”, it very much means that there IS argument and opposition, and the debate is NOT over.
Please note that none of this is a claim that I’m right and you’re wrong on the basic issue. That remains to be seen. You may indeed be right. Me, I haven’t gotten that far yet. I’m still trying to figure out your terms and definitions.
w.
The equation in figure 1, and the related derivations, compute the expected change in temperature with respect to changes in available solar radiation. It is incorrect to use that lambda-zero to compute a change in surface temperature due to a change in greenhouse gasses. Using that equation, if you increase the CO2 amount one hundred times, the temperature of the Planck emission surface, and its measured emission, will still be the same because this is determined only by the amount of energy received from outside the system, the albedo, and the assumption that the emissivity is equal to one. The pressure (altitude) where this average “surface” occurs may change, but its temperature will not.
Mr Clemenzi is partly right. The usual approach is to determine climate sensitivity at the emission altitude and then, via the lapse rate (which does not vary much), translate any temperature change at altitude to a corresponding temperature change at the surface. Some authors (see e.g. Vial et al., 2013) argue that temperature feedbacks should be determined by reference to changes in surface temperature, but they do not follow the logic of their argument through to the extent of replacing lambda-zero with lambda-surface in the feedback part of the equation, for that would greatly reduce climate sensitivity, and their paychecks depend on not letting that happen, ever, regardless of mere science.
Monckton of Brenchley August 23, 2016 at 1:31 pm said (emphasis mine)
Actually, the lapse rate varies quite a lot at lower altitudes, both by season and by location. Here are the MODTRAN values for the lapse rate up to the tropopause for six different scenarios. All of them use the default MODTRAN values except for a setting of 400 ppmv for CO2. I’ve “jiggled” the x-axis values slightly and used a 50% transparency so you can see two or more points which land on top of each other.

As you can see, far from your claim that the lapse rate “does not vary much”, the lapse rate actually varies by about two to one, from values around minus 3 to about minus 6 degrees C per 1000 metres altitude depending on season and location …
Again, I’m not saying that you are incorrect in your basic claim about the Planck parameter. I’m just trying to hack through the misconceptions so I can see what you are actually doing.
w.
To confirm the variation in lapse rates by latitude, I calculated them using the mean temperatures and elevations by 10° latitude band. Of course, this can only calculate the lapse rates over the land. Here is that result:

The large uncertainty in the 50°-60°S band is due to the very small amount of land there.
Now, recall that Lord Moncton had claimed that the lapse rate “does not vary much”. However, both MODTRAN and the CERES data disagree strongly. When the standard deviation is nearly a third of the average value, yes, it varies a lot.
w.
Christopher Monckton of Brenchley,
may I accolade the ‘smiling physics readers’ award.
Mr Wundersamer is most kind. I accept the award with – er – a physical smile.
Can’t help; the best analysis + the best performance of ‘climate models’ to get.
Lots of work, I suppose – lots of time.
________________________________________
1st of all is a fast base. Yours the way.
I have tightened the chin strap on my steel hard hat helmet, and ducking all of the ordnance flying around.
BUT, I have to admit, that I am NOT troubled at all, when an author adds the words: ” By Definition ” to a statement, that may in fact be the first utterance of a definition that (s)he has just offered.
Now others may choose to NOT recognize that ” out of the blue ” definition as too new to find in the literature, but there is nothing wrong with the author saying it is a definition, if (s)he wants to designate that term to that subject.
On a first reading, I simply took LMofB’s statement as being his definition of his terminology, although it might also have been a pre-existing term, and definition.
In science papers where it is very common to find “shop” terms and ideas, authors are in fact well advised to define right there terms they used that might not be widely disseminated in the literature.
I once wrote a technical paper for an electronics magazine that was a tutorial on the terms from the Science of Photometry for the benefit of EEs who were starting to play with LEDs.
Naturally, throughout the paper, I used the word “Luminance” many times, referring to the photometric equivalent to “Radiance” for emitting sources of EM radiation.
The editor, thinking that “Luminance” was simply some street term for shiny things, proceeded to methodically replace “luminance” with brightness, illumination, and every other colloquial synonym he could find, as he thought my multiple usage was stuffy.
Then he asked me to proof read his trashy result for technical accuracy.
I simply wrote back that my paper was technically correct as written, and he had turned it into total rubbish. He published my paper verbatim. Never changed a word or letter of even punctuation. We got along famously after I explained that Luminance and the other photometric terms were precisely defined quantities, and not at all interchangeable in science papers.
And as an example, I have yet to find an EXACT definition of the term “Climate Sensitivity ” as used in a peer reviewed scientific paper by whoever the heck it was that first mentioned climate sensitivity, and said “By definition.” Who was that and does anyone have a reference for that paper. Here at WUWT, I have read at least a half dozen ersatz statements on what CS is, that are all different.
G
Moon Fact Sheet Moon/Earth Comparison Bulk parameters
Moon Earth Ratio (Moon/Earth)
Mass (1024 kg) 0.07346 5.9724 0.0123
Bond albedo 0.11 0.306 0.360
Visual geometric albedo 0.12 0.367 0.330
Visual magnitude V(1,0) +0.21 -3.86 –
Solar irradiance (W/m2) 1361.0 1361.0 1.000 check
Black-body temperature (K) 270.4 254.0 1.065
–
albedo. The Earth (or, in particular, the clouds, which account for some 97% of its albedo) reflect about 30% of all incoming solar radiation grudging check
the Earth’s emission temperature, which turns out to be 254.6 Kelvin, check
–
Note both the sun and the earth receive the same solar irradiance yet the earth, with greenhouse gases radiates at a lower temp than the virtually airless moon from it’s Planck emission surface,
I guess because more energy has been reflected.
The bit we live in is nice and warm though.
@angech
The sun receives solar radiation? A short trip.
Hmm… he loves Scotland so much he can only stand to see it ruled from another country, without independence…
He ignores that the SNP is voted in by the majority of Scots… perhaps he’d prefer if it was governed by Labour MPS from Westminster?
And he doesn’t seem capable of using the internet to find a decent cottage… I’ve just found some at £335 for a week.
Bizarre stuff…
Don’t whine. The people of Scotland voted to remain part of the United Kingdom. Get over it.
The people of Scotland also voted to remain in the EU. Well, we can’t have our cake and eat it. Scotland remains in the UK, and the UK is leaving the EU, so Scotland is leaving the EU.
“Willis was infelicitous in referring to the Planck parameter as a “feedback”, for it is unlike any true feedback; he was incorrect (as I had once been) in attempting to determine it at the hard-deck surface rather than the emission surface of the Earth;”
Thanks Lord Monckton, and of course Mr. Eschenbach (who may consider himself beknighted in my heart) for this exchange that helps to illuminate the mysterious concept of feedback. It is infuriating to the senses and aggravates the mind, like finding fractals floating in your soup. Every time I hear the term “re-radiation” I wonder, why would Nature stop at one “re-“? Is it Planck Turtles all the way down?
Until I grasp this concept completely I dare not place a candle between two mirrors, lest the tunnel of light should gain even with the re-radiation of the soot particles upon the mirrors’ surfaces, to swell brilliantly and consume the Earth in a blaze of Glory that is contained only by the urgent gravity of the situation.
For gravity is the firewall with which Nature keeps its silly mistakes from spoiling the whole Experiment. Will wax philosophical, for food.
It surprises me to read that the precision with which albedo is known is claimed to be uncertain. A 0.5% change of albedo [in eq 1361 (1 – 0.3) / 4 = 238.2] results in a change of 1.7 W/sq meter. NASA seems to say 0.3 +/- 0.04 from CERES data [ http://earthobservatory.nasa.gov/IOTD/view.php?id=84499 ] Is this contested in any serious way?
The CERES page in the link has some good info on albedo, the maps are interesting. And this quote…
“What the results show is that even at global scales, Earth’s albedo fluctuates markedly over short time periods due to natural variations in the climate system,” said Norman Loeb, CERES principal investigator
Also, here is another case where the 24 hour averaging may be deceptive. Since albedo is a solar reflection parameter, and therefore only applies to the sunlit side of the Earth. Some unknown percentage changes of albedo may occur within hours due to cloud formation from surface convection. However, it seems reasonable that the CERES data show solar energy absorbed by the Earth averages about 240 watts per square meter over a year. At least as a starting point for the Planck function calculations.
BW,
Because the moon is not in the plane of the ecliptic, any measurements of Earthshine over time are going to be from different viewing angles, and of different regions of the surface, alone with changes resulting from weather and seasons. That is, the albedo, as estimated from Earthshine measurements, can be expected to vary considerably for natural reasons. From what I have read about the CERES measurements, they are modified with models. Need I say more?
A 0.5% change in albedo would alter the Planck radiance by about 0.5 Watts per square meter. However, albedo changes are accounted for not in the determination of the Planck radiance but by way of the albedo feedbacks. At present, observation suggests that the mean value of terrestrial albedo is about 0.3, so that is the value everyone uses. If it were to change, no doubt the official value of the reference sensitivity parameter would change. Be that as it may, the method of determining the reference sensitivity parameter is as descibed in the head posting, and, in may material respects, not as described in Willis Eschenbach’s posting.
Randy,
Please see my remarks above. There is an alternative albedo value in the literature — 0.367 — that carries some weight.
However, no one seems to have picked up on my claim that even if the albedo, as determined from Earthshine is known with great precision, it cannot capture the specular reflection from water, which goes off into space in a direction opposite from the moon.
And is only 2-3% at most.
G
It isn’t obvious to me that Confucians have much similarity to Libertarians.
The thing that separates Confucianism from Libertarianism is the former’s emphasis on family and social harmony. Confucianism is basically collectivist. The difference between the two is sheep and goats.
A basic principle of Confucianism is zhong xiao. Zhong is piety to the ruler. Xiao is piety to your parent. It requires total deference to both of them. The concept is highly nuanced and goes far beyond blind obediance.
If there is an ancient Chinese philosophy that comes close to libertarianism it would be the early Doaism of Laozi and Zhuangzi.
Worth reading the Analects, which I carry with me on my phone. Of course Confucius was publicly demonstrative of piety to the ruler: in those ungentle times, death followed otherwise. However, in the modern Chinese understanding, the contrast is drawn between totalitarianism, which is not only collectivist but subservient to the State, and libertarianism, which is not collectivist. To suggest that the family is a collectivist institution in the usual political sense of the term “collectivist” would be ridiculous.
You could simply look into the basic Confucian values. Those in themselves are pretty clear. Confucians do value social harmony, but that harmony is regarded as an emergent property of ethical behaviour on the individual’s part. Compare that with various schools of Libertarianism and you will find considerable similarity. Confucianism emphasizes individual action while the Legalists emphasized the rights of the state. Modern Chinese communist government falls into the same pattern “legalist” patterns that many Chinese governments have during the last three millennia. In those times individuals have no rights not permitted by the governing class – be it emperor and nobility or Chinese Communist Party.
Confucianism does not maximize autonomy. It focuses on the obligations people have to each other … the parents to the children … the children to the parents … the subjects to the ruler … the ruler to the subjects.
Clearly, obligations flow in both directions.
The Venn diagram circles representing Confucianism and Libertarianism certainly overlap. For instance, both emphasize individual responsibility. On the other hand, a good Confucian will subordinate his autonomy to his obligations to his family, community, and country.
Anyone asserting that Confucianism is Libertarianism has the problem of explaining zhong xiao.
In the document Zhong Jing (The Classic of Loyalty)
The root of Confucianism is service to others.
http://globalenergybudget.com/#Cloud
quote If GW is not AGW, then which is the next most dangerous human influence? unquote
Surfactant and light oil pollution of the ocean surface — fewer salt aerosols so stratocumulus reduction, reduced surface mixing and hence alteration of diatom and phytoplankton populations, albedo change, reduced wind surface engagement….
There you go.
JF,
The above shows that albedo can change quite easily. I have pointed out certain terrestrial changes will influence albedo those being snow cover, sea ice coverage and cloud coverage in particular.
I also stated that I think solar influences are likely behind this.
Look at my post sent at 2:07 pm Aug 22.
http://globalenergybudget.com/#Albedo
More info.
Mr del Prete seems to have an obsession with albedo. However, the Earth’s current albedo is of order 0.3; that is the value the models use; and that, therefore, is the value that is used in the head posting, which fairly points out that if albedo were to change the value of lambda-zero would also change.
And recall that I do not warrant that lambda-zero is fit for its purpose. I merely point out that it is determined by reference to emission temperature and not by reference to surface temperature – that was Willis Eschenbach’s error (I had formerly made the same error myself, but was willing to admit it as soon as it was pointed out to me). And it is at present determined – like it or not – under the assumption that albedo is of order 0.3, subsequent changes of albedo being treated not as forcings but as feedbacks and hence occurring at a stage in the calculation after the determination of lambda-zero.
As a matter of fact, 0.3 is the value the models use; as a matter of fact, lambda-zero is determined at the emission altitude; as a matter of fact, its value in the models and in IPCC’s reports is of order 0.3125, or 3.2^-1, Kelvin per Watt per square meter.
If Mr del Prete wishes to argue with IPCC on this point (and, as it turns out, there are excellent reasons why lambda-zero ought not to be used at all, but that is quite another story and not for today), then he should address himself to the IPCC secretariat and cease whining at me.
MODTRAN can be used to look both up an down from any altitude. The effective radiative altitude can be averaged, but the average masks enormous variation by wavelength and radiating gas.


From one meter. The red “background run” is looking down, and the blue looking up.
Ten meters.
One hundred meters.
Not until one kilometer do you begin to see a half baked signal in the CO2 bands looking down. The atmosphere simply does not radiate in the CO2 bands below 1km. It is all thermalized and mostly in the first few meters.
So much for the layer by layer photon hand-off approach from the surface to space.
If you wish to define the CO2 effective radiative elevation as the altitude where up and down flux are equal, it will be around 8km in the tropics, but this is not where the satellites see it. They see it at the tropopause, about 13km.
Mathematics is the art of making different things seem the same. The Plank constant relates temperature, intensity, and wavelength. Kirchoff will have absorption and radiation be equal at equilibrium. Evidently, the atmosphere, thought of as a material, has properties that demand a new equation.
Interesting; have you seen some of the first principles work that Clive Best has done in this
area also?
http://clivebest.com/blog/?p=5911
http://clivebest.com/blog/?p=6800
Thanks Jon,
Familiar with Clive but had not read those particular posts. What I am saying is radically different and I left a comment to that effect on the first link.
What I am saying is that NO photons from the surface EVER make it to space in the CO2 bands. Two lines of reasoning lead me to assert this.
The first, as I have been harping on about for some time, is that there is a flat zero transmission zone to the tropopause according to MODTRAN, that is defined by the fundamental bending mode of CO2 and its rotational sidekicks.
The 667.4 fundamental bend represents nearly 90% of the radiative potential of CO2. If none of this is getting through to the tropopause at 280ppm, there is already a fundamental disconnect.
The second reason, outlined in my initial comment, is that Modtran does not even see any CO2 radiation in the first kilometer of the atmosphere. Now THAT’S a disconnect.
This is all heresy, even here, so I very much appreciate your interest.
This is fascinating! thank you “gymnosperm”. Not that it matters much, but your MODTRAN runs and analysis here resonate with what my intuition has suspected. I just can’t seem to grasp how CO2:
o With its maximum extinction coefficient covering such a small portion of the spectrum, (especially when compared to water vapor, liquid and solid) and
o with its higher density than most other naturally occuring atmospheric gases, concentrating it into the lower altitudes of the atmosphere and
o with it’s solubility in water regularly “leaching” even that concentration out after a good storm, and
o with it never experiencing a (natural) phase change in the atmosphere . . . . .
that it can have anywhere near the impact to adversely warm the planet as the mythical 97% say it must have.
Bond albedo also is the fraction of the total solar radiation reflected by a planet back to space, but is dependent on the spectrum of the incident radiation because it’s defined over the entire range of wavelengths. Bond albedo is used to measure a planet’s energy balance. (It’s named for the American astronomer George Bond, who in 1861 published a comparison of the brightness of the sun, moon, and Jupiter.) Earth-orbiting satellites have measured the Earth’s bond albedo – the most recent values average approximately 0.33.
0.33, not “30%”
I wholeheartedly agree that dividing the flux from the Sun by 4 to make these calculations is an error. This is non-physical. The condition never exists.
CO2 is opaque to the spectrum it absorbs up until that altitude where it is no longer opaque. The concentration of CO2 in the atmosphere causes that altitude to vary. This variance causes the temperature at which the Earth radiates to space to vary. This variance causes the amount of heat found in the atmosphere to vary.
This altitude CANNOT BE CALCULATED!!!
It appears that Mr Moon is unaware that if about 30% of incident solar radiance is reflected harmlessly back to space one may express this either as a percentage, “30%” or as a fraction, 0.3. If Mr Moon multiplies 0.3 by 100 he will get 30. Simple once you have attended an elementary school.
Various values of the Earth’s albedo are given in various sources, but the modelers tend to use 0.3 (or 30%). Since the focus of the head posting was on how the reference sensitivity parameter is determined, it was and remains legitimate for me to take the figure that climatologists use and adopt it by way of illustration. If Mr Moon disagrees that the Earth’s albedo is about 30%, then he should direct his objections not to me but to the IPCC secretariat, which will want to see some evidence for his assertion.
.30 + .03 = .33. “30%” has one significant digit. Both “.30” and “.33” have two. I hope our good Count is aware of the difference.
When I took the final in “Transport of Heat and Mass” at the U of M, there were 180 kids in the class. Final counted for 90% of the grade, as the mid-term had been thrown out, and everyone got a perfect score in the labs. One problem, two hour test, NO ONE finished it. Nothing in my professional life has ever been so difficult. Elementary school indeed.
Your imprecise language concerning radiative flux (“density”?), and your confusion about significant digits, indicate that you have dipped your toe into a very deep, very foreign pond. None of your assertions are based on first principles. The IPCC does not base their assertions on first principles either. I have stated the fundamental first principles in my original post.
You should study the first principles before jumping into these deep waters…
And no reply? First principles, our Count…
The whining Mr Moon, if he were to go to a kindergarten and learn to read, would be able to discover that 0.3 (or, as a percentage, 30%) is the current value that nearly all models assign to albedo. Not 0.33; not 0.37; just 0.3, or occasionally 0.31. No error arises. therefore, from the assumption that albedo is as the models find it.
Mr Moon may well have taken an exam in transport of heat and mass, but he appears not to have been awake when the systeme internationale des unites was explained to his class. Briefly, the unit of radiant energy is the Joule. The absolute rate of energy flux (flux being the Latin word for “flow”) is expressed in Joules per second, also known as Watts. And the flux density, which is the rate of energy flux per unit area (in this case the square meter), is measured in Watts per square meter.
Mr Moon may care to avoid the unpleasant habit of assuming that an interlocutor with whom for some reason he wishes to manufacture a disagreement is using imprecise language when in fact his interlocutor’s use of language is precise but Mr Moon has insufficient elementary knowledge to appreciate that fact.
As to significant digits, I follow a simple rule. All input variables should be expressed to the highest precision available, but the output should be expressed to the least precision among any of the input variables. It is a good rule of thumb. My computer, which I program to perform flux-density and related calculations, uses an extended-precision routine that is capable (not always reliably: my calibration tests have identified one or two errors around which I must code) of determining results to 24-digit precision.
If Mr Moon, from some expert knowledge that he may possess, disagrees with IPCC’s understanding of the ratio of the surface area of a sphere to that of a disk, or if he disagrees with its finding, along with that of most of its models, that the Earth’s albedo is of order 0.3, then he should not snivel at me: he should snivel – for that is what he does best – at the IPCC secretariat, whose current email address will be found at ipcc.ch.
As for the determination of the mean emission altitude, it is a simple enough matter. One determines the emission temperature, deducts that from surface temperature and divides the answer by 6.5 to obtain the mean emission altitude in km.
If Mr Moon disagrees, he should snivel not at me but at the IPCC secretariat.
Wrong conclusions which is verified through the historical climatic record which shows the climate undergoes major and abrupt changes.
Can the value of the Planck parameter vary? Yes, if insolation varies, and yes, if albedo varies. But, since the solar “constant” is near-invariant, and since the albedo is unlikely to change much even if major ice losses eventually occur, lambda-zero will continue to be at or close to 0.313 K W–1 m2 for the foreseeable future.
Mr del Prete imagines a sudden climatic change in the near future. I acknowledge that possibility but do not consider it particularly likely.
But how could it happen ? Can you explain Mr. Monckton?
Monckton of Brenchley you are clueless when it comes to why and how the climate may change. Your focus of study is wrong and your statement that there is not much evidence a change in albedo can not change climate sensitivity is based on your opinion which is also wrong.
A change of albedo of .5 of a percent is all that is needed to have major climatic impacts.
Your line of study when it comes to the climate does nothing to explain why the earth has transitioned from glacial to inter-glacial conditions and why abrupt climatic changes occur sometimes in decades.
This whole article is a waste of time when it comes to why /how the climate may change especially if one like myself does not believe the GHG gas effect drives the climate but rather it is the other way around.
Question what factors do you think impact or change climate sensitivity ?
This argument for everything in the climate system is not subject to change is wrong.
I do not think you have ever looked at the historical climatic record for if you did the conclusions you apparently have would have never been reached.
Mr Del Prete, who has conducted this conversation in a generally vexatious and unscientific as well as discourteous fashion, has failed to appreciate that the purpose of the head posting was not to revisit the entire science of climate sensitivity analysis but instead to point out that Willis Eschenbach, in suggesting that I had erred in finding the value of the Planck or reference climate-sensitivity parameter to be 50% greater than he thought it should be, was himself in error, and to demonstrate the point by providing perhaps the most detailed and yet accessible account of its derivation that is at present publicly available.
The head posting specifically makes mention of the fact that the reference sensitivity parameter is only constant under the assumption – adopted ad argumentum in the head posting – that insolation and albedo are constant.
Finally, Mr Del Prete talks of his “belief” on a scientific matter. i have no beliefs on scientific matters. I examine the evidence to the best of my limited ability and report the results of my researches in the learned journals from time to time, discussing some of the ideas here too.
On weighing all the evidence, I consider that equilibrium sensitivity to doubled CO2 concentration will fall on the interval [0.8, 1.3] K. The rather sparse scientific literature on climate sensitivity is moving inexorably in my direction. It is possible that climate sensitivity could be less than the interval I have mentioned, but even if this were the case my derivation and determination of the reference-sensitivity parameter are both scientiically correct, and that of Willis Eschenbach was in several crucial respects in error. And that is all there is to it.
Here is the problem albedo and insolation are NOT constant because if that were the case the climate of the earth would stay in a highly regulated state for eternity.
This is what is frustrating with your approach which is a disregard for the historical climatic record.
What you are driving at I think is to show that the climate sensitivity to an increase in CO2 is very limited.
Which is fine but I would like you to express if possible your theory as to why Ice Ages come and go given your premise that albedo and insolation are constant.
I want to understand how you square that and then apply it to the present climate situation.
Do you believe albedo and insolation are constant ?
Mr del Prete persists in missing the point that in the determination of lambda-zero one is taking today’s albedo value, not some imagined past or future value. Any subsequent changes in albedo are reflected in the models by way of temperature feedbacks. Lambda-zero, however, is determined at the pre-feedback stage.
I think that Lord M. has formed a definition which has a precedent, but the terms he used aren’t used. The term that is typically used is the “Effective Emission Temperature” of the Earth. This is generally worked out to be 255 degrees K, which is about 40 degrees below the average “surface” temperature of the Earth. (See here: http://www.geo.utexas.edu/courses/387h/Lectures/chap2.pdf ) Using a normal lapse rate calculator to get to 255 you need to go to about 3500 meters. SO I think that Lord M’s Planck emission surface is the altitude at which the normal lapse rate gives us the 255 degree temperature. Now as to how this fits in with any “feedback”, I have no idea. HOWEVER, Lord M., am I correct on your meaning of “Plank Emission Surface”?
In response to Mr Hugoson, the head posting contains a surely clear enough calculation demonstrating that the Earth’s emission temperature is just shy of 255 K – and, more importantly, demonstrating how that value is arrived at.
To determine the mean altitude of the “surface” at which incoming and outgoing radiation are equal, one simply takes the surface temperature 289 K, subtracts the emission temperature 255 K, and divides the 34 K difference by the temperature lapse rate of 6.5 K/km to obtain the mean Planck emission altitude in km: thus: 34 / 6.5 = 5.2 km.
In case I didn’t make myself clear, your answer was “spot on”….and shows that despite the fact that you may have “coined a new label” (i.e. EMISSION SURFACE) it took me approximately 10 microseconds to figure out what it meant (your feedback to me IS exactly the point I was trying to make.) Ergo, Willis needs to be a little more DYNAMIC in his approach to things. He needs to be ready to understand “intent”. (Let’s put it this way, I don’t program in R code. I don’t engage in the marvelous statistical work that Willis does. YET, elucidating what the Good Lord meant, was…as they used to say oft times in my Engineering textbooks, a trivial exercise left up to the reader. (Which really meant, get a pot of coffee, two tablets, your Sci Calculator (my era) and prepare to stay up to 3AM to figure this out.) Now it comes to the need to understand the “intent” of words, I suggest anyone with interest, locate a PDF copy of Churchill’s “Complex Variables”. A textbook I had for a course with that name. Typically it took me three read through of a 12 to 15 page chapter. Then a word by word examination WITH the equations and graphs (which would take about 3 to 4 hours.) THEN, I could spend my 8 to 10 hours doing the problem set for the week. I continuously think of this, when I examine attempts to derive “utilitarian” models for a system with INFINITELY more variables than ANY problem found in Churchill.
IMO the very concept of ECS is bogus. If valid, it would only apply to the world as it is now in every climatically relevant detail, which won’t be the same between now and AD 2100, but might indeed vary significantly.
If there were an ECS 100, 1000, 10,000, 100,000, 1,000,000, 10,000,000, 100,000,000 or a billion years ago, it was substantially different from now, as shown by recorded and geologic history.
Too many other factors enter into climate variability for a hard and fast rule to apply to ECS. IMO net feedback is liable to be negative, so even if there be such a thing as ECS, it’s probably less than the nominal 1.2 degrees C per doubling of CO2. IMO, a lot less.
In answer to Gabro, any mathematician, and certainly any physicist, will be familiar with the concept of performing a calculation holding some parameters fixed. It is a fact that, all other things being equal, returning some CO2 to the atmosphere from which it came will cause some warming. The climate sensitivity equation is designed to give us some idea of how much warming will be caused. As it happens, the official equation contains at least two material errors, one in the determination of the CO2 radiative forcing and the other in the analysis of temperature feedbacks. I suspect it is these two errors, in combination, that are the chief reason why models run hot. Further work is beng done as we speak. Watch this space.
Holding “everything else fixed” is useful for models. Otherwise it is totally unreal. We simply can not hold everything else fixed. That’s not how Mother Nature works. That’s why can not measure ECS, even in principle. That’s why we don’t know it with any accuracy after all those years and resources spent.
Another possible reason for the models running hot is using a total reflectivity that is too low!
In answer to Curious George, I do not say that the models hold everything else fixed – merely that they hold some things fixed. Any model, other than a complete representation of reality, which is unattainable, will hold some things fixed and parameterize others.
“Technically, there is no absolute dividing line between the Earth’s atmosphere and space, but for scientists studying the balance of incoming and outgoing energy on the Earth, it is conceptually useful to think of the altitude at about 100 kilometers above the Earth as the “top of the atmosphere.” The top of the atmosphere is the bottom line of Earth’s energy budget, the Grand Central Station of radiation. It is the place where solar energy (mostly visible light) enters the Earth system and where both reflected light and invisible, thermal radiation from the Sun-warmed Earth exit. The balance between incoming and outgoing energy at the top of the atmosphere determines the Earth’s average temperature. (!!!!!!!!) The ability of greenhouses gases to change the balance (which at 0.04% is not going to happen, not when the alleged reflective steel/glass domes are colanders that are 99.96% hole.) by reducing how much thermal energy exits is what global warming is all about.”
http://earthobservatory.nasa.gov/IOTD/view.php?id=7373
In my opinion the 240 W/m^2, 255 K, occurs at the top of the troposphere/tropopause where atmospheric and surface absorptions reunite, where atmospheric density has dropped to the point that conduction and convection no longer work and the only heat flow comes from radiation. That is why S-B applies in this case, but not at the surface. Also why S-B applies to the sun’s photosphere. The full 340 W/m^2 applies at ToA.
It is the thermal conductivity of the troposphere and Q = U * A * dT that makes the surface the temperature it is, not the thermodynamically unsupportable 333 W/m^2 perpetual loop that actually doesn’t produce any net change in the heat (power flux) balance anyway. It’s the same formula that makes your house 70 F inside on a 30 F day outside. It’s the same formula that applies to the blanket you wrap around yourself at a high school football game.
Above the tropopause density falls to the point that traditional thermo/heat transfer/physics etc. is compromised. When a molecule has to travel a km to interact with another, hard-deck surface/object concepts of heat and energy begin to fall apart.
NS,
Yes. For example, what is the vertical profile of the atmospheric CO2 concentration?
Does it stay at a constant 400 ppm by volume until with altitude it becomes so dilute that it cannot be detected, so dilute that it cannot take part in radiative energy exchanges? Or does it unmix because of its high gas density compared to major air components?
Or does it stay at 400 ppm until a certain altitude, above which it disappears in square wave form?
I do not understand this well enough, but I have much unease about the ability of GHG to do some of the claimed physics when the number of molecules per cubic metre becomes vanishingly small.
Geoff
The atmosphere is well mixed up to the mesopause at about 85km. The mesosphere (50-85km) gets cooler with increasing altitude primarily because CO2 emits IR radiation.
To add to Mr Clemenzi’s point, CO2 has been found to be near-uniformly mixed at all altitudes. Its partial pressure is just about the same throughout the atmospheric column.
Monckton of Brenchley August 24, 2016 at 11:47 am
To add to Mr Clemenzi’s point, CO2 has been found to be near-uniformly mixed at all altitudes.
Correct
Its partial pressure is just about the same throughout the atmospheric column.
Its partial pressure is not constant it decreases in line with the local pressure, it is the volume fraction (ppm) which is approximately constant.
How well-mixed? What are the flows the CO2 sensing sat. is now reporting?
CO2 appears to be very poorly mixed at low altitudes.
At low altitudes CO2 can vary by more than 100%, ie., about 300 ppm to over 600 ppm. I seem to recall that when I had exchanges on this with Ferdinand Engelbeen he provided examples where low altitude CO2 was more than 700 ppm,
It is because CO2 is very poorly mixed at low altitudes that the IPCC dismissed the restatement work by Ernst Beck. It is only at mid to high altitudes that CO2 becomes a well mixed (in relative terms) gas.
The scientifically-challenged Phil. seems not to appreciate that the partial pressure of a gas is the concentration of that gas: the ratio of its molarity to that of the atmosphere as a whole. Its partial pressure, therefore, remains constant at all altitudes, even though absolute atmospheric pressure diminishes with altitude.
Monckton of Brenchley August 25, 2016 at 1:44 am
The scientifically-challenged Phil. seems not to appreciate that the partial pressure of a gas is the concentration of that gas: the ratio of its molarity to that of the atmosphere as a whole. Its partial pressure, therefore, remains constant at all altitudes, even though absolute atmospheric pressure diminishes with altitude.
It is not I who is scientifically challenged but Monckton! The ratio of the partial pressure of a gas to the total pressure is equal to the mole fraction of that gas therefore as the mole fraction remains constant with altitude then the partial pressure decreases with altitude as the total pressure decreases. See Dalton’s law of partial pressures.
Phil. is not scientifically challenged. He is right.
” the partial pressure of a gas is the concentration of that gas”
Well, it’s proportional to it, for an ideal gas.
” the ratio of its molarity to that of the atmosphere as a whole”
Not true at all. The partial pressure is the pressure the gas would exert if there were no other gases present. As Phil. says, for a constituent of the atmosphere, it is basically mole fraction times atmospheric pressure.
Just for the elucidation of those reading, above about 25,000′ (sorry, old style)…CO2 has been classically considered an UPFLUX gas, as water is also considered (for pure IR transfer in the gaseous state) in the whole atmosphere.
Troposphere is 17 km at equator, 9 km at poles. 30,000′ is about 9 km. Power’s U-2 flew at 20 km.
I simply doubt that the clouds account 97 % of the albedo. I have relied on the research of Zhang et al. published in 2004, which is based on the huge measurement data from satellites and from the ground based stations. In the most common energy balance presentations, the SW flux from the surface is about 23-25 W/m2. This can be compared to the total outgoing SW flux, which is about 100-105 W/m2. If the surface reflected flux would be only 3 W/m2, it would mean a massive error in earlier studies. It should be noticed that the surface reflected SW flux can be measured on the ground-based stations. The satellite measurements cannot separate the sources in the clear sky conditions, whether the reflected SW flux originates from the atmosphere (aerosols and particles) or from the surface.
I still rely on the older results, which is according to my research paper in W/m2 fro the all-sky conditions: total flux 104, reflected by the clouds 68, reflected by the surface 23, and reflected by the atmosphere (air) 13.
In response to Aveolilla, I had read a paper a couple of years ago that had given 97% as the fraction of albedo that occurred above rather than at the Earth’s surface, and nearly all of that supra-surface fraction was attributed to clouds. But other values are possible, not that any of this has anything much to do with the determination of lambda-zero. The models find the value of lambda-zero broadly constant at or about 0.3, and that is the value I took, and, to the extent that the overwhelming preponderance of the albedo is of supra-surface rather than of surface origin, there is a good case for expecting the albedo to remain broadly constant under modern conditions. Insofar as the usual suspects may be correct in finding that albedo changes materially as a result of global warming, then they take account of that by treating the albedo changes as a feedback, whereas lambda-zero is determined before feedbacks are considered and, therefore, at today’s value 0.3 or thereby.
Monckton of Brenchley August 24, 2016 at 11:45 am
Oh, he’s good, our good Lord. In response to being told by myself and others that his numbers for cloud albedo are wrong, wrong, wrong, and despite being provided with references to back that up, he merely says something which is undeniably true, that “other values are possible”.
Yes, Lord Monckton, other values are indeed possible. What is NOT possible is your ludicrous 97% value, because it is wrong. Not just a little wrong, not slightly off, but way, way wrong.
If you could bring yourself to actually admit that you made a mistake, your stock would go way up … or you could continue to damage your reputation by issuing true but misleading statements that do not begin to acknowledge the depth of your incorrect claim.
w.
Trenberth et al 2011jcli24 Figure 10 displays the values of 8 models. Albedo ranges from 94 to 117 W/m^2 with an average of 102, +15/-8 . Compare that 23 W/m^2 band of uncertainty to IPCC AR5’s 261 year additional CO2 RF of 2.
TSI ranges from 1,323 to 1,415 W/m^2, +/- 45 W/m^2 from 1,368 & 342 because of the eccentric orbit. The RFs of GHGs are lost in the magnitudes and uncertainties of natural fluctuations.
The calculation of lambda by Monckton of Brenchley utilizing the Earth’s energy balance according to Planck’s equation is simple and clear except one thing. Two parameters, which have been used, are based on the experimental measurements: the temperature corresponding to the emitted LW radiation and the absorbed SW energy flux of the Earth. Both values are the average long-term values of the Earth. This calculation shows that the lambda is 0.267 K/(W/m2). It means that this value is tied to the experimental parameters of the Earth.
My question is, why we should change this result by multiplying the lambda with the Hölder coefficient? If so, then we admit that actually the simple energy balance equation used for calculating lambda is not valid. I think that it is and that is why the lambda value of 0.267 K/(W/m2) is correct.
Aveolilla is of course correct that if one differentiates the SB equation by reference to emission-altitude temperature and flux density one arrives at a value 0.267 Kelvin per Watt per square meter. However, the true value is determined (I know, because I determined it to make sure the models had gotten it right) by the integration of latitudinal calculations – actually, quite a nice problem in spherical geometry, to make proper allowance for the Hoelder Inequality. I determined the coefficient to be approximately 7/6. Multiply that by 0.267 and you get 0.312, which is the canonical value of lambda-zero.
Lord Monckton, you say:
I fear your habit of not citing or explaining a number of your claims is coming back to bite you. What is the basis for your “97%” claim?
I ask because if you look at e.g the Kiehl/Trenberth budget, it gives cloud reflection as being 78 W/m2, and ground reflection as being 24 W/m2, for a total of 102 W/m2.
CERES also gives about those figures, with the ground reflection being observed as being 24 W/m2, and cloud reflection being 76 W/m2, for a total of 100 W/m2 …
In neither case do I get clouds being responsible for 97% of the albedo or anything near it. How have you done your calculations? What am I missing here?
Regards,
w.
I also wonder about that?
In answer to Willis Eschenbach, a paper of 2011 (of which I foolishly kept no copy, for I read it on the fly) gave the surface fraction of total albedo as 3% and albedo from clouds (with some contribution from the blue end of the spectrum) accounted for the remainder.
But all of this is peripheral to the main point, which is that lambda-zero is, like it or not, currently determined by reference to the Earth’s emission temperature 255 K and not by reference to its surface temperature 289 K. That is where Willis went wrong. Or, as will shortly be revealed, partly wrong.
Monckton of Brenchley August 24, 2016 at 11:39 am
So … no citation.
Perhaps it is peripheral to the main point (to be reveal\ed shortly, it appears), perhaps it is not.
What it is not peripheral to is your unfortunate habit of making uncited, unreferenced, incorrect claims. As I said above, when a man tells me a term means something “by definition”, and then later admits he made up the term and thus there is no definition for the term … well, I get nervous. And when he doubles down by making an error that is as basic to the science as claiming clouds make up 97% of the albedo … well, the perplexity goes into overdrive. That error just tells me you know very little about albedo.
I looked at the 97% number, busted out laughing, and said “Christopher’s at it again” … and that, my dear friend, is a problem.
Finally, you say:
Unfortunate, you are not doing that. You are using a reference temperature of 297 (7/6 * 255, according to you), which is even warmer than the surface.
w.
Willis, don’t whine. You incorrectly determined lambda-zero by reference to surface rather than emission temperature, and it is now time to stop wriggling and admit it. It’s not a difficult point, and your diversions around it do not impress.
Mr Escenbach should really stop digging. The Earth’s emission temperature is of order 255 K, and the value H = 7/6 allows for necessary latitudinal variations.
Monckton of Brenchley August 25, 2016 at 1:41 am
To begin with, let me suggest that if you won’t listen to me regarding your unpleasant ad hominem attacks, you should listen to Viscount Brenchley, who said:
That Viscount Brenchley guy has got a good handle on the useless (and unpleasant) nature of ad hominem attacks. He knows that accusing a man of “wriggling” is just a way to avoid actually dealing with the issues that the man brings up for examination, and the Viscount strongly condemns these kinds of attacks. You should pay attention to him.
So please, leave off the accusations of “wriggling” and the like. Perhaps you “wriggle”, I wouldn’t know … but I assuredly do not. I’m known for the fact that I can assuredly be convinced that I am wrong, and that when I’m wrong I say I’m wrong and make no bones about it.
But whether or not I wriggle, jiggle, or dance naked under the moon is immaterial to the science. It is just a nasty, cheap, and untrue attack on ME rather than on my SCIENTIFIC STATEMENTS. It demeans you and damages your well-deserved reputation as a clever and sometimes inspired wordsmith.
Next, I indeed determined lambda-zero by reference to surface temperatures. But whether that is incorrect or not is the very subject in dispute. Once again you are prematurely trying to claim victory and close off debate, and as I said before, when someone announces that the the debate is over and they won, all that means is that a) they’d like very much for the debate to be over, but b) … it isn’t.
So let me suggest that you emulate the rooster and wait until it is actually dawn before you start crowing. And in the meantime, if you were to stop the puerile ad hominem attacks and actually reply to some of my questions and observations, we could have a discussion on the subject of lambda-zero, a fascinating subject indeed.
For example, you claimed that the global lapse rate is 6.5°C per 1000 metres elevation … but the CERES data not only says you are wrong because it varies from about 3 to about 9°C per thousand metres, but also … the area-weighted global average is only 4.8°C per thousand metres.
Now, that incorrect 6.5°C lapse rate is obviously used in your calculations … so what difference does it make to your results? It might be of no consequence, but since your number is 35% higher than the CERES observations, that seems unlikely … so what difference does it make?
Or you could continue to claim that pointing out your error is just a “diversion” and keep on not answering objections to your theory … up to you.
w.
Ref Willis Eschenbach August 26, 2016 at 5:01 pm
In the troposphere, there are 3 important Lapse Rates
* DALR – Dry adiabatic lapse rate, about 9.8 K/km
* ELR – Environmental lapse rate, 6.5 K/km
* SALR – Saturated adiabatic lapse rate, variable, 3 to 9.8 K/km, typically about 4.9 near the surface
When air rises via convection, it cools at the DALR.
When water condenses from rising air, it cools at the SALR (which varies with height).
However, when balloons measure the actual lapse rate, it is “usually” almost exactly the ELR.
In any sounding, there is a high probability of finding all 3 of those, DALR near the surface, SALR when clouds are forming, and ELR from the top of the clouds up to the tropopause.
The other important lapse rate is the surface inversion that occurs from shortly before sunset until a few hours after sun rise. (At the poles, this inversion lasts for several months!)
If you want a global average for models, the ELR (6.5 K/km) is the correct value to use.
Lord Monckton, I’m also confused by this claim:
Satellites, as far as I know, perceive the radiation from the surface, from the clouds, and from the atmosphere. For example, the satellites use that radiation to tell us the temperature of the cloud tops. How is this done if the satellites are solely perceiving radiation from the mid-troposphere as you claim?

Yes, there is something generally called the “effective emissions level” or the “effective radiation level”. But it is an EFFECTIVE level, meaning it is an AVERAGE of the various levels, not a real surface as you seem to assume.
Also, when you say “one optical depth” what frequency are you talking about? Because the atmosphere has different optical depths depending on frequency. The problem is that the effective radiation level is not the same everywhere, nor is the optical depth. And since radiation can clearly come from higher altitudes than the effective emission level, I’m sorry, but that radiation is coming from much less than one optical depth.
Nor is the effective emission level at “about 300 mb” as you claim without substantiation or citation. Here’s a map of the effective emission levels for both upwelling and downwelling IR:
SOURCE
Note that NOWHERE is the effective emission level at the pressure you specified, 300 hPa. Not at the poles, not at the equator, nowhere.
Finally, I note that you claim that the “Planck emission surface” (which may or may not be what the charts are showing since you have never bothered to define the term) has the same radiation up and down, viz:
This sounded nuts to me, so I went to MODTRAN, and used default values for GHGs. At 0.1 km looking up gives me 342 W/m2 downwelling, and looking down it’s 420 W/m2 upwelling radiation. And as I go higher, both values decrease until at 70 km., looking up gives me 0 W/m2 downwelling and looking down it’s 388 W/m2 upwelling.
The point I’m making is that the upwelling and downwelling IR are NEVER equal. At all levels, upwelling is larger than downwelling.
So it’s not clear what you mean when you say “incoming and outgoing radiation are equal”. This was a part of the problem I had with your curious term “Planck effective surface”, in that you seemed to claiming that the “Planck emission surface” was doing impossible things.
Thanks for the answers, these are puzzling questions to me that are not answered in your post or anywhere else I can find.
w.
The laws of thermodynamics require that in steady state as much radiation must go forth from the Earth as arrives thereat. There will, therefore, be some altitude at which, for each wavelength and in each place, outgoing and incoming radiation are equal. The mean altitude is determinable from the mean emission temperature.
Absolutely wrong! The incoming is in the wavelength band 0.25-3.0 microns, the outgoing in the band 5-50 microns, there is no requirement that they balance at any given wavelength. On the contrary the sum over all wavelengths is what must balance over the planet as a whole, the arctic in winter will still emit even though there’s no incoming radiation.
Agreed Willis.
Here’s an experiment using MODTRAN.
I zeroed out all the GHGs at the Midlatitude Summer setting (no clouds) looking down from 70km and a T offset of 5.8K. That gives a black body emission of 416 W/m^2 and a surface T of 300K (all emission from surface).
Restore all the GHGs except H2O and you’ll see the same BB curve with three absorption bands for CO2, O3 and CH4. So ignoring water for the moment this allows us to define a Planck emission surface for the permanent GHGs, emission 362W/m^2 for a surface T of 300K, needs ~12K warmer surface to reach 416W/m^2.
For CO2 (400ppm) the center of band is emitting to space at ~220K (12km), the Q-branch gives a spike at ~245K (35km), about halfway up the wings (~600cm^-1 & ~750cm^-1) it’s at ~260K (6.5km) and a little wider it’s back to 300K (0km).
It remains at 300K (0km) until the O3 band is reached at ~1000cm^-1 and then drops to ~270K (45km) then returns to 0km at about 1100cm^-1.
It remains at 300K (0km) until the CH4 band is reached at ~1250cm^-1 and then drops to ~280K (3.5km) before returning to 300K at ~1400cm^-1.
Addition of water reduces the effective altitude below 600cm^-1 and above 1200cm-1, giving 336W/m2 at a temperature of 312K, a further 19K rise is necessary to reach 416W/m2
So you end up with a rather funky graph, in terms of hPa:
cm-1 hPa
300 260
550 700
600 400
650 150
750 900
1000 1000
1050 550
1100 1000
1200 1000
1500 260
So not a chance of averaging out at 300hPa! My best guess would be that 300hPa would be the average for the CO2 band alone?
I hope the author’s knowledge and understanding of climate and the mechanisms of climate change are greater by far than his knowledge and understanding of Scotland. That he should write so much rubbish about my country makes me even more suspicious than I previously was of his “contribution” to the climate debate. If self regard and contempt for others were Olympic disciplines I suspect he’d have won golds in both.
Aha! A member of the National Socialist Workers’ Party of Scotland. Well, it’s my country too, but both my lovely wife and I were shocked to see the terrible decline of the past five or six years. Edinburgh is prosperous enough, because that is the center of the totalitarians’ web, and is draining the wealth away from everywhere else just as in the time of the Clearances. The same mistakes are being made. The same growing poverty is becoming visible. And the once-fair hills are scarred by bird-blending, bat-blatting windmills. How sad it is to see the decline that is the inevitable handmaiden of totalitarianism.
Fortunately, the people are beginning to notice. The democratic spirit of Scotland will arise again, as it has before, and sweep away the dismal bureaucratic centralizers. Not before time. But by then, our great birds will be extinct. The golden eagles, hen harriers, ospreys, capercailzie, blackcocks – all will be a memory, as those monstrous monuments to totalitarian folly, the 14th-century technology to address a 21st-century non-problem, rust in place. O Scotland of old, how we long for thee!
As I noted elsewhere NASA defines the “emission surface” as 100 km and where the 342 ISR & OLR must balance. The 333 endless loop does not effect this balance and can and should be simply erased from the picture.
It’s typical of a Tory to blame anything that happens under a Tory government on someone else. This time the excuse is not ‘a global recession’ or ‘the EU mandarins’ but a largely toothless Scottish National Party. For folk that prefer truth to bluster, the stated case by the SNP for Scottish independence is that Scottish politicians have zero power either with or without the current limited Scottish parliament to affect growth one way or another except in the rather limited promotion of Scottish goods; the sales of which have happily been enough to offset the oil-industry decline so far. That decline, which is inevitable, is, according to the independent Wood report, being made much worse by the numerous new Tory exploration taxes combined with the general inflexibility, inaction and malcomprehension of engineering industry that the Tories are famous for.
The reason Tories are as unwelcome in Scotland as a fart in a spacesuit is because they are to blame for its deindustrialisation in the ’80s – after which, having made many people unemployed they then started to taunt the newly unemployed Scots as ‘subsidy junkies’.
As for Wind power please note that if it will work anywhere then it will work in very windy Scotland and that currently it contributes to the 50% of power generated being renewable; not an unreasonable feat!
And nobody has clearly been put off touring Scotland by Wind turbines since tourism is 9% up on last year. Indeed many of us rather like them.
I wondered when the National Socialist Workers’ Party of Scotland would start sending its minions to post here. Well, here is the NSSAP policy on protection of Scotland’s great birds: Kill them! Kill them all! But that is not my policy, and it is not the policy of the people of Scotland.
The scientifically and economically illiterate NSSAP have achieved a world first in the dismal history of the dismal science. By closing down their last cheap, coal-fired power station and by depending on the vagaries of the wind, they have put themselves simultaneously at the mercy of a monopoly and a monopsony. When the wind is not blowing, they must buy electricity from England at any price England cares to charge; and when the wind is blowing too much, they must export electricity to England at any price it cares to pay. And the electricity these monsters generate is, in reality, thrice the price of coal-fired power.
If there is to be another independence referendum, this time prior to the vote, it should be made clear on what terms Scotland would depart the Union. Unlike the Brexit campaign it is very easy in advance to lay out the main terms of exit.This would obviously include (amongst other matters).
(i) whether Scotland may use the Pound (or whether it needs its own currency),
(ii) how much it is obliged to reimburse for the bailed out Scottish companies which were the main subject matter of the financial collapse,
(iii) whether Scotland should repay the overspend per capita resulting from the continued use of the unfair Barnett Formula,
(iv) if England is to help defend Scotland what contribution Scotland should make for this service, and
(v) the point raised by you regarding energy price, eg., England will buy the surplus Scottish electricity at the cost of the lowest coal fire generator price, and when Scotland needs to buy electricity to make up shortfall resulting from their renewables not providing the necessaries then Scotland will buy it from England at the most expensive strike price paid for wind (eg off shore wind strike price) even though England will be producing the electricity from fossil fuels (ie.take advantage of needs, supply and demand).
I have always considered that the SNP misunderstood how much revenues would be earned from oil (given that licences have already been sold, and the oil companies are not Scottish companies and the oil can be landed off-shore) and possibly even which oil fields would be in Scottish waters once one extrapolates the SW to NE line of the boarder out into the North sea.
if Scotland is to have any hope of making a go of independence, then it would need, in the early and formative years of independence, a right wing government who would prioritise earnings and export and minimise government spending making sure that it was balancing the books, and this would require pushing full ahead with Shale Gas extraction and cutting corporation tax and/or giving companies that relocate to Scotland advantage tax deals.
History shows that all socialist governments run out of money and do so rather quickly at that. Given that history, it would be likely that having the SNP in power when independence is obtained would be a disaster. The newly independent country would get off to a poor start from which it may never recover, or at any rate it would be a generational issue.
JasG: “The reason Tories are as unwelcome in Scotland as a fart in a spacesuit is because they are to blame for its deindustrialisation in the ’80s”
No, that was a combination of the militant trades unions and the Labour party’s nationalisation policies, which between them reduced not just Scottish industry but pretty much industry of the rest of the UK as well to irrecoverable basketcases, utterly dependent on exponentially increasing amounts of taxpayer subsidy and industrial disruption for exponentially decreasing levels of production.
All the Conservatives did was to put them out of their misery.
It is interesting to note that both Labour the Liberal democrats now possess only one seat, how do you explain that?
Scotland is a bit smaller than Maine w/ 5 times the population. “Solutions” are not universal.
Monckton ==> You have my congratulations, verily a Gold Star, for “Exemplary Patience”.
I submit, however, that eventually you have to acknowledge that some of these comments are simply “tweenage-style trolling” disguised as questions about your article and the science therein. If you keep replying to them, they keep trolling. I suggest giving them your best answer and then cutting them off, one at a time.
Good luck!
Kip Hansen:
You characterize “some of these comments” as “tweenage-style trolling.” Is there a way in which this characterization can assist us in reaching a logical conclusion regarding the cause of global warming? I don’t believe that there is. If your belief is contrary to mine let us hear your argument.
Reply to Terry Oldberg ==> My comment is addressed expressly to Monckton — I am communicating to/with the author of this essay, which is one of the major purposes of the Comment Section. It is not intended to add anything to the Climate Debate but simply to congratulate Monckton for his patience in dealing with the comments (with which, as an frequent guest author here, I am very familiar) and point out that he not only need not, but should not, over-engage with obvious trolls.
My view of the Comment Section here at WUWT is contrary to the seeming “consensus” view that this section is where combatants in the Climate Wars gather to snipe at one another endlessly, state the sections of the ‘Articles of Faith’, the talking points, of their side in the Climate Debate as if they were fact, denigrate one another, make random snide remarks, attack authors, attack ideas, and engage in all other sorts of non-constructive nonsense.
Mr Hansen is right: a number of trolls, no small fraction of them paid to cause disruption of these threads, pile in whenever I write. What is interesting is to observe that the trolling has become more subtle than before, as it slowly dawns on the paymasters that the official science is indeed as wrong as we say it is. They are now playing for time to go on profiting just a little longer from all this nonsense. And they show themselves up for what they are by their persistence in sheer inaccuracy.
I have had some very interesting comments privately from eminent scientists who would never dream of posting comments in fora such as this. Those comments show quite clearly that I have correctly and fairly represented the IPCC method ot determining lambda-zero. Though there is a lot wrong with that method, as my team will in due course demonstrate, to start the calculation at the emission altitude and not at the hard-deck surface is the correct first step.
“Those comments show quite clearly that I have correctly and fairly represented the IPCC method ot determining lambda-zero.”
Not true. The use of the effective emission temperature is correct, but the talk of Hölder coefficients is a Monckton fantasy. From Roe’s now much cited review:
“λ0 = … = 1/(4 σ T^3)
For an equilibrium temperature of 255 K, λ0 = 0.26 K (W m−2 )−1 . In practice, the finite absorptivity of the atmosphere in the longwave band means that, in global climate models, the reference climate sensitivity parameter, determined after removing all dynamic feedbacks, is 0.31 to 0.32 K (W m−2 )−1 (e.g., Hansen et al. 1984, Colman 2003, Soden & Held 2006).”
The “7/6” factor is due to absorptivity, not surface averaging, and is worked out from models. Soden and Held set it out (using an inverse convention):
“The strength of λ0 (Table 1) ranges from roughly -3.1 to -3.2 W m^2 K^-1. Intermodel differences in λ0 arise from different spatial patterns of warming; models with greater high-latitude warming, where the temperature is colder, have smaller values of λ0.”
Table 1 gives various model values.
Mr Stokes is, as usual, incorrect, as he would have discovered if he had done the math. Like it or not, the values of lambda-zero vary latitudinally, as his citation from Soden and Held makes quite clear, and as anyone familiar with spherical geometry would know. And small variations in lambda-zero from one model to another arise because the models assume slightly different latitudinal distributions of warming. Reducing the latitudinal variations to a single Hoelder-inequality coefficient leads to no error.
“Like it or not, the values of lambda-zero vary latitudinally, as his citation from Soden and Held makes quite clear”
That makes no sense. λ0 is defined as a global quantity. It has a single value, cited here as 0.312. It can’t vary with latitude.
What Roe and S&H say is that the modification from .26 to .31 is due to absorptivity in the atmosphere, determined by GCM. The effects of absorption do depend on the location of warming, and diffrent models reflect that to a small extent. In S&H Table 1, the (inverse) λ0 varies from 3.17 to 3.26. That is a far cry from saying that the correction is due to the difference between integrating T and T^4 )Hölder), as in the head post. There is nothing to support that in either paper.
Christopher, I’m with Nick on the question you haven’t answered, and me agreeing with Nick doesn’t happen often. Let me rephrase it.

Yes, you can do a double-integral to figure out the total radiation. OR, you can use actual measurements of 1°x1° gridcells and take an area-weighted average, which is what I did. Here’s that result.
Note that the situation is NOT as either Nick or Lord Monckton described. The negative of the slope of the line gives the value of the Planck parameter dT/dW. For most of the planet, there is no latitudinal change in the value of lambda-zero. But in the equatorial region, the slope goes NEGATIVE … how will using the Hoelder Inequality fix that?
Now, with my method (area-weighted observations), the calculated average LW radiation leaving the earth from all of those gridcells is ~ 240 W/m2. And we know this is correct, because that is the amount coming in.
SO … why would I need the Hoelder Inequality to determine the Planck parameter, when I not only do NOT need it to determine the outgoing radiation, but it gives me a WRONG ANSWER if the 7/6 fraction is applied? In both cases it’s just outgoing radiation, why one and not the other?
I also note that other than using argument by assertion, you have not answered Nick’s other question—why does the IPCC say the 7/6 factor is NOT from the Hoelder Inequality, but results from absorptivity? Yes, they could be wrong … but you not answering Nick’s questions is not a good sign.
Finally, although you keep claiming that the debate is over and you are right, the IPCC says you’re wrong … and whether they are right are not, that is clear evidence that the debates still rages, and you have NOT been declared the winner by anyone but yourself. Lucia thinks you’re wrong. I think you’re wrong. The IPCC thinks you’re wrong. Nick Stokes thinks you’re wrong.
So it is clear that the debate is far from over … and it will remain that way until you start answering the hard questions.
Finally, you say:
Right. And you have some data about cloud albedo that you can’t find. And you have data from John Christy that you haven’t revealed. I’m sorry, but anecdotes about unspecified claims made by un-named scientists do nothing but make me laugh. But if you want to go at it via anecdote, let me tell you that I have discovered a truly remarkable proof of my claims, which this margin is too small to contain, so obviously I must be right and the debate is over … you see the problem?
I know that you are used to your word being taken as gospel. But in the world of science, such claims are just anecdotes, and crappy anecdotes at best, whether they are told by an idiot or a Viscount. Without the claimed cloud albedo data, without the John Christy data, without the actual comments made by the scientists, it’s just more handwaving. The plural of “anecdote” is not “data”.
Best regards,
w.
PS—If your “eminent scientists” are unwilling to make their opinions public, claims about what they said are worthless, NOT because of you or whether you are trustworthy, but because we have no way to assess their veracity, value, or truth-content. In other words, your claims are neither verifiable nor falsifiable.
So I don’t care if they post them here, but for me to believe you, they’d have to post them somewhere and sign them. Because at present, we have no way to know if they understand you or not, we have no way to determine if their assessment is correct, we have no way to know if they are talking about the same thing you are, we have no way to know if they’ve read all of the very relevant questions that you have not answered, we don’t know if they’ve read my previous post, we don’t know if they are “eminent”, and we don’t know if they are “scientists” … and if you can’t tell if it is correct or not, if you cannot either verify or falsify a claim, IT’S NOT SCIENCE.
According to professor of climatology Judith Curry, the climate sensitivity, “…is broadly defined as the equilibrium global mean surface temperature change following a doubling of atmospheric CO2 concentration.” ( Response to comment, Climate, Etc, August 22, 2016 ). Under her interpretation of the terminology, delta T sub S is the change in the equilibrium global mean surface temperature. Thus lambda sub 0 is the ratio of the change in the equiilbrium global mean surface temperature to the change in the radiative forcing under a specified condition. The condition is that there are no “feedbacks” defined as anomalies in the forcings. Supposedly, one of these feedbacks is “water vapor feedback.”
In theorizing, Lord Monckton treats lambda sub 0 as if it were a constant. This implies that the Earth is a “gray body.” That it is a “gray body” is not a law of physics but rather is an assumption of Monckton’s theory. The feedbacks of Monckton’s theory add additional assumptions.
Monckton’s theory is a parameterized model. Usually, a parameterized model fails when its predictions are tested in samples drawn randomly from the statistical population that underlies this model. In the case under discussion, the model is insusceptible to failing as the statistical population does not exist. A model that is susceptible to failing and does not fail under testing is “scientific.” Monckton’s model is pseudoscientific.
Mr Oldberg is, as usual, confused and thus confusing. It is not I who treat lambda-zero as near-invariant in modern conditions: it is IPCC, to whose secretariat Mr Oldberg may care to direct any objections he may have. My presentation of the method by which IPCC and the modelers determine lambda-zero is not “Monckton’s theory”: for there is a great deal wrong with it, which I am at present working with a team of eminent researchers to correct.
The sole and simple purpose of the head posting was to prepare the ground for the revelations to come by educating the readership in how IPCC and the models do things at present. Then, when the true position is later explained, the differences between what is now done and what should be done will be clearer.
Mr Oldberg again sows confusion – I wonder whether he does it deliberately – by waffling uselessly about samples drawn from a statistical population. The quantum of solar irradiance reaching the Earth’s surface is not a statistical population: it is a measurement. So is the albedo. Lambda-zero follows from these two quantities alone. It really isn’t difficult, but Mr Oldberg, as usual, pompously waffles entirely off the point.
If Mr Oldberg thinks IPCC’s model (not “Monckton’s model”) is pseudoscientific, then let him address his pseudo-wisdom to the IPCC secretariat, which will rightly give him short shrift. There is a lot wrong with IPCC’s model, including its use of lambda-zero, but it is correct that at the outset the calculation is performed at the emission altitude and not at the hard-deck surface.
Monckton of Brenchley August 25, 2016 at 1:25 am
Since Nick Stokes clearly showed above that the method used by the IPCC (GCM-determined atmospheric absorption) is TOTALLY DIFFERENT from the Monckton method (Hoelder Inequality), this most assuredly IS “Monckton’s Theory” and is not that of the IPCC. Please stop claiming you are explaining what the IPCC did—Nick Stokes has shown that that is simply not true.
w.
Twas Dr. Johnson who said that “the only good thing to come out of Scotland was the road to England….”
Not strictly true as we’ve had generations of good quality graduates following that road and enriching our businesses and universities.
As others have said, its time the SNP concentrated on providing some realistic governance and policies for their constituents and stopped the silly Braveheart posturing.
The recent POO has left Salmonds and Sturgeons economic projections sunk without trace.
Actually, Mr Fishy and Ms Fishier could not make the national accounts come anywhere close to balancing even at an oil price of $100 a barrel. Now that it’s only $50, there’s an even bigger black hole in the finances.
“the Planck emission surface, whose mean pressure altitude is about 300 hPa up in the mid-troposphere.”
Note: 300 hPa *up*, ie 1000 hPa sfc – 300hPa -> ~700hPa pressure level.
If I missed this point being made already, apologies.
No, the meaning is improved by adding a comma after 300 hPa. The 300 hPa absolute pressure level is high up in the troposphere. The 200 hPa level is about the tropopause. The middle of the atmosphere has a pressure altitude of 500 hPa. Surface pressure is 1000 hPa.
Also, the 15 micron CO2 emission curves vs altitude vary with concentrations, see the link for a good explanation why IR emission has a vertical gradient, not a fixed altitude. The gradients have a superficial resemblance to Planck curves.
http://clivebest.com/blog/?p=4475
Lord Monckton’s meaning is clear, he’s talking about 300 hPa, not 700. However, as with many of his numbers, this is an average given without the slightest attempt to support it.
w.
Maybe Monckton should record his thoughts and opinions on Trip Advisor? Which may be a more appropriate place his his sensitive reviews than this site. I’m sad that he is so appalled by the state of Perth, it is a lovely town, and it’s deterioration is heartbreaking. I wonder if Monckton realises that although the SNP are in power in Holyrood as a devolved government, the Federal Government in London with far more economic clout, has a been in power for ten years with an austerity package which seems to have facilitated similar results in Towns and Cities across the UK. I think we should be told.
I used to work problems with radiative transfer in the context of high-energy laser weapons. Out of that background, it is beside the point to worry about the thermodynamic behavior of the atmosphere, since the interaction between the Earth (surface temperature) and outer space (4 K background) is driven purely by radiative processes. The atmosphere has so little thermal mass, it can be neglected. On a geophysical scale, it is thinner on the Earth than the skin of an apple is on an apple. Radiative transfer processes happen orders of magnitude faster than conduction or convection. And the atmosphere is mostly in radiative equilibrium anyway, so it is “bleached” as we would put it (in our trade), and only serves to function as a scatterer for low infrared, regardless of what temperature it has.
But to remark to Lord Monckton on a personal level, I have never visited Great Britain, to my regret. I have family heritage that I esteem, springing from one William Dunn (1670-1745) of Louth, Lincolnshire. I would like to visit Lincolnshire some day. According to Wikipedia, the countryside is very pleasant, and not unlike the Puget Sound. I am glad that the people of Great Britain reclaimed their own by stepping away from the “EeeUuuu.” As a Yank observer, it seems to me that the great people of Britain have been truly trashed by their leadership, and that high ideals have been trampled in the process. This is a terrible passage. You bring hope with the brilliance of your light. Thank you, God bless you, God bless the people of the British Isles, and God save the Queen.
Thank you for those kind words, Michael.
Now we’ve freed ourselves from the dead hand of the EU, hopefully we can live up to your hopes and expectations.