Guest essay by Christopher Monckton of Brenchley
Yet another screaming Reuters headline, this time Earth on track for hottest year ever as warming speeds up, precedes yet another screaming, inaccurate, prejudiced Reuters “news” article about the totalitarians’ current hot topic.
http://sustainability.thomsonreuters.com/2016/07/21/earth-on-track-for-hottest-year-ever-as-warming-speeds-up/, written from Geneva, cites the World Meteorological Disorganization as saying the Earth is warming at “a faster rate than expected”.
Um, no, it isn’t.

The Global Warming Speedometer for January 2001 to June 2016 shows observed warming on the HadCRUT4 and NCEI surface tamperature datasets as below IPCC’s least prediction in 1990 and somewhat on the low side of its 1995 and 2001 predictions, while the satellite datasets show less warming than all IPCC predictions from 1990 to 2001. Later IPCC predictions are too recent to be reliably testable.
All of the observations have been much affected by the recent el Niño spike, which may yet be followed by a correcting la Niña, in which event it is possible that the Pause may resume, though don’t bet on it yet. Theory would lead us to expect some warming over the medium to long term, though on balance not very much.
Now, was it really too much work for Reuters, which prides itself on its numerical data, to check IPCC predictions against observations, rather than rebarbatively regurgitating a handout that any of its customers could have downloaded from WMD all by their little selves?
“June,” says Reuters’ gripping work of fiction, “marked the 14th straight month of record heat.” Now, let me see, when Ted Cruz displayed WUWT’s Pause graph in the Senate last November, at which time there had been no global warming for 18 years [9] months, was there not a great deal of whining about how a mere 19 years was too short a period to draw any conclusions?
Yet Reuters, the supposedly bankable financial/statistical news agency, unquestioningly recycles self-serving WMD propaganda to the effect that 14 months is enough to confirm what Private Fraser in Dad’s Army had long told us: that “We’re a’ doomed!”

“We’re a’ DOOMED!”
Next, Reuters unquestioningly reports a WMD spokesman as saying: “What we’ve seen so far for the first six months of 2016 is really quite alarming. This year suggests that the planet can warm up faster than we expected in a much shorter time … We don’t have as much time as we thought.”
Er, no. Just look at the predictions and then look at the measured reality, even after all the data tampering. It ought to be plain even to the meanest journalistic “intelligence” at Reuters that the planet is actually warming up far more slowly than They had expected.
Next, Reuters unquestioningly repeats that “The average temperature in the first six months of 2016 was 1.3° Celsius (2.4° Fahrenheit) warmer than the pre-industrial era of the late 19th Century, according to space agency NASA”.
Unh, no. Even if one relies upon the most tampered-with and prejudiced of all the global temperature datasets, that of “space agency NASA”, the rate of global warming since the dataset began in January 1880 has been less than 1 degree, equivalent to a mere 0.7 degrees per century. Not exactly scary. It’s well within natural variability.
Is there no longer anyone at Reuters with enough elementary mathematical knowledge to know that in statistics one should not make arbitrary comparisons between periods of months and periods of decades? Better to determine the trend on the data:

Next, Reuters unquestioningly “reports” that “under the Paris Agreement, nearly 200 governments agreed to limit global warming to well below 2 C° (3.6 F°) above pre-industrial levels, while ‘pursuing efforts’ for a ceiling of 1.5 C° – a lower limit already close to being reached.” Aargh, no. Taking the mean of all three surface datasets, the warming trend since 1880 is little more than 0.9 degrees, leaving 0.6 degrees to go before the new arbitrary “ceiling” of 1.5 C°” is reached, and 1.1 degrees to go before the pre-existing arbitrary “ceiling” of 2 C° is reached.
Is there no one at Reuters who can do elementary least-squares linear-trend analysis? The quite unnecessary proposed “lower limit” of 1.5 degrees is by no means “close to being reached”.

Next, Reuters unquestioningly cites an “expert”: “There’s almost no plausible scenario at this point that is going to get us anything other than an extraordinary year in terms of ice (melt), CO2, temperature – all the things that we track.”
Ooof, no, no and thrice no.
As for ice melt, yet another totalitarian propaganda expedition intended to “raise awareness” of climate “catastrophe” by trying to sail around the Arctic in the summer has just come a cropper owing to – er – too much ice. Neither the North-East Passage nor the North-West Passage is open, so the expedition is holed up in – of all ghastly places – Murmansk. That’ll teach Them.
I once saved the owners of the swank rent-a-suite megaship The World from losing a fortune when her otherwise perfectly sane skipper had conceived the notion of sailing her through the North-West Passage, and had sold them on the idea.
The World was lying in Fremantle at the time. My lovely wife and I were spending a few days aboard. We were grockling all over the ship when, by mistake, we stumbled into the skipper’s day cabin, where he and his brother officers were merrily laying plans to penetrate the North-West Passage.
The skipper took us up to the bridge and, with that faraway gleam in his eye that bespeaks the adventurer, told us all about his idea. I called up the University of Illinois’ global and Arctic sea-ice data on the ship’s computer and gave the skipper a short lecture on the very few occasions over the previous century or two when the North-West Passage had been open.
The Arctic, I said, was unpredictable, wherefore he should not be too ready to join the True-Believers in subscribing to every barmy but transiently fashionable dogma of the New Religion. He saw at once that the thing was impossible and cabled the owners to tell them to think again.
Can we perhaps get just one Reuters “journalist” away from the various global institutional profiteers of doom in whose lavishly-marbled, planet-destroyingly air-conditioned halls they spend their useless days for long enough to check the data from the real world outside?
Here is what the University of Illinois’ data at WUWT’s sea ice page show. Not very scary:

According to the National Snow and Ice Data Center’s graph, also available at WUWT’s sea-ice page, it’s possible, though not all that likely, that there will be no Arctic icecap for a week or two this summer:

Even if the ice disappears for a week or two so what? The same was quite possibly true in the 1920s and 1930s, which were warmer than today in the northern hemisphere, but there were no satellites to tell us about it. Would a couple of weeks’ total ice loss drastically alter the Earth’s albedo? No: the latitude is too high, and in any event nearly all of the Earth’s albedo is reflection from clouds: the surface has very little to do with it, except perhaps during the snow-cover season in the Northern Hemisphere winter, but four-fifths of the snow-cover albedo comes from the land, not from the Arctic Ocean.
As for CO2, notwithstanding all the totalitarian propaganda about the need for the world to repent of its sins of emission (propaganda for which Reuters has been a relentlessly and cloyingly sycophantic cheer-leader), emissions continue to increase at a rate somewhat above IPCC’s do-nothing, business-as-usual case in 1990:

If the real purpose of all that propaganda had been to reduce the world’s output of CO2, no doubt that output would have begun to fall by now. But the true purpose, which is being achieved, is the war on and destruction of the U.S. coal industry, formerly one of the largest financial supporters of the Republican Party.
As far as I can discover, Reuters’ idle “journalists” have never reported that the one IPCC prediction that has undershot reality is its prediction of the global CO2 emissions rate. The net effect of all those international conferences has been precisely zero.
As for temperature, will this really be an “extraordinary year”? Let us do what no Reuters “journalist” has the knowledge, wit or interest to do, and put today’s temperatures in the geological perspective of the last four interglacial warm periods.
All four of those warm periods, over the past 450,000 years, were as warm as, if not warmer than, the present. All those prehistoric SUVs, one supposes.
As far as I can discover, Reuters has never pointed out that, sub specie aeternitatis, there is nothing in the least exceptional about today’s global mean surface temperature. The world has seen it all – and survived it all – before.

Next, Reuters gets round to admitting the existence of the recent strong El Niño spike, though, of course, the propagandist who wrote the piece somehow fails to point out that this is a natural and regularly-occurring event, not a sudden consequence of global warming:

El Nio spikes in 1998, 2007, 2010, and 2016. The rate of global warming since 1990, equivalent to 1.26 K/century, is a long way below IPCC’s predicted 2.8 [1.9, 4.2] K/century interval in 1990.
Instead, Reuters unquestioningly parrots the WMD’s Secretary-General: “Climate change, caused by heat-trapping greenhouse gases, will not (disappear). This means we face more heatwaves! More extreme rainfall!! And potential for higher-impact!!! tropical cyclones!!!!”
Well, one might expect warmer weather to bring more heatwaves. But does Reuters really need no less a personage than the WMD’s lacklustre, overpaid Sekjen to tell us that?
And, even then, would it not have been better if Reuters had checked the best weather records in the world, those of the United States, to see when the frequency of record daily temperature maxima – the measure of heatwaves – was at its highest?
The answer, as the mere facts show, was in the 1930s, when CO2 concentration had barely risen above its pre-industrial value.

As for “More extreme rainfall”, even IPCC, both in its special report on extreme weather and in its Fifth Assessment Report, has been compelled to concede that there is little evidence for “more extreme rainfall” to date, and not much reason to expect it.
Could not Reuters’ “journalist” have sobered up for long enough to totter along from the marble halls of the WMD (headquartered in Geneva, where she is supposed to have written the story) to the marble halls of IPCC (also, conveniently, headquartered in Geneva, where the authorities are more indulgent of official corruption than anywhere else on the planet)?
As for “more high-impact tropical cyclones”, the graph of accumulated cyclone energy over recent decades gives the lie to that one:

The accumulated cyclone energy index from weatherunderground.com
Next, the Reuters’ propagandist provides her own opinion that “Repeated extremes, such as heatwaves! downpours!! or droughts!!!, could encourage more action to limit greenhouse gas emissions.”
We’ve dealt with heatwaves and downpours. As for droughts, the most comprehensive recent survey, Hao et al. (2014), shows that there has been something of a decline in the fraction of the global land area under drought:

Finally, the open propaganda proposition: Reuters quotes a “climate expert” [x, an unknown quantity; spurt, a drip under pressure] at the International Institute for Applied Taxpayers’ Money Gobbling in Vienna: “Research shows that for the general public extremes make climate change more tangible, more understandable. It could help to motivate people to engage in climate action, and do something.”
Translation: “The data don’t support our climate profiteering. The facts don’t support it. The graphs don’t support it. Even the weather doesn’t support it. There has not been enough bad weather to let us get away with using it as an excuse for gobbling still more taxpayers’ money. Something must be done, and soon, or we shall have to work for a living.”
Is Reuters’ story, like so very many others it has published in sullenly prejudiced furtherance of the the climate scam, downright fraudulent?
Just type the words “Reuters disclaimer” into a search engine. What comes back, in with-knobs-on capitals, is this:
“THOMSON REUTERS EXPRESSLY DISCLAIMS ALL WARRANTIES, EXPRESSED OR IMPLIED, AS TO THE ACCURACY OF ANY THE CONTENT PROVIDED, OR AS TO THE FITNESS OF THE INFORMATION FOR ANY PURPOSE.”
It’s not as though we hadn’t been fairly warned that Reuters is just another junk website peddling totalitarian propaganda rather than mere facts.
However, Reuters takes money – and a lot of it – from various organizations on the premise that, even if it does not always achieve accuracy and disinterest, it will at least attempt these things. Its “Handbook of ‘Journalism’” opens with these ringing words:
“Everything we do as Reuters ‘journalists’ has to be independent [eh?], free from bias [what?] and executed with the utmost integrity [really?]. These are our core values [values?] and stem from the Reuters Trust Principles [principles?]. As a real-time, competitive news service [news service?] whose reputation rests on reliability [coulda fooled me], we also value accuracy [pull the other one, squire, it’s got bells on] …”
The Ten Absolutes of Reuters “Journalism” include these: always to hold accuracy sacrosanct, to correct errors openly, to strive for balance and freedom from bias, to reveal conflicts of interest, to guard against putting “journalists’” opinions in a news story, and not to fabricate. [Pass the anti-giggle potion, Hermione!]
Notwithstanding the capitalized, butt-covering disclaimer, then, Reuters is holding itself out as an organization whose news “journalists” will at least make an effort to be accurate, honest, impartial, unbought, factual and truthful.
Except on climate change, it seems.
Now read this posting again. Does wafting around the gilded palaces of Europe’s corruption capitals and vomiting out, year after year, totalitarian rentaquotes about Man’s imagined (and largely imaginary) influence on climate that are manifestly, repeatedly and materially at odds with the facts and the data, and are challenged by an increasing body of published scientific research, including 250 “consensus”-busting papers this year alone, demonstrate any recognizable effort whatever to be accurate, honest, impartial, unbought, factual or truthful?
If, like me, you don’t think so, go to https://reuters.zendesk.com/anonymous_requests/new, leave a comment telling them what you think, and send monckton {at} mail.com a copy of your message and any answer you get.
Many years ago, I used to know the then Chairman of Reuters, Lord Barnetson. He was an honest man and would not have tolerated garbage like Reuters’ latest. It may be that someone in the organization still has a conscience, as he did.
Give it a try. We should not only talk to each other here but also quietly let the outside world know the truth. The truth will prevail eventually, but the more we call out the peddlers of falsehoods the sooner it will prevail, and the fewer innocent people the terrible policy consequences of their falsehoods will kill.
Reuters – just another hard left outlet for lies. 👎🏻
Is anybody at Reuters capable of least square analysis?
Uh, no.
From what I have seen in the cv’s of the bylines of the dozen or so “journalists” cranking out dreck for the MSM, Moody, Doyle, Berenstein, et al range from 9 months out of school, to food editors, to unemployed stand up comics. The editor walks into the meeting, “I want 2,000 words on the evils of climate change for Sunday, who wants it?”
These people are paid to write, not think, especially not critically.
Even if one relies upon the most tampered-with and prejudiced of all the global temperature datasets, that of “space agency NASA”
I dispute this assertion , have you checked the Bureau of Meterology .
Correction: “18 years and 19 months” – should be 9 months.
Moderators, please fix!
Done
Well for what it’s worth my comment to Reuters was.
GENEVA – The earth is on track for its hottest year on record and warming at a faster rate than expected,
Really? This statement is wildly at odds with all the available data sets. Did you really need to parrot a ridiculous claim and imply that it was real?
With a couple minutes of effort it would have been easy to establish the fact that in fact the warming throughout the last 30 years and especially since the turn of the century has been consistently and dramatically lower than all of the popular widely reported predictions. If your author wasn’t even willing to do the very limited research required why did they bother to write this at all and why did you publish it.
As a person who dedicated his life to teaching science and the scientific method to thousands of students I can tell you that articles with this kind of crap masquerading as science do enormous damage to the scientific literacy of the population and as a result do damage to real scientists everywhere and to society as a whole.
Well done!
As long as they have a source they can throw under the bus, they will get away with almost anything.
Many of these nuts are willing to be listed as sources and make outrageously alarmists claims, truth be damned, because after all, only they are smart enough to truly comprehend what is really going on. Liberals really think they are saving us from ourselves. And THEY WANT MONEY!
I’ve thought Reuters has been turning to the Left for quite some time. There is demonstrably no more objectivity there today than one would find with the NYT or WaPo. Lots of servicing of narratives!
UNEP, April 10, 2014
“Thomson Reuters and United Nations Environment Programme (UNEP) have announced collaboration on Executive Perspectives on Sustainability – …”
More at:
http://www.unep.org/newscentre/Default.aspx?DocumentID=2787&ArticleID=10826
Of course the crux of AGW is not that it is warming but that warming can be attributed to fossil fuel emissions. The only empirical evidence presented for that are (1) a high correlation between cumulative emissions and cumulative changes in atmospheric CO2 and (2) a high correlation between cumulative emissions and cumulative warming (i.e. surface temperature). Both of these correlations are spurious and therefore they do not serve as empirical evidence.
http://papers.ssrn.com/sol3/papers.cfm?abstract_id=2725743
http://papers.ssrn.com/sol3/papers.cfm?abstract_id=2642639
The correlation between the time-integral of sunspot number anomalies and the average global temperature trajectory approaches perfect (97% match since before 1900)
I would only add that, if one goes back a century or more, the correlation between cumulative emissions and temperature is extremely poor. There is no evidence of causation.
The crux is that warming can be attributed to man, and is catastrophic. The theory is CAGW. Or else why all the fuss?
Not only is there no evidence for causation, but the true link between emissions and temperature could be albedo. But if that were true, then Co2 might be innocent.
chaamjamal
You may be right for point 2), but you are wrong for point 1). There is an extreme high correlation between accumulated human emissions and the accumulation of CO2 in the atmosphere. As you have shown, that is a necessary but insufficient condition. In this case the correlation is causation, as it is supported by:
1. The mass balance: less increase than emissions.
2. The 13C/12C ratio decline
3. The pre-bomb test dilution of 14C for carbon dating
4. The process characteristics (sink rates in average are linear increasing with CO2 pressure above steady state).
5. The oxygen use, which shows that vegetation is a net sink for CO2
6. The oceans pH and pCO2.
See further: http://www.ferdinand-engelbeen.be/klimaat/co2_origin.html
For the nth time: your second paper is nonsense: of course you don’t find a correlation between CO2 emissions and CO2 rate of change for the simple reason that with detrending you completely removed the influence of the emissions! It is what remains from the emissions (as mass, not the original molecules) which accumulates in the atmosphere, not the – temperature caused – variability which integrated doesn’t add more that 13 ppmv of the 110 ppmv CO2 measured since the depth of the LIA…
Read Lord Monckton and expand your vocabulary! “Rebarbitavely.” “Grockling.” “Sub specie aeternitatus.” Marvelous! And your arguments are wickedly entertaining. Are you sure you weren’t Oscar Wilde in your last incarnation?
Expanding one’s vocabulary provides more succinct expression in fewer words and is an effective way to retain memory. My dad was adamant about that.
English probably has the most words of any language of any non-agglutinative language. It is a Germanic language with influence from the Norse language of the Vikings, old French from the Normans, Latin and Greek from the church. There are many similar words with slightly different meanings, i.e. liberty and freedom. There are many words that mean the same thing, i.e. pig, hog, and swine. It cannot be an easy language to learn with all those words, and then having to remember how to spell those words.
@Ronald P Ginzler
Agreed – great read – and I had to look those three terms up too – as you have to. So thanks m’lud
You don’t need to be Oscar Wilde to enjoy the benefits of a Classical education. Pity you have to pay a lot of money for it, it’s not meant for the ‘plebs’.
Confirmation once again of Winston Churchill’s assertion that the British and the Americans are two great peoples separated by a common language.
Didn’t know those three either. “Grockling” got to me. Read the definition and immediately said to myself “now there is a word that should have appeared in Hitchhiker”s Guide To The Galaxy”.
Eugene WR Gallun
I think that the Reuters doomsday reporting only reflects the current market in the media. If you want the boss to promote you, you write something sensational. Reporting that climate change has not been particularly extraordinary since the turn of the century will not get you a raise, particularly if your employer has invested in renewables or is controlled by liberal “polititricksters” (to quote my Jamaican friends).
Hmm, somehow cousin “It” found his way into “politricksters”.
Pop Piasa — cousin “it”??? From “The Adam’s Family”???? — Eugene WR Gallun
“If if bleeds, it leads”. Panicmongering is a traditional storyline, and endemic to the press in general.
Sad to see the dusk of trust of so many previously venerated institutions . I knew Peter Job and Glen Renfrew thru analyst meetings in NYC because Renfrew had purchased IP Sharp Associates APL which I had worked for in 1980 for 13 days before being fired for insubordinate use of the email system . I had a brief but impressive chat with Renfrew about the possibilities of what now would be called “high frequency trading arbitraging foreign exchange if you were sitting at the center of Reuters dataflows with a supercomputer exploiting the intrinsically relativistic relationships induced by the
n - 1degrees of freedom between trades inncurrencies . He’s one of the few people I can imagine understanding virtually instantly what I was saying .My nephew would like you. He does that for Citadel right now.
Entertainment!
That which has been written is only entertainment. Therefore not liable in any Court of Law.
After all, when the snow of summer is up to our knees, it (the falsehood of their words) will be all apparent.
Ha ha
Entertainment!
That which has been written is only entertainment. Therefore not liable in any Court of Law.
After all, when the snow of summer is up to our knees, it (the falsehood of their words) will be all apparent.
Ha ha
[thanks for the edits.]
If Fraser uttered “We’re doomed” we need Corporal Jones’ “Don’t panic!”
I think we could use Sergeant Schulz, at least he never claimed to know anything.
“I know nothing, I see nothing, I did not even get out of bed today!” (Or something to that effect.)
Captain Mainwaring had the right response, “Stop rolling your eyes Fraser”!
Maybe off topic. Maybe not. But where I live it seems that between TWC and NWS there seems to be an increase in “Excessive Heat Warnings” that either never materialize or the actual temps and/or heat index is less than those in the past when no or fewer “Excessive Heat Warnings” were issued.
Maybe that’s just my impression. Maybe I’m just not impressed by the impressions.
Yeah, those gloom-and-doom forecasts are getting tiresome.
The MSM are definitely hyping the weather now, making it look like we are just going from one extreme to another, and humans are the cause. “Eighty-two million Americans under threat!” they proclaim breathlessly.
The local meteorologists are completely different, and give you the proper perspective on what is happening with the weather, for which, I am eternally grateful. 🙂 No hype, just the facts.
I am still annoyed about WaPo’s change to the US weather forecast map to make temperatures appear warmer. Suddenly, each range of 10 degrees shifted colors: the range that was green shifted to yellow, the range that was yellow shifted to orange, etc. As a result, the map has “warmer” colors in all seasons, but is particularly misleading in the warmer months. It makes even the Yankee and Canadian summers look unbearably hot. (A good chunk of Canada is pictured along with the lower 48 states.) People were annoyed when the change occurred, with many saying it messed up their “sense” of how warm and cool temperatures were around the nation. I am sure there has been a subliminal effect on people’s weather “memory”, etc.
Then again, print and newspapers are dying, so I suppose that particular sleight of hand will not be an issue for long. Regardless, DC area summers are not any hotter now than they were over the last three decades. The next several days are not going to be fun, but they are nowhere NEAR unprecedented.
Its a trick the UKMO and BBC have been playing for years. They announce in the weather forecast the max possible temperature not the most likely. I’ve tried it out on several occasions. Phone someone in the UK and ask them what the weather is like that day and check their response against the actual outcome. Its fascinating. They always quoted the BBC max temperature even though no where reached it and they live in rural England.
The Weather Underground forecasted a high of 98F a couple days ago (western MD). I knew better and the high was only 90F. Happens all the time.
Let’s see what happens Monday morning when all the ACs are turned on again?
Back in the 60’s and 70’s we had no “excessive heat warnings” because people hadn’t been stupefied yet enough not to know you should seek shade and not move around much when it gets hot out! Yesterday afternoon, here are these flaming idiots out running, riding bikes, torturing their dogs running them on hot pavement. “No sense, no feeling.” THAT’S why for liability purposes alone as I see it the NWS “warns” us.
In the old days the firemen would put a sprinkler on a hydrant so city kids could cool off.
Gunga Din
A crime wave begins when the News begins reporting crimes. A crime wave ends when the News stops reporting crimes. The number of crimes committed remains pretty much a constant. I read an article in “Reader’s Digest” almost 60 years ago that taught me that.
What you describe about “Excessive Heat Warnings” is exactly what we are seeing with the “Black Lies Matter” News phenomena.
Eugene WR Gallun
crime now operates on climate science principles ,at least here in the uk eugene . a crime wave begins when the police decide to start recording a particular type of crime,and ends when they move on to recording some other type of crime.
in recent years recorded knife crime in some areas of the uk has been completely out of whack with the numbers of patients receiving treatment at accident and emergency departments.
http://www.independent.co.uk/news/uk/crime/14000-knife-victims-a-year-860857.html
of course it may just mean more people have taken up stabbing themselves as a hobby /
New Zealand National Radio (public funded, non-commercial) is up to the same tricks. During the peak in this last El Nino they ferreted out 2 stations out of total or 31 ‘master stations’ used in measuring trends that broke ‘all time records for the month”. The record from these 31 stations go back a to a maximum of a whopping 27 years. All but 2 are in cities or airfields. Someone with an agenda must be feeding them this information. Reporters don’t have the time or gumption
Have some respect for tradition. Heresy.
I guess I should put this in the proper thread.
My local meteorologist compared this current heatwave in Oklahoma to the “hottest year evah” of 1936, (around here, anyway) and he said Oklahoma had 65 days over 100 degrees during 1936 (36 *straight days* over 100), which compared to 38 days in 2012, and 7 days in 2013, and 7 days in 2014, and three days in 2015. Do you see a trend? Today, we hit our first 100+ temperature of the summer at 101 (107 heat index).
It’s laughable to claim the 21st century is hotter than the 1930’s. Too bad the original surface temperature database got hijacked by nefarious characters posing as climate scientists. If we had that, we could draw temperature charts that didn’t look nearly as scary as the hockey stick charts, and looking at them, people wouldn’t be fooled into thinking the world is about to come to an end from overheating, because it would be obvious from the chart that we were not overheating. Like the chart above, which is a better representation of reality than any current NASA or NOAA surface temperature chart.
A reporter would look at a chart like that and say, “What extreme heat?”
I don’t understand the scale of that graph. There’s only 365 days in the year, so it is not days. I don’t think it is degrees either.
The y-scale of the graph is stated to be the frequency of record daily temperature maxima.
Javier
It’s the number of days x the number of stations
I assume it uses USHCN, of which there are about 1200, so a total of about 400,000 ish
Thank you
I notice that too in southern Saskatchewan. The local news channels always provide the record temperatures and we rarely beat those from the 1930s as well as a surge around 1908ish. But when I point this out to friends I’m told that that is weather NOT climate!
In this context does the expression “all time high temperatures” mean temperatures that were higher than all previous temperatures or temperatures that were higher than all temperatures up till now?
Straight North of Oklahoma in Saskatchewan, Canada we still have an all time high of 47C or 116.6F from 1937. Lots of highs for specific dates are also from the 30’s.
Sir Crispin Tickell anyone?
I debated against Tickell in London a couple of years ago. He lost.
Yet Reuters Foundation influence is real… including a carbon strung Trudeau in Canada.
I must confess that before my own ‘road to Damascus’ I was gleeful for what those ‘comedians’ did to you in Australia, a ‘silly Denialist’ as I saw you then. In retrospect you should have not batted an eyelid and gone along with their nonsense, but bah. I really enjoyed watching subsequently the video you for the Paris CONference (despite the atrocious technical quality). “Quid Est Veritas?” Indeed! Thankfully, no need for Vino to divine that one.
“Sir Crispin Tickell anyone?”
Hey, no relation, eh?
Did you make Monbiot a fellow of green college? If not, you’re OK. LOL
I saw this same basic headline in a News Corporation masthead newspaper, The Australian, and could not believe it. Similar schlock had been on the Australian ABC (Oz=BBC) and in the Fairfax media ( Oz=Guardian Lite).
That said I take some comfort. Consider this:-
Q What kind of scientific sub prime scam artist would come out with such utter crap given the recent El Nino spike?
A The sort of dribbledick CAGWarmist dribbledick who knows damned well that once the La Nina kicks in such statments will be impossible, that El Nino will dissolve into the historical record and the ‘pause’ with have been re-establshed statistically.
As for the MSM, they do not really give a a rats derrier, a headline is a headline is a headline. “Lies, Damned Lies and Climate Statistics”, “Scientists Lied to Secure Ongoing Funding”, “CAGW was just a hoax!” are just as good a headlines and there is a time for everything under heaven.
How I love your beautiful, British sarkasm, Lord, it’s great.
The Climate Speedometer, though may be a bit complex for normal journalists to understand, though. Perhaps you should ask this Reuters journalist to provide her assessment of it?
Get the anti-giggle potion from Hermione first.
“Sarcasm” in this case.
Although I feel leading off with “Tamperature” is just a little confrontational for the tastes of neutrals, new to the subject.
It is a fact that the terrestrial temperature datasets have been tampered with ex post facto. It is a fact that the overwhelming net effect of this tampering has been to push up apparent warming a great deal. It is a fact that newcomers to the climate question may not know that the warming rate has been artificially steepened. And I have been able to convey all that to them by altering a single letter in a single word, What’s not to like?
I’ve always liked sarchasm, myself. People are always falling into them, the internet being what it is.
“Tamperature”
I love that………..
Monckton: there is a contest held annually in which words with a single letter change are judged, along with their meanings, seeking entertainment and appropriate tongue-in-cheek tickles of fancy.
Tamperature is one of the best I have seen so I recommend you enter it with a suitable definition.
I also recommend that all the Watts Up With That-izens use the term ‘global tamperature’ freely in their correspondence. When others ask for the definition, we need something to cite so please provide it here.
In response to Mr Hovland, the surely very simple and clear global warming speedometer shows predictions in red and orange, and observations in green.
The problem is that the labels for HadCRUT4 and NCEI are partially obscured. IMO graphs (with suitable explanatory captions, if necessary) are better.
(Mr. Monckton, I suggest you play around with the appearance of the pointers, so as to make them appear more substantial, like the casing of the meter . . )
Thx
IPCC pointers should be hockey stick shaped!
Well done, Mr Harmsworth! A great idea.
(Reporting and writing by Stephanie Nebehay; additional reporting by Alister Doyle in Oslo; editing by Raissa Kasolowsky and John Stonestreet)
Now, imho poor Stephanie should have been sent packing and back to the library by messrs, Raissa Kasolowsky and John Stonestreet – But having said that, thirty odd years of shameful globull warbling propaganda force fed to skool kids and at colleges of further indoctrination and the likelihood is, Raissa Kasolowsky and John Stonestreet don’t know any better either…………
On the 2º C rise thing and insanely stupid attempts to limit the ave T rise to 2 degree C/275k whatev’……..was a figure plucked out of the air by that Cultural Marxist and sometimes amateur scientivist – prof, Hans Joachim Schellnhuber.
You’ve got to hand it to Jo, some salesman: he sure sold them and us, a great big pup.
I was hoping that, a miracle was occurring, having 17.4 million people begging, demanding, ordering to be released from the Brussels Slave Empire and all that that megaloman-ic project entails.
The EU and control and central diktat – the UK is still shutting coal plant because of the last ideological fixation on the ‘acid rain’ scam… Thus, including, its {EU] carbon dioxide limitations lunacy – now out and away from Brussels sclerosis……Britain, at long last able to steer WELL away from the OWG-corporate monster.
Britain free of the EU?!….. and decide for herself some properly thought out energy policies, what energy revolution we could bring about and just as the lights are about to go out!
Not a bit of though, very quickly Dave was booted out and Theresa was installed to keep us in and with all the attendant ‘on message’ BS, shackled to the ‘green agenda’. The Tories never change, global warming just part of the great Tory lie – that they’re EU septic, when in truth they’re the Tories and with the EU imprimatur…. are more insanely gung ho EU, than are the Brussels senate and the 5 Caesars.
Thus, unchallenged [except by your esteemed self Lord M]…… Reuters and the rest of the corporate world go on their merry way, and allowed, encouraged by HMG to still peddling the great scam for all it is worth.
Be Trump – this November, because if Hellary is anointed – then by Christmas we’re all stuffed.
“A conflict exists between competing certainties: between followers of Faith, who know because they believe, and followers of Reason, who believe because they know” – Unknown
You go my Lord.
The earth is on track for its hottest year on record and warming at a faster rate than expected
This kind of headline is a pre-emptive ‘attack’ by the warmista, just in case it doesn’t happen. If it does happen they will shout from rooftops ‘the earth is on fire’. If doesn’t happen the warmista are not going to issue a retraction, however the headline will be lingering in the sub-consciousness of the less informed well beyond the ‘sell-by date’.
Unfortunately, it is not easy to counter effectively..
Do not underestimate the gravity of this situation. We can’t afford to wait until December for the hottest year on record. We will be dead before Christmas.
Die laughing I expect!
The government agencies are creating misinformation (the “warmest evah” and “we’re melting” memes.)
Reuters doesn’t understand science very well and doesn’t understand climate at all.
Reuters is just regurgitating what information they get from government sources and studies (hence the climategate revealed urgency to gatekeep studies).
Accusing Reuters of “committing” fraud is like accusing an idiot of “committing” stupidity.
Wrong. Dreadful analogy.
Every time I see a post from on Facebook from my someone in my social circle (including people I actually like) asserting the latest alarmism I just have to come here to get some perspective. The problem is, I can’t post this as a rebuttal for fear of, as David Siegel said in the mammoth essay on Medium (featured on WUWT) which got me here, watching my friends disappear faster than you can say “vaccination”. The modest efforts I’ve made at presenting a dissenting view have not been well received, if at all.
I cannot either really discuss this with my friends – United Nations has succeeded very well in creating a dogma and to stigmatize those who dear to ask questions about it.
One way to deal with trained intolerance is to say how charmingly quaint and old-fashioned is the official Thermageddonite cult, add a smile and drop in a single devastating fact.
reply to Monckton of Brenchley July 23, 2016 at 1:38 am.
knowing the root of the word ‘quaint’ I think your suggestion an excellent one!
my approach to that situation in real life (i do not do face book) was to let them know in no uncertain terms they were no longer friends .quite simple really., like your friends.
There is a comment section in the Reuter article linked to in this Guest Essay.
As far as I can tell there are no comments at all in that comments section.
I would have expected at least one comment – a comment from Christopher Monckton.
It would have been nice to a response from the Reuters Journalist – Stephanie Nebehay.
“Science or Fiction” has a point. I have left a comment at Reuters linking to WUWT. But Rupeuters will pay near-zero attention to comments posted below its article. There is some chance, however, that it will not ignore comments sit directly to its feedback portal, to which the link appears in the head posting.
I have now posted the following comment:
“One thing I have always thought of as making Western mass media more reliable than East European media, was that Western media was allowed to have a critical attitude to the information provided by the authorities. However, 2 criteria need to be fulfilled for Western Media to actually be more reliable than e.g. Pravda was known for – the journalists must both be allowed to be critical and actually be critical.
This article makes me wonder – what kind of critical questions has the journalists actually asked themselves in the preparation of this article?”
The comment is now waiting to be approved by “Sustainability” on thomsonreuters.com
“The comment is now waiting to be approved by “Sustainability””
Gee, I wonder how that’s going to turn out…
And once again – too much critical theory and not enough critical thinking in journalism today.
There’s your problem.
The mainstream media do not need to be censored. Noam Chomsky showed that the owners of the MSM will make sure their organizations will adequately meet the requirements of their powerful friends. The freedom of the press belongs to the person who owns the press.
The people have noticed that you can’t trust the MSM.
Without speculating about it, I notice that there seems to be a significant correlation between political affiliation and trust in mass media:
http://content.gallup.com/origin/gallupinc/GallupSpaces/Production/Cms/POLL/vxiuhz3oxu6uj8l7shhxmq.png
Emissions are not rising as predicted by the IPCC’s RCP8.5 case, what they call “business as usual”. Furthermore, there’s no agency or company supporting their oil production forecast, which shows an increase to over 165 million barrels per day in the second half of the 21st century. The planet simply lacks that much oil. I would correct this article to point out that IPCC “business as usual” projections are based on unachiavable fossil fuel production rates.
Emissions are not rising as predicted by the IPCC’s RCP8.5 case, what they call “business as usual”.
Huh?
1. RCP8.5 assumes some things like near- zero technological advance that seem insane to someone moderately well informed. This is why it is called the greenpeace scenario, in honor of a group of idiots that are out of touch with reality. The only people who call RCP8.5 a BAU scenario are misinformed, dishonest, or deluded.
2. You are looking at the wrong end of the horse. The emissions are very close to RCP8.5 but the CO2 level is below RCP4.5. The marginal propensity for additional CO2 emissions to stay in the atmosphere is below 27.5% and falling.
Sometime in the next 3 years we will have the lowest annual atmospheric CO2 PPM increase this century. Which after 16 years and a 50% increase in emissions shouldn’t be possible. The question isn’t whether the annual CO2 increase will go below 1.56 PPM/Y, but how much below 1.56 PPM/Y.
Do you have a table showing the RCP8.5 CO2 and CH4 emissions and concentrations a on a year by year basis? It would be useful to plot them in comparison with actual data.
I mostly focus on oil and gas, and I can’t find a detailed description of the RCP8.5 model inputs/outputs. I even wonder if the RCP8.5 authors could differentiate between crude oil and natural gas liquids. My impression is they just drafted a table without giving it much thought.
I repeat that it is too early to present a meaningful trend analysis on the RCP 8.5 emissions projections. What we do know is that RCP 8.5 was a deliberately extreme scenario based on wild assumptions about future population, emissions intensity and fossil-fuel growth. On top of that, the upper half of its fantastic 21st-century temperature predictions are based on a single outlier model. It is valueless.
Fernando Leanme:
You may want to try downloading here: http://tntcat.iiasa.ac.at/RcpDb/dsd?Action=htmlpage&page=download
The spreadsheets you get do indeed have separate, year-by-year numbers for CO2 and CH4 concentrations, but not for emissions.
Do you have a table showing the RCP8.5 CO2 and CH4 emissions…
http://www.pik-potsdam.de/~mmalte/rcps/
RCPs in XLS format both emissions and concentrations.
I noticed the emissions are now harmonized, apparently the older data couldn’t carry a tune.
The RCPs are identical to reality and each other up to 2004.
I mostly focus on oil and gas, and I can’t find a detailed description of the RCP8.5 model inputs/outputs.
My understanding is that except for the concentrations file, all the other information is commentarial. Fossil Emissions are just fossil emissions.
My impression is they just drafted a table without giving it much thought.
There doesn’t appear to have been a lot of thinking involved in the creation of the of RCPs.
They apparently drew the concentration curves, then created the data and scenario cover story.
RCP 8.5 allegedly received a lot of greenpeace input and bears no resemblance to remotely possible future trends in this section of the space time continuum.
So sayith: PA – July 23, 2016 at 1:17 am
It would have to go …. way below ….. your stated increase of 1.56 PPM/Y ….. according to my calculations and given the fact that it has already occurred eleven (11) times during the past 36 years, to wit:
Maximum to Minimum yearly CO2 ppm data – 1979 thru 2016
Source: NOAA’s Mauna Loa Monthly Mean CO2 data base
@ ftp://aftp.cmdl.noaa.gov/products/trends/co2/co2_mm_mlo.txt
CO2 “Max” ppm Fiscal Year – mid-May to mid-May
year mth “Max” _ yearly increase ____ mth “Min” ppm
1979 _ 6 _ 339.20 …. + …… __________ 9 … 333.93
1980 _ 5 _ 341.47 …. +2.27 _________ 10 … 336.05
* 1981 _ 5 _ 343.01 …. +1.54 __________ 9 … 336.92
1982 _ 5 _ 344.67 …. +1.66 __________ 9 … 338.32
* 1983 _ 5 _ 345.96 …. +1.29 __________ 9 … 340.17
1984 _ 5 _ 347.55 …. +1.59 __________ 9 … 341.35
* 1985 _ 5 _ 348.92 …. +1.37 _________ 10 … 343.08
1986 _ 5 _ 350.53 …. +1.61 _________ 10 … 344.47
1987 _ 5 _ 352.14 …. +1.61 __________ 9 … 346.52
1988 _ 5 _ 354.18 …. +2.04 __________ 9 … 349.03
1989 _ 5 _ 355.89 …. +1.71 __________ 9 … 350.02
* 1990 _ 5 _ 357.29 …. +1.40 __________ 9 … 351.28
1991 _ 5 _ 359.09 …. +1.80 __________ 9 … 352.30
1992 _ 5 _ 359.55 …. +0.46 Pinatubo _ 9 … 352.93
* 1993 _ 5 _ 360.19 …. +0.64 __________ 9 … 354.10
* 1994 _ 5 _ 361.68 …. +1.49 __________ 9 … 355.63
1995 _ 5 _ 363.77 …. +2.09 _________ 10 … 357.97
* 1996 _ 5 _ 365.16 …. +1.39 _________ 10 … 359.54
* 1997 _ 5 _ 366.69 …. +1.53 __________ 9 … 360.31
1998 _ 5 _ 369.49 …. +2.80 El Niño __ 9 … 364.01
* 1999 _ 4 _ 370.96 …. +1.47 __________ 9 … 364.94
* 2000 _ 4 _ 371.82 …. +0.86 __________ 9 … 366.91
2001 _ 5 _ 373.82 …. +2.00 __________ 9 … 368.16
2002 _ 5 _ 375.65 …. +1.83 _________ 10 … 370.51
2003 _ 5 _ 378.50 …. +2.85 _________ 10 … 373.10
2004 _ 5 _ 380.63 …. +2.13 __________ 9 … 374.11
2005 _ 5 _ 382.47 …. +1.84 __________ 9 … 376.66
2006 _ 5 _ 384.98 …. +2.51 __________ 9 … 378.92
2007 _ 5 _ 386.58 …. +1.60 __________ 9 … 380.90
2008 _ 5 _ 388.50 …. +1.92 _________ 10 … 382.99
2009 _ 5 _ 390.19 …. +1.65 _________ 10 … 384.39
2010 _ 5 _ 393.04 …. +2.85 __________ 9 … 386.83
* 2011 _ 5 _ 394.21 …. +1.17 _________ 10 … 388.96
2012 _ 5 _ 396.78 …. +2.58 _________ 10 … 391.01
2013 _ 5 _ 399.76 …. +2.98 __________ 9 … 393.51
2014 _ 5 _ 401.88 …. +2.12 __________ 9 … 395.35
2015 _ 5 _ 403.94 …. +2.06 __________ 9 … 397.63
2016 _ 5 _ 407.70 …. +3.76 __________ 9 …
The “Max” CO2 occurred at mid-May (5) of each year … with the exception of three (3) outliers, one (1) being in June 79’ and the other two (2) being in April 99’ and 2000.
The “Min” CO2 occurred at the very end of September (9) of each year … with the exception of eleven (11) outliers, all of which occurred within the first 7 days of October.
PS, ….. I should have “tagged” my above “2016 year” as being an El Nino year that caused that +3.76 ppm increase in CO2, …. the same as did the 1998 El Nino caused a +2.80 ppm increase.
Samuel C Cogar July 23, 2016 at 7:46 am
PS, ….. I should have “tagged” my above “2016 year” as being an El Nino year that caused that +3.76 ppm increase in CO2, …. the same as did the 1998 El Nino caused a +2.80 ppm increase.
Bullsomething.
I actually follow the CO2 trends. 2015 only hit 3.05 PPM.and this might be the all time never to be beaten record..
The weekly year to year was as high as 4.5 PPM and is down to 2.8 PPM. With the declining La Nina (this year) running into the butt of the rising El Nino (last year) I doubt we will hit a 3 PPM annual increase this year and might go as low as the 2.2 PPM average. With 50% higher emissions than 1998 we should be seeing 4.4 PPM. That just isn’t happening. Setting the GISS 4 month all time cooling record (the greatest 4 month temperature decline in all of history) just sort of locks that in.
So sayith: PA – July 23, 2016 at 8:59 am
Well now, PA, your “trend following“ is quite delusional, … fer shur.
PA, here is the Mauna Loa Monthly CO2 ppm record for fiscal 2014 and 2015, to wit:
So tell me, what sort of “fuzzy math” subtraction were you employing to achieve your stated 3.05 PPM increase in fiscal 2015.
Samuel C Cogar July 24, 2016 at 6:56 am
…
So tell me, what sort of “fuzzy math” subtraction were you employing to achieve your stated 3.05 PPM increase in fiscal 2015.
http://www.esrl.noaa.gov/gmd/ccgg/trends/gr.html
I am just quoting the official 2015 Mauna Loa CO2 increase from the ESRL website.
My full response is further down the thread.
https://wattsupwiththat.com/2016/07/22/is-the-reuters-news-agency-committing-fraud/comment-page-1/#comment-2263530
I’m not sure what your point is.
If you could bullet what points you thought you were trying to make that would be helpful
PA – July 24, 2016 at 10:02 am
I was right, ….. a reading comprehension problem, whether intentional or otherwise.
Are you truly that miseducated ….. or just “blowing smoke” in my face in hopes that your mimicked “junk science” rhetoric would bedazzle and confuse me?
To wit, excerpted from ESRL website:
http://www.esrl.noaa.gov/gmd/ccgg/trends/gr.html
Start January ….. 2015 1 2015.042 399.96 399.96 399.80 30
End December .. 2015 12 2015.958 401.85 401.85 402.65 30
Difference in Concentration …. 401.85 ppm – 399.96 ppm = 1.89 ppm
And NOAA is claiming that a 1.89 ppm increase in atmospheric CO2 for fiscal year 2015 equates to a 3.05 PPM annual mean rate of growth of CO2.
CO2 annual mean rate of growth = “junk climate science” agitprop …… or blatant stupidity, …. take your pick.
To wit, please explain NOAA’s mathematics:
Start January ….. 1998 1 1998.042 365.18
End December …1998 12 1998.958 367.08
Difference in Concentration …. 367.08 ppm – 365.18 ppm = 1.90 ppm
And NOAA is claiming that a 1.90 ppm increase in atmospheric CO2 for fiscal year 1998 equates to ONLY a 2.93 PPM annual mean rate of growth of CO2.
1998 = 1.90 ppm quantity increase and a 2.93 PPM annual mean rate of growth
2015 = 1.89 ppm quantity increase and a 3.05 PPM annual mean rate of growth
“DUH”, …… nobody cares what the “mid” bi-yearly seasonal atmospheric CO2 quantities are or were. Mother Nature doesn’t give a damn about human’s fiscal-year start and end dates.
Samuel C Cogar July 25, 2016 at 6:17 am
PA – July 24, 2016 at 10:02 am
I am just quoting the official 2015 Mauna Loa CO2 increase from the ESRL website.
I was right, ….. a reading comprehension problem, whether intentional or otherwise.
You would make a good global warmer. You latch on to something utterly trivial, wrestle it to the ground until it is dead, and believe you have proved something.
I tend to do decadal trends just because the atmospheric CO2 data is so twitchy.
You can claim whatever you want about ESRL, but if you sum their “growth rate” for a decade, or take the difference in the start and end CO2 levels, the result is the same.
The argument you have with the ESRL is they rearrange deck chairs on the Titanic differently than you do.
The mid-year 1997 and 1998 concentrations were 365.08 and 368.2 so you could argue the annual change was 3.12 PPM in 1998.
Further, they aren’t using the Fiscal Year since it starts October 1.
“DUH”, …… nobody cares what the “mid” bi-yearly seasonal atmospheric CO2 quantities are or were.
The fact that the IPCC, the GCM modellers, and I, care renders that statement untrue.
@PA, Sam
you are argueing about a few ppm CO2 which is completely meaningless as it is not the GH effect that causes warming or cooling
it is the anti-green house effect that induces warming or cooling as it is caused by the production of ozone, peroxides and N-oxides TOA due to the particles emitted by the sun.
So, in other words, the annual rate of increase depends on when you think the year starts and ends ?
HenryP July 25, 2016 at 11:02 am
@PA, Sam
you are argueing about a few ppm CO2 which is completely meaningless as it is not the GH effect that causes warming or cooling
it is the anti-green house effect that induces warming or cooling as it is caused by the production of ozone, peroxides and N-oxides TOA due to the particles emitted by the sun.
1. The last 50 years, environmental absorption has been increasing about 1.8 times faster than emissions. This wasn’t important until the 21st century when absorption reached 60+% of emissions on a regular basis.
2. It isn’t a few PPM. The IPCC RCP8.5 has a 940 PPM CO2 level in 2100. At the current 1.8 x emissions absorption trend we won’t even hit 460 PPM. 480 PPM is not “a few ppm CO2”.
3. “anti-green house effect” yada yada.
It is possible to be right and wrong at the same time. Yeah there are a lot of atmospheric effects, Yeah the IPCC attribution estimates are cr*p. However there is some influence or influences that are causing weak long term warming. Correlation makes CO2 a likely candidate for some of the forcing. And whatever the warming effects are they are dominating the cooling effects… so far.
Dear PA
you must come to the point where you have to try and explain your OWN results as shown measured by myself on this weblog and those reported by others, as shown in the Tables II and III of the report below
http://virtualacademia.com/pdf/cli267_293.pdf
i.e.
the explanation of Gleissberg
86-88 years
http://www.nonlin-processes-geophys.net/17/585/2010/npg-17-585-2010.html
HenryP July 25, 2016 at 12:16 pm
Dear PA
you must come to the point where you have to try and explain your OWN results as shown measured by myself on this weblog and those reported by others, as shown in the Tables II and III of the report below..
1. I don’t have to come to any point or explain anything.
2. I don’t have a “theory” per se. I tend to accept what seem like accurate studies.
3. The only serious attempt to measure “CO2 forcing” measured a value equivalent to 2.4 W/m2 or 0.44 K for doubled CO2 at the 28°C average Oklahoma temperature where it was taken.
4. The UHI effect, if you assume it results in about 200 W/m2 more outgoing IR on affected land in comparison to vegetation is a net effect of about 1.6 W/m2 The claims that this is more than countered by irrigation – when you look at the total acreage and duration of irrigation this claim is just laughable. And we haven’t tossed in deforestation and other land use effects that are clearly warming.
5. There are natural effects Your WOLF-GLEISSBERG CYCLE may be true – but you have the same problem global warmers have – historic data is garbage.
The IPCC has made no credible attempt at attribution – if they did their 110% due to GHG claim would be self-evidently absurd. It doesn’t appear likely CO2 is responsible for more than 1/3 of the post 1900 warming. But I have the same problem proving this that every one else has – the data is garbage.
If the Wolf cycle makes a testable prediction about the next decade or two I am willing to listen.
Now the interesting part, as I read the tea leaves, is that sometime in the next decade or two the ocean should stop warming. Once the ocean stops warming – all further land warming is ALW not AGW. This solves an important attribution question.
Richard Mallett July 25, 2016 at 11:28 am
So, in other words, the annual rate of increase depends on when you think the year starts and ends ?
We have a 5 year period. One metric that uses mid-year value says the annual change in PPM was 1.5, 2.5, 2, 1.5, 2.5 and another metric that uses a yearly average or starts at the beginning of the year or whatever says it was 2, 2, 2, 2 ,2.
Does the annual rate of increase depend on when and how you measure? Sure.
Does it matter? No.
At the end of the day if the decade started out at 380 PPM and ended up at 400 PPM, the rate is 20 PPM/decade regardless of what odd and twisty path it took to get there.
@PA
PA, you say that deforestation causes warming.
Henry says
Incorrect.
It is the other way around: deforestation causes cooling (minima dropping), e.g check station in Tandil, Argentina. More vegetation causes warming, e.g check weather station in Las Vegas (minima increasing)
I have analysed the daily data of 54 stations for the period 1976-2015.(including all data 2014)
In the case of minima, that would be 365x38x54=748980 measurements.
However, on a random sample of 54 stations balanced to zero latitude and averaged, overall, the individual differences that can be discerned at stations, just seem to fall away or simply cancel each other out….
As you can see, there is no room in [my] equation for any measurable AGW.
we know that a number of components, like nitrogen have no absorption in their spectra, hence they allow all sunlight through. Some components, like O3 and H2O2 have absorption in the UV region. Hence, when UV falls on those molecules, approximately 50% of that light [absorptive region] is returned in the direction where it came from [some say 62.5%]. It is like when you put on bright lights in misty conditions: the light is returned to you as H2O vapor has absorption in the visible region.
Hence, ozone and H2O2 & others give you an anti-greenhouse effect. In fact, that effect is big. Much bigger than the actual GH effect caused by CO2….[think of the wavelengths involved]
hence what is happening -to explain the Gleissberg cycle:
=> we [currently] have very low solar polar magnetic field strengths
=> we have more of the most energetic particles being released from the sun\
=> we have more ozone, peroxide and N-oxides being formed TOA
= > we have more UV being back radiated to space
= > we have less heat into the oceans
= > hence we now are globally cooling [as evident from my graph]
henryp July 25, 2016 at 11:42 pm
@PA
PA, you say that deforestation causes warming.
Henry says
Incorrect.
It is the other way around: deforestation causes cooling (minima dropping), e.g check station in Tandil, Argentina. More vegetation causes warming, e.g check weather station in Las Vegas (minima increasing)
Huh? Really? Using Las Vegas as an example of deforestation invalidates any argument you were trying to make. Tandil depends on where the station is located. Tandil has the population density of Brussels. Tandil is an odd choice Argentina is deforesting at 0.42% (a low number) per year and Tandil isn’t one of the hot spots. Pick some place like Tanzania that is deforesting at 1% or more per year.
There are enough surface studies that compare pavement to dirt to ground cover that you really ought to go fishing elsewhere.
Anyway, pick one of the brown spots and make this claim.
Henry said
More vegetation causes warming, e.g check weather station in Las Vegas (minima increasing)
Pa says
Huh? Really? Using Las Vegas as an example of deforestation invalidates any argument you were trying to make.
henry says
you misunderstand me?
Las Vegas changed from a desert into a green oasis within the last 40 years. It is an excellent example of how greening causes heat to be trapped, especially evident by increasing minimum T/. If there is any AGW at all, it is this: mankind wanting to have green gardens, crops and trees….
henryp July 25, 2016 at 11:42 pm
we know that a number of components, like nitrogen have no absorption in their spectra, hence they allow all sunlight through. Some components, like O3 and H2O2 have absorption in the UV region. Hence, when UV falls on those molecules, approximately 50% of that light [absorptive region] is returned in the direction where it came from [some say 62.5%].
As I pointed out to you last week Henry this is not true.
When O3 and H2O2 absorb UV they are dissociated, i.e. an O-O bond is broken. The energy is not available to be returned!
@Phil.
I am sure we argued about this before?
How do you explain radiation specific to the absorptive spectra of e.g. ozone and CO2 coming back to earth via the moon? fig 6 and 7
http://www.iop.org/EJ/article/0004-637X/644/1/551/64090.web.pdf?request-id=76e1a830-4451-4c80-aa58-4728c1d646ec
PA – July 25, 2016 at 8:52 am
There is absolutely nothing “trivial” about the lies, misinformation, fear mongering, ignorance, stupidity, estimations, guesstimations, insinuations, percentagiations, trends, etc., etc., that is being touted and mimicked as being “factual science” that is associated with the natural world in general and with Biological and Physical Sciences in particular …… by those Professors, Teachers and other persons who have a “lucrative funded interest” for doing so ….. as well as the uneducated, miseducated, learning disabled, rabblerousers and/or the “brainwashed” CAGW religious believers (the Jim Jones’s).
PA, you really need to make a self-assessment of “why you believe what you believe” ….. and if there is any literal truths or evidence to support those beliefs.
Simply believing without questioning ….. every one of those “The sky is falling, the sky is falling” fear-mongering claims that you hear is what a well trained lemming will religiously do …… because they are simply afraid “not to believe”.
PA also said:
And given the fact that the atmospheric CO2 data is “twitchy” from one day to the next,
one week to the next, one month to the next, one year to the next, one decade to the next and one century to the next, ……. just what kinda “trends” are you looking to find?
Those kinda “noninfrequent” atmospheric CO2 ppm trends, ….. maybe? But what the ell, most every “troughfeeding” government job is a guaranteed “paycheck for life” job, right?
Anyway, here ya go, PA, some decadal statistics you can look for your elusive “trends” in, to wit:
PA also said:
Shur nuff, PA, …. and just like you have done, ….. I could also attest to my non-Mauna Loa assumed factual data that the mid-year 1997 and 1998 concentrations were 765.4 and 837.2 and then I could argue the annual change was 71.8 PPM in 1998, ……. right PA, ……. couldn’t I, ……. couldn’t I?
But iffen I were to do that then I am sure you would then be claiming that your “junk science” was far more factually correct than my “junk science”, ….. right.
The religious believing CAGW’ers of today …. are of the same mindset as the Flagellants of yesteryear.
HenryP July 26, 2016 at 9:05 am
@Phil.
I am sure we argued about this before?
How do you explain radiation specific to the absorptive spectra of e.g. ozone and CO2 coming back to earth via the moon? fig 6 and 7
That’s near Ir and visible not UV
The perils of witless estrapolation…
In response to Mr Schaeffer, CO2 emissions are what policymakers address, and, as the head posting shows, CO2 emissions are rising even faster than IPCC’s Scenario A (business as usual) prediction in 1990. It would not, therefore, be appropriate to use any of the lesser scenarios.
“Emissions are not rising as predicted by the IPCC’s RCP8.5 case, what they call “business as usual””
RCP8.5 is irrelevant here. The most recent projection quoted is 2001, which far precedes RCP or CMIP. In fact as you see, the predictions in 1995 almost exactly match the surface temperature observations that they were predicting. The 1990 range is somewhat higher, but that is for what they then called scenario A. They also had B,C and D, for which the projections were lower by factors of 2/3, 1/3 and 1/3 respectively. So scenario B led to 0.2°C/decade over the next century, quite close to what eventuated 1990-2016.
The test of scenarios is always what actually happened, not what you think was expected. Scenario A would have reached 400ppm CO2 by 2010 (Fig 5 summary); scen B would reach that by 2020. More drastically, methane would have risen (A) to about 2400 ppm by now; it is currently about 1850.
CO2 emissions were understated in the business-as-usual Scenario A in IPCC (1990). Methane emissions were flagrantly overstated in all the first thee IPCC ASSessment reports. Overall, Scenario A is the one that has come to pass, in that its oredicted CO2 emissions are less far below outturn than all other scenarios, but IPCC’s temperature predictions in 1990 proved to be flagrant exaggerations. Among the reasons: over-predicted CO2 concentrations consequent upon both oredicted and actual CO2 emissions; over-predicted methane emissions and methane concentrations; abs flagrantly over-predicted transient as well as equilibrium climate sensitivity.
Mr Stokes errs in citing predicted centennial sensitivity as justification that scenario B got it right. It is predicted decadal sensitivity that is the true comparator over decadal timescales.
As for IPCC 1995, Tthe two terrestrial tamperature datasets only approach the 1995 prediction after being tampered with to show more warming than the original records showed, and only then thanks to the distorting influence of the El Niño. Even then, it is surely clear that Reuters’ screeching assertion that the world is warming faster than expected is false.
” Overall, Scenario A is the one that has come to pass, in that its oredicted CO2 emissions are less far below outturn than all other scenarios, “

No, what counts is the actual gas concentrations. They are the drivers. And they were below the 1990 scenario A levels. Here is the AR1 1990 Fig 5 for CO2 with the present level (400 ppmv) shown in red:
And here is methane, again with the present level (1850 ppmv) marked. It is well below not only scenario A but also B.
So citing scenario A definitely overstates the predictions.
Scenario C should have been implemented in an RCP as the “business as usual” scenario since it seem to be the most likely.
Nick, it is not only the ghg levels that count. If they grossly over predict emissions and atmospheric retention, they are simply more wrong, and more alarmist.
Saying they are almost correct at the peak of a large El Nino is simply desperate nonsense.
BTW Christopher Monckton, it may be good to compare RSS to the models troposphere predictions, which are suppose to rise 20 percent higher then the surface. They are even more wrong.
Correction, if they grossly overstate atmospheric retention, not emissions.
Could you revisit your methane ratios please Nick 😉
Nick Stokes
July 23, 2016 at 4:50 am
No, what counts is the actual gas concentrations. They are the drivers.
————————————–
Of course Nick, in principle you are right………..but you see the concentration and its variation depends in the emission and its variation.
You see Nick the very base for your AGW “science” is the connection between thermal variation and CO2 emission variation, where concentration actually gets to be an artifact, very important as you say, but never the less depending in the relation of temps with emissions.
Now Nick when at this can you explain how could there have being significant thermal variations during the last 7k years, consisting as warming periods similar in the quantity of warming to the modern warming period, without any sign of any variation in the CO2 emissions for the periods in question?
Hopefully you can explain that to me…….
without any explanation for it Nick the AGW loses its base, as far as I can tell.
cheers
“If they grossly over predict emissions and atmospheric retention,”
Again, wearily, scenarios are not predictions. They are “what if”. That’s why there are four of them here.
GCMs, at least then, do not deal directly with emissions. They take air composition as an input, and predict the results. For methane there is no complete data on emissions.
I agree with nick here. Shouldn’t the speedometer thingy be comparing the observations to the prediction based on the scenario that is closest to the actual GHG concentration we actually have? And shouldn’t it explicitly state which scenario it is referring to, and why that was the most suitable scenario to use for the comparison?
To pick the most extreme scenario, when we don’t have the corresponding levels of GHG concentration, and to then use that as a comparison, without even stating which scenario the prediction was from, is extremely misleading. It is however exactly what you would do if you wish to create a speedometer that shows the largest possible gap between observation and prediction.
As Nick states, it’s the actual GHG concentration that determines the level of warming expected for a given scenario.
Mr Monckton, can you explain why scenario A is the best one to use, as you have done with your speedometer?
Maybe we can have version 3 of your speedometer?
Philip Schaeffer
July 23, 2016 at 5:46 pm
“I agree with nick here.”
——————————–
Sorry Philip, but you clearly do not agree with Nick.
Your comment starts with a self evident logical fallacy.
Nick says and states clearly:
“Again, wearily, scenarios are not predictions. They are “what if”. ”
—
And you claim agreement with Nick by saying and stating clearly:
“Shouldn’t the speedometer thingy be comparing the observations to the “prediction” based on the scenario that is closest to the actual GHG concentration we actually have?”
—
First you consider the scenario as a prediction, contrary to Nick, and secondly you fail to see that actually the “extreme” scenario (the business as usual) is closest to the the actual CO2 concentration as up to date, at least according to Nick’s graph.
The only problem that scenario has is that its extreme “projection” depends in the relation between the thermal variation and the CO2 emission variation, which the reality up to now does not support, aka the problem that AGW has, which in return means that the extreme outcome of that “what if” scenario is very unlikely and any other scenarios of “what if” are not of any meaningful value as far as the support for AGW concerned, because the range of “what if” scenarios becomes too wide for any rational meaning.
Further more is not up to lord Monckton to pick, the pick is defined by default by the “business as usual” label, something not up to Monckton.
But the very basic fallacy you start the comment at, renders your comment as faulty, as far as I can tell.
cheers
“Sorry Philip, but you clearly do not agree with Nick”
Well, I agree with Philip. I don’t know why people have such trouble with the scenario/projection thing. It says – models can estimate how the atmosphere will respond to GHG. But they can’t tell you how much GHG we will emit. So you run the models with scenarios. They aren’t predictions. They are representative pathways used by the modellers so that:
1. Others can make their own estimate of what scenario is likely, maybe a blend (so they need to cover the range of what reasonable people might think)
2. To test the model afterward, you test whatever scenario actually happened. That completes the “what if” part. It no longer matters who thought what about what would happen. We now know, and can see how well the model did. Provided you test the scenario that actually happened.
I think that is what Philip and I are both saying.
So presumably the scenario that has actually happened so far is BAU since CO2 is still going up at the same rate (some say it’s accelerating) ?
“First you consider the scenario as a prediction”
Logic fail. There is a prediction based on the scenario. That doesn’t make the scenario a prediction. Look up the word scenario.
<I.Samuel C Cogar July 24, 2016 at 6:56 am
So sayith: PA – July 23, 2016 at 8:59 am
Bullsomething.
I actually follow the CO2 trends. 2015 only hit 3.05 PPM.and this might be the all time never to be beaten record.
Well now, PA, your “trend following“ is quite delusional, … fer shur.
PA, here is the Mauna Loa Monthly CO2 ppm record for fiscal 2014 and 2015, to wit:
http://www.esrl.noaa.gov/gmd/webdata/ccgg/trends/co2_data_mlo_anngr.png
The Mauna Loa CO2 increase in 2015 was 3.05 PPM. Fact.
http://www.esrl.noaa.gov/gmd/ccgg/trends/gr.html
2000 1.62
2001 1.58
2002 2.53
2003 2.29
2004 1.56
2005 2.52
2006 1.76
2007 2.22
2008 1.60
2009 1.89
2010 2.42
2011 1.88
2012 2.62
2013 2.10
2014 2.17
2015 3.05
And if the 2017 CO2 increase, after a 50% increase in emissions, is below the increases at the start of the century (we use the 1.56 PPM level just to be fair) that will be a record for this century and worth noting. In theory if you prorate the 2000 or 2001 level to the increase in emissions, the current minimum increase should be about 2.37.PPM/Y which is higher than the average annual increase.
http://www.esrl.noaa.gov/gmd/ccgg/trends/global.html
2000 1.25
2001 1.85
2002 2.37
2003 2.27
2004 1.57
2005 2.43
2006 1.76
2007 2.09
2008 1.77
2009 1.67
2010 2.41
2011 1.69
2012 2.37
2013 2.46
2014 1.97
2015 2.90
The Global CO2 increase in 2015 was 2.90 PPM. Fact.
In fact, if the global increase doesn’t hit 3.0 PPM this year, it might not EVAH exceed 3.0 PPM.
Keep dancing.
PA – July 25, 2016 at 8:52 am
There is absolutely nothing “trivial” about the lies, misinformation, fear mongering, ignorance, stupidity, associations, correlations, insinuations, guesstimations, percentagations, etc., etc., that is being touted and mimicked as being “factual science” that is associated with the natural world in general and with Biological and Physical Sciences in particular …… by those Professors, Teachers and other persons who have a “lucrative funded interest” for doing so ….. as well as the uneducated, miseducated learning disabled and/or the “brainwashed” CAGW religious believers (the Jim Jones’s).
PA also said:
And given the fact that the atmospheric CO2 data is “twitchy” from one day to the next,
one week to the next, one month to the next, one year to the next, one decade to the next and one century to the next, ……. just what kinda “trends” are you looking to find?
Those kinda “noninfrequent” atmospheric CO2 ppm trends, ….. maybe? But what the ell, most every “troughfeeding” government job is a guaranteed “paycheck for life” job.
Anyway, here ya go, PA, some decadal statistics you can look for your elusive “trends” in, to wit:
PA also said:
Shur nuff, PA, …. and just like you have done, ….. I could also attest to my non-Mauna Loa assumed factual data that the mid-year 1997 and 1998 concentrations were 765.4 and 837.2 and then I could argue the annual change was 71.8 PPM in 1998, ……. right PA, ……. couldn’t I, ……. couldn’t I?
The religious believing CAGW’ers of today …. are of the same mindset as the Flagellants of yesteryear.
Perhaps the interesting question is whether the 2015/16 el Nino event will cause a step change in global temperatures of 0.2 – 0.3C, as happened after the 1998 event. At least as measure using satellite data…..
If it doesn’t, perhaps people will have to speculate about other mechanisms by which that warming was triggered……..
In response to Mr Schaeffer a little above in this thread, IPCC’s Scenario A in 1990, the highest-emission or business-as-usual scenario, predicts CO2 emissions rising at a rate that is below what has been estimated since then. So Scenario A is the right scenario.
Mr Monckton, the predictions for warming rates are based on scenarios of various curves of GHG concentration over time. They care not about the why’s or hows that lead to a given GHG concentration curve actually happening.
GHG emissions don’t directly do anything. It is the resulting GHG concentration that determines the predicted warming. If you are going to compare predictions for given concentrations of GHG’s with the warming rate, then you need to look at the curves of concentration over time, and find the one that matches the actual recorded level of concentration over time the best, not the rate of emissions.
extrapolation…
I think it is REALLY SAD that the UK Met Ofice and the Royal Society have been seduced into the alarmist camp. What are we coming to?
The corruption of science for profit at the expense of taxpayers ruled by governments of a totalitarian cast of mind is a serious problem. The best weapon we have against it is the truth.
Otherwise known as the part of Eisenhower’s farewell speech that never gets quoted.
In response to Mr Leanme, the head posting makes it plain that official predictions more recent than IPCC’s 2001 Third ASSessment Report are too recent to allow reliable verification. The RCP 8.5 emission prediction was not used till the 2013 Fifth ASSessment Report. Its absurd exaggerations were exposed in Monckton of Brenchley et al. (2015), in the Science Bulletin of the Chinese Academy of Sciences.
IPCC’s most wildly exaggerated predictions of global warming were made in its 1990 First ASSessment Report, based on the business-as-usual CO2 emission predictions in that Report, a graph of which is reproduced in the head posting. Though CO2 emissions have risen faster than the 1990 business-as-usual prediction, even the terrestrial tamperature datasets do not show warming even at the least rate that IPCC had predicted in 1990. That is a reliable measure of the models’ failure.
If you compute the marginal effect of emissions increases less than 27.5% of additional emissions stay in the atmosphere and the number is falling. 58% of emissions pre-2000 stayed in the atmosphere.
So 2.2 PPM more or less is about as bad as the average annual CO2 increase is going to get.
Further, the last time CO2 emissions were stable, the annual CO2 increase in PPM declined.
Net Environmental Absorption was 0 at 280. The environmental absorption is basically proportional to the the current CO2 level minus 280. The roughly 6-7 GT/Y of current absorption will be around 13 GT at 500 PPM. This is not factored into the RCPs.and renders them unusable for predictive runs. The RCP4.5 2100 scenario of a 4.2 GT carbon emissions level with a 538 PPM atmospheric CO2 level will result in -4+ PPM decrease not a 0.5 PPM increase in atmospheric CO2.
A few “thingys” that one should know, remember and recite ….. when discussing atmospheric CO2, …. to wit:
1 gigatonne is equal to one (1) billion tonnes
1 gigatonne of carbon equals 3.67 gigatonnes of carbon dioxide.
1 part per million of atmospheric CO2 is equivalent to 2.13 gigatonnes Carbon.
Using the 44 over 12 rule, this means 1ppm = 7.81 gigatonnes of Carbon Dioxide.
1958 max Mauna Loa CO2 ppm = 317.50
2000 max Mauna Loa CO2 ppm = 371.82 …. +54.32 ppm = +424.2 gigatonnes of CO2
2016 max Mauna Loa CO2 ppm = 407.70 …. +90.20 ppm = +704.5 gigatonnes of CO2
So, in past 58 years (1958-2016) atmospheric CO2 has increased by 90.2 ppm or 704.5 gigatonnes ……… with was the result of an average bi-yearly (seasonal-May to Sept) CO2 decrease of 5 to 6 ppm (39/47 gt)….. and an average bi-yearly (seasonal-Oct to May) CO2 increase of 7 to 8 ppm (55/63 gt).
Thus, said 90.20 ppm total increase …. divided by 58 years …… equals 1.6 ppm average yearly increase in atmospheric CO2.
And as most anyone can plainly see, via the following graph, …. that global (near-surface) lower atmospheric temperatures have little to no effect on the yearly increase in atmospheric CO2 ppm. But the temperature of the ocean waters and volcanic eruptions sure do.
http://i1019.photobucket.com/albums/af315/SamC_40/1979-2013UAHsatelliteglobalaveragetemperatures.png
Mr Bor, who continues to go off topic and issue childish, innumerate attacks on our popular paper in the Science Bulletin of the Chinese Academy of Sciences on grounds unconnected with that for which it was cited here, petulantly insults those commenters who have pointed out his elementary errors of mathematics.
For instance, he has not the faintest idea what a forcing is, or he would not find it remarkable that, in our equation, just as in that of IPCC, a zero forcing engenders a zero response and that a non-zero forcing may engender a non-zero response, which may vary (whether linearly or otherwise) over time to equilibrium, at which time the full response to the forcing has occurred and does not simply disappear as he foolishly suggests.
For another instance, he says our equation models only linearities.
He appears unfamiliar with the fact that the CO2 forcing in the equation for our simple model is not a linear but a logarithmic function of the change in CO2 concentration, though the fact is stated plainly enough in the paper.
He appears unfamiliar with the use of temporally-subscripted arrays to model any desired non-linearity over time to equilibrium. IPCC uses them, if he would only read its reports.
He appears unfamiliar with the fact that the output of the system-gain element in our equation is non-linear.
He would not have stated, falsely, that our equation models only linearities if he had understood these things.
In short, he is woefully out of his league and ought really to learn a little mathematics before he continues to be rude to commenters here who point out his many errors.
Meanwhile, the change in global temperature seems to follow what our model would predict a great deal more reliably than what IPCC’s models would predict. In the end, that – and not Mr Born’s uneducated opinion – is the measure of a model’s skill.
.
I once again caution readers against relying on that paper. A critical reading would reveal that its extensive recital of facts and figures has almost nothing to do with the sensitivity value it purports to find. As I have elsewhere explained, that value wasn’t so much “found” as just pulled out of the air.
Moreover, relying on that paper puts one in danger of being seen to accept the main innovation of its central equation, which is the preposterous notion that the response of a memory-implementing time-invariant system can reliably be computed by treating it as a memoryless time-variant system. Applied, for example, to a system comprising a shower and slow bathtub drain, that equation would say of water that has risen to above your ankles while you are showering that it will instantly disappear as soon as you turn the shower off. Obviously wrong, but that’s what Monckton et al.’s equation would tell you.
Mr Born does not like the paper in the Science Bulletin of the Chinese Academy of Sciences. But then he does not understand it. It is more than somewhat above his pay-grade. And he approaches it with the sullenly hostile prejudice that had led him earlier to assert, falsely, that I had not sent him data for which he had not sent me a request, leading several commenters to criticise him trenchantly for his falsehood. He has been something of a sourpuss ever since, greatly adding to the readership and appreciation of our paper.
Readers will be able to find the paper for themselves by visiting scibull.com, clicking Most Read Papers and fining the most-read paper of all in the 61-year archive of that distinguished journal. That is our paper, of which either the abstract or the full text has been downloaded more often than its nearest rival by a factor of 12.
Mr Born, not understanding the admittedly rather mathematical arguments in the paper, thinks our chosen climate-sensitivity interval was mere guesswork. Well, in that event one might more legitimately say the same of IPCC’s very high sensitivity guesses.
So, how might one decide between the two sensitivity intervals, IPCC’s, which Mr Born seldom if ever questions, and ours, which he whinges about in his petulant fashion at every opportunity? By checking the temperatures that each sensitivity interval would lead us to predict, and then seeing whether those temperatures bore some relation to warming in the recent past. That, at any rate, was the test that the authors of a paper criticizing ours demanded. In our reply paper, which Mr Born seems not to have seen, we carried out a couple of such tests. Our sensitivity interval seems, so far at any rate, to be considerably more reliable and less fanciful than that of IPCC.
The real test of any model, however, is not its ability to hindcast successfully (any fool except IPCC can do that). The test is which model’s predictions will prove the most accurate. How many readers here think for one moment that our model will in100 years’ time prove to be less accurate than those of IPCC? It was trying to find the next pay check: we were trying to find the truth.
Lord Monckton does go on, mostly about things irrelevant to my point, which is that the paper is internally inconsistent and mathematically incoherent. As to which of us is out of his depth mathematically, any upper-class engineering undergraduate could readily determine that for himself by ignoring Lord Monckton’s bluster and actually checking Monckton et al.’s worked examples for himself.
Monckton et al.’s Equation 1 purports to be a short-cut approximation to computing a model’s transient response, the models purportedly used in Monckton et al.’s Table 6 worked examples being those whose responses to a 4 W/m^2 step are depicted in Monckton et al.’s Fig. 4. As I have said, the proposition that the equation is anything of the sort is preposterous.
To test that proposition, simply compare the Equation 1 result with the exact response—obtained, as any such undergraduate knows, by convolving that Fig. 4 step (divided by 4 W/m^2) with the time derivative of your favorite RCP suggested historical and/or projected forcings. While the comparison with the results obtained from Monckton et al.’s equation varies, you’ll find that Monckton et al.’s results shown in their Fig. 6’s first three rows are off by a factor of 3.
This is only one of several glaring, fundamental errors in physics, linear systems, and logic. The paper is an embarrassment.
Incidentally, I am under no illusion that anyone at this site will, as I have, actually go through the effort of performing the exercise I suggested above. If you’re familiar with feedback theory, though, you can with much less effort test another aspect of Monckton et al.’s paper, namely, their characterization of the various feedback regimes depicted in their Fig. 5, which is essentially the hyperbola defined by the feedback-definition implication y = gx / (1-fg), where x and y are stimulus and response, f is the feedback coefficient, g is the open-loop gain, and fg is the loop gain.
I can’t believe that the climate system’s loop gain (which Monckton et al. calls “closed-loop gain”) can exceed unity or even come close to it. If you’re familiar with feedback theory, though, you will recognize that, if it did, there is no reason in principle why equilibrium sensitivity could not be negative, although equilibrium in that range would be unstable. Although the figure’s nomenclature is understandable—unstable-equilibrium states rarely persist naturally—the greater-than-unity range would more properly be called “unstable” than “unphysical.”
Contrary to what Monckton et al. say in their Sec. 8.3.2, that is, negative equilibrium sensitivity values are not among the features that distinguish feedback in electronics from feedback in other physical systems such as climate. So adepts at feedback theory can recognize that this justification for Monckton et al.’s claim that climate scientists “use the wrong equation” is erroneous. There are no doubt many egregious errors in alarmist scientists’ work, but using straightforward implications of the feedback equation y = g(x + fy) is not among them.
As I have elsewhere explained, that value wasn’t so much “found” as just pulled out of the air.
Well…
The only real data point we have is the UCB Berkeley study that looked at downwelling IR in Oklahoma and Alaska.
0.2 W = 22 PPM (370 PPM to 392 PPM).
Oklahoma average temperature is 290K, at 290K it takes about 5.5 W/m2 to increase temperature 1 K.
From radiosonde studies we know the “increase” in warming drops 50+% above the 100 meter surface layer. This effectively throttles any feedback from the upper atmosphere. We don’t care what happens at the 255K point, it is irrelevant. Global warmers care what happens at the 255 K point, but they are irrelevant which tends to prove my point.
0.2 W/m2 * ln (2)/ln (392/370) = 2.4 W/m2 for a doubling or 0.44 K per doubling.
Direct forcing to date is 2.3 W/m2 according to the IPCC.
Temperatures are up only 0.7C or so (of course this an exaggerated, adjusted number but it is what it is).
Temp K / W/m2 direct forcing is only 0.304K / W/m2.
That means the feedbacks just are not showing up or they are extremely low in the RealEarth(tm) response. The Energy Imbalance is only 0.6 W/m2/year right now but the combined Direct and Feedback Forcing that is supposed to be around 6.3 W/m2/year so 90% of it has just gone missing. Only 10% of it is showing up.
That means when we get up to doubled CO2/other GHGs of 4.2 W/m2 around the year 2065, temperatures will be up 1.27C or so. AND that is just another 0.57C on top of what we have experienced already.
The longer-term feedbacks getting to Equilibrium Sensitivity 25 years later appear to be so low, they don’t really matter because they are just NOT showing up anyway.
There you go Joe. Nice simple math that your climate science colleagues can’t seem to do.
Bill Illis:
Without having checked your source data, I find your argument fairly compelling. My own opinion, too, is that sensitivity is low. But what I look for in a technical paper is further reason to believe (or disbelieve) my current opinion. Since it is replete with errors that go to the heart of their argument, I find no such reason in Monckton et al.’s paper.
If you do find it a rigorous argument, I would be be happy to entertain your exegesis. But Lord Monckton’s arguments are incoherent.
Monckton 2015 did not do anything different that what I just showed you Joe except it went into much more depth and included a complete review of all the uncertainties.
The fact that you found it incoherent just means you like simpler descriptions versus detailed maths.
That isn’t how CO2 works. CO2 has a natural “off switch,” and the marginal absorption of energy decreases with each additional unit of CO2. In economics we call this the law of diminishing returns.
Very true CO2islife. (that is actually my chart).
But we are also in a particular part of the diminishing returns formula that it is fairly close to linear. f course, it should not be approximated as linear but the real diminishing returns calculations should be used.
If we “zoom” right in on the chart, we can see how the Direct CO2/GHG forcing and then the “multiply it by 3” Feedbacks are supposed to get us to 3.0C per doubling. (Most climate scientists would not understand this is what their theory implies).
http://s18.postimg.org/nanmqc6d5/SB_Equation_Zoom_in_GW_Math.png
The feedback values are very carefully “chosen” by those climate scientists who actually get the equations to maintain the theory at the 3.0C per doubling. There is very little “room” to change them to more accurate values because the entire 3.0C per doubling theory then falls apart if they do. They need to be in the “mulitply it by 3” category or they don’t get 12.2 W/m2 of feedback forcing.
When have you heard that the “feedbacks” need to provide 12.2 W/m2 of additional forcing to get to 3.0C per doubling. Not from climate science.
Bill Illis:
Independently of whether I like simpler descriptions, my understanding of the math involved in Monckton et al. is superior to any that the authors’ remarks have betrayed.
Rather than just spout conclusory statements, why don’t you explain how Monckton et al.’s Equation 1, which computes the output of a time-variant memoryless system, can calculate the output of Roe’s, which are time-invariant and memory-implementing? This math I know, and the answer is, It can’t.
Or maybe you can explain why the mere fact that climate scientists in effect use y = gx /(1 -fg) means they “used the wrong equation.” That’s what the authors’ press release says. But the detailed math says they’re wrong. I know that because I understand the math; they seem not to.
Or perhaps you can explain how they come up with the proposition that the higher-feedback system yields a lower early-year response than a lower-feedback system. Because I do understand the detailed math, as they apparently did not, I know this is what their paper says. Everything else being equal, that’s an incorrect result.
It’s easy to be part of Lord Monckton’s lightweight chorus. Really defending the paper’s logic is a different matter entirely.
In economics we call this the law of diminishing returns.
Marginal propensity to absorb…
The other problem for CAGW (Cult of Anthropogenic Global Warming) is the “marginal propensity” of the atmosphere to retain emissions.
The feedback values are very carefully “chosen” by those climate scientists
As far as the feedback…The feedback values are carelessly “chosen” by those climate scientists because they are wrong. Carefully chosen values would be correct.
The warming effect reduces by 50+% once you leave the surface layer. This “throttling” means the warming at the surface is mostly a surface only effect (the contribution of the atmosphere above 100 m is negative if anything).
Further, the atmospheric effect is really 63°C GHG- 30°C convection. For CO2 to cause significant warming convection and evaporation have to remain constant and there is no chance of that happening.
So sayith: Joe Born – July 23, 2016 at 4:14 am
There is nothing “linear” about earth’s climate system other than it will “go on forever” as long as the earth exists.
Also sayith: Joe Born – July 23, 2016 at 5:03 am
Personally, I think it is asinine and silly for anyone to associate or compare the “feedback theory in/of electronics” …… with the “junk science” claims about feedback mechanisms associated with earth’s physical climate system.
IMHO, the surface winds are the only true “feedback mechanism” of earth’s climate system. The surface winds are simply “feeding back” the air that was displaced as a result of an increase in temperature or a Coriolis effect.
“Applied, for example, to a system comprising a shower and slow bathtub drain, that equation would say of water that has risen to above your ankles while you are showering that it will instantly disappear as soon as you turn the shower off. “
Bollocks.
Stop making things up.
catweazle666:
This is what passes for reasoned discourse here. I thank him for the terse example. Had catweazle666 been able to understand math, he would have recognized Equation 1’s saying that as soon as the stimulus (forcing anomaly , analogous to the faucet’s flow) disappears, so does the response (temperature anomaly
  , analogous to water depth) without delay; obviously, this is contrary to physics.
The discriminating observer will note that I presented facts, while the lightweight chorus’s response was irrelevance no more “trenchant” than catweazle666’s.
For example, Mr. Cogar’s observation that the earth system is nonlinear is not even wrong. Of course the climate system is nonlinear. The reason why the mastery of nonlinear systems to which I referred is important is that it would have enabled the authors to recognize that, contrary to what they thought, their Equation 1 describes a linear system. And it would also have enabled them to understand how to calculate such a system’s response correctly. Their error is analogous to saying that you can calculate the product of two numbers well enough by just adding them. Yes, you may luck out and get the right answer, but not usually.
Really, guys, this is not complicated physics or math. This is undergraduate stuff. Please stop embarrassing yourselves. Wait to comment until you have acquired some familiarity with the relevant disciplines.
@ Bill Illis
“The Energy Imbalance is only 0.6 W/m2/year right now but the combined Direct and Feedback Forcing that is supposed to be around 6.3 W/m2/year”
Could you summarize the factors you use to arrive at the figure of 6.3 W/m2 ?
(I guess the unit you used: 6.3 W/m2/year was a mistake)
Joe Born – July 23, 2016 at 7:27 pm said, to wit:
It’s quite obvious to me Mr. Born surely has a “short-term” memory problem, ….. or a reading comprehension problem, …… and if not, ….. then I fear it might be an un-professional deviously dishonesty problem.
And I say that because his above stated agreement at 7:27 pm …. that the “climate system is nonlinear” …. absolutely, positively NEGATE his silly CYA statement that he had previously posted at 4:14 am, to wit:
So sayith: Joe Born – July 23, 2016 at 4:14 am
So, make up my mind, Joe, ….. are you bad-mouthing “fundamental errors” associated with linear systems …… or with non-linear systems?
Science or Fiction July 24, 2016 at 3:47 am
@ Bill Illis
“The Energy Imbalance is only 0.6 W/m2/year right now but the combined Direct and Feedback Forcing that is supposed to be around 6.3 W/m2/year”
Could you summarize the factors you use to arrive at the figure of 6.3 W/m2 ?
—————————-
Direct human-induced and volcano Forcing is 2.3 W/m2 in 2015 according to the values used in IPCC AR4.
http://www.pik-potsdam.de/~mmalte/rcps/index.htm
Temperatures are up 0.7C which should have produced water vapor, cloud albedo, lapse rate, albedo feedbacks of another 4.05 W/m2. The initial round of feedbacks is supposed to provide for another round of feedbacks which then provide for another round etc. We are supposed to have 4.05 W/m2 of total feedbacks from this initial temperature increase.
http://jonova.s3.amazonaws.com/source/ipcc/5ar/draft/fig-9.44-ipcc-ar5.feedbacks-450.gif
@ Bill Illis
“Temperatures are up 0.7C which should have produced water vapor, cloud albedo, lapse rate, albedo feedbacks of another 4.05 W/m2.”
I don´t get it. from the figure you provided I gather that the feedback parameter for all feedbacks is about 2.0 W/m^2*K – Where K is the temperature increase from preindustrial times. IPCC has provided a central estimate of 0,85 K . for the temperature increase since preindustrial times. that should provide a positive feedback of 2 (W/m^2*K) * 0,85 (K ) = 1,7 W/m^2 (Based on Assessment Report nr. 4) .
@ Bill Illis
“The initial round of feedbacks is supposed to provide for another round of feedbacks which then provide for another round etc.”
Thats a question I have had on my mind. Since there is a Water Vapour, Cloud and Lapse rate feed feedback from surface temperature alone, not related to CO2 but to surface temperature, wouldn´t the response be to a step increase in surface temperature be an ever increasing warming?
How do you calculate the result of these endless rounds and how do we know that IPCC hasn´t already done that, and provided the end result after having taken into account these endless rounds of feedback?
“I can’t believe that the climate system’s loop gain (which Monckton et al. calls “closed-loop gain”) can exceed unity or even come close to it.”
The closed loop gain is certainly greater than 1 and is equal to about 1.6 which is the ratio between the output of the gain block (385 W/m^2 @ 287K) divided by the input power arriving from the Sun (239 W/m^2 @ 255K). While the classic climate feedback model has forcing power in and surface temperature out, Bode requires inputs and outputs to be linearly related such that the open loop gain. closed loop gain (sensitivity) and feedback are all dimensionless ratios. Only the relationship between net surface emissions and input forcing, which are expressed in the same units and whose ratio is dimensionless, satisfies Bode’s linearity constraint. The delta temperature can be calculated by converting starting and ending surface emissions to temperature using the SB law and then subtract the start temperature from the end temperature.
The dimensionless requirement comes from the basic gain equation, 1/Go = 1/g + f, where Go is the open loop gain, g is the closed loop gain and f is the fraction of the output fed back to the input. Note that g, Go and f must all be dimensionless.
Meanwhile Tony Heller shows a 140 year temperature record that has been broken last month but that nobody is going to report.
The fastest 4-month cooling of the entire record.
http://realclimatescience.com/wp-content/uploads/2016/07/2016-07-22093327.png
Technically GISS monthly data shows it. The mods on that thompsonreuters article didn’t like that, I downloaded the GISS and posted it. They didn’t like that at all.
Most interesting. My comments went down the Memory Hole too. That conduct by Reuters, refusing to correct serious and persistent inaccuracies, is dishonest.
It’s the regular catastrophist fare these days m’laawd. 😀
My understanding of CAGW theory is that ghg’s slow the return of heat from the planet to space. Therefore the featured chart is impossible. The model has spoken!
I was silly enough to provide a detailed response with GISS monthly CRU RSS UAH and IPCC projections, and boom deleted. There are no comments, all get deleted.
Green denialism in full flow
from the article cited here, not here. 😀
As we’re on the “Dad’s Army” theme and Reuters are doing there best not to tell us that warming is on track to be lower than predicted – it reminds me of the classic Dad’s Army sketch “Don’t tell them Pike”
Is there any valid correlation between global temperature and levels of atmospheric carbon dioxide, that is actual measurements not modified data? If not, then how it is possible to predict a 1 or 4 K degree rise as there is no basis for it.
The bottom of the bottom of the Reuters article contains the names of those involved:
(Reporting and writing by …) I note that for the lead journalist, this appears to be her first climate story. I suspect she needed to be tutored by the more believing one of the group.
AFAIK (please prove me wrong) nobody seems to get yet that the Powell study (http://www.jamespowell.org) IS effectively the refutation of Cook 2013 that I have been recently posting.
His 99.5% is most likely correct. All that actually MEANS though is that only 0.5% of papers that he studied explicitly reject AGW. For a paper to reject AGW altogether means that most likely it’s explicitly stating there’s no GHE or something like that. It would have to be a paper which actually rules out man as a cause of ANY proportion of the observed warming. AGW = Anthropogenic Global Warming. It ONLY means that humans cause warming. It does NOT involve a quantification of how much of observed warming is due to man.
Warmists misuse the Powell result to try to claim that 99.5% of the literature (and scientists writing it) is/are in agreement that observed warming is primarily (or entirely) the result of mankind. That’s not what the result shows. It’s not what Cook 2013 shows. If the categories in Cook 2013 had been set up correctly, I believe 99.5% would be the result they got too. All it shows is that the 99.5% are in agreement that AGW is real. And all THAT means is that humans can cause SOME warming (proportion of the observed warming due to mankind NOT quantified, i.e could be less than 50%). 99.5% of skeptics would agree with this consensus too.
That refutation of Cook 2013 again:
The categories in Cook et al (2013) “explicit endorsement without quantification” and “explicit rejection without quantification” are oxymoronic if the consensus the abstract of a paper supposedly endorses is either:
a) “climate change is happening and is caused by mankind” (meaning 100% of all observed warming is the result of human emissions) or
b) “climate change is happening and is caused mainly by mankind” (meaning greater than 50% of all observed warming is the result of human emissions).
Therefore the consensus Cook et al (2013) claims to have found cannot be either of those, and any subsequent attempts to imply that it is, should be ignored.
If an abstract contains no indication of how much warming is down to humans (i.e there’s no quantification) then there’s no more reason to put it under “explicit endorsement without quantification” than there is “explicit rejection without quantification”, if the consensus that abstract is supposed to be endorsing or rejecting is either a) or b). If you don’t know the level of quantification in that paper then there’s no way to know whether it endorses or rejects such a consensus. Yet, all papers rated ended up in one of the seven categories, and therefore the consensus being surveyed cannot have been a) or b).
This only leaves the consensus they found to be “climate change is happening and mankind plays a role” or, as Cook et al put it, “humans are causing global warming” (yes, but how much, of the total observed warming!?). This is unquantified (by which I mean, the percentage of warming due to mankind is unquantified). This means that the categories are, essentially, set up incorrectly in the first place. The only rejection category required would be one in which an abstract rejects humans as a cause of global warming entirely. This would have resulted in a higher consensus percentage, yet would be a consensus that the vast majority of sceptics would agree with anyway.
The consensus statistic as it stands, from this paper at least, is meaningless.
Further, Powell states:
“John Cook continues to defend the 97% figure, even though his own words falsify the starting assumption of the Cook et al. (2013) paper. On his website he writes, “That so many studies on climate change don’t bother to endorse the consensus position is significant because scientists have largely moved from what’s causing global warming onto discussing details of the problem.” But if “so many studies don’t endorse the consensus,” then endorsement cannot be the criterion of consensus and the 97% must be false.”
This is correct, and it’s also the reason NO literature survey can possibly produce a consensus figure that represents agreement on quantified AGW. By “quantified AGW” I mean a statement such as “more than 50% of observed warming is the result of human emissions”.
The only paper with some merit in determining scientific opinion on a quantified consensus is, IMO, Verheggen. They actually surveyed climate scientists and asked them how much of the observed warming was due to mankind, in their opinion. Only 60-odd percent of respondents put it as over 50%. So that’s as close as we’ve got to an accurate answer on consensus as far as I can tell. Even then, those 60-odd percent were asked how sure they were of this and only a proportion of them put their level of certainty at 95% (in agreement with the IPCC’s attribution statement).
Obama tweeted that 97% of scientists agree that global warming is real, man-made and dangerous.
People only seem to be debating the “dangerous”. This is incorrect. I would take “man-made’ in this context to mean AT LEAST “greater than 50% of observed warming due to man”. Thus, there are two possibly correct tweets he COULD have made:
1) 99.99% of the climate science literature agrees that mankind can cause SOME warming (99.99% of skeptics agree!)
2) 60-odd % of climate scientists agree: climate change is real and man-made.
Neither are particularly convincing. What he instead tweeted is an absolute lie but NOT just because of the “dangerous” part.
Note: I got the Powell result wrong earlier. It was 99.99%. Got confused with the other Obama tweet (which is misleading at best).
The Verheggen result was 65.9%. That’s from this link:
http://www.pbl.nl/sites/default/files/cms/publicaties/pbl-2015-climate-science-survey-questions-and-responses_01731.pdf
Page 8, results for question 1)a, the total of the three categories over 50%. 16.6 + 32.2 + 17.1.
Just for completeness.
@Monckton of Brenchley:
As I had heard it described, the word “expert” may be broken down as follows: “ex” = “former, has-been;” “spurt” = (as you described) “drip under pressure.” Thus, an “expert” may be defined as a “has-been drip under pressure.”
Further evidence of linguistic drift, I suppose. Cheers!
made me laugh!…..thanks!!
Oh dear, so much for transparency from Reuters!
We now know why there are no comments at the bottom of this article, they do not survive moderation!
Here is a screen capture of my comment on the article:
http://pasteboard.co/eTEzPfrlC.png
It took about 30 minutes before it was killed by a moderator.
Please don’t use RSS 3.3 TLT for comparisons. It is no longer endorsed by RSS due to unchecked drifts: http://www.remss.com/node/5166
“The lower tropospheric (TLT) temperatures have not yet been updated at this time and remain V3.3. The V3.3 TLT data suffer from the same problems with the adjustment for drifting measurement times that led us to update the TMT dataset. V3.3 TLT data should be used with caution.”
Until the new TLT v4 is here, there is a good alternative in TTT v4:
http://data.remss.com/msu/graphics/TTT_v40/plots/RSS_TS_channel_TTT_Global_Land_And_Sea_v04_0.png
More upward tampering ex post facto. That makes 4 out of the 5 longest-standing datasets that have been adjusted net-upward by a significant amount in the past few years, with the effect of bringing sober observation closer to wild prediction. Only UAH has gone the ether way, owing to spurious heating of the sensors by onboard instrumentation.
Yes, UAH has gone the other way by use of personal choices. The have an elegant approach with the single largest intersatellite uncertainty, that between the last MSU and first AMSU-satellite. They go 100% for the lowest trend alternative, and look what happens at about year 2000. Well, the choice can’t exactly be verified by weather balloons (or anything else):
http://imgur.com/a/7igG7
O R you should be carefull by comparing RATPAC data with UAH: RATPAC A is a homgenized dataset for whole area’s based on the recordings of the weather ballons. In order to calibrate the satellite records you need the RATPAC B data which is the raw data.RATPAC B doesn’t differ much with UAH…
the difference is UAH mesures the total region. RATPAC A estimates a grid region based on a wether balloon profile of a weather station.
If then RATPAC B (the raw data) is almost near the UAH (and RSS) data that means a lot.
Frederik,
Subsampling of UAH data at Ratpac locations is the right way to compare..
However, the problem with Ratpac B is that the data is raw, containing inhomogeneities. The Ratpac A procedure is both homogenisation and global averaging. Individual station series are cut at metadata breakpoints, and are not allowed to carry the regional trend over such events.
I have circumvented the problem by subsampling UAH data from Ratpac locations, and contructed a global average with the Ratpac A method. It is no major difference when comparing with “Ratpacized” UAH data, or with TLT-weighted Ratpac data:
https://drive.google.com/file/d/0B_dL1shkWewaVUdobkJYcjM5VmM/view?usp=docslist_api
When did raw data become so unacceptable to science? The day that people decided that raw observations needed to be “adjusted or homogenised” is the day that climate scientists could make past data say whatever they want. Ratpac is yet another example of this.
Pbweather,
Ratpac raw data is not adjusted per se, only cut at equipment changes etc, when constructing zonal and global averages..
Satellite series are probably the most adjusted of them all, in several steps between initial readings and final dataset.. Here is just one example, how UAH adjusts apples, pears, and oranges together, readings differing up to 10 C (or >1000 m in height), by use of a polynomial fit:
http://www.drroyspencer.com/wp-content/uploads/AMSU5-gridpoint-polynomial-fit-example.gif
I have no major problems with this procedure, but I have when Spencer and Christy do adjustments and data acceptance based on personal choice, not scientific objectivity..
Monckton of Brenchley July 23, 2016 at 3:39 am
More upward tampering ex post facto. That makes 4 out of the 5 longest-standing datasets that have been adjusted net-upward by a significant amount in the past few years, with the effect of bringing sober observation closer to wild prediction. Only UAH has gone the ether way, owing to spurious heating of the sensors by onboard instrumentation.
Correction for orbital drift/decay has been an ongoing process with the satellite temperature measurements since the necessity for it was first pointed out to Spencer and Christy in 1994 by Mears and Schabel. S & C’s original correction contained an error which was subsequently corrected in 2005 (version 5.1-5.2) following the paper by Mears et al. Such corrections are essential to producing an accurate record, they are not ‘tampering’.
Dissatisfaction with this process led to both RSS and UAH modifying their algorithms and data collection process (RSS v3-v4, UAH v5-v6), this led to a different product which in general was weighted towards higher altitudes and reduced the surface contribution.
In response to “Phil.”, there have now been so many alterations to the various datasets, nearly all of them with the effect of making apparent warming seem greater than it probably was, that it is very clear that a new, standardized, properly located and far better resolved dataset than anything now available is necessary, so that the goalposts can no longer be quite so easily moved.
Even after the tampering, there does not seem to be anything like as much warming as predicted going on.
That’s why I don’t worry about tampering.
We need a cooling about 2° K to convince CAGW-Community that there is no catastrophe. But then they will claim there is an ice age coming ! With catastrophic effect on human life! ( and of course we have to burn more fossiles)
“They” won’t change their tune. They’ll claim that we need to save the resources for the future when its (more) needed.
I noticed the following section including the term “green energy”:
“June marked the 14th straight month of record heat, the United Nations agency said. It called for speedy implementation of a global pact reached in Paris last December to limit climate change by shifting from fossil fuels to green energy by 2100.”
This makes me wonder – by the theory propounded by United Nations – are there really any kind of energy which will cause more greening than fossil fuels?
Maybe a more appropriate term would by human energy – but then they will run into problem off course – because the most affordable energy would also be the most human energy.
The MSM Media is on an all out Hillary/Climate blitz. Here is a piece that appeared in the illustrious liberal rag known as the Boston Globe penned by Karenna Gore, who really should be waiting tables at McDonalds.
Why I was arrested in West Roxbury
https://www.bostonglobe.com/opinion/2016/07/23/pipeline/KYcvOafVAHhSqjIfmoFAMI/story.html
She’s a chump off the old block.
McDonalds doesn’t have waiters or waitresses. They could hire her to stand and complain about their gas-fired grills, though.
/Mr Lynn
So, what you are saying is that coal and oil are good for the planet because your organization is funded by corporate interests like, umm, oil and coal.
Check.
“… faster than we expected in a much shorter time”
So by their own admissions warmist predictions are wrong and cannot be trusted.
Nino3.4 Index predicts UAHLT ~4 months in the future.
Accordingly, UAHLT is projected to drop to +0.13C by end October 2016, and should reach the zero anomaly before end 2016.
https://www.facebook.com/photo.php?fbid=1043110235766538&set=a.1012901982120697.1073741826.100002027142240&type=3&theater
Reference:
https://wattsupwiththat.com/2016/07/16/does-ipcc-practice-willful-blindness-of-water-vapor-to-prove-a-scientific-point-for-a-political-agenda/comment-page-1/#comment-2262020
Please look at the absolutely flat slope of UAHLTcalc in the above plot, where:
UAHLTcalc (anom. in degC, ~four months later) = 0.20*Nino3.4Index + 0.15
http://www.cpc.ncep.noaa.gov/data/indices/sstoi.indices
Here is an off-the-wall hypo:
Maybe there was some real global warming before 1982 due to the Great Climate Shift of ~1976, , but it is possible, even probable, that there was no “real” global warming since 1982 – there was only “apparent” warming, which was caused by the temporary cooling of global temperatures by the two volcanoes El Chichon in 1982 and Mt. Pinatubo in 1991.
The slope of the blue line, which is UAHLT calculated from the Nino3.4 Index, shows absolutely no average warming since 1982.
The slope of the red line, which is UAHLT actual, shows an average warming rate of 0.13C per decade.
Comments?
Regards, Allan
Allan says:
Maybe there was some real global warming before 1982 due to the Great Climate Shift of ~1976, , but it is possible, even probable, that there was no “real” global warming since 1982 – there was only “apparent” warming, which was caused by the temporary cooling of global temperatures by the two volcanoes El Chichon in 1982 and Mt. Pinatubo in 1991
Henry says
AGW alleges that heat is trapped by earth [CO2/H2O – from burning CxHx and nuclear, respectively]
according to my various measurements global cooling started around 20 years ago…
https://wattsupwiththat.com/2016/07/22/is-the-reuters-news-agency-committing-fraud/#comment-2263076
I did have a comment here, I am puzzled as to where it went….///?
AMO? It went positive right around 1995 which is about when you see a change.
Richard M re the AMO, which went positive about 1995:
Possibly Richard, but not sure. Both the cited volcanoes were big and their cooling effects each seemed to take about 5 years to fully abate.
_________
HenryP – your comment is below. You said:
“@Allan macrae
– as you can see from my graph, minima started dropping about 18 years ago; the graph includes the data for 2014. that means 1996.
– most of my graphs on other data also suggest a turning point around 1995”
Also possible Henry. I recall John Christy(?) wrote something about this.
The Nino3.4 Index proxy suggests no net warming or cooling since 1982, which is the earliest data I have for that Index – but that IS a proxy, with all the frailties that proxies bring.
In 2002 I (we) predicted global cooling would start by 2020-2030 in an article published in the Calgary Herald. That prediction was based on research on the climate change that could be related to a period of 80-90 years, similar to the Gleissberg Cycle
We (another we) now think global cooling will start by as early as 2017:
I said above:
“UAHLT is projected to drop to +0.13C by end October 2016, and should reach the zero anomaly before end 2016.”
MY best guess is that the UAHLT anomaly will hit -0.2C by about March2017, and then it is anyone’s guess where it will go. I still think we will see average UAHLT staying low and exhibiting further cooling, which I would define as UAHLT staying (on average) below the +0.2C anomaly for an extended period of time, say several decades. The occasional El Nino will increase atmospheric temperatures for a year or so from time to time, but the warming will not last.
However, I really hope to be wrong about our global cooling prediction – my predictive track record is good enough, and I’m getting old and hate the cold.
Best to all, Allan 🙂
Later last night I spoke with my friend, veteran Meteorologist Joe d’Aleo. He said the La Nina is not developing nearly as much as in 1998, and the AMO is still positive, so my 2017 start-of-global-cooling prediction may be too early.
Fine by me – as I said above, I’m getting old and hate the cold.
Best, Allan
…cites the World Meteorological Disorganization as saying the Earth is warming at “a faster rate than expected”.
Um, no, it isn’t.
http://www.funnysigns.net/files/no-we-wont-400×341.jpg
Greetings readers. This message is a respectful request for those who are well educated in radiative physics of carbon dioxide and water vapor to correct the wrongful ideas in the following paragraphs. I am not able to determine is the following statements are true. If the reader finds such an exercise desirable, please assist me in understanding if the ideas listed below are true. This text is sourced from a comment by a user on the Joannenovea global warming skeptic blog. Many Thanks and Best Wishes.
***********************************
CO2 has some 3,800 lines of absorption/emission over the 13 to 17 micron band. Radiation is temperature dependent. CO2 will radiate over those bands if the local temperature is above -50°c.
It is statistically possible for CO2 to absorb a photon from the surface over that band but it will almost immediately be re-emitted due to equipartition of energy. CO2 cannot absorb and trap energy over that band from the surface to the tropopause.
The absorption band for CO2 at 4.3 microns will absorb and rescatter radiation from the surface at a temperature in excess of 100°c. (Not a temperature normally encountered on the surface of this planet except at hot springs, volcanoes, or fires.) The 2.7 micron band would require photons emitted from a radiating surface in excess of 500°c for absorption.
There is one source that provides consistent radiation over the 2.7 and 4.3 micron bands and that is the sun. CO2 will absorb those very energetic photons and warm up the surrounding air which dutifully expands and rises. that energy never reaches the surface. that is a cooling effect.
The CO2 in the atmosphere will not reradiate in those two bands because it will be nowhere near the radiation emission temperatures of 800°c or even 400°c (peak emission temperatures of the 2.7 and 4.3 micron bands). CO2 in the atmosphere is unlikely to be near 100°c to emit the odd 4.3 micron photon. But CO2 will certainly increase the overall emission of the 13 to 17 micron bands and half that radiation does reach the surface.
Any body at a temperature that allows emission of a specified band of radiation cannot absorb that same band of radiation from another source.
CO2 does absorb energy from sunlight and warm the air but that energy never reaches the surface. that is a cooling effect. at night CO2 is continuously radiating over the 13 to 17 micron band and cooling the air. any of that radiation reaching the surface has no effect because the surface is already radiating over those same bands (and more). there is no enhanced greenhouse effect due to radiative transfer from CO2 in our atmosphere.
********************************************
Thank you for taking time to read my long question.
Now you are getting into the realm of real quantum physics. Do you think a climate model builds in these real effects – the way real molecules in a real atmosphere or on a real surface actually work.
Not a chance. Everything is just approximated on 10 km square grids for 20 two-dimensional levels in the atmosphere working one day at a time.
That is not what really happens in a real atmosphere with molecules hitting each other 6 billion times per second and absorbing/emitting photons a million times per second in a three-dimensional 100 km atmosphere intricately linked with what is occurring with the quadrillion surface molecules doing the same thing and an almost infinite number of photons coming in from the Sun each second.
You are far closer Robert to what really happens in the quantum world where this energy actually exists at.
Hello Mr Bill Illis. Thank you for your reply. Please accept my kindest regards and best wishes for your continued success.
RB, there is much wrong in what you posted, and that just concerns the Plank stuff. I would ignore it.
For a layman’s level explanation of the GHE, with illustrations, covering also the main absorption windows for CO2 and H2O, the saturation fallacy, the literal greenhouse fallacy, the downradiation surface warming fallacy… Read essay Sensitive Uncertainty in ebook Blowing Smoke.
In a nutshell, incoming sunlight (SWR) warms. Warmth produces outgoing infrared (LWR) that cools. The GHE simply retards the cooling by absorbing outbound IR then reemitting it in all directions (scattering) so less escapes to space per unit time. GHE is in essence a reduction in cooling, not a direct warming. Disproving direct warming is a red herring.
Hello Ristvan. Thank you for your reply and book recommendation. Please accept my warm regards and best wishes. Cheers.
@Robert Bumbalough, I just glanced at your question, but without addressing the details I do see two issues right off the top:
1) Though there may be peak temperatures at which various emission lines from CO2 are most prominent, this does not mean that NO radiation is being released in those particular bands at other temperatures. It also does not mean that radiation isn’t capable of being released outside those specific emission bands: a burner on lowest heat still emits visible light AND radio waves, even if there’s not enough of it to activate our eyeballs or our car stereos, for instance.
Granted, there will generally be much less of the specified wavelength at the ‘wrong’ temperatures, but there are other ways of transferring heat energy in a compressed gas (e.g. that which exists in the Earth’s troposphere) which further allow for a continuum of wavelengths to be released (e.g. collisions with other molecules which then re-radiate said heat in bands different from CO2).
Only undisturbed gasses which are fluorescing (neon signs, the aurora, etc.) are limited to emissions in specific wavelengths due to the quantized energy levels inherent in their excited electrons.
2) Any black-body may simultaneously emit & receive energy at any wavelength. Thus, a black-body that receives radiation while emitting radiation will simply cool more slowly than an identical body of the same temperature that does not receive any, regardless of the wavelengths involved. The statement “any of that radiation reaching the surface has no effect because the surface is already radiating over those same bands (and more)” is thus false.
Granted, a CO2 molecule isn’t the truest of “black-bodies,” but the ground is much less sensitive to the wavelengths it absorbs than a molecule of transparent gas (i.e. CO2, et al.), and will certainly happily absorb that (so-called “down-welling”) thermal radiation even as it’s emitting it.
NOTE: While it may be true that individual atomic/molecular particles cannot emit/receive packets exactly simultaneously during fluorescence, such an event is an extremely rare occurrence in the grand scheme of things, and large collections of such particles (e.g. a planetary atmosphere) absolutely CAN do both at once (e.g. the aurora, emission nebulae, etc.).
NOTE #2: If this is a bit much, ristvan’s comment has it exactly right, in many fewer words. ^_^
No Smokey, it was no bit much at all. ristvan’s explanations are in my mind a bit poor in comparison to yours.
Hello Smokey (Can’t do a thing about wildfires); thanks for the reply. Best Wishes. 🙂
“TIME” was introduced in the comments above.
Time is missing whenever we talk about the greenhouse effect.
When energy is generated in the centre in the Sun through fusion, it takes an average of 200,000 years for that energy to make its way to the surface and be emitted as a photon.
When energy is received by the Earth from the Sun, its average residency time in the Earth system is just “HOURS”. About 39 of them. Some photons/energy spend just seconds on Earth while others may be hundreds of years but the average is still just around 39 hours.
How much does doubled CO2 actually increase that average residency time? How could you possibly answer that question without working it out with real quantum physics level like Robert surmises rather than just general approximations like climate science surmises.
Why is the Sun 1,752,000,000 hours while the Earth is only 39 ?
Hello Bill Illis, Thanks for your replay and please forgive the tardiness of this response. Although I’ve only been interested in this AGW by CO2 topic for a few months, I’ve not yet noticed any pundit discussing residence time of photon energy in the atmosphere. Thanks for mentioning that. Best Wishes. 🙂
You are stating/accepting that energy re-emission in the 13-17 micron band has 50% likelihood of reaching the ground. I would suggest that energy re-emitted downward has a progressively greater chance of reabsorption as the atmosphere thickens going down. At lower altitudes there is also much more water vapour which, after absorbing more energy, will be unlikely to condense before taking its packet of energy back to altitude. Every absorption/readmission provides an opportunity for a change of direction.
John,
While energy re-emitted downward has a progressively greater chance of re-absorption going down, once absorbed, it also has a progressively greater chance of being re-emitted. Since re-emission can be in any direction, there’s an equal probability that any specific re-radiated photon will have a positive or negative Z component in its trajectory. While it’s true that most of the GHG energy returned to the surface originates from GHG molecules close to the surface, it’s also true that most of the energy in GHG absorption bands that leaves the planet originates from GHG molecules close to space, but neither truth affects the fraction of what’s entering the atmosphere and that ultimately leaves in any specific direction. The specific GHG density profile only affects the geometrical distribution of the absorption band photon flux passing between GHG molecules and not what comes out either side. A good way to conceptualize how GHG’s operate is as a collection of impedance mis-matched narrow band transmission lines where half of the input power is reflected back to the source.
There’s an often ignored constraint, which is that the atmosphere as a whole must conform to the basic laws of geometry, where energy entering a semi-transparent atmosphere from the surface can ultimately leave from either the top (into space) or bottom (back to the surface). The divide by 2 is based on the same logic applied to the planets relationship with solar power where energy arrives across 1/4 of the area that energy is absorbed and emitted by the surface in equilibrium with the arriving solar power. Note the distinction from the solid surface of the planet, 3/4 of which lies below the deep ocean and is not in direct equilibrium with the Sun, much like the surface of Venus.
John,
More evidence of what I’ve said can be seen in FLIR systems, which must notch out the CO2 emission spectrum or else the image will get washed out by the absorption band flux passing in all directions and among CO2 molecules.
Robert Bumbalough on July 23, 2016 at 7:24 am
I have no education in physics and therefore can’t give you any consistent response to your questions.
But I found this within your comment:
CO2 has some 3,800 lines of absorption/emission over the 13 to 17 micron band.
This information might well be some decades old. Look for more accurate info at this site:
http://spectralcalc.com/spectral_browser/db_intensity.php
Therein you find absorption/emission data originating from the HITRAN2012 database which I guess is the most recent edition actually available.
And that data you can download in pdf format (what I subsequently transformed into jpeg):
– CO2 13-17µ: http://fs5.directupload.net/images/160726/2jm64uqo.jpg
– H2O 13-17µ: http://fs5.directupload.net/images/160726/unmxdsgr.jpg
So what they give us seems to be, with over 65,000 lines for CO2, a little bit more than you have in mind…
Hello Bindidon: Thanks for your replay and please forgive the tardiness of this response. 🙂
Robert Bumbalough July 23, 2016 at 7:24 am
Greetings readers. This message is a respectful request for those who are well educated in radiative physics of carbon dioxide and water vapor to correct the wrongful ideas in the following paragraphs. I am not able to determine is the following statements are true. If the reader finds such an exercise desirable, please assist me in understanding if the ideas listed below are true. This text is sourced from a comment by a user on the Joannenovea global warming skeptic blog. Many Thanks and Best Wishes.
***********************************
You’re welcome.
CO2 has some 3,800 lines of absorption/emission over the 13 to 17 micron band. Radiation is temperature dependent. CO2 will radiate over those bands if the local temperature is above -50°c.
Hitran says a little over 67000.
The -50ºC is a misunderstanding of the Blackbody radiation curve. A blackbody at a temperature of 223K will have its peak emission in that band, other than setting the maximum envelope for CO2 at that temperature it’s irrelevant. CO2 can emit at lower temperatures.
It is statistically possible for CO2 to absorb a photon from the surface over that band but it will almost immediately be re-emitted due to equipartition of energy. CO2 cannot absorb and trap energy over that band from the surface to the tropopause.
Another error, equipartition is an equilibrium state, it says nothing about how long it takes to achieve that state. In fact when an IR photon is absorbed by a ground state molecule of CO2 it gets promoted into an excited rotational-vibrational state. The radiative lifetime of this state in the atmosphere is around a millisec, however in the lower troposphere that molecule will undergo collisions with neighboring molecules (mostly N2 and O2) about ten times per nano sec. Consequently the million+ collisions/lifetime are much more likely to deactivate the excited state than radiation. That energy will predominantly be in the form of N2/O2 kinetic energy and will not be re-emitted.
The absorption band for CO2 at 4.3 microns will absorb and rescatter radiation from the surface at a temperature in excess of 100°c. (Not a temperature normally encountered on the surface of this planet except at hot springs, volcanoes, or fires.) The 2.7 micron band would require photons emitted from a radiating surface in excess of 500°c for absorption.
There is one source that provides consistent radiation over the 2.7 and 4.3 micron bands and that is the sun. CO2 will absorb those very energetic photons and warm up the surrounding air which dutifully expands and rises. that energy never reaches the surface. that is a cooling effect.
Those wavelengths are in the tails of the solar and earth radiation spectrum, they’re not relevant.
The CO2 in the atmosphere will not reradiate in those two bands because it will be nowhere near the radiation emission temperatures of 800°c or even 400°c (peak emission temperatures of the 2.7 and 4.3 micron bands). CO2 in the atmosphere is unlikely to be near 100°c to emit the odd 4.3 micron photon. But CO2 will certainly increase the overall emission of the 13 to 17 micron bands and half that radiation does reach the surface.
In order to emit at those wavelengths the CO2 molecule would have to be in a very excited vibrational state indeed, very unlikely (perhaps in the thermosphere?).
Any body at a temperature that allows emission of a specified band of radiation cannot absorb that same band of radiation from another source.
Not true.
CO2 does absorb energy from sunlight and warm the air but that energy never reaches the surface. that is a cooling effect.
See above.
at night CO2 is continuously radiating over the 13 to 17 micron band and cooling the air. any of that radiation reaching the surface has no effect because the surface is already radiating over those same bands (and more).
In order to radiate in that band a CO2 molecule would first have to be excited by the appropriate energy photon. Any photons radiated by the CO2 that reached the surface would be absorbed.
“That energy will predominantly be in the form of N2/O2 kinetic energy and will not be re-emitted.”
No. The most likely result of a collision of a GHG molecule with N2/O2 is for the GHG molecule to re-emit a photon. Remember that this is quantum mechanics and returning to the ground state must release all the energy of a state transition at once. Small amounts can be transferred to and from the kinetic energy of the GHG molecules motion only and the result is absorption or emission of a photon with a slightly higher or lower frequency (with equal probability) and a slightly faster or slower GHG molecule which is the mechanism behind collisional broadening, where the apparent absorption/emission spectrum spreads out. Because of the equal probability of adding to or taking away from the kinetic energy of motion, there can be no NET transfer of energy from excited GHG’s to N2/O2. The only other components of the atmospheric that can absorb photons in GHG absorption bands are liquid and solid water or aerosols, which to be in LTE must absorb what they emit, thus again, no NET transfer occurs.
Keep in mind that relative to thermometer measurements, a photon flux and faster kinetic motion of molecules are indistinguishable. This can only be discerned by examining the emission spectrum of the planet which has far to much energy emitted in GHG absorption bands then can be supported by the idea that GHG absorption is converted into the kinetic energy of O2/N2 which being transparent to the relevant energy bands, has no influence on the emissions of the planet.
co2isnotevil July 26, 2016 at 9:37 am
“That energy will predominantly be in the form of N2/O2 kinetic energy and will not be re-emitted.”
No. The most likely result of a collision of a GHG molecule with N2/O2 is for the GHG molecule to re-emit a photon. Remember that this is quantum mechanics and returning to the ground state must release all the energy of a state transition at once.
Unfortunately not, if it were so it would have made my Laser induced fluorescence experiments much easier!
Collisional deactivation from one rotational state to another only involves about 1cm-1 but with so many collisions it doesn’t take long.
http://www.barrettbellamyclimate.com/userimages/CO21M.jpg
Check out Stern-Vollmer equation.
Phil,
As you can see from the picture you sent, there’s an equal probability of increasing the rotational state as there is decreasing it, thus the net kinetic influence is zero. Otherwise, there would only be fine structure on one side of resonance. The picture also demonstrates how its a small amount at each transition owing to the tight spacing between lines in the sub-structure. Absorption by electron shells is a resonant property and as conditions push the required characteristics away from resonance, the probability of spontaneous emission also increases. There are also significant differences in the possible behaviors between the collision of an energized CO2 molecule with another, energized or not and collisions with a non electromagnetically reactive O2/N2 molecules. As a though experiment to understand the effect O2 and N2 has on the surface temperature, consider how the average temperatures on the Moon would change if it had an atmosphere consisting of 1 ATM of O2 and N2, but no GHG’s or clouds (Hint: the lunar average won’t change by any significant amount).
co2isnotevil July 26, 2016 at 1:23 pm
Phil,
As you can see from the picture you sent, there’s an equal probability of increasing the rotational state as there is decreasing it, thus the net kinetic influence is zero. Otherwise, there would only be fine structure on one side of resonance.
You misunderstand what you’re looking at, those are the P, Q & R branches of the spectrum resulting from the lower vibrational manifold. The lower energy branch (P) is the result of a transition from v=0, J to v=1, J-2, the middle branch (Q) is the result of a transition from v=0, J, to v=1, J, and the upper branch (R) is the result of a transition from v=0, J to v=1, J+2.
The picture also demonstrates how its a small amount at each transition owing to the tight spacing between lines in the sub-structure.
And such a small amount of energy can easily be transferred during a single collision.
Absorption by electron shells is a resonant property and as conditions push the required characteristics away from resonance, the probability of spontaneous emission also increases.
We’re talking about resonance of the dipole formed by a bond (vibrational and rotational) not electrons.
As usual the good lord (lord spelled with no capital) has it right….again….thanks.
Amongst other things he said:
More upward tampering ex post facto. That makes 4 out of the 5 longest-standing datasets that have been adjusted net-upward by a significant amount in the past few years, with the effect of bringing sober observation closer to wild prediction. Only UAH has gone the other way, owing to spurious heating of the sensors by onboard instrumentation.
Henry says:
my point exactly.
I simply don’t trust any data sets anymore, except my own:
Minimum temperatures are falling, as you can see from my results, so, there is no room in the equation for any AGW. Not even as a possible “small factor”. Those on the “green” gravy train have every interest in pushing the “official measuring ” organisations in a certain direction on their own so-called data sets>
and , OTOH,
the sun is at its most destructive in its 87 year cycle so any probe material used in space to measure T will simply not hold out. Earth is in a cooling cycle, as its atmosphere re-organizes itself to protect us from the most energetic particles from the sun. It’s amazing to be able watch this happening. Unfortunately, it seems I am all alone or perhaps there are just a few people with me like those giving their own honest opinion on this site…
It is like peeing in your pants, when you are lucky that the pants are black: it gives you a warm feeling.
[un?] fortunately nobody notices….
@Allan macrae
as you can see from my graph, minima started dropping about 18 years ago; the graph includes the data for 2014. that means 1996.
most of my graphs on other data also suggest a turning point around 1995.
Hmm, OK, you pulled my original comment, fair enough but what I alluded to, in that Reuters is merely plugging the official UK-EU government line is, made is it not?
Tacit approval or officially ordained, the link is clear and Reuters are only being ‘good little boys’ or in this case, girl.
Until, the ‘our’ the UK {and EU, US governments for that matter} government redirects to totally dismantle the green agenda – ends the specious lies and the subterfuge concerning this great scam. If also must follow on behalf of the HMG to curtail and end the corporate carousel palliative rip off [ paying for useless technologies; birdmincers, rank upon rank of diesel generators…. real driver of climate
bolloxscam …….to cease forthwith to making taxpayers liable to fund an insane adventure in moonbeam technologies and by iniquity and inequity, taxpayers are enforced by law to fund this evident madness [man made warming]….Thus, I beg, defenestrating jejune reporters’s copy ex Reuters however clever it is, is of no real value whatsoever – is it?
Government, banksters and corporate giants to me are, the real enemy – Reuters are only the messenger boys.
Every article written about AGW, CAGW and/or the GHG effect should be required to answer “how does CO2 cause the observation?” If we are going to blame CO2, we should force researchers and the press to specifically state how CO2, whose only impact on the climate is trapping IR between 13 and 18µ, can cause the observed observation/warming. Record daytime temperatures are not caused by trapping outgoing radiation of wavelength 10µ, they are caused by more incoming viable radiation reaching the earth’s surface and oceans. Warming does not prove CO2 is the cause, especially record high temperatures that can only be reached by adding more energy to the system, not trapping existing energy.
http://www.azimuthproject.org/azimuth/files/earth_and_sun_emission.jpg
http://faculty.icc.edu/easc111lab/labs/labi/waveradi.jpg
..Clouds…which the models cannot “model” !
See my reply to RB just upthread. You apparently misunderstand the GHE.
I wonder why the Plank curve is always represented in a wavelength scale for climate purposes. Showing it on a frequency scale yields a much better physical insight, since the total energy there is simply the area below the curve. Notice that your first graph uses a logarithmic scale for wavelength. The total radiative flux in a 1 micrometer band between 1 and 2 um should be compared with a flux between 20 and 21 um.
@Rud Istvan
try and understand that the biggest anti-GHE is being ignored…
https://wattsupwiththat.com/2016/07/09/alarmism-claiming-normal-as-abnormal-began-on-a-global-scale-with-ozone/#comment-2260215
Bravo Lord Monckton. Is it possible to get a compact, readily understandable, climate in a nutshell crib sheet to Trump’s campaign people, or to DJ Trump himself for such a personage as yourself? I think he’s the guy to finish off this gross global fraud and defund this Marx brothers grandest Totalitarian putsch.
Small light-bulb moment reading this: the chart on the frequency of temperature maxima invites us to conclude that there is ‘nothing to see here’ because of the downtrend in the frequency of maxima.
However, in a stable climate, the frequency of maxima naturally falls: each successive maximum raises the bar for the next. I can’t do the maths in my head, but some kind of tailing down towards zero is to be expected, unless there is warming.
Overall the graph is hard to interpret! It might be consistent with ‘nothing to see here’ but very hard to tell at a glance.
Russel, you say:
Small light-bulb moment reading this: the chart on the frequency of temperature maxima invites us to conclude that there is ‘nothing to see here’ because of the downtrend in the frequency of maxima
Henry says
where is your chart//?
Wow – I learn a lot here. Thanks to all 🙂
To make claims regarding climate change and AGW, there has to a long history of data to compare human activity to actual conditions on the ground (or water). Truthfully, reliable data only exists for as long as the satellite technology created to acquire it. 40 years of data, millennia of post-ice age history involving humanity….and climate models presented in ways to support AGW theory as the only links connecting the dots. We have a miniscule amount of data, yet the climate industry and the governments it owns are engaging in massive fraud to convince us that humanity somehow has control over climate change borne of an inherently chaotic system.
Some interesting discussion.
U.S. Coal/ jobs etc. “should” be a big topic in the upcoming Presidential Election!
Should be, yes, but the Main Stream Media will do whatever is necessary to keep it from being anything but a minor footnote.
Agree with you Rob.
When politicians get energy policy completely wrong, almost nothing else that they do really matters. They drive up energy costs, kill jobs, and increase winter mortality rates, especially among the elderly and the poor.
This is abundantly clear in the UK – they have much higher energy costs, and much higher Excess Winter Mortality Rates than Canada and the USA.
Fortunately, the Brits are finally abandoning their ridiculous green energy policies and returning to energy sanity.
Cheap, abundant reliable energy is the lifeblood of society – it IS that simple.
When misinformed politicians fool with energy systems, innocent people suffer and die.
Regards, Allan
Allan MacRae. P. Eng.
Reference: “Cold Weather Kills 20 Times as Many People as Hot Weather” by Joseph D’Aleo and Allan MacRae, September 4, 2015
https://friendsofsciencecalgary.files.wordpress.com/2015/09/cold-weather-kills-macrae-daleo-4sept2015-final.pdf
“What we’ve seen so far for the first 6 months is really quite alarming. ”
No worries 6 months is just weather not climate. 🙂
http://www.vukcevic.talktalk.net/ETMf.jpg
In our unquenchable desire to search for truth we often do not notice things that nature warns us about (paraphrasing MTC)
I have a question regarding this chart (from an earlier post in this thread):
Is this a “real world” estimation that includes things like the cooling effect of precipitation or is it an estimation assuming no other atmospheric temperature forcings?
In other words, is it saying for a certain level of Atmospheric CO2 we will have a specific temperature increase or is it saying that the most the increase can be is what is shown, but other factors may lessen the overall CO2 effect?
I built this chart. 8 years ago now. Maybe i have been in this game for too long now, I don’t know.
But it is a depiction of two things:
–> the black line is what the 3.0C per doubling of CO2 theory implies. What it is really based on. A simple thing like the level of water vapor depends entirely on the level of CO2. Climate scientists like Andrew Lacis, Gavin Schmidt, and Richard Alley have speculated that this is true but the theory itself actually is based on that. If there is no CO2, there is no water vapor (well maybe 5% left). The Earth is frozen desert. In mathematical terms. It also implies that CO2 cannot possibly be more than 3.0C per doubling despite what the climate scientists try to depict in their distribution of potential temp increase per doublng of CO2 charts. The 3.0C per doubling formula is an absolute Max. (Every climate scientist is just bad at basic math, that is why they migrated into the field in the first place which is why they do not get this).
–> the red line is what the actual Hadcrut3 temperature observations to 2008 observations imply the real CO2 sensitivity is. Natural cycles are removed first before one gets to this level.
A more-up-to-date chart would have the red line – real observations – flattened somewhat and the temperature increase value at doubling would be in the 1.5C range versus 1.85C in the chart.
I have gone through all this crap 10 ways from Sunday (I have a degree in Math) and it always, always, always turns out exactly like this. The theory is just wrong by something like 50% or more and climate science today is really all about trying to AVOID people recognizing this truth. Delay the reckoning until i retire or until I am dead. I have a Phd program and $400,000 per year of NSF funding each year and I will not jeopardize that. That is what a climate scientist is today.
Bill Illis July 23, 2016 at 8:06 pm
“Maybe i have been in this game for too long now, I don’t know.
Now THAT was alarming!
Please, Bill. Never give up. I look for your replies in comments because you communicate the technical details in a way this dumb ol’ engineer can comprehend. And when you call B.S. on some erroneous point made in comments or in an article, you have the intellectual guns and the data behind you.
To borrow from the old E.F. Hutton commercial, “When Bill Illis talks, people listen.”
Doesn’t time fly? It is now almost exactly 9 years since “the greatest morale challenge of our time” was called by one on the most challenging prime ministers of Australia’s time.
But isn’t it completely strange that this catastrophe that the world faces was NOT MENTIONED ONCE in the 75 minute speech by the Republican candidate for the next president of the United States?
Even stranger is the fact that all of the newspapers I have read since, that have echoed Mr Rudd’s alarm over the years, NOT ONCE mentioned Mr Trump’s apparent glaring omission. Good gracious me, what has happened?
Have the dams suddenly started filling? Do the children still know what snow is? Could it be that the people are beginning to suspect that our current warming really IS within natural variation? Are the birds still singing in the trees? Or, are there just many more moral challenges these days?
Whatever the answer, my only advice to prospective doomsayers to avoid any future unpleasant embarrassment, is to make sure you have well and truly left this earth before the date of your predicted doomsday cataclysm.
“Are the birds still singing in the trees?”
Millions fewer birds are singing in the trees. The windmills got them.
Dear Reuters,
I find your news stories kinda useful
http://cdn.thisiswhyimbroke.com/images/horror-story-toilet-paper-640×533.jpg
perhaps, as a chemist, I need to inform some of you of a few basic truths.
first of all, it took ages for earth to produce enough CO2/CO3 to produce life. You need at least ca. 200 ppm CO2 in the air to be able to get life [crops]
Apart from the CO2 in the air, there are giga tons and giga tons of CO3 dissolved in the oceans….an unlimited supply of CO2 if it is warming:
CO3 (2-) + H2O + warming => CO2 (g) + H30(1+)
the opposite also happens! Coldness is a sink for CO2
CO2 + H2O + coldness => CO3 (2-) + OH (1-)
ergo,
CO2 increase follows a warming trend
Hence, the link between increasing CO2 and warming is negative….
it is like saying cancer causes smoking when we all know that it is the other way around…..
true enough
I have the reactions the wrong way around as they don’t balance properly…
I must be getting[very] old?
should be
CO3 (2-) + H2O + warming => CO2 (g) + 2OH (1-)
the opposite also happens! Coldness is a sink for CO2
CO2 + 3H2O + coldness => CO3 (2-) + 2H3O (1+)
sorry….
Should that be “alleged” link between CO2 and warming? In the case of the alleged link between smoking and cancer, we know something else must be involved because some people who smoke do not get cancer and some people who get cancer never smoked.
The alarmists claimed that one of the consequence of a warming climate would be an increase in the frequency and intensity of tropical storms [cyclones in Australia].
When the frequency didn’t increase, but rather seemed to decrease, the response was that in a warming world the frequency of tropicals storms would decrease [for some reason] but their intensity would increase.
Records kept by BOM in Australia show that since the 1970s [records are a bit patchy earlier than that] cyclone frequency has decreased and that their intensity has remained the same or decreased slightly.
http://www.bom.gov.au/cyclone/climatology/trends.shtml
Then there is the Atlantic……..according to NOAA researchers..”the historical tropical storm count record does not provide compelling evidence for a greenhouse warming induced long-term increase”
http://www.gfdl.noaa.gov/historical-atlantic-hurricane-and-tropical-storm-records.
Is there more information on the Arctic cruise ship(s) which Lord M says is/are currently holed up in Murmansk? I notice that a large cruise ship (the “Crystal Serenity”) is supposed to be taking a trip through the N-W passage in August. Is that still happening? Any info would be welcome.
It’s not a cruise ship, it’s a yacht and Monckton was mistaken about it being holed up in Murmansk (that’s the problem with believing what ‘Steve Goddard’ says).
To add to Phil’s reply, the Northabout left Murmansk on the 20th July and is currently in the Kara Sea.
You can track their progress here
http://polarocean.co.uk/
I’ve no idea if this challenge will succeed, but dismissing them as a “Ship of Fools” is pretty insulting.
Thank you.
Breitbart.com and realclimatrscience.com have the details of the latest Ship of Fools expedition.
mark my words
that ship will get stuck
just like the ship of Willem Barentz….
@Phil.
I have repeatedly explained to you in the past what “absorption” really means. Are you saying that ozone is not a GH gas? Both ozone and peroxide have absorption in the UV region. Unfortunately you don’t exactly what it means?
Anyway for those interested here we can do the GH-effect 101 again (and that includes the anti-GH effect caused by ozone, peroxides and other TOA)
“I am watching with some amusement a lot of scholar discussions on the green house effect as I realised again that the people that I encounter on most scientific blogs don’t understand the chemistry principle of absorption and subsequent re-radiation. In fact very few people do understand it because if they did they would have raised the alarm bells ringing long time ago. But they all got stuck at Tyndall and Svante Arrhenius. …
They know that CO2 (carbon dioxide) “absorbs” in the 14-15 um region. Most people think that what it means is that the molecules absorbs photons here which then subsequently get transferred as heat to neighboring molecules. Then it absorbs again, and so on, and so on…and all the absorbed light is continuously transferred to heat…
Although this may happen up to a certain saturation point as soon as the light or radiation hits on the gas, that is in fact not what is causing the heat entrapment.
The best way to experience re-radiation for yourself is to stand in a moist dark forest just before dawn on a cloudless night. Note that water vapour also absorbs in the visible region of the spectrum. So as the first light of sun hits on the water vapour around you can see the light coming from every direction. Left, right, bottom up, top down. You can see this for yourself until of course the sun’s light becomes too bright in the darkness for you to observe the re-radiated light from the water vapour.
A second way to experience how re-radiation works is to measure the humidity in the air and the temperature on a certain exposed plate, again on a cloudless day, at a certain time of day for a certain amount of time. Note that as the humidity goes up, and all else is being kept equal, the temperature effected by the sun on the plate is lower. This is because, like carbon dioxide, water vapour has absorption in the infra red part of the spectrum.
We can conclude from these simple experiments that what happens is this: in the wavelengths areas where absorption takes place, the molecule starts acting like a little mirror, the strength of which depends on the amount of absorption taking place inside the molecule. Because we can assume that the molecule is like a perfect sphere, 62,5% of a certain amount of light (radiation) is send back in the direction where it came from. This is the warming or cooling effect of a gas hit by radiation in the absorptive region.
Unfortunately, in their time, Tyndall and Arrhenius could not see the whole picture of the spectrum of a gas which is why they got stuck on seeing only the warming properties of a gas. [closed box experiments]
If people would understand this principle, they would not singularly identify green house gases (GHG’s) by pointing at the areas in the 5-20 um region (where earth emits pre-dominantly) but they would also look in the area 0-5 um (where the sun emits pre-dominantly) for possible cooling effects.
We also know that CO2 aborbs in the UV area and this re-radiation is in fact used to identify CO2 on other planets
In all of this we are still looking at pure gases. The discussion on clouds and the deflection of incoming radiation by clouds is still a completely different subject.
So what everyone should be doing is looking at the whole spectrum of the gas molecule 0-20 um. Unless you come to me with a balance sheet of how much cooling and how much warming is caused by a gas, we don’t actually know whether a substance is a net warmer or a net cooler.
Seeing that CO2 also causes cooling by taking part in the life cycle (plants and trees need warmth and CO2 to grow), and because there is clear evidence that there has been an increase in greenery on earth in the past 4 decades, I think the total net effect of more carbon dioxide in the atmosphere could even be zero or close to zero. But unless we cone up with a test method and measurements, we will never know for sure.
For proof that CO2 is (also) cooling the atmosphere by re-radiating sunshine, see here:
http://www.iop.org/EJ/article/0004-637X/644/1/551/64090.web.pdf?request-id=76e1a830-4451-4c80-aa58-4728c1d646ec
They measured the re-radiation from CO2 as it bounced back to earth from the moon. So the direction was sun-earth-moon -earth. Follow the green line in fig. 6, bottom. Note that it already starts at 1.2 um, then one peak at 1.4 um, then various peaks at 1.6 um and 3 big peaks at 2 um. It all comes back in fig. 6 top.
This paper here shows that there is absorption of CO2 at between 0.21 and 0.19 um (close to 202 nm):
http://www.nat.vu.nl/en/sec/atom/Publications/pdf/DUV-CO2.pdf
There are other papers that I can look for again that will show that there are also absorptions of CO2 at between 0.18 and 0.135 um and between 0.125 and 0.12 um.
We already know from the normal IR spectra that CO2 has big absorption between 4 and 5 um.
So, to sum it up, we know that CO2 has absorption in the 14-15 um range causing some warming (by re-radiating earthshine) but as shown and proved above it also has a number of absorptions in the 0-5 um range causing cooling (by re-radiating sunshine). This cooling happens at all levels where the sunshine hits on the carbon dioxide same as the earthshine. The way from the bottom to the top is the same as from top to the bottom. So, my question is: how much cooling and how much warming is caused by the CO2? How was the experiment done to determine this and where are the test results? (I am afraid that simple heat retention testing might not work here, we have to use real sunshine and real earthshine to determine the effect in W/m3 / [0.03%- 0.06%]CO2/m2/24hours)”
henryp July 26, 2016 at 7:57 am
@Phil.
I have repeatedly explained to you in the past what “absorption” really means. Are you saying that ozone is not a GH gas? Both ozone and peroxide have absorption in the UV region. Unfortunately you don’t exactly what it means?
I know exactly what it means Henry.
In the UV O3 absorbs causing an electronic transition, however the upper state is above the dissociation limit and the molecule falls apart resulting in an O2 molecule and an O atom:
O3 + h𝜈 -> O2 + O
That has nothing to do with O3 being a GH gas, the UV supplied the energy to break the bond and there is no re-radiation of it. Similarly for peroxide:
H2O2 + h𝜈 -> 2OH
Ozone also absorbs in the IR, principally at ~1000 cm-1, without dissociating, which allows it to act as a GH gas.
@Phil.
https://wattsupwiththat.com/2016/07/22/is-the-reuters-news-agency-committing-fraud/comment-page-1/#comment-2265147
let me get an answer from you on that comment now, otherwise you come back with the same story again on the next thread…
Already answered:
https://wattsupwiththat.com/2016/07/22/is-the-reuters-news-agency-committing-fraud/comment-page-1/#comment-2265266
@Phil.
no. We disagree.
the graph clearly shows the purple line starting at 0.6 um and it can be implied to go back further, below 0.6
similarly, it also does not show the absorptions and subsequent re-radiation of water and CO2 beyond 4 um but you and I know that it is there –
coming back from the moon-
that is=
HenryP July 26, 2016 at 1:09 pm
@Phil.
no. We disagree.
the graph clearly shows the purple line starting at 0.6 um and it can be implied to go back further, below 0.6
No, that’s the Chappuis-Wulf band, in the visible:
http://joseba.mpch-mainz.mpg.de/spectral_atlas_data/cross_sections_plots/Ozone/O3_ChappuisWulf_lin.jpg
As you see it only extends to 450nm.
The UV band, the Hartley-Huggins band, below 350nm is not covered in that paper, and that is the band associated with O3 dissociation.
http://www.intechopen.com/source/html/6775/media/image2.jpg
dear Phil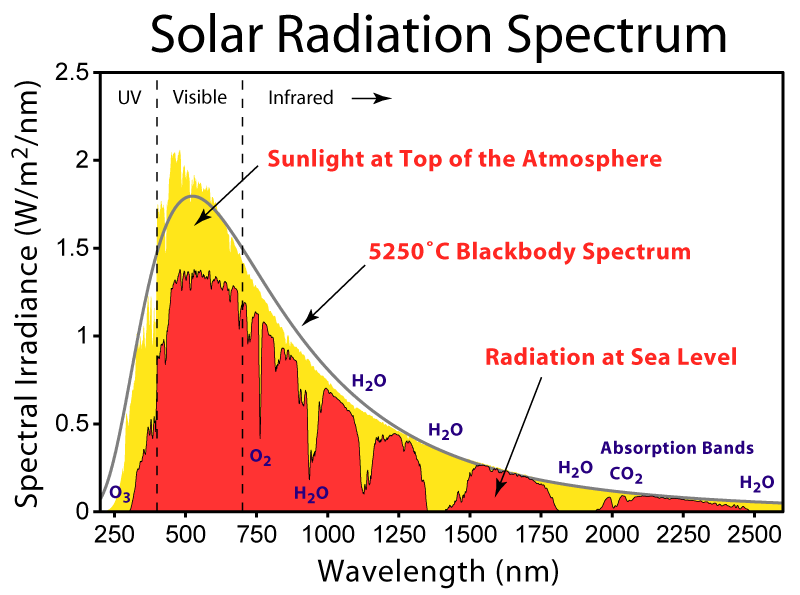

I have already explained this to you before.Look here.
the spectrum shows all the absorption bands of the important components that cut away a portion from the sun’s rays (i.e. the difference between the yellow and red)
[pity that at some point chemists started talking about “absorption”. That has caused a lot of confusion. In my days we used to call it extinction]
The O3 has major absorption in the UV region, causing it to back radiate, just like the other gases.
Ozone itself is made by the sun’s most harmful rays. As is the H2O2 and N-Oxide.. That is our protection against the most harmful rays from the sun. In a time of very low solar polar magnetic field strengths, such as now, more harmful rays are released and more ozone & others are manufactured TOA. Hence we have ozone increasing, both in the NH and the SH. Peroxide has almost the same spectrum as ozone…so we can add it in there with the O3 in the solar spectrum.
More ozone & others means that the difference between the red and yellow becomes bigger.
That anti-GH effect is much bigger than the GH effect.
Do you understand why it is cooling now?
henryp July 27, 2016 at 2:10 am
dear Phil
I have already explained this to you before.Look here.
You have stated it before, it was wrong then and it is still wrong!
The O3 has major absorption in the UV region, causing it to
back radiatebe destroyed,just likeunlike the other gases.Ozone itself is made by the sun’s most harmful rays. As is the H2O2 and N-Oxide.
The UV energy absorbed by the O3 molecule has been used to break a O-O bond, unlike the case of IR absorbed by CO2 which causes the bond to vibrate at a higher frequency and therefore have the ability to radiate IR (unless it’s depleted by multiple collisions before it has time to radiate).
@CO2 is not evil
would be nice if some of the astronauts had left a T measurement instrument on the moon transmitting the results on a regular basis….
HenryP,
They did leave some measuring equipment, but it’s probably inoperative now and I haven’t been able to fund a source for the original data. It would be a very good indicator of the effects of all energy from the Sun, rather than just that we think we know about. If we saw a small change on the Moon which was not as big terrestrially, it would be a clear indication of net negative feedback. It it reflected a bigger change, it would be representative of net positive feedback.
Frederik Michiels on July 23, 2016 at 1:00 pm
O R on July 23, 2016 at 1:45 pm
O R you should be carefull by comparing RATPAC data with UAH: RATPAC A is a homgenized dataset … In order to calibrate the satellite records you need the RATPAC B data which is the raw data.
This opinion looks a bit strange for anybody having analysed the IGRA context and, by extension, its RATPAC subsets.
Simply because everybody can see that the full IGRA dataset looks 100% more raw and unadjusted than does the RATPAC B.
This is best shown by plotting together the following three datasets for the period 1979-2016:
– the original RATPAC B dataset called „monthly combined“;
– the dataset constructed by filtering, out of the full IGRA dataset, all records produced by the 85 RATPAC B radiosondes;
– the full IGRA dataset.
http://fs5.directupload.net/images/160726/7f76pxli.jpg
According to Kevin Cowtan, the IGRA dataset shows a much higher deviation from linearity than does the dataset generated by the RATPAC B sondes, and the latter shows similar compared with the data originating from the original RATPAC B „monthly combined“.
There is evidence that, if the original RATPAC B dataset never had been subject to modifications of any kind, there would be no difference at all between it and that what has been extracted out of the full IGRA dataset for the 85 RATPAC radiosondes.
“I once saved the owners of the swank rent-a-suite megaship The World from losing a fortune when her otherwise perfectly sane skipper had conceived the notion of sailing her through the North-West Passage, and had sold them on the idea.”
Could you say when this happened? Presumably not in 2012 when The World successfully sailed through the North-West Passage,
Presumably when Monckton was in Fremantle in 2011, in which case they clearly ignored his advice and sailed through the NW Passage at the next available opportunity! There’s even a youtube documenting the voyage.
That’s what I was thinking, but The World didn’t visit Fremantle in 2011, but was there in Feb 2012, when it was already scheduled to go through the Northwest Passage.
https://web.archive.org/web/20120101215229/http://aboardtheworld.com/journey
So if this is the point when Monckton persuaded the skipper that it was impossible, they must have ignored his advice. In which case he didn’t save them a fortune.
Phil. says
The O3 has major absorption in the UV region, causing it to back radiatebe destroyed, just likeunlike the other gases.
Henry says
You just changed my words. Can you also change the graph that I quoted?
Truth is that very few people really do know what is happening, exactly, TOA, as evident from the introduction of this report
http://www.nat.vu.nl/en/sec/atom/Publications/pdf/DUV-CO2.pdf
I do know is that ozone is increasing, both NH and SH and it started going up from 1995 which corresponds with the dates I have for the Gleissberg [various factors including my own data sets on maxima and minima]
ozone scare was a red herring just like the CO2 scare is a red herring…..
HenryP July 27, 2016 at 9:30 am
Phil. says
The O3 has major absorption in the UV region, causing it to
back radiatebe destroyed,just likeunlike the other gases.Henry says
You just changed my words. Can you also change the graph that I quoted?
No I just corrected your statement. Regarding the graph you quoted, as I pointed out before it shows no UV reflected from the moon in the O3 absorption band, so there is no correction necessary, it doesn’t show what you claim it does!
When O3 absorbs UV below ~350nm the molecule falls apart in about 1psec, there is no surplus energy to radiate so the reradiation of ~50% back to space is impossible.
@Phil.
I think you are being deliberately misleading now?
this graph
shows that a large portion of UV is being back radiated by the ozone, [+ peroxides + N-oxides]. In fact, everything indicated as yellow is back radiated by the so-called greenhouse gasses. It is the anti-GH effect that perhaps people like you donot want to talk about?
One can only wonder why.
Figure 6 from the earthshine [via the moon] investigation quoted by you exactly confirms the absorption bands of the solar spectrum including the purple one from O3 which can be seen declining towards the UV region, exactly as one would expect from the graph on the solar spectrum.
Perhaps you have to re-write your books?
Good luck with that.
HenryP,
It’s just like the GHG effect in the atmosphere. About half of what’s absorbed by the atmosphere from the surface is radiated back to the surface and about half escapes to space. The same is true with the GHG effect at higher wavelengths, except that the energy being absorbed arrives from the top, rather than the bottom of the atmosphere, yet still has 2x the area to eventually leave so about half of the solar input absorbed from space is reflected back out to space while the remaining half is radiated back to the surface. It’s a basic geometric requirement that the data confirms even as consensus climate science conveniently ignores this inconvenient reality of physics.
If we count the effects of absorption of surface radiant emissions by GHG’s and clouds, about 76% of what’s emitted is absorbed. At an average surface temperature of 287K, it emits 385 W/m^2, thus the atmosphere absorbs 293 W/m^2 leaving only 92 W/m^2 to escape. However, we need 239 W/m^2 to escape to match the power arriving from the Sun which is a deficit of 239-92 = 147 W/m^2. This can only come from the 293 W/m^2 being absorbed by the atmosphere, leaving 146 W/m^2 which when added to the 239 W/m^2 from the Sun is equal to the 385 W/m^2 being emitted by the surface. Not only are the boundary conditions at the top and bottom of the atmosphere met, the 50/50 split required by geometry emerges.
Do you think its a coincidence that half of the radiation absorbed by the atmosphere is required to make up the difference in planet emissions and the other half is required to make up the difference in surface emissions at its elevated temperature?
Trenberth incorrectly assumes the 76% is closer to 90%. If we plug in his number, the atmosphere absorbs 346 W/m^2 leaving only 39 W/m^2 to escape and a deficit of 200 W/m^2, which when subtracted from the 346 W/m^2 absorbed again leaves 146 W/m^2 which when added to 239 W/m^2 becomes the 385 W/m^2 required to replace the power emitted by the surface.
If the transparent window is really as narrow as Trenberth claims, then the required split becomes 57.8% of the radiation absorbed by the atmosphere must be emitted to space while only 42.2% is returned to the surface. This contradicts the consensus requirement to claim that more than 100% of what the atmosphere incrementally absorbs must be returned to the surface in order to support the claimed sensitivity. His attempt to obfuscate this obvious problem is why he incorrectly conflates radiant power transported by photons with non radiant energy transported by matter relative to the radiant balance of the planet. Unfortunately, when you add non radiant energy to the atmosphere, it can only be returned to the surface (Trenberth incorrectly refers this to back radiation even though is has nothing to do with photons). If you add 54 W/m^2 to the amount absorbed, you must increase ’emissions’ by the same amount, 439 W/m^2, absorbed power becomes 400 W/m^2, 40 W/m^2 escapes, 199 W/m^2 of the 400 W/m^2 is required to make up the output deficit and the remaining 201 W/m^2 is added to 239 W/m^2 to arrive at the 439 W/m^2 of ’emissions’. OK, now we have the required 50/50 split, except that the surface is not emitting 439 W/m^2 of NET radiant energy because if it was, its temperature would be about 10C warmer than it actually is.
HenryP July 27, 2016 at 11:30 am
@Phil.
I think you are being deliberately misleading now?
No that’s what you’re attempting!
this graph shows that a large portion of UV is being back radiated by the ozone, [+ peroxides + N-oxides]. In fact, everything indicated as yellow is back radiated by the so-called greenhouse gasses.
It shows nothing of the sort, the color yellow indicates that the light at the TOA hasn’t made it to the surface. It does not show that any of the UV is being back radiated by the ozone.
Figure 6 from the earthshine [via the moon] investigation quoted by you exactly confirms the absorption bands of the solar spectrum including the purple one from O3 which can be seen declining towards the UV region, exactly as one would expect from the graph on the solar spectrum.
That graph shows nothing below 600nm, that is your fantasy.
Here’s the Earth’s UV/visible spectrum from the LCROSS mission.
http://blogs.discovermagazine.com/badastronomy/files/2009/08/lcross_spectrum2.jpg
Note the absence of UV below ~320 (where O3 absorbs).
Phil. says
it shows nothing of the sort, the color yellow indicates that the light at the TOA hasn’t made it to the surface. It does not show that any of the UV is being back radiated by the ozone.
Henry says
So explain to us all how and why exactly the yellow did not make it to the surface when clearly it was there TOA? Please also explain your theory as to why the yellow indicated in the UV region did not make it to sea level?
HenryP July 27, 2016 at 12:34 pm
Phil. says
“it shows nothing of the sort, the color yellow indicates that the light at the TOA hasn’t made it to the surface. It does not show that any of the UV is being back radiated by the ozone.”
Henry says
So explain to us all how and why exactly the yellow did not make it to the surface when clearly it was there TOA? Please also explain your theory as to why the yellow indicated in the UV region did not make it to sea level?
As is clearly indicated on the graph in Blue in the visible and IR regions it is predominantly absorbed by CO2 and H2O. Below ~300nm you have strong absorption by O3 and O2 also Rayleigh scattering becomes important here (1/𝝺^4 dependence), you also have Mie scattering from clouds in the Vis and near IR.
None of the light that you see in the clouds in this image made it to the surface.
http://coopergreendesign.com/blog/wp-content/uploads/2010/04/earth1.jpg
phil. says
As is clearly indicated on the graph in Blue in the visible and IR regions it is predominantly absorbed by CO2 and H2O. Below ~300nm you have strong absorption by O3 and O2
henry says
let us forget about the clouds, for now, as I remember that the original solar spectrum graph
was specifically taken on a cloudless day.
Now you say – or you admit – that the CO2 and H2O and the O3 and O2 “absorbed” the yellow portion of the graph. Now, this is where the confusion with “absorption” comes in. In my old language, we rather used the word extinction instead of absorption. According to you, or your theory, or your books, what exactly is happening to the missing [yellow] radiation?
henryp July 27, 2016 at 11:51 pm
phil. says
“As is clearly indicated on the graph in Blue in the visible and IR regions it is predominantly absorbed by CO2 and H2O. Below ~300nm you have strong absorption by O3 and O2”
henry says
let us forget about the clouds, for now, as I remember that the original solar spectrum graph was specifically taken on a cloudless day.
Seems reasonable, there will still be some Mie scattering due to natural particulates in the air. In the visible spectrum there will be Rayleigh scattering ranging from about ~5% in the red to ~25% in the blue (more in the UV where there is no molecular absorption).
Now you say – or you admit – that the CO2 and H2O and the O3 and O2 “absorbed” the yellow portion of the graph.
That’s what the authors of the graph explicitly marked on it.
Now, this is where the confusion with “absorption” comes in. In my old language, we rather used the word extinction instead of absorption. According to you, or your theory, or your books, what exactly is happening to the missing [yellow] radiation?
In the marked absorption bands the light is absorbed and the ground state molecule is promoted to an excited vibrational/rotational state. What happens then depends on the molecule and its environment, in the lower troposphere, because of the high density, the predominant result will be collisional deactivation back to the ground state and thermalization of the of the atmosphere. At lower densities in the upper atmosphere emission from the excited state becomes more likely.
In the UV the excited state will be an electronic one, in the case of O3 and H2O2 the upper states aren’t stable and the O-O bond is broken in about 1 psec, and therefore there is no emission.
This is all basic physical chemistry Henry, I thought you had a Chem degree?
The textbooks we used when I did my undergraduate degree used the term ‘absorption’ and that was published in 1964!
Phil. says
Seems reasonable, there will still be some Mie scattering due to natural particulates in the air. In the visible spectrum there will be Rayleigh scattering ranging from about ~5% in the red to ~25% in the blue (more in the UV where there is no molecular absorption).
At lower densities in the upper atmosphere emission from the excited state becomes more likely.
Henry says
never mind my qualifications,
I find it just amazing that when we measure the earthshine via the [dark] moon we find all the sun’s radiation specific to the O3 and CO2 and H2O and O2 absorptive regions coming back to us, where you say only
” emission becomes more likely”> that it like saying “it seems possible” but other factors weigh heavier.
I am saying that re-emission [=re-radiation = back radiation, = reflectance ] is exactly what is happening and not very much else… There is no mass to do much of any heat transfer. All these gasses together that account for about 30% of incoming radiation becoming extinct, only make for ca. 0.5% of the total atmosphere’s mass.
The best way to experience re-radiation for yourself is to stand in a moist dark forest just before dawn on a cloudless night. Note that water vapour also absorbs in the visible region of the spectrum. So as the first light of sun hits on the water vapour around you can see the light coming from every direction. Left, right, bottom up, top down. You can see this for yourself until of course the sun’s light becomes too bright in the darkness for you to observe the re-radiated light from the water vapour.
A second way to experience how re-radiation works is to measure the humidity in the air and the temperature on a certain exposed plate, again on a cloudless day, at a certain time of day for a certain amount of time. Note that as the humidity goes up, and all else is being kept equal, the temperature effected by the sun on the plate is lower. This is because, like carbon dioxide, water vapour has absorption in the infra red part of the spectrum. A third way to experience re-radiation for yourself is to put your bright [car] lights on when driving in in misty conditions: the light will come back to hit you straight in your face.
We can conclude from these simple experiments that what happens is this: in the wavelengths areas where absorption takes place, the molecule starts acting like a little mirror, the strength of which depends on the amount of absorption taking place inside the molecule. Because we can assume that the molecule is like a perfect sphere, 62,5% of a certain amount of light (radiation) is send back in the direction where it came from. This is the warming or cooling effect of a so-called GH or anti- GH gas, respectively, hit by radiation in the absorptive region.
Hope that helps.
henryp July 28, 2016 at 7:05 am
Phil. says
“Seems reasonable, there will still be some Mie scattering due to natural particulates in the air. In the visible spectrum there will be Rayleigh scattering ranging from about ~5% in the red to ~25% in the blue (more in the UV where there is no molecular absorption).
At lower densities in the upper atmosphere emission from the excited state becomes more likely.”
Henry says
never mind my qualifications,
Well you brought them up, you claim to be a chemist yet seem to be missing some basic undergraduate knowledge. You also claim to be confused by the terminology ‘absorption’ vs ‘extinction’, yet the former has been in regular use since the 60s at least!
I find it just amazing that when we measure the earthshine via the [dark] moon we find all the sun’s radiation specific to the O3 and CO2 and H2O and O2 absorptive regions coming back to us, where you say only
” emission becomes more likely”> that it like saying “it seems possible” but other factors weigh heavier.
What you see is relatively low reflected light in the regions of the spectrum where absorption takes place, as expected. Whether the excited molecule is collisionally deactivated or radiates depends on it’s environment, where the atmosphere is dense there will be many collisions so deactivation is much more likely (there may still be very low level of radiation). In the much less dense atmosphere higher up, collisions are less frequent and the probability of emission increases.
I am saying that re-emission [=re-radiation = back radiation, = reflectance ] is exactly what is happening and not very much else…
That’s where you’re wrong as far as the lower atmosphere is concerned as explained above.
There is no mass to do much of any heat transfer. All these gasses together that account for about 30% of incoming radiation becoming extinct, only make for ca. 0.5% of the total atmosphere’s mass.
Collisional deactivation means that the energy absorbed by, say, a CO2 molecule is transferred to all its neighbors.
The best way to experience re-radiation for yourself is to stand in a moist dark forest just before dawn on a cloudless night. Note that water vapour also absorbs in the visible region of the spectrum.
Extremely weakly
So as the first light of sun hits on the water vapour around you can see the light coming from every direction. Left, right, bottom up, top down. You can see this for yourself until of course the sun’s light becomes too bright in the darkness for you to observe the re-radiated light from the water vapor.
That’s elastically scattered light (Mie), that’s why it’s diffuse.
A second way to experience how re-radiation works is to measure the humidity in the air and the temperature on a certain exposed plate, again on a cloudless day, at a certain time of day for a certain amount of time. Note that as the humidity goes up, and all else is being kept equal, the temperature effected by the sun on the plate is lower. This is because, like carbon dioxide, water vapour has absorption in the infra red part of the spectrum.
But that has nothing to do with re-radiation, it’s just absorption.
A third way to experience re-radiation for yourself is to put your bright [car] lights on when driving in in misty conditions: the light will come back to hit you straight in your face.
Again that’s elastic scattering.
We can conclude from these simple experiments that what happens is this: in the wavelengths areas where absorption takes place, the molecule starts acting like a little mirror, the strength of which depends on the amount of absorption taking place inside the molecule. Because we can assume that the molecule is like a perfect sphere, 62,5% of a certain amount of light (radiation) is send back in the direction where it came from. This is the warming or cooling effect of a so-called GH or anti- GH gas, respectively, hit by radiation in the absorptive region.
Doesn’t happen like that Henry.
CO2 is no evil says:
https://wattsupwiththat.com/2016/07/22/is-the-reuters-news-agency-committing-fraud/#comment-2266177
Henry says:
interesting comment.
My theory is that the ozone hole never existed. IMHO: had they measured for peroxides they would probably discover that “the hole” is filled with relatively more peroxides, as one would expect to find more OH radicals above the [much warmer] SH oceans. It seems very likely to me that peroxides are formed preferentially to ozone by the sun’s most energetic particles if OH is present.
Therein lies the key to finding Trenberth’s missing energy…..[but that is just my opinion].
{the anti GH effect of gases with absorption below 300nm is much greater than the GH effect from CO2 etc. for obvious reasons, i.e. much lower wavelengths involved = more energy at stake}
Anyway, for further clarity, I would like to ask you the same question as I asked Phil.
https://wattsupwiththat.com/2016/07/22/is-the-reuters-news-agency-committing-fraud/#comment-2266504
CO2 is no evil says:
https://wattsupwiththat.com/2016/07/22/is-the-reuters-news-agency-committing-fraud/#comment-2266177
Henry says:
interesting comment.
My theory is that the ozone hole never existed. IMHO: had they measured for peroxides they would probably discover that “the hole” is filled with relatively more peroxides, as one would expect to find more OH radicals above the [much warmer] SH oceans. It seems very likely to me that peroxides are formed preferentially to ozone by the sun’s most energetic particles if OH is present.
Therein lies the key to finding Trenberth’s missing energy…..[but that is just my opinion].
[the anti GH effect of gases with absorption below 300nm is much greater than the GH effect from CO2 etc. for obvious reasons, i.e. much lower wavelengths involved = more energy at stake]
Anyway, for further clarity, I would like to ask you the same question as I asked Phil.
https://wattsupwiththat.com/2016/07/22/is-the-reuters-news-agency-committing-fraud/#comment-2266504
phil. says
on the absorption of water:
extremely weak
henry says
that “weak” absorption of water is in fact extremely important. It also absorbs a bit in the UV and IR. It simply means that all radiation of the absorptive region entering the oceans will eventually somehow be converted to heat. Because, now here, you have the mass to get thermalization….
That means
water + radiation=> heated water => water vapor => clouds => rain and the rest is history, i.e. life as we know it.
For the record, you brought up my qualifications, not I.
Maybe HenryP should have a look a the real ability of H2O to absorb/reemit in the IR range (4-40µ), when compared with that of CO2.
Here is an output of Spectralcalc’s Line Browser, please compare:
http://fs5.directupload.net/images/160730/o8bawjq6.png
with
http://fs5.directupload.net/images/160730/wjolmflq.png
and you quickly will understand one of the reasons why water vapor’s role, though very important, is not the primary one.
This “slight” difference also builds the basics of the ability of hardware and software used to differenciate molecular sources of downwelling IR.
HenryP July 28, 2016 at 1:14 pm
phil. says
“on the absorption of water:
extremely weak”
henry says
that “weak” absorption of water is in fact extremely important. It also absorbs a bit in the UV and IR. It simply means that all radiation of the absorptive region entering the oceans will eventually somehow be converted to heat.
You referred to the absorption of visible light by ‘water vapor’ which was what I was replying to, not liquid water.
For the record, you brought up my qualifications, not I.
Here’s a quote from you where you claimed to be a chemist, so you brought it up.
HenryP July 24, 2016 at 5:25 am
perhaps, as a chemist, I need to inform some of you of a few basic truths.
henryp July 28, 2016 at 3:08 am
CO2 is no evil says:
https://wattsupwiththat.com/2016/07/22/is-the-reuters-news-agency-committing-fraud/#comment-2266177
Henry says:
interesting comment.
My theory is that the ozone hole never existed. IMHO: had they measured for peroxides they would probably discover that “the hole” is filled with relatively more peroxides, as one would expect to find more OH radicals above the [much warmer] SH oceans. It seems very likely to me that peroxides are formed preferentially to ozone by the sun’s most energetic particles if OH is present.
The ozone ‘Hole’ forms between 14km and 20km altitude above the antarctic continent, not the southern oceans, also when formed it is isolated from the surrounding atmosphere by the polar vortex (polar night jet). So why do you think the SH oceans are relevant? Measured stratospheric Hydrogen peroxide levels are pptv and it has a lifetime of a couple of days, in the winter over the pole it would decay away rapidly.
Reblogged this on Climatism and commented:
A MUST read slice-and-dice of Reuters climate propaganda and blatant misinformation by the brilliant Lord Monckton…
Take-outs:
Can we perhaps get just one Reuters “journalist” away from the various global institutional profiteers of doom [WMO, NASA, IPCC et al] in whose lavishly-marbled, planet-destroyingly air-conditioned halls they spend their useless days for long enough to check the data from the real world outside?”
—–
Reuters quotes a “climate expert” at the International Institute for Applied Taxpayers’ Money Gobbling in Vienna:
“Research shows that for the general public extremes make climate change more tangible, more understandable. It could help to motivate people to engage in climate action, and do something.”
Translation: “The data don’t support our climate profiteering. The facts don’t support it. The graphs don’t support it. Even the weather doesn’t support it. There has not been enough bad weather to let us get away with using it as an excuse for gobbling still more taxpayers’ money. Something must be done, and soon, or we shall have to work for a living.”
Read on…