Bipolar disorder continues, Arctic reaches lowest maximum extent while the Antarctic sets new records

Time to take a quick look at the sea ice situation down under, as I must have missed it on BBC News. According to NSIDC, a new record high has been set for April, beating last year. Ice is above average virtually all around the continent. Meanwhile, according to Bob Tisdale, Southern Ocean surface temperatures continue to plunge. It really does not take a genius to add two and two together. –Paul Homewood, Not A Lot Of People Know That, 3 May 2015
From the WUWT Sea Ice Page: http://wattsupwiththat.com/reference-pages/sea-ice-page/

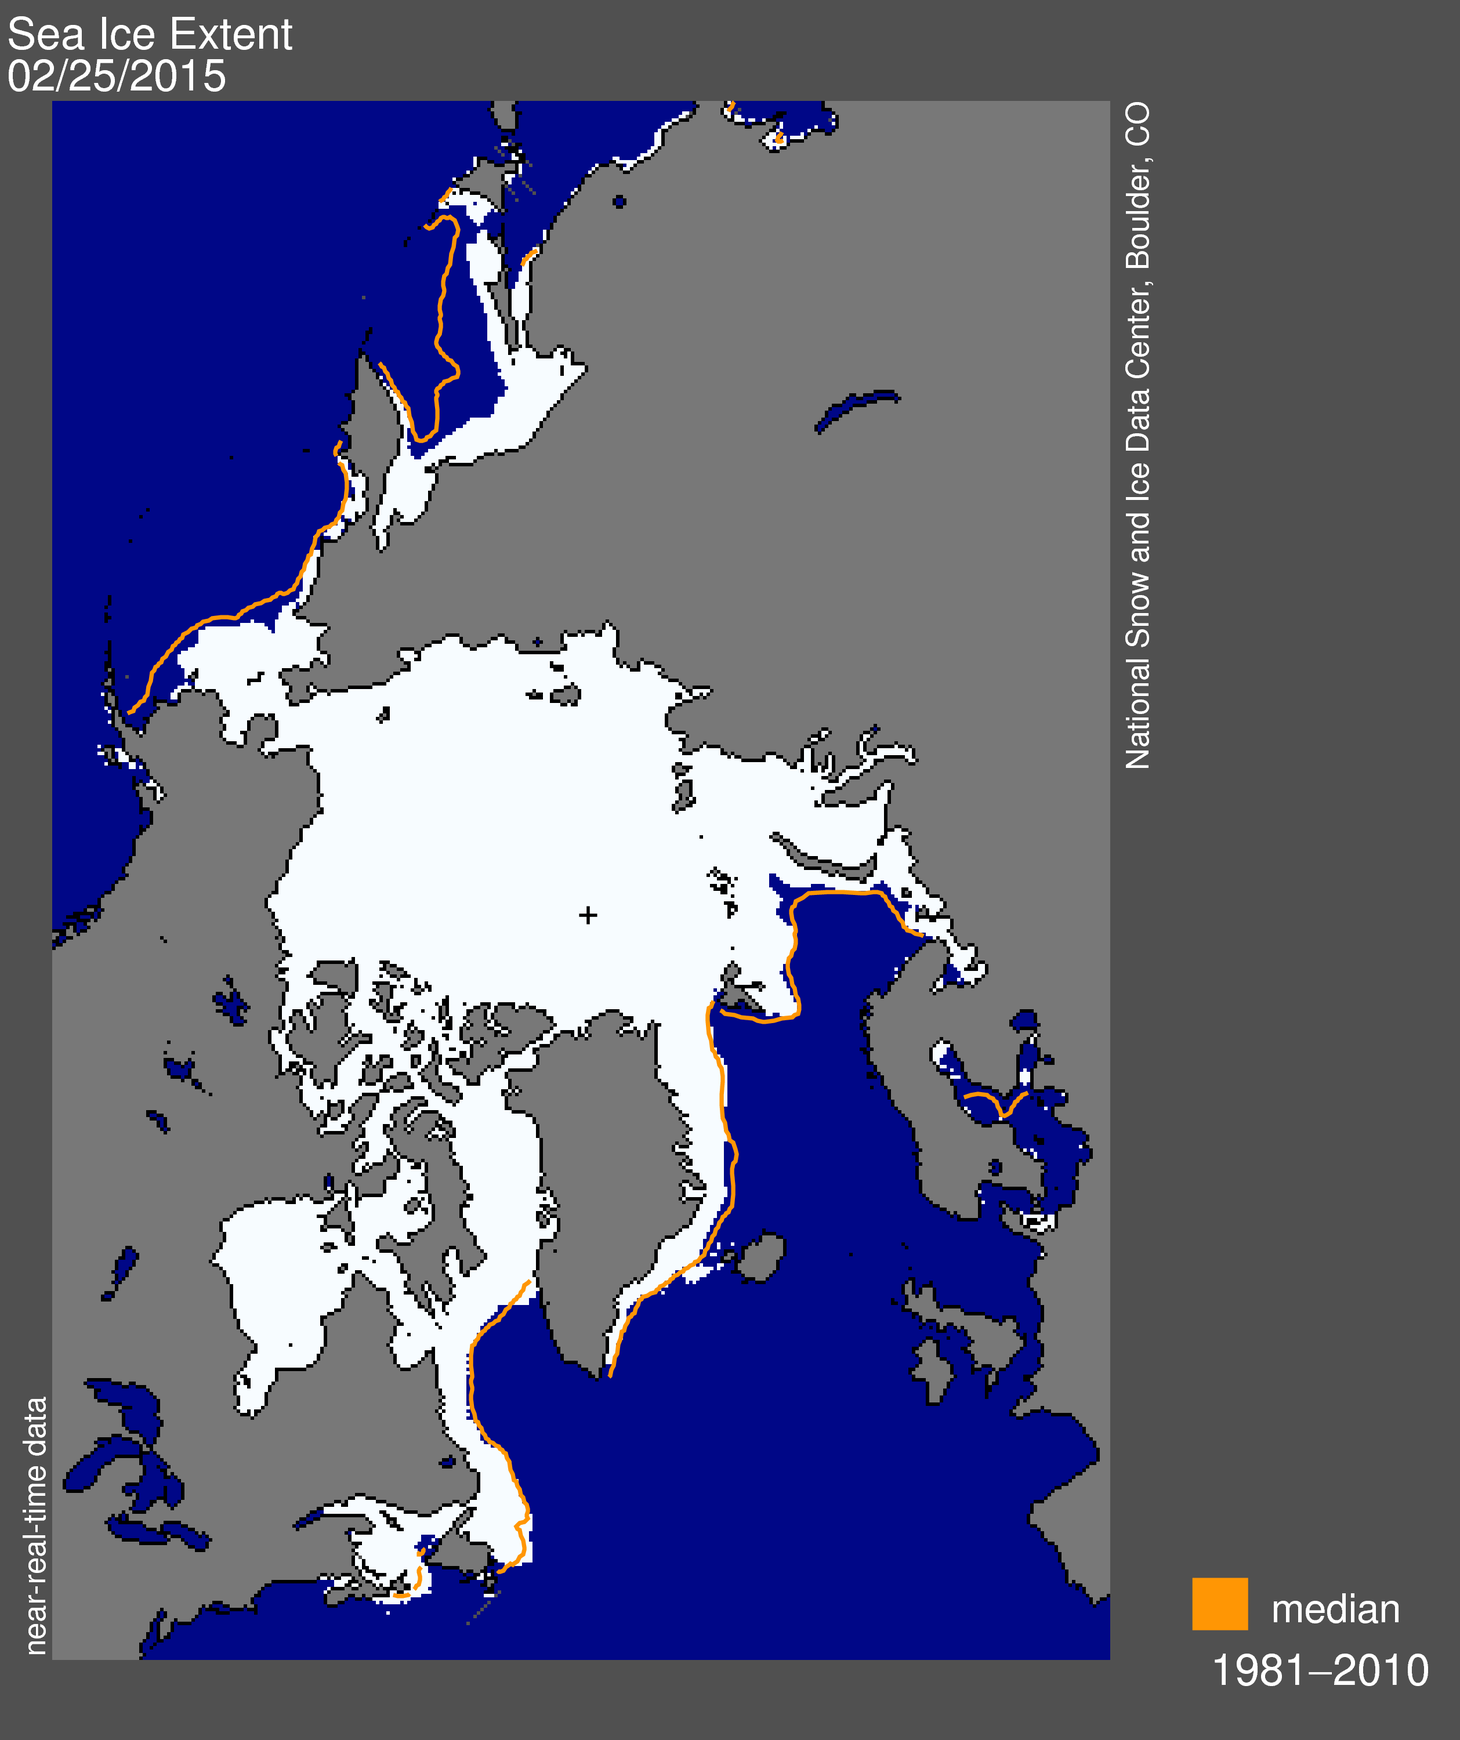
Arctic sea ice maximum reaches lowest extent on record

The National Snow and Ice Data Center (NSIDC) is part of the Cooperative Institute for Research in Environmental Sciences at the University of Colorado Boulder. NSIDC scientists provide Arctic Sea Ice News & Analysis content, with partial support from NASA.
NSIDC has issued an update to Arctic Sea Ice News & Analysis describing winter sea ice conditions in the Arctic Ocean.
Arctic sea ice appears to have reached its maximum extent for the year on February 25 at 14.54 million square kilometers (5.61 million square miles). This year’s maximum ice extent is the lowest in the satellite record.
NSIDC will release a full analysis of the winter season in early April, once monthly data are available for March.
To read the current analysis from NSIDC scientists, see http://nsidc.org/arcticseaicenews.

Actually, according to MASIE, NH ice extent is virtually the same as last year.
https://rclutz.wordpress.com/2015/05/02/arctic-ice-watch-2015/
Has been for quite a while since that “record low” was announced.
http://polarbearscience.com/2015/04/16/spring-ice-alarm-deflated-2015-ice-now-as-high-as-2014-davis-strait-highest-since-1971/
Polar bear activists still using it as a sign of reduced polar bear habitat, not taking into account the fact (as noted by others below) that much reduced ice in the Sea of Okhotsk (where no polar bears live) accounted for virtually all of the difference. In fact, that has always been the case for the Spring minimum:
http://polarbearscience.com/2015/04/12/challenging-polar-bear-fearmongering-about-arctic-sea-ice-extent-for-march-2015/
Those polar bear activists are going be very disturbed if polar bears start migrating to the Antarctic Ocean via the American land bridge. There are some very dense food sources along the way.
Isn’t the Sea of Okhotsk in the North Pacific Ocean? Why is it included in the extent of Arctic Ocean sea ice?
Jan Christoffersen
“Arctic” sea ice also goes down to the Gulf of the St Lawrence River, Hudson Bay, Baltic Ocean, Bering Sea … Better to think of it as “northern hemisphere sea ice” – But even using that illogical “name” excludes the larger areas of the Great Lakes “freshwater” sea ice that are at the same latitude. Which the “Sea Ice powers-that-be” specifically and vehemently deny is “sea ice”
RACooke,
Thanks. I didn’t know those factoids.
Like the “as I must have missed it on BBC News” comment. Talk about bias…
sarcasm? That’s how I took it.
Agreed – my comment of bias was directed at the BBC, not WUWT
Antarctica also recorded record warmth in March. See text at bottom of link:
http://nsidc.org/arcticseaicenews/
“Antarctica also recorded record warmth in March.”
More of a tie than a new record. Last time those two stations were this warm was in 1961, during the extended cool period that caused many scientists to proclaim impending doom due to man-caused global cooling. Interesting.
http://nsstc.uah.edu/climate/2015/march2015/march2015_mapjpg
Look at the data no record warmth in Antarctica ,if anything below normal overall.
But Salvatore, you’re looking at the big picture. We’re supposed to be focused on the two tiny spots where it is a little warmer than “normal”.
Yes, I noticed that last month. Then in reading what they are saying one finds that they are talking about conditions at the Argentina base and at the very tippy top of the WAIS…”” On March 23, at Argentina’s base Marambio, a temperature of 17.4° Celsius (63.3° Fahrenheit) was reached, surpassing a previous record set in 1961 at a nearby base, Esperanza. The old record was 17.1° Celsius (62.8° Fahrenheit). However, Esperanza quickly reclaimed the record a few hours later on March 24, reaching a temperature of 17.5° Celsius (63.5° Fahrenheit).””
Does that indicate to you that the entire continent has warmed?
What I think is that this item, which turns out to be an all time record for any location in Antarctica, is certainly as newsworthy as the setting of a monthly record in sea ice. It was reported by numerous news outlets. Why not here?
And no, I’m not claiming this record is due to climate change.
This “recent” Antarctic sea ice increase has been going on since 1992.
Since 2006, at ever-increasing rates, with record-breaking sea ice extents and sea ice anomalies.
Since 2006-2007, the Arctic sea ice has been oscillating strongly, but not decreasing.
Further, when the entire continent is surrounded by record-breaking sea ice for an entire month, the increased reflectivity of the sea ice – compared to the dark ocean it covers, DOES make a difference in the earth’s heat budget.
In contrast, for 8 months of the year, loss of Arctic sea ice from “normal” increases heat loss from the Arctic Ocean.
When the “excess” sea ice around Antarctica is larger than the entire Greenland ice cap, when the Antarctic sea ice remains above 2 std deviations above normal for the most part of 2-1/2 years now … One small part of one peninsula that is itself only 3% of the continent’s entire area can be ignored as trivial.
It indicates to me that Esperanza is hotter than Northern England and the Argies are trying for the tourist trade.
If we were talking about ice at a single spot, you might have a point. However we are talking about all the ice for the entire continent and many miles surrounding the continent.
As such, a more valid comparison would be to the temperature of the entire continent of Antarctica. Which isn’t increasing.
@RACookPE1978
And the surface temperature in Antarctica has shown a mean positive trend from 1960 of 1.05°C/century, and from 1990 of 2.31°C/century.
http://berkeleyearth.lbl.gov/regions/antarctica
So this record has taken place within a context of generally increasing temperatures and increasing rates of increasing temperatures.
So again, I ask, why wasn’t this record warmth reported here?
Not true – The temperatures there are biased to the few labs down there manned full-time – and only one in the center of the whole continent. Thus, you are assuming that FL, CA, and Seattle create an average temperature and rainfall profile valid for Kansas. With one weather station in each state.
ftp://ftp.ssmi.com/msu/graphics/tlt/plots/rss_ts_channel_tlt_southern%20polar_land_and_sea_v03_3.png
When the whole continent is actually sampled by satellite, the temperatures are declining, and the ice mass increasing. Except for four specific coastal glaciers.
cgs, Antarctica hasn’t seen any warming in 36 years according to satellite data.
The warmth at that spot is caused by the Foen effect. Wind dragging wet cold air over high ground, losing its moisture and warming as it descends on he leeward said. Eastern Scotland and eastern England are great examples. Many years ago a Foen wind twisted and toppled a power station cooling tower near Leeds
“And the surface temperature in Antarctica has shown a mean positive trend from 1960 of 1.05°C/century, and from 1990 of 2.31°C/century.
http://berkeleyearth.lbl.gov/regions/antarctica
So this record has taken place within a context of generally increasing temperatures and increasing rates of increasing temperatures.”
This isn’t news because the “record temperature” is barely a tie with the previous record from 1961; It occurs at only a tiny spot; the “context of generally increasing temperatures” is only a recent bump from -35.25C to -35C, and appears to be cooling; and as the authors admit, the record was caused by anomalous conditions which cannot be tied to any climate change hypothesis. So, the actual question is why should this have been highlighted on the worlds foremost climate change blog?
Here is the heading that they used for this tripe…””Record warmth in Antarctica”””. Note that it doesn’t state “record at the tip of the WAIS”, or “record at one spot”. The average person reading that would likely assume that this was reflective of the entire continent, as that is what “Record warmth in Antarctica” suggests at face value. When you consider how cold the main continental mass is, then even if there were a 1 C rise it would still be a meaningless quantity.
cgs, 3 recording stations for an entire continent? Are we supposed to be impressed?
But the cause of the “record” was a foehn storm. All that tell us is the winds were flowing over the peninsula instead of around. The warming on the east side of the peninsula can be attributed to adiabatic heating of the air as it descends.
TAS NSIDC wrote, “The cause of these warm conditions is familiar to people living in mountainous regions: a foehn”
So.
The entire continent is surrounded by ever-increasing sea ice for 4 straight years, and the NAS declares it is due to a “foehn” over one part of one peninsula for one week?
Next: High winds over Los Angeles cause sea ice to pile up onto Massachusetts shoreline!
Jim was referencing cgs’s claim that one location in Antarctica set a warm record.
sorry jim I replied before I read your piece
AKA “chinook” winds.
Esperanza is at the very end of the Antarctic peninsula and a good deal north of the southern polar circle. So it is not at all a good place to represent the climatic conditions of the main part of Antarctica…
The alleged cherry picking happens much more on the side of climate alarmism and the MSM. There you hear practically never any news about the steadily growing Antarctic sea ice records of recent years, or the stable or even growing glaciers of much bigger East Antarctica, but constantly alarm stories about high temperatures and melting glaciers in West Antarctica and the Antarctic peninsula…
So, who is more biased ? The alarmist side or wuwt ?
The Antarctic is not a territory of Australia last time I’ve checked. Also not of NZ.
http://www.antarctica.gov.au/about-antarctica/people-in-antarctica/who-owns-antarctica
No comment.
Current Sea Ice extent
Total sea ice extent on the northern hemisphere since 2005. The ice extent values are calculated from the ice type data from the Ocean and Sea Ice, Satellite Application Facility (OSISAF), where areas with ice concentration higher than 30% are classified as ice.
The total area of sea ice is the sum of First Year Ice (FYI), Multi Year Ice (MYI) and the area of ambiguous ice types, from the OSISAF ice type product. However, the total estimated ice area is underestimated due to unclassified coastal regions where mixed land/sea pixels confuse the applied ice type algorithm. The shown sea ice extent values are therefore recommended be used qualitatively in relation to ice extent values from other years shown in the figure. In late 2012 sea ice climatology and anomaly data will be available here.
http://ocean.dmi.dk/arctic/plots/icecover/icecover_current.png
Fig 4.Average Arctic sea ice thickness over the ice-covered regions from PIOMAS for a selection of years. The average thickness is calculated for the PIOMAS domain by only including locations where ice is thicker than .15 m.
http://psc.apl.uw.edu/wordpress/wp-content/uploads/schweiger/ice_volume/Bpiomas_plot_daily_heff.2sst.png
Now the ice in the Arctic is almost normal. What is important is of September ..
Table 1. Previous minimum Arctic sea ice extents
YEAR MINIMUM ICE EXTENT DATE
IN MILLIONS OF SQUARE KILOMETERS IN MILLIONS OF SQUARE MILES
2007 4.17 1.61 September 18
2008 4.59 1.77 September 20
2009 5.13 1.98 September 13
2010 4.63 1.79 September 21
2011 4.33 1.67 September 11
2012 3.41 1.32 September 16
2013 5.10 1.97 September 13
2014 5.02 1.94 September 17
1979 to 2000 average 6.70 2.59 September 13
1981 to 2010 average 6.22 2.40 September 15
Thanks, ren. Good information, sourced.
Thanks for the information and the charts. I was wondering what the thickness was doing.
Antarctic sea ice is grounded, at least along an edge. Arctic sea ice is free floating. Wind blows it around and piles it up. It’s hard to tell from sea ice extent data how much ice is really there. Are we really looking at “How windy was it?”
AFAIK, [grounded] ice is categorized as “ice sheets,” not sea ice.
Pochas is saying that Antarctic sea ice doesn’t move around as much as Arctic sea ice, because one edge of Antarctic sea ice is bound to the shore. The ice referred to is indeed sea ice, not grounded or land ice.
rogerknights
I asked the NSIDC specifically about this several years ago: They exclude ALL shelf ice (north and south hemispheres) from their sea ice reports and calculations. This affects the sea ice area around Antarctica more than the Arctic – because there is little shelf ice up there, but there is some around a few of the Canadian islands. Little shelf ice at around Greenland though. Antarctica has 1.5 Mkm^2 of shelf ice. 3.0 to 20.0 Mkm^2 of variable sea ice around the 14.0 Mkm^2 continent and 1.5 Mkm^2 shelf ice.
“Fast” ice oddly enough, is NOT moving. It is “fast” to the shore (using ship terminology) and may be what the writer meant by grounded ice. Usually, that term is “mixed” into the tongue of a glacier pushed out onto a very shallow underwater area. The grounding line, for example, is the line where the glacier ice no longer touches the bottom of the water.
To what extent does the seaward movement of the Antarctic ice sheet determine the extent of the sea ice surrounding it?
Looks like the 3rd lowest extent after 2007 first lowest and 2011 second lowest.
http://arctic.atmos.uiuc.edu/cryosphere/IMAGES/seaice.anomaly.arctic.png
And a nice 10 year sideways trend since 2005/06 clearly stands out. Several more years and that trend line should be close to the 2000/01 position.
Unfortunately, This chart hasn’t been updated since April 11
They get their data from the International Arctic Research Centre (IARC) collaboration with the Japanese JAXA satellite program. Their data and imaging web site has been off-line for about three weeks, so it looks like the problems that they are having are as a result of a lack of data from the Japanese. Hopefully this is just a temporary glitch.
RE: JAXA
Is it back?
I used to have a link to that chart, and I was bummed when it disappeared. I think the message was starting to get wrong when ice stopped shrinking, and the newest line on the standard “last ten years” view looked normal or up trending.
we’ll just ignore the increase in MYI…. 😉
http://www7320.nrlssc.navy.mil/hycomARC/navo/arcticictnowcast.gif
A few more Ice thickness maps. First from Cryosat2 – average of the last month.
http://www.cpom.ucl.ac.uk/csopr/sidata/thk_28.png
And then ice age from Mark Tschudi of the University of Colorado. Significantly more multi-year, more-resistant-to-melting ice in the western Arctic now after the Beaufort Gyre restarted up two years ago.
ftp://ccar.colorado.edu/pub/tschudi/iceage/gifs/age2015_13.gif
Thanks Bill !!
“Obduction” of sea ice can help bolster thickness. Pressure ridges and other pile ups may fuse into areas of substantial thickness. Snowfall atop the ice can also similarly bolster thickness. What a complicated picture in the windy, mobile Arctic.
In fact Arctic ice volume is 14% greater than 2013 http://www.bbc.com/news/science-environment-32348291 and Antarctic ice volume shows no decrease at all since 1992 but a slight increase http://epic.awi.de/35571/1/holland-etal_reresubmitted.pdf.
And we all know how we’re repeatedly being told it’s volume and not extent that’s important.
I should add that West Antarctica IS losing ice and that’s what the warmists alway report but that’s almost certainly due to the geothermal element there. Lies, lies and yet more lies.
The lady is not where you think she is.
Possibly the most shocking example of the tendency to attempt to focus all interest exclusively on the warming trend in West Antartica, can be found here in the U.K. A level curriculum.
Notice that nowhere on this page is the simple explanation that W. Antartica is the exception on a vast continent and that the warming trend found there is atypical.
And also note the manipulative starting sentence “Antarctica has experienced air temperature increases of 3°C in the Antarctic Peninsula”.
It is hard not to conclude that this is a willful attempt to deceive the reader.
And this is what now passes for “education”.
http://www.discoveringantarctica.org.uk/alevel_5_1.html
The loss of ice is an estimate from GRACE satellite data and has enormous error bands which means there may not be any ice loss at all.
Given the cold oceans and increasing sea ice extent it is highly likely that the claimed ice loss is not real and in fact the ice thickness should be growing
indefatigablefrog:
Thanks for pointing out that biased rubbish from the A-Level site. I noticed the following:
This statement implies that the whole of the Antarctic has reduced sea ice cover! Ridiculous!
I’m a secondary school teacher(high school for our American members) and this kind of propaganda disgusts me. I’m going to try and contact them and ask for their justification for this nonsense
David Smith,
The answer you won’t get is that BAS and the RGO are fully signed up to thermageddon and dependent on government money; the only way to keep that cash flowing is to spout the expected nonsense.
When you dissolve the ice in Hudson Bay?
http://oi61.tinypic.com/2l8awy.jpg
Has anyone attempted a “global sea ice” anomaly chart?
Yes, the University of Illinois Cryosphere (used to) keep just such a daily plot. It was last updated 11 April, along with all of their other products.
No word from the Cryosphere on why they stopped updating their products, nor when the updates will resume. They have not returned phone calls nor emails to the displayed links.
But it doesn’t matter.
The Antarctic sea ice area (or sea ice extents) CANNOT be directly compared to the Arctic sea ice area (or sea ice extents) for several reasons:
Most important, because the two receive different amounts of sunshine at different elevation angles every day of the year. This changes the amount of solar energy transmitted and absorbed in the atmosphere before striking the sea ice, and changes drastically the albedo of the supposedly “darker” ocean water under the sea ice.
The two also have different sea ice albedoes at different months of the year: The Arctic sea ice is particularly “dark” due to the summer melt ponds on top of the sea ice from 1 May through 15 August, with its “clean” winter sea ice albedo of 0.83 dropping to as low as 0.42 in July, then going back up to 0.83. The Antarctic sea ice albedo also decreases in the Antarctic summer, but not as much (going down to 0.75 in December and January) before going going back up to 0.85 in the rest of the year. The Antarctic sea ice receives almost no pollen, dust, dirt, or pollution either – all of which darken the Arctic sea ice and Greenland’s ice cap each summer.
Finally, adding to that effect, because they are at different latitudes receiving different top-of-atmosphere radiation levels at minimum and maximum each season, and because the minimum for spring Antarctic sea ice does not occur at the same time as the maximum for Arctic sea ice, although the values for minimum and maximums of each sea ice area are not even “almost the same”, the “total sea ice” is a meaningless and distracting averaged approximation EVERY day of the year.
It seems that taking monthly anomalies handles the seasonal variability just fine:
http://1.bp.blogspot.com/-C5sq5gdmAFc/VUj-DtdTNiI/AAAAAAAAAdw/rKu5tStIdpA/s640/NSIDC%2BSea%2BIce%2BAnomaly%2B01.png
NSDIC sea ice extent data via KNMI Climate Explorer.
Brandon Gates
Not true. Sea ice anomaly analysis of each pole independently, each hour of the day, every day of the year?
Do that for 2014-2015 year and you find that the the excessive sea ice around Antarctica reflected 1.68 times as much solar energy as the missing Arctic sea ice north of Canada absorbed.
Trenberth’s “missing heat” is back in space. It never interacted with CO2 because it never was absorbed in the first place.
I disagree with your statement that:
“The Antarctic sea ice area (or sea ice extents) CANNOT be directly compared to the Arctic sea ice area (or sea ice extents) for several reasons”
The two are connected by the Stratosphere.
I am JUST a commercial landscape gardener. As such the weather in the UK is important for my work. I need to know the weather well in advance. Like a stream of low pressures bring in rain or a sitting high being a dryish spell. This seems to be dominated by the Jetstream see. http://www.netweather.tv/index.cgi?action=jetstream;sess= The Jetstream is dominated by the vortex being either strong (strong Jetstream) weak (weak Jetstream)see. http://www.netweather.tv/index.cgi?action=stratosphere;sess=. If you watch the vortex and its behaviour you will notice that some of the warm / cold air disappears / appears over the equator. This has been a getting weaker since I have been watching it. You can not see it pulling in or splitting off at the moment but the autumn will be a good time. At the moment there is just tails. I see it is like two plug holes one each end of a bath giving a figure eight effect.
On the question of ozone which I believe has a short half life and is made by sunlight. I would expect a low level in a strong winter vortex. Is this the cause because I have never nor heard of penguins using aerosols at the south pole???
Bj.
OK. Let us continue your analogy. Water flow through each of the two holes depends on the actual current depth of the water above the hole, right? (Not the water depth at the average of the middle of the tub!)
The “water” in the tub is sloshing back and forth – 1 inch deep at times, then 2 – 4 – 6 – 8- 10, then stays at 10 inches for a moment, then goes back down to 1 inch. The water at the other end is going up and down as well, but NOT at the exact opposite time. Further, one of the two holes is 1 inch diameter, one is 1.68 inches in diameter.
Now, can you tell how fast water is flowing out of the tub by measuring the diameter of the two holes?
Maybe I should start a service to report ice albedo using the ice surface. It’s a fairly brainless exercise for a computer. Too bad ncdc is not dong it.
Fernando Leanme
And, you’re right – NCDC are not doing it. You’ve got to look for Curry’s and Perowitz’s papers (for the Arctic) and Warren (2005) for the Antarctic.
Well, ice albedo is straightforward: You need day-of-year and latitude: What language? Excel, Fortran?
Open Ocean albedo requires solar elevation angle; wind speed, cloud cover and atmospheric clarity.
Solar elevation angle requires day-of-year, latitude, and time of day (declination angle, day angle, hour angle, latitude, elevation (sea level obviously, but the fundamental calc’s allow for other altitudes), air pressure – assuming you’re willing to use local apparent solar time.
Sunlight available onto a flat surface at the earth’s surface (sea level) requires knowing day-of-year => Top-of-atmosphere radiation levels, latitude, time-of-day (again), solar elevation angle (again) => air mass, air clarity.
RACookPE1978,
That doesn’t make much sense to me. Antarctic minimum sea ice extent has changed very little relative to maximum extent, exactly the opposite of the Arctic in almost every way imaginable. From the poles to 65 degrees latitude, the Arctic has lost about 0.5% albedo since 1980, whereas the Antarctic is dead flat. [1]
I’m pretty sure Kevin knows to take all available fluxes from all latitudes.
——————
[1] Albedo calculated as UWSR / DWSR using data from NCEP/NCAR Reanalysis Monthly Means: http://www.esrl.noaa.gov/psd/data/gridded/data.ncep.reanalysis.derived.otherflux.html
It’s interesting to note that dropping down another 10 degrees to 55 from each pole results in the Actic losing another 0.5% since 1980, for a 1% total, whilst the Antarctic still remains dead flat.
Brandon Gates
Why are you even thinking about comparing minium Antarctic sea ice to maximum Antarctic sea ice? That number is useless!
Further, Arctic sea ice minimum is “only” 3 – 4 Mkm^2. The Arctic sea ice simply cannot get get much smaller – there never was much to lose over the very, very short September minimum – when the Antarctic sea ice receives FIVE TIMES the solar energy that the Arctic does.
The Antarctic EXCESS is already half of that value. Why not compare the ever-increasing Antarctic minimums? Since 1979, they have almost doubled in size, and are now regularly higher than the 1979-1992 record points. The Antarctic sea ice maximums are also steadily getting larger, now routinely larger than values never approached before.
Dead wrong. In broad numbers, the Antarctic is now 25% to 35% HIGHER in high-albedo surface area for the entire year for the past 10 years. Further, that high-albedo Antarctic sea ice is ALL between latitudes 67 south and 58 south – far, far closer to the equator than the Arctic 5 – 7% loss. And the Arctic vastly SMALLER loss of area is all between latitudes 72 north and 80 north.
At those latitudes, through most of the year, and not only is there no sunlight at all 8 months of the year, the little that does get through is at such low solar elevation angles that the albedo of sea ice is almost the same as the albedo of open ocean water.
The “paper” is simply wrong. For 8 months of the year, lower Arctic sea ice levels mean additional heat loss from the Arctic Ocean..
Gates
No. The ONLY “analysis” Trenberth can make is a flat-earth average with a constant sunlight. He has never presented any graphic, any heat balance for anything else with spherical earths, elliptical orbits, rotating earths, changing arctic and antarctic sea ice extents, or real-world albedos for ocean and sea ice.
I basically agree completely, however it is pretty normal for the human brain to take an interest in patterns, and here we have a (very limited) pattern of contrast between North Pole and South Pole. I have looked at this and mulled what if anything it might mean. Here is my hypothesis. I have next to zero professional credential in this field so I only offer my ideas for consideration by people with greater knowledge and resources.
It seems to me that when considering the global climate system as a heat transfer engine it looks to me as though it actually must sub-divide into North and South hemispheres, as the equatorial winds provide some separation of Northern and Southern air masses. Given that land masses and ice cover areas differ between North and South, It seems to me that the “heat load” must differ between North and South. Which ever hemisphere has the higher heat load will therefore experience greater heat rise. Obviously, this cannot be sustained as the planet is a single mixed system. So, how does this uneven heating manifest and rebalance? The most obvious to me would be that one hemisphere “loads up” with heat until it hits a point at which it is able to dump that heat to the other hemisphere by increased atmospheric activity or ocean water circulation changes or other means. If this is the case, I believe it would explain the somewhat anomalous ice readings; ie. Southern hemisphere has recently, or is in the process of dumping heat to the North. This pattern of heat flow would be exacerbated by the loss of sea ice in the warming hemisphere ( North at present) and the increase in albedo from greater sea ice in the hemisphere which is dumping heat. This will continue until an equilibrium is reached which will no longer allow the heat transfer engine to operate. Sometime after that point, the Northern hemisphere will reach a point relative to the South whereby It can dump heat to the South, or perhaps that heat will merely “leak” back to the South over time.
RACook,
It looks like Cryosphere Today is up to date again. Day 123 anomalies of -0.637 and +1.729 Mkm².
RACookPE1978,
As I wrote in the previous post, comparing that figure to the Arctic is illustrative because it highlights how the two poles are opposites in almost every way imaginable. For the Antarctic, the 1979-2014 mean value is 15%. It’s, oh, call it 38% for the Arctic. Linear trendwise, the Antarctic went from 13% up to 17% over the same interval. The Arctic went from 47% down to 30%.
Nah, it’s got room to go. Lowest extent since 1979 was 22% of maximum in 2012. And then there is average annual extent as a percentage of maximum. The Arctic went from 75% in 1979 to 65% in 2012. For Antarctica, it’s from 60% to 65% over the same interval.
When talking about equilibrium systems, I find it most illustrative to think in terms of percentage of means, mins and maxes for 0th approximations.
Why not compare mass loss from landed ice in both hemispheres?
For sea ice, I get 117% vs 60%, Arctic vs Antarctic respectively. The calculation is range of the minimums divided by the minimum min.
When talking albedo feedback effect, the naive assumption would be that wintertime ice extent has the least effect. Radiative heat loss from the surface … different story.
The complication of latitude and relative area is why I calculated change in albedo for each pole from 65-90 degrees. Note also that I didn’t mask out land areas even though I could have done without much bother. I like comparing apples to apples.
You’re going through a lot of brain damage to do ad hoc calculations which a) aren’t really necessary and b) don’t mean very much in terms of total radiative budget.
What paper? I didn’t cite any paper. I used reanalysis data for which most of the heavy lifting has already been done and simply tallied up area-weighted mean anomalies.
Obviously less ice coverage means more heat loss, but getting a meaningful calculation is ridiculously not easy since that quantity is highly sensitive to SST variability due to winds and currents … and as we’re certainly learning from the Antarctic, ice extent is not necessarily a direct function of water temperature below it at depth.
Calculating albedo as the ratio of shortwave up/shortwave down at TOA is low-hanging fruit, extremely difficult to muck up. Very clearly the Arctic at or above 65 N is darkening quite rapidly relative to the same southern latitudes, which as I mentioned previously is pretty much dead flat. Conclusion: Antarctic sea ice extent increase is doing effectively zip in terms of bouncing solar energy out of the system.
lol. The energy budget cartoon IS what he’s most (in)famous for … well, after his “it’s a travesty” comment … but I rather think a guy who had Lorentz for a PhD adviser knows a bunch more than you’re obviously willing to give him credit for. That, and, you know, I actually read his papers instead of just looking at (and ignorantly mocking) the pretty pictures.
Well, there is virtually no “arctic sea ice” between latitude 65 and latitude 72 (Hudson Bay, 1/2 of the Bering Sea, a part of the Okhotsk Sea.) All of these melt every summer, re-freeze each winter. All of the “arctic sea ice” on land between 65 north and the pole melts as well -unless you’re going to throw in Greenland ice caps as well. Antarctic sea ice does not include Antarctic land ice, nor antarctic shelf ice.
Antarctic sea ice is 35% greater now than the 1980-2010 average.
Arctic sea ice is 5% below the 1980 – 2010 average.
“Apples to apples” means just that: The change in sea ice from day-to-day, between year-to-year values for the same day, occur at the edges of the sea ice. Not in the center, the “average” or on land. Compare the edge of the sea ice in each hemisphere to the edge of the sea ice in the other hemisphere on each day of the year. Your words are wrong.
Because that value is meaningless. It is as useful as comparing a man’s height to his shoe length as he gets older, then saying that he did not gain weight because his foot is the same proportional length at age 30 as it was at age 16. Useless and meaningless.
Compare the growth in minimum (Antarctic minimums have grown from 1.75 to 2.5 – a growth of 42%.)
Compare the growth in maximums (Antarctic maximums have grown from 15.0 to 16.0 (an increase of 6%) But Antarctic maximums are at latitude 58-59. Receiving far more radiation each day in September than the 3 million kilometers up around the pole at latitude 80.
Comparing the ratio of minimum to maximum?
Over the entire 2014-2015 year, the Antarctic sea ice reflected 168% more energy than the Arctic sea ice absorbed, compared to their respective “average” years.
Dead wrong. Show your equations. 8-1/2 months of the year, Antarctic sea ice is reflecting more radiation from the system than the Arctic Ocean is absorbing.
RACookPE1978,
It has meaning to me as a gauge of hemispheric sea ice trends. As a metric for estimating radiative budgets … yes, completely useless.
I’m talking long-term trends for the entire polar regions, you’re talking about weather for one year in ocean areas only. What’s wrong with this picture?
I told you already: upwelling solar / downwelling solar measured from TOA, which gives me an effective albedo. Since I’m using zonal means from gridded data, I area-weight using the cosine of latitude. I’m not masking for oceans, and because I’m using TOA I pick up any changes due to cloud coverage, aerosols, etc. That gives me a fairly complete picture of the solar portion of the radiation budget for both poles in percentage terms which are directly comparable. From 1948 through 2014, the albedo changes by linear trend are:
Arctic: -2.3%
Antarctic: +0.9%
World: +0.1%
Or I can give it to you as downwelling solar – upwelling solar:
Arctic: +4.5 W/m^2
Antarctic: -1.8 W/m^2
World: -0.2 W/m^2
http://arctic.atmos.uiuc.edu/cryosphere/iphone/images/iphone.anomaly.global.png
It’s on the WUWT sea ice page
Arctic Sea Ice within standard deviations, so it’ just natural variability (unless you wish to do some fear mongering).
Absolutely! And Antarctic Sea Ice is above 2sd so not natural variability (ie. some special cause is acting) — though 3sd would be the more usual cutoff. So really AGWists should be trying to explain why Antarctic ice is higher than normal rather than why Arctic ice is normal :).
You’ve not seen it on the BBC because they have an environmental correspondent reporting on the news happening in the Arctic. The BBC is too busy with the Arctic to bother about the Antarctic. Shukman is on another of his frequent Arctic trips to observe the warming for himself. http://www.bbc.co.uk/news/science-environment-32467674 “the Arctic is on course to switch at some point this century from having permanent ice-cover to existing in a state where the ice comes and goes with the seasons”
I know, Phillip, such is the BBC now. It’s just so sad for me to see what was once a truly great British institution sink to the abysmal state it’s in now. The lefties took over some time back, and now we have very poor journalism as well. The truth doesn’t matter to the BBC any more, it’s just focused on climate propaganda. Remember that they refused to report on climategate, as they said the emails were stolen. If the emails had been stolen from some oil company, and hinted that it had paid some sceptics, the BBC would have made it headline news. I find it really sad. A year ago I finally stopped reading any BBC news, as you just can’t trust them anymore.
So, the BBC are out helping chop up the Arctic ice to make it easier for the wind to blow it around and eventually carry it out of the Arctic.
Shukman should be investigating whether there is any correlation between number of icebreakers (tourist or ‘research’) active in the Arctic and the September minimum.
Also, the low NH maximum extent was due to open water in two seas far from the North Pole.
https://rclutz.wordpress.com/2015/04/18/okhotsk-barents-who-cares/
That low extent was caused by shifts in the wind patterns. I made a few comments at the time it was happening that this would drop the extent for awhile. The current down trend in sea ice in the Arctic is once again due to shifting winds pushing sea ice out into the North Atlantic. This has been ongoing for around 3 weeks as of now. Although there was a further change yesterday, and that should mean a reduction in the sea ice loss of the last week…http://earth.nullschool.net/#current/wind/isobaric/1000hPa/orthographic=1.03,64.98,497
http://earth.nullschool.net/#current/ocean/primary/waves/overlay=sea_surface_temp_anomaly/orthographic=1.03,64.98,497
Most of the very low “Arctic” sea ice total was due to – as you point out – the half-covered Sea of Okhotsk (south of Siberia-Kamchatka Peninsula) and the low amounts of Bering sea ice both sides of the Aleutian Islands.
Hudson Bay is “normal”, the Arctic is “normal” – although winds are towards the south towards Greenland and Iceland and will move ice that direction, and the other Canadian coastal regions are “normal”. Though NOT a part of the “sea ice” totals reported by any lab, the Great Lakes were at record high coverage this past winter, and still have a lot of ice down in those latitudes.
Both low-sea-ice-areas would be warmed significantly by the “blob” of warm water across the northern Pacific Ocean Bob Tisdale has been reporting on.
I will be especially interested in how open or closed is the Canadian Archipelago given its ability to block cold Arctic water from leaving the basin in favor of warmer Atlantic water. Of course it is completely frozen at this point. Last year it melted to less than 50% of full extent for a period of only 13 days.
https://rclutz.wordpress.com/2015/03/29/arctic-sea-ice-factors/
Ron two researchers are missing presumed drowned having apparently fallen through thin ice in the archipelago! So it is not “Of course it is completely frozen at this point”.
http://churchillpolarbears.org/2015/05/dutch-sea-ice-researchers-presumed-drowned/
[We regret their family’s loss. .mod]
Phil, that’s a sad way to discover the difference between ice extent and volume.
No real sea-ice expert would go skiing on thin ice this late in spring. Spring ice is extremely treacherous, even when quite thick it has very little strength. Also very odd that both seem to have drowned. Normal procedure on thin ice is to stay well spaced. Possibly one went through the ice and the other drowned trying to save him.
Impossible to tell.
I suspect as well, that they were “led” into assuming they actually “could make the trip” (and HAD TO make the trip) for the publicity value of the trip. Not the research. Two people? With dog teams only on today’s date, and with today’s large number of polar bears? We should no longer be taking such risks as Peary’s or Shackleton’s expeditions for publicity.
But, there is still talk of an extremist trying to sit on a iceberg off of Greenland all year for the publicity of it.
Is increasing Antarctic ice a health threat? /sarc
AGW is to blame for Arctic sea ice loss.
AGW is to blame for Antarctic sea ice gain
AGW is to blame for Manny Pacquiao’s failure to beat Floyd Mayweather.
Obviously, the fix was in on all three counts.
The missing part of the ice is in the west where the ‘BLOB” was. Has nothing to do with CO2.
Well, north of the “blob” at least.
Maybe it underwater volcanoes?
https://youtu.be/LSmQB2yJQg0
I sent an e-mail to the University of Iillinois asking why the ice extent data has been updated for almost a month and was advised it was a “server” problem and that updates should start again”soon’…
That was a BS answer because fixing or replacing a server softerware/hardware problem is a one or two day process; not three weeks…
My guess is that they are developing a new algorithm to calculate lower ice extents because the current ice extent data is very detrimental to the CAGW hypothesis; especially what’s happening to Antarctic Sea Ice Extents.
Granted, this is just speculation on my part, but why else would UI lie about what’s really going on with the almost 1-month cessation of daily updates?
I emailed them a week ago, and they never even replied.
I e-mailed them 3 times before I got a reply.
After I received UI’s reply, I told them it’s impossible for a “server problem” to take 3+ weeks to fix, and asked for the real reason, but and they haven’t responded….
[What email address did you use? .mod]
I also e-mailed a week ago with no response received as of this posting.
@SAMURAI
At tertiary institutions funds usually have to be approved and then allocated before new hardware/software can be purchased–often a timely process. Besides, they’re not sitting around for your beck and call.
Mike– That’s really depressing that in the public sector, bureaucratic red tape requires 1 MONTH to fix a 1~2 day problem…
UI probably has an annual budget of $1+ billion and it takes 1 month to install a $1,500 piece of hardware… Imagine the lost productivity involved without a working server in the department; penny wise and pound foolish comes to mind…
It boggles the mind..
I worked for what was then called the Illinois State Water Survey’s Climatology Division at the University of Illinois many years ago. I wouldn’t be surprised for a repair to take a month. They didn’t have dedicated hardware engineers or support beyond an IT staff doing backups. It’s hard to guess what the Cryosphere group’s funding situation is like, but there probably isn’t a maintenance account just sitting around. Once they know what they need, funding and purchasing still have to occur. After that there’s shipping and installation. Just getting a purchase order signed might take weeks. There are layers of bureaucracy involved that are nearly as thick as Antarctic ice.
Funding wouldn’t be such a big issue if their charts were just a bit more CAGW friendly.
The answer might be in this article from CNBC…http://www.cnbc.com/id/102650153
They mention how the Illinois Dept of Education is asking for 2 billion that is needed now or yesterday, yet the state is 130 billion in the red as it is. Might have something to do with why Cryosphere is offline, thanks to Obama and friends.
It’s a state university we are talking about here. A 2-3 day job will take 2-3 weeks just to fill out the paperwork, a week or so for an administrator to sign, then another week for anything to actually get done.
You are hopelessly cynical and probably right.
Oh, I hadn’t noticed Cryosphere had problems. I really need to do a better job of teaching my software to alert me when there are problems.
The last time something like this happened, I got the sense that Cryosphere consisted of two scientists and a few student interns. Since then, the last people to work on the software have graduated and the replacements are trying to learn how the system works.
Cryosphere has been remarkably problem-free for most of the time I’ve used it. It’s probably about time the disk drive filled up or died horribly.
Last time I got a reply from Bill Chapman. He noted then, almost exactly three years ago:
That outage went from 2012 April 28 to 2012 May 12, see http://igloo.atmos.uiuc.edu/cgi-bin/test/print.sh?fm=04&fd=28&fy=2012&sm=05&sd=12&sy=2012
They may be getting their act back together. I’ve gotten “fresh” images from them today, and Email from someone asking why they looked so bizarre. The Cryosphere site does not display the image I have, it’s still showing the April 13 images.
Check out http://home.comcast.net/~ewerme/wuwt/cryo_latest.jpg – it will change automatically tomorrow, or manually sooner if they have a better looking image.
I suspect they build up the image from multiple satellite passes and work to ignore cloud-covered parts.
Ric Werme
Cryosphere graphics are still stuck, but their download text files are now up-dated through 5 May.
This is the Antarctic data, updated with day-of-year number, percentage anomaly, and equivalent latitude of the edge of ice.
And the same for the Arctic
Curious that the text files look reasonable, the May 5th image doesn’t, and recent images don’t exist. That would suggest the text comes from a different source that Cryosphere and that Cryosphere creates the images themselves.
BTW, I have a note in my crontab file that says “1145: WUWT Cryosphere download. They seem to update at 1124.” That’s Eastern time (EST5EDT). The note is years old, they may have changed their schedule since then.
I may be mistaken, but it looks like the U of I updates are happening again.
I’m trying to understand two of the graphs. Antarctica and the SH has a positive anomaly of around 20 million kilometers and is growing rapidly, while the NH has a negative anomaly of less that 2 millionkilometers and is at most shrinking very slowly if at all, if I am to believe the graph at the very top vs the graph of the NH anomaly that appears later. The entire NH anomaly is the scale of the noise in the SH anomaly?
rgb
[No, not 20 million sq km, but +20% of today’s nominal. Total varies a bit by different labs, but about 9-10 million sq kilometers. Depends also on sea ice area or sea ice extent.
Arctic anomaly is about -0.6 million sq kilometers compared to an average of 12 million sq km’s on each day. .mod]
I you are referring to the first chart, it seems to be % not Km2.
Oops, thanks Mod and Ron, I used to actually know how to read a graph. I just saw the 7.4 million sq kilometers in the legend and the 20 on the left and didn’t notice that the left axis was percent and not km^2. So one thing that I don’t see straight up is what the net planetary sea ice anomaly is. I think WUWT has a sea ice page — maybe I’ll visit and take a look. Since “global” warming is what is being considered and people correctly object to cold spells here or there being necessarily representative of global average temperature, it seems only fair to apply the same standard to things like sea ice. If the global sea ice anomaly is holding nearly steady with a simple redistribution from the NH to the SH, it means that the sadness of the arctic polar bears is offset by the gladness of the antarctic penguins, or something. Or it forces the discussion back towards the impossible-to-refute assertion of “anthropogenic climate change” (impossible because the climate is always changing with or without human influence, climate is a non-stationary process, not a stable, stationary equilibrium state, and climate is the integral of chaotic processes so that if I sneeze then I, a human, cause “anthropogenic climate change” compared to what would otherwise have occurred ten years downstream).
Sigh.
Watching the Arctic ice melt season is fascinating, but almost as humbling as predicting solar cycles or ENSO events. In any case, the variability seems to be driven by water, wind and clouds; CO2 not so much.
https://rclutz.wordpress.com/2015/03/29/arctic-sea-ice-factors/
The graph at the very top is %anomaly based on the 1981-2001 average of 7.4 million cu km.
You are not the only one baffled. It would seem Arctic ice is migrating to the Antartic. For what reason, who knows? Perhaps we should hang a net around the Arctic to discourage it.
Why is the difference between land ice and sea ice constantly ignored?
Max Sargent
Not sure what you mean? In proper analysis, the two are rigorously tracked separately. BUT! Around the Antarctic, you determine the reflectivity and effect on the earth’s energy budget, you need to determine the energy received and reflected at the specific latitudes of the edge of the Antarctic sea ice and that of the Arctic sea ice on the same date – which is NOT the same as comparing Arctic sea ice area to Antarctic sea ice area.
Down south, the edge of the Antarctic sea ice = Antarctic land ice + Antarctic shelf ice + Antarctic sea ice.
Up north, only the Arctic sea ice is present. (Hudson Bay, Bering Sea, Baltic sea are the few exceptions. And they melt every year each summer. )
Thank-you for the explanation.
Currently, the temperature dropped below average.
http://ocean.dmi.dk/arctic/plots/meanTarchive/meanT_2015.png
Daily mean temperatures for the Arctic area north of the 80th northern parallel, plotted with daily climate values calculated from the period 1958-2002.
http://ocean.dmi.dk/arctic/weather/temp_latest.big.png
That graph shows air temperature anomalies, meaning that this year til now Arctic air has received more heat from the ocean than the past average. That is the result of there being less than average ice extent, and more open water than the past average. Air temperature returning to average may indicate ice extent is headed toward average, if that trend continues.
For comparison look at the same chart from 1977 when there was much more ice cover the entire year:
http://ocean.dmi.dk/arctic/plots/meanTarchive/meanT_1977.png
The cycle phase of the AMO was positive, now turned. So we come back to the seventies.
Comparative to the last dozen years though, this is relatively early for the trend to cross into negative territory. Any other time where it occurs here or earlier generally correlates with a cold year. I took a look this morning to see if there was any indications of affecting the rest of the year,s temps.
ren, I don’t disagree, the future is more likely than not to be cooler than today. That is something unthinkable for global warming believers.
But the summer temperatures in the Arctic have been running cooler in comparison to 1977 over the past few years.
Do you know why? Anything to do with cooler Atlantic SSTs?
Yes, the [Antarctic] sea ice has been banned from participating in BBC news broadcasts.
At least until it starts to behave itself by melting promptly, as planned.
The BBC trust decided that they should not give publicity to any sea ice that behaves in a manner that is inconsistent with their mainstream fear-mongering agenda.
Mentioning sea ice gains in one part of the world whilst focusing on the disappearance of sea ice somewhere else may give viewers the false impression that what we are seeing is nothing more than a trivial upward temperature trend combined with natural variability of weather patterns.
Rather than the brink of apocalypse, as confirmed by govt. funded experts, everywhere.
(satire).
They should be interested in dropping the temperature of the North Atlantic.
http://weather.unisys.com/surface/sst_anom.gif
This is interesting. I wonder if anyone can reconcile the low Sea Ice Extent in the Sea of Okhotsk, as referenced in one of the first comments above by polarbearscience , with this map showing the Sea Surface Temperature anomaly for that same area. Seems like a below normal Sea Surface temperature would be conducive to more sea ice. Or not? Or does it say more about the water temperature?
The entire post was very informative and helpful.
Okhotsk is on the Pacific side bordering Japan sea. There’s a warm blob in the Northern Pacific currently, so that would be consistent with less ice. Ice extent is also affected a lot by wind, as someone commented up thread.
https://rclutz.wordpress.com/2015/03/29/arctic-sea-ice-factors/
Straight from NOAA themselves – April Global Sea ice is 3rd highest on record. Any questions?
https://www.ncdc.noaa.gov/snow-and-ice/extent/sea-ice/G/4
Good link. Thanks.
Except that it only goes up to 2014
Richard,
So far, 2015 global sea ice is above 2014 [the red chart line]:
http://arctic.atmos.uiuc.edu/cryosphere/IMAGES/global.daily.ice.area.withtrend.jpg
DBStealey
I was about to point out to you that this was the data which was only complete up to 11th April, and before I could write my comment, the last 3 weeks’ data has magically appeared. They must have known we were talking about them.
I can almost hear the hum of sea-ice spreadsheets being gleefully updated around the world….
[Spelling fixed. ~mod.]
Richard,
Thanks for pointing that out, I would have missed it.
And indeed my own spreadsheet, based on the recently updated JAXA data shows that April 2015 comes a close second to 2014, with an average extent of 6.28 million sq km, against 6.32 for last year. They must use a slightly different algorithm from that used by NSIDC.
The last 9 days of the month all set records, breaking last year’s records, and this has continued into May.
The average year-to-date figure for 2015 (4.33) is also just behind 2014 (4.35), but way ahead of the 3rd placed 2008 (4.17)
Paging Ernest Henry Shackleton……
Satellite Products, Arctic Ocean.
http://ocean.dmi.dk/arctic/satellite/plots/satsst.arc.d-00.png
Satellite Products
The ice surface temperature strongly affects heat exchange between the surface and the atmosphere and the rate of ice growth. In order to perform proper forecasting of weather and sea-ice conditions, it is essential to obtain accurate surface temperatures.
A sparsely distributed observational network, consisting of drifting buoys, cannot resolve the surface temperature variations in the Arctic sufficiently but satellite observations can fill in the gaps of the traditional observational network.
The DMI ice temperature product (IST) uses three thermal infrared channels from the Advanced Very High Resolution Radiometer (AVHRR) on board the Metop-A satellite to calculate the surface temperatures in the Arctic.
http://ocean.dmi.dk/arctic/ice_temp/plots/icetemp.arc.d-00.png
I am just going outside and may be some time
It grows seismic activity in Antarctica.
http://ocean.dmi.dk/arctic/climatology_v2/img/ymon/sh_JAM__ymontrend_08.jpg
There appears to be a natural bipolar seesaw in operation.
‘The minimum over the pre-industrial period occurred during the years AD 1250 – 1500. The sea-surface temperature in the Southern Ocean lags the conditions in the Northern Hemisphere, where the simulated temperatures reach a maximum in the model during the 11 and 12th centuries.
‘Such a lag is due to the long memory of the ocean associated with the storage and transport of temperature anomalies at great depth. Between AD 1250 and 1500 the simulated Antarctic ice area was similar to that at the end of the 20th century.’
Goosse and Renssen 2004
We are talking about on 1 in 14 variation from average max to this low max when annual swing from max to min is 7 or 8 parts in 14. Not sure why this should have any effect on much of anything.
my comment is wrt Aectic
Warm cuddly model, meet cold hard reality.
http://www.gifbin.com/bin/102012/1350490360_guy_jumps_cannon_ball_into_frozen_pond.gif
I do love how he blazed a path to new understanding … via buttock and spinal column’s compaction … you don’t see that sort of thing very much these days … reminds me of the movie, “The Right Stuff”, the part where the German engineer subtly suggests a chimpanzee might be a more prudent occupant for the ‘capsule’.
Breaking your tail bone is one of the least best forms of entertainment.
In other news, here’s my “Oh, but…” trollish person imitation:
Oh, but Antarctica is losing ice mass.
In retrospect, I do sincerely apologize. It’s painful to even watch.
I got 5 stiches in my chin playing hockey at the local rink, without being a fool.
So, I got no pity for amateurs 🙂
Does anybody recall the concept of “average?” The black line is the average of 1981 to 2010 trends w/ +/- 2 stand dev band. That means that half of the 29 year lines were above and half below. Plot all of the annual trends and see where 2015 fits in. Just lost among the 15 other lines in the SD band.
What’s the hub-bub, bub?
It doesn’t mean half were above and half below the average. That would be the median rather than the mean (average).
You could say approximately half.
Antarctic surface temperature measurements are worthless, because they are contaminated by a combination of the only Urban Heat Islands on the continent, and albedo melting of snow and ice from the particulate pollution from the diesel generators all the stations use, exposing bare rock at many of the stations and darkening the snow/ice at all of them. Thus absorbing more solar energy around the stations.
Concerning the loss of sea ice in the Sea of Okhotsk. This area is downwind from Siberia where there have been extensive forest fires this spring, with reports of the haze from these fires reaching as far as several US cities.
Deposition of this particulate haze/smoke on the ice will have caused accelerated spring melt in the Sea of Okhotsk, which is the most southerly Arctic sea ice, and thus most susceptible to melt from albedo changes.
Particulate pollution occurs across much of the Arctic, whereas it is almost completely absent from Antartica (except very locally to the Antarctic Stations as noted above). Which makes changes in Antarctic sea ice climatically far more more significant.
In “Climate Science” it really does take a genius to add two and two together. Is the answer 4, or 4.000, and do they know the difference? They probably do but know that low-information types do not, and this is endlessly exploited…
Ice that is frozen onto a Continent is nothing like ice that is free-floating on an Ocean. Ice attached to a continent can resist the Wind, whereas ice free-floating, with all the leads and polynyas, cannot. It’s the Wind what dunnit, another issue not understood by those poor unfortunate Low Information types.
Did I spell “polynyas” correctly?
Michael Moon
May 5, 2015 at 8:37 pm
“Did I spell “polynyas” correctly? ”
=============
It seems you did, good work.
Nothing confusing about this.
Found this today….
http://www.bbc.com/news/science-environment-32599228
One of the lines from the article….”The new core also supports the “bipolar seesaw” effect between poles, meaning that when it’s warm in Greenland, Antarctica is cooling, and vice versa”.
http://arctic.atmos.uiuc.edu/cryosphere/
It has been updated.
ARCTIC SEA ICE -.648 below normal.
ANTRACTIC SEA ICE +1.76!!!! above normal.
Once again deniers…you don’t know what you’re talking about. The increased ice is due to global warming. Sorry.
Antarctic sea ice is complex and counter-intuitive. Despite warming waters, complicated factors unique to the Antarctic region have combined to increase sea ice production. The simplistic interpretation that it’s caused by cooling is false.
[url=https://www.skepticalscience.com/increasing-Antarctic-Southern-sea-ice-intermediate.htm]Why is southern sea ice increasing?[/url]
Redtom,
Define a “denier”.
If/when you do/can, I’ll give you a better definition.
You won’t like it. But it will be far more accurate.
Redwing Tom, are you the guy that used to sell me my work boots?
(Redwing shoes are top-notch!)
I believe the same can be said for the greenhouse effect’s influence on global climate.
At least, when you look at the divergence of the models from reality…
The claim that land ice melting is causing the extra sea ice around Antarctica has been completely debunked. Guess where the only area with below average sea ice is located? Right where the land ice is experiencing geothermal melting.
@Redwingtom,
You say:
“Once again deniers…you don’t know what you’re talking about. The increased ice is due to global warming. Sorry.”
========================
So lets parse this statement, I’m sure it was as nasty as you could produce.
You say: “Once again deniers…you don’t know what you’re talking about.”
I say: You may very well be right, but was the “deniers” tag necessary ?
You say: “The increased ice is due to global warming.”
I say: How does warming lead to more ice ?
So, by calling me names you figure I’ll be more receptive to your crazy theory that “The increased ice is due to global warming.”
Can you even see how backwards your tactics are ? Not only do you insult me, you expect me to believe something that is counter-intuitive.
The data is slowly but surely proving that nobody knows what they are talking about.
You should be happy you are in the fraction of the world population that has the resources to actually debate the issue.
There seems to be “money” in the ultimate outcome.
University of Illinois’ Cryosphere today is now updating their graphs.
Based on what has happened before (paleo record when there was a reduction in solar activity) and the current trends, it appears there will soon be record total sea ice followed by record sea ice both poles.
http://arctic.atmos.uiuc.edu/cryosphere/iphone/images/iphone.anomaly.global.png
Any way you cut it the global temperature average is static.
A bit of noise, some heat island effects, some record low temps, some record high temps.
Exactly what you’d expect.
No up trending, no down trending.
No NET heating, no NET cooling.
Stable planet.
All the rest has nothing at all to do with science.
CPC forecasting positive sea ice extent anomaly for peak melt sea season in Sept 2015.
http://www.cpc.ncep.noaa.gov/products/CFSv2/imagesInd3/sieMon.gif
If that comes to pass, and Antarctic Ice stays very positive, takes the Arctic Ice melting doom off the table for 2015 Paris COP propaganda run-up.
The Antarctic is heading into its winter now, and darkness so don’t worry. The Arctic is coming into summer and longer days of sunlight. Don’t worry sea ice is always going to retreat and grow in the Arctic same as Antarctic. As the Arctic is mainly sea ice and no land near the pole, not the Arctic circle and there is nothing we can do to control this. It tires me when all these reports suggest AGW controls sea ice melting etc., when it is caused by the seasons and natural physically events. Yes the Antarctic is very seismic and has active volcanoes terrestrial and submarine. And they don’t have polar bears either.