Guest post by Bob Tisdale.
Preliminary Note: An “alarmism warning” indicates alarmism is imminent. On the other hand, an “alarmism watch” indicates alarmism might occur, but that’s all the time.
We’re not just talking a record high for the month of August…we’re talking a record high for any month during the satellite era. I suspect our alarmist friends will be making all sorts of claims about attribution even though climate models still almost double the observed rate of ocean surface warming during the satellite era.
We recently discussed the likely reasons for the record high sea surface temperatures in the North Pacific, and their impacts on global sea surface temperatures. See the post On The Recent Record-High Global Sea Surface Temperatures – The Wheres and Whys. According to the preliminary satellite-enhanced sea surface temperature data for August 2014, the sea surfaces of the North Pacific are still warming. See Figure 1. After almost 2 ½ decades of showing no warming, apparently a blocking high is driving sea surface temperatures in the North Pacific skyward.

Figure 1
Due to the enormity of the North Pacific, and due to the magnitude of its apparent upward shift, sea surface temperatures globally are at record high levels, as shown in Figure 2. And as noted above, the record is not just for the month of August, we’re talking record highs for any month [during the satellite era].
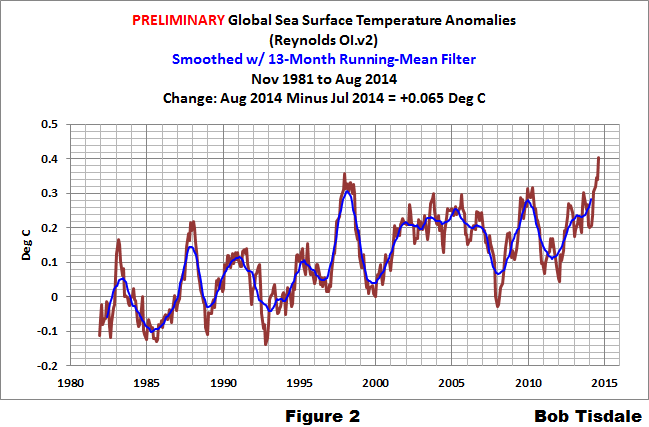
Figure 2
AND NOW BACK TO YOUR REGULARLY SCHEDULED PRELIMINARY SEA SURFACE TEMPERATURE UPDATE FOR AUGUST 2014
GENERAL NOTES – BOILERPLATE
The August 2014 Reynolds OI.v2 Sea Surface Temperature (SST) data through the NOAA NOMADS website won’t be official until Monday, September 8,, 2014. Refer to the schedule on the NOAA Optimum Interpolation Sea Surface Temperature Analysis Frequently Asked Questions webpage. This post includes the preliminary Global and NINO3.4 sea surface temperature anomalies for August 2014 that the NOMADS website prepares based on incomplete data for the month. I’ve also included the weekly data through the week centered on August 27, 2014. The base years for anomalies are 1971-2000, which are the standard base years from the NOAA NOMADS website for this dataset.
PRELIMINARY MONTHLY DATA
The preliminary global sea surface temperature anomalies for August are presently at about +0.40 deg C. See Figure 2 above. Based on the preliminary data, they warmed a good amount (an increase of about +0.065 deg C) since July. With the apparent upward shift in the North Pacific sea surface temperature anomalies last year, and the early El Niño conditions this year, we’re looking at the possibility of record-high global sea surface temperatures for the year 2014. The other factor, of course, is the upward shift in the sea surface temperatures of the South Atlantic-Indian-West Pacific subset in response to the 1997/98 El Niño. See the discussion in this post under the heading of The East Pacific Versus the Rest of the World and the post here.
Another consideration, the sea surface temperatures in the equatorial Pacific are warming again, in response to another downwelling (warm) Kelvin wave.
The sea surface temperature anomalies of the NINO3.4 region in the eastern equatorial Pacific (5S-5N, 170W-120W) are a commonly used index for the strength, frequency, and duration of El Niño and La Niña events. See the illustration here for the location of the NINO3.4 region. Based on the preliminary data, August 2014 NINO3.4 sea surface temperature anomalies are now slightly below the +0.5 deg C threshold of an El Niño event. They’re presently at +0.32 deg C. The threshold for El Niño conditions is considered to be warmer than or equal to +0.5 deg C (and for a La Niña, it’s cooler than or equal to -0.5 deg C). So the reading of +0.32 indicates the tropical Pacific in in ENSO-neutral conditions based on the preliminary monthly data. Also refer to the weekly data that follows, because the weekly NINO3.4 data have shown warming again in recent weeks.

Figure 3
######################
WEEKLY DATA
Weekly NINO3.4 region (5S-5N, 170W-120W) sea surface temperature anomalies for the week centered on August 27, 2014 have recently warmed and they are once again approaching the threshold of El Niño conditions. The weekly NINO3.4 sea surface temperature anomalies are approximately +0.47 deg C.

Figure 4
######################
The weekly Global sea surface temperature anomalies are now at record high levels. They are presently about +0.45 deg C.

Figure 5
######################
INTERESTED IN LEARNING MORE ABOUT THE EL NIÑO AND LA NIÑA AND THEIR LONG-TERM EFFECTS ON GLOBAL SEA SURFACE TEMPERATURES?
Why should you be interested? Sea surface temperature records indicate El Niño and La Niña events are responsible for the warming of global sea surface temperature anomalies over the past 30 years, not manmade greenhouse gases. I’ve searched sea surface temperature records for more than 4 years and ocean heat content records for more than 3 years, and I can find no evidence of an anthropogenic greenhouse gas signal in either dataset. That is, the warming of the global oceans has been caused by naturally occurring, sunlight-fueled, coupled ocean-atmosphere processes, not anthropogenic greenhouse gases.
Last year I published an ebook (pdf) about the phenomena called El Niño and La Niña. It’s titled Who Turned on the Heat? with the subtitle The Unsuspected Global Warming Culprit, El Niño Southern Oscillation. It is intended for persons (with or without technical backgrounds) interested in learning about El Niño and La Niña events and in understanding the natural causes of the warming of our global oceans for the past 31+ years. Because land surface air temperatures simply exaggerate the natural warming of the global oceans over annual and multidecadal time periods, the vast majority of the warming taking place on land is natural as well. The book is the product of years of research of the satellite-era sea surface temperature data that’s available to the public via the internet. It presents how the data accounts for its warming—and there are no indications the warming was caused by manmade greenhouse gases. None at all.
Who Turned on the Heat? was introduced in the blog post Everything You Ever Wanted to Know about El Niño and La Niña… …Well Just about Everything. The Free Preview includes the Table of Contents; the Introduction; the beginning of Section 1, with the cartoon-like illustrations; the discussion About the Cover; and the Closing.
Please buy a copy. (Credit/Debit Card through PayPal. You do NOT have to open a PayPal account. Simply scroll down to the “Don’t Have a PayPal Account” purchase option. It’s only US$8.00 marked down to U.S.$5.00.
SOURCE
The Sea Surface Temperature anomaly data used in this post is available through the NOAA NOMADS website:
http://nomad1.ncep.noaa.gov/cgi-bin/pdisp_sst.sh
The book is well with it. Support Tisdale. Even if you argue about his conclusions, his data gathering is invalauble.
Thanks for the kind words, hswiseman.
I got it and my knowledge advanced in areas that were lacking.
Well Worth it. GD, spellchecker.
Well, it is both “with it” and “worth it” so you got it covered.
/grin
Bob –
“…And as noted above, the record is not just for the month of August, we’re talking record highs for any month.”
Should that be “record highs for any month in the satellite era” so as not to imply an all-time record?
Hi JohnWho: I agree. I added “during the satellite era” in brackets. Thanks.
However Hadsst3, which goes back to 1850, also showed an all time record in June but July was just a bit lower. August could set a record as well.
I assume the last point will come down once we get to the end of 2014?
It will be interesting to see if the alarmists are right and the heat will be transferred back to the atmosphere. This month might put the real world back on track with the models.
Or it might not.
I think that, due to the difference in specific heat of water and air, the transfer of the same amount of heat back into the atmosphere from the water is impossible. For example: heat that would have warmed the air, say 1 degree, would only warm the water 0.1 degree. 0.1 degree can not, in turn, heat the air back up 1 degree because heat has to flow from a higher temperature to a lower temperature.
Yes, but this argument is not complete or sufficient, because the system is highly nonlinear and we are not talking about warming the air above the temperature of the ocean by passive radiation or heat transfer from the ocean, we are talking about warming the air including the transfer of lots of latent heat and greenhouse gas in the form of water vapor, both of which nonlinearly affect the coupling of the atmosphere to both incoming radiation from the sun and the greenhouse trapping of that sun-source energy.
So sure, warming the water by 0.4C over a very broad region of open sea water could “turn on” a vast increase in greenhouse efficiency for that region OR it could cause a vast increase in regional cloudiness for that or some other region altogether (because the atmosphere itself isn’t stationary, neither is the ocean underneath) and self-regulate by reflecting more incoming sunlight, or both at different locations and times in the future (possibly substantially in the future).
As Bob said, the “proximate cause” of the warming appears to be a blocking high. Blocking highs happen, and can cause the weather over significant regions of the Earth’s surface to stagnate, so that heat transport that usually moves heat delivered there to move elsewhere so that it can be radiated away no longer occurs. This can significantly increase temperatures in the region in the same way you car is likely to get hotter with the windows closed than it is with them open, until something like automated sun shades (clouds) kick in to limit the process.
Bear in mind that there is substantial evidence that strong ocean coupled events, e.g. the 1997-1998 super El Nino, can produce a substantial pulse of mean atmospheric warming. What is even more interesting is that the warming of the atmosphere can linger even after the ENSO event is gone — the system has multiple equilibria and instead of returning to the old one it creates a new one.
In a chaotic system, there is at least some chance that the system self-organizes during an event like this to become more efficient at cooling and instead of retaining the new temperature fall back to a temperature even cooler than the one it started with, although there isn’t much evidence of this in the short stretch of halfway decent data we have to date (satellite era only, basically).
It is important to note that the efficiency of the system at dissipating heat is proportional to temperature to the fourth power at any given patch of surface. The patch of ocean that is now heating because of the blocking high is actually losing more heat, faster, from the Earth system altogether than would have been lost if the heat were delivered somewhere else cooler and lost there. Also, those cooler places (unwarmed as much by heat transported from the warming ocean) are now getting cooler than usual and will enter the fall and winter at slightly sub-normal temperatures. This could include places like “the Arctic” or Siberia and Canada and North Europe. When winter finally happens, it could happen with a colder initial state everywhere but the blocked stretch of ocean, and when that stretch cools, if it cools locally it could still easily return close to equilibrium and have little long term effect. There was a similar blocking high in the Atlantic a few years ago, and it did cause Atlantic SSTs to rise a fair bit in the tropical hurricane zone, but seemed to have little long term impact on the climate once the blocking high went away and the trade winds swept away the rest of the surplus heat.
Not all of the heat gets swept away, of course. Some of it is carried down into the deeper ocean by thermohaline circulation and so on. Events like this are possibly responsible for some bit of Trenberth’s “missing heat”, depending on just where they occur in the thermohaline transport. But in this case the heat is basically sequestered for a very long — decades to centuries — timescale.
rgb
That would be my inclination as well. But it doesn’t need all the heat to transfer into the atmosphere as water holds so much heat compared with the diffuse air.
So I’ll let the world turn and see what actually happens. Observation trumps theory.
“… But in this case the heat is basically sequestered for a very long — decades to centuries — timescale.
rgb”
Yes, perhaps, and it may over that time dissipate the heat so slowly as to not make a discernable difference, could it not?
Isn’t the mechanism for heat transfer from the ocean to the air primarily just the evaporation of the ocean water (heat removal from ocean) and re-condensation of the water vapor in the air (heat deposition in the atmosphere)? During the cold ocean cycle, the cold oceans are warmed by the sunlight, but less evaporation occurs so less heat from the absorbed sunlight makes it’s way back into the atmosphere. During the warm ocean phase, the rate of evaporation of water from the ocean is greater than the amount of sunlight depositing energy into the oceans, (1970-2000) resulting in the oceans cooling and additional heat showing up in the atmosphere. Heat (energy) that starts in the atmosphere, goes into the ocean, and then somehow makes its way back into the atmosphere can cause NO net warming.
I have a model aeroplane.
That I assembled over fifty years ago.
And the bloody thing still won’t fly.
Nice work. I was going to point out that ‘enormity’ implies something awful like a monstrosity.
Not too be confused with the “half-vastness” of the Alarmist/Warmist belief.
To rgbatduke,
So my mistake is to use such words as “impossible.” I guess with a chaotic system anything is possible. Very good response!
I suppose it’s straight data from NOAA this time, but if its from NOAA. I mentally attach a Roger Maris asterisk next to all their data now. The institution is fundamentally biased.
Is there “Raw” data and “Quality Controlled” data for sea temperatures?
Either way this warmth in the sea surface will not take long to disappear in to space, thus increasing the overall cooling rate.
Make the most of any heat transferred to the atmosphere, it won’t be around long.
Has global cloudiness changed? I assume this warming is sun-fueled and if global cloudiness hasn’t changed then some land areas should be cooler.
The question I’d like to know the answer to is, what percent of the AGW crowd would actually prefer to be conclusively proven wrong or do they want their policy objectives implemented regardless?
But Bob, you haven’t told us – are we all doomed?
Of course we’re all doomed; to quote The Doors:
“Five to one, baby
One in five
No one here gets out alive…”
Not scientific enough. To say “Death is inevitable” it is preferred to show at least a 95% confidence interval, no more than 1 in 20 of your population sample may be immortal.
Isn’t the blocking high part of the reason for the polar vortex that is expected to return this winter in NA?
Scarborough says, “,,,the transfer of the same amount of heat back into the atmosphere from the water is impossible.”
Heat is still released when the ocean surface evaporates warmed water into colder air. When the moist air rises and becomes rain or snow, heat is released at that moment and that heated air rises through the atmosphere, creating low pressure under the rising air system. Eventually, the oceans do release their sun-warmed collected heat or else they would have boiled away by now.
Also, no one has mentioned that the energy in the atmosphere will not transfer into the ocean as readily if the ocean is warmer. While that is not a major source of heat for the ocean (it’s the sun), it would contribute to a lack of cooling the atmosphere.
Seriously, only the “Alarmists” will get excited over this.
The climate scientists aren’t in agreement what was the main cause(s) of the LIA nor are they in agreement of the main cause(s) of the “recovery” from the LIA. We don’t even know when the recovery will end or what the end will be: a number of years of relatively stable atmospheric temperature or a 100 plus years of temperature decline toward LIA2, the Sequel.
The current crop of models, which aren’t tracking reality very well, move us toward continued warming, perhaps until the “oceans boil”, although if we just stop putting so much CO2 into the atmosphere the oceans may remain cool to the touch. The actual science “as we know it” does not support the models nor does it support the idea that less anthropogenic CO2 emissions will be our salvation.
It is too bad the phrase “Stop the Insanity” has already been used, ’cause it sure is appropriate to the Warmist/Alarmist belief system.
/rant off
Any data on temperature with depth in this North Pacific region? Is there any correlation with changes in North Pacific upwelling?
JaneHM: Subsurface temperature data are not available in easy-to-use form. Sorry. The KNMI Climate Explorer does have NODC ocean heat content data for depths of 0-700 meters, but it hasn’t updated there yet for the second quarter (April-June).
But the hotspot in the North Pacific is visible in the GODAS depth-averaged temperature anomalies (a reanalysis) for the top 300 meters:
All that heat is probably coming from massive increase is sea ice volume in the past couple of years. Latent heat released by the phase change.
Just how hot are these hot spots in the Bering Sea and between Canada and Greenland?
I mean _actual_ SST.
The data are available in absolute form (not anomalies) on weekly and monthly bases through the NOAA NOMADS website:
http://nomad1.ncep.noaa.gov/cgi-bin/pdisp_sst.sh
Interesting that VA is shown in white. VA Beach water temp is 77.9 today; average is 81. Moving the goalposts?
I just thought of something. If the oceans are getting warmer, wouldn’t that cause higher evaporation rates and higher rates of stormy weather– especially in places like California, where the mountains inland cause the prevailing Westerlies to rise, therefore dumping their moisture?
That being the case— how come there’s a drought in California? If the seas are getting warmer, raising evaporation rates, California should look like a rain-forest right about now— not like a parched desert where they’re having to pass laws so you don’t waste water.
OK— don’t mind me, I’m just “thinking out loud” here. I remember all to well the number of times my actual observations of current conditions– I live just West of Chicago, in Illinois– got put down because “weather isn’t climate”. So, actual observation— you know, real science– isn’t compatible with current alarmism, and so therefore must be discounted.
mjmsprt40 – It’s the “blocking high” that is also causing the drought in CA.
http://www.wunderground.com/blog/JeffMasters/california-droughtpolar-vortex-jet-stream-pattern-linked-to-global-wa
interesting that GAT does not reflect this all time satellite era high?
There is a problem with the sea surface temperature measurements in that there is significant seasonality remaining in the anomalies – the summer months are the peak now with August being the highest.
The lower troposphere satellite measurements over the ocean are not showing these type of records (at least up to July). Warm but nowhere near the records of 1998 or 2010.
http://data.remss.com/msu/monthly_time_series/RSS_Monthly_MSU_AMSU_Channel_TLT_Anomalies_Ocean_v03_3.txt
http://vortex.nsstc.uah.edu/data/msu/t2lt/uahncdc_lt_5.6.txt
Melting ice will have been taking heat content out of these areas for most of period of record. Since ice volume is now increasing this may be producing a positive SST “anomaly”.
specific heat capacity water: 4.21 kJ/kg/K
latent heat of fusion water : 332 kJ/kg
freezing 1kg of pure water to ice releases enough heat to warm 100kg of water by the “anomaly” of 0.8K .
All sounds rather paradoxical but if global warming can cause severe winters I suppose increasing sea ice can cause global warming.
Specific heat of sea water @36 F is 3.93.
Warm temps in the N Pacific cause a high to anchor there, pushing the jet-stream in winter north into Alaska & then south into the US. 1976-1977 for example. Not good.
Warm ocean temps + cold continental temps = snowfall!
Since sea surface temperatures are at a “record high”, where are all the hurricanes and typhoons? I suppose the next 2 months could (should) be very active:
http://www.wunderground.com/hurricane/
The tropical cyclones are in the eastern tropical North Pacific.
Is this how a glaciation gets started?
No, this is how the next cycle of hype gets started.
I’ve posted this before, but I am still not seeing a proper explanation of why the ocean heat system (including ninos, ninas, oscillations etc) should be treated separately to the atmospheric heat system. Nobody has explained to me why the vast heat capacity of the oceans shouldn’t act as a moderator, then a delayer, and finally perhaps an accelerator, for atmospheric warming. Lots of talk of thermoclines and haloclines but no convincing numbers..
‘It’s not AGW.. its the ocean’ seems to me worse than an oversimplification
According to the fine folks at Weatherbell.com that blocking high over the N Pacific was one of these reasons for last year’s severe winter. If it persists, might this winter be worse?
My thoughts are that a blocking high means fair weather, i.e. few clouds. Few clouds mean up welling IR has no reflector/blocking function, which in turn means that the cooling of the SST can continue apace. Since the anomaly is just a delta T, the temperature of the ocean is right cool anyway – if you don’t believe me, try catching some of the Aleutian swells on a board without a wetsuit. Ergo, the current past the west coast of NA is going to be somewhat cooler than one might anticipate. If the Weatherbell folks were correct last year, then we’ll have more in spades this year.
How much energy does this warming represent?
Can the Sun give that amount of warming in such a short space of time?
Ralph
Thank heavens! Perhaps that enormous amount of heat in the Northern Pacific will, at some point, mitigate the bitterly cold winter we expect to see here in the eastern part of North America.
A bitterly cold winter, I might add, brought to us by Global Warming, umm, Climate Change umm, Climate Disruption.
Oh, whatever. We’re all going to freeze to death otherwise.
Dream on…
No — just the opposite. Warm in Alaska/N Pacific means cold in the US east. Last winter was somewhat an example, 1976-1977 was a better one.
Bob
Have you ever done, or is it possible to do, an individual comparison of sea surface temperatures over the years measured against the changing sea levels over the years in each of the ocean basins as defined by the University of Colorado here
http://sealevel.colorado.edu/content/regional-sea-level-time-series
tonyb
tonyb, I don’t recall doing it, but it’s possible. The University of Colorado sea level data are available in monthly format through the KNMI Climate Explorer.
http://climexp.knmi.nl/getsealevelave.cgi?id=someone@somewhere&WHERE=ocean_ib
You’d then have to select the coordinates of the sea surface temperature data to try to match the sea level data
Greg says: September 1, 2014 at 7:33 am
Just how hot are these hot spots in the Bering Sea and between Canada and Greenland?
I mean _actual_ SST.
Here is a chart that comes out at 6:00 AM ET daily that gives the actual temps.
http://weather.gc.ca/data/analysis/351_100.gif
Bob…
It appears the ENSO Meter (in the sidebar) has inched up a bit more toward the El Nino area. Do you have any hard predictions as yet on this?
Thanks
F. Ross, the sea surfaces of the equatorial Pacific should reach back into El Nino “conditions”. There’s another wave of warm water working its way to the eastward and to the surface:
http://www.cpc.ncep.noaa.gov/products/analysis_monitoring/enso_update/wkxzteq.shtml
The warm water appears to be leftovers that were recirculated from the earlier Kelvin:
http://bobtisdale.wordpress.com/2014/08/12/the-201415-el-nino-part-15-august-2014-update-an-el-nino-mulligan/
But if the trade winds still don’t cooperate, we may not get a full-fledged El Nino.
I guess that link did not work. Go to
http://weather.gc.ca/canada_e.html
Then Marine >sea surface temperature
Note that the temp anomaly is about 0.3C from 1980 to present, or about 1.0C/century. Only if you use the most recent years do you see any non Scenario C Hansen profile.
The temperature (Y-) axis looks to be a killer only because of scale.
Precisely. A record may indicate the end of the “pause,” but if the peak ends here, roughly one half of one tenth of one degree above the ’98 peak, we are well below modeled paces. Time will tell…
No alarmism – just more data confirming the world is warming.
The vast amounts of time expended on comparing models and data trends, predictions of impending ice ages, even denial of the most basic physics, don’t change the fact that the world is warming due to increasing GHGs in the atmosphere.
The real debate is what the extent of the warming response of the system will be, the time it takes to reach equilibrium (subject to natural variations) and the impacts that increase in global mean temperature will have on physical parameters, particularly sea level.
James Abbott
Global warming has stopped. The Earth is NOT warming.
Face it,live with it and cope with it because it reality.
Global warming has stopped.
Richard
The world is not warming, though there will be a spike followed by the downturn that is the nature of the cold PDO events, when there is a pdo/mei spike. It tiring explaining this to every person that wishes to scream global warming, but the fact is what you see in the oceans is a product of decades to centuries of action and reaction in the climate and not the increase in 1 molecule of co2 out of 10000 molecules of air in the last 100 years Given another MAJOR tropical epac pacific cyclone likely to develop and perhaps strike the BAJA I think Bobs warning should be a double secret probation code red warning.. they will go nuts next week. Here is the global temp the last 10 years
http://models.weatherbell.com/climate/cfsr_t2m_2005.png
another spike is coming, followed by another fall to a lower level than the post 09-10 spike
second anyone want to mention what may have been another record cold summer at the NPOLE
http://ocean.dmi.dk/arctic/meant80n.uk.php
click on 2013 for last year and then 2014 for this year.. last year was record
richardscourtney and Joseph Bastardi you clearly have not read and understood the article.
The article states:
“sea surface temperatures globally are at record high levels, as shown in Figure 2. And as noted above, the record is not just for the month of August, we’re talking record highs for any month [during the satellite era].”
The figure referred to clearly shows, as any reasonable person would agree, a warming trend continuing to the present, over the last 30 years. There are of course cycles within that as would be entirely expected given natural fluctuations, but the trend is clear.
Why is the sea surface temperature anomaly significant ? Because the oceans hold vastly more heat energy than the atmosphere.
You may wish for cooling temperatures and search for ever more remote methods of undermining the data, but the fact is the world has warmed and continues to do so.The pause in surface air temperature does need explaining of course, but it is not inconsistent with an expected long term warming trend.
There is a legitimate debate about the future response (sensitivity) to rising concentrations of GHGs but to keep on trying to claim there is no warming or even worse that increasing concentrations of GHGs have no effect is just futile and wasting everyone’s time.
James, without knowing what the history of sea surface temperatures are, as it definitely appears there are ocean temperatures cycle as well, and without knowing how they varied in the past, one does not even know if the current ocean temperatures are out of the ordinary. Basing the whole idea that the current ocean warming is looking catastrophic, on a mere 20 yrs of data, is just fear-mongering because there is no science upon which to back up the claim. The fact that the oceans are warming means absolutely nothing without knowing what the history is. Also, since sea level rise has not accelerated, more evidence the warming in much ado about nothing.
James Abbott says: “richardscourtney and Joseph Bastardi you clearly have not read and understood the article…….”

And you appear to have overlooked a portion of my post, James, which clearly states:
I suspect our alarmist friends will be making all sorts of claims about attribution even though climate models still almost double the observed rate of ocean surface warming during the satellite era.
And here’s the graph that was linked to that sentence:
James Abbott says: “The figure referred to clearly shows, as any reasonable person would agree, a warming trend continuing to the present, over the last 30 years. There are of course cycles within that as would be entirely expected given natural fluctuations, but the trend is clear.”
But you also overlooked the graph of the North Pacific data that showed it hadn’t warmed for nearly 2 1/2 decades. It was linked to the sentence:
After almost 2 ½ decades of showing no warming, apparently a blocking high is driving sea surface temperatures in the North Pacific skyward.
Unless you can explain the lack of warming for 2 1/2 decades, while emissions of manmade greenhouse gases rose, you can’t claim the long-term warming for 3+ decades was caused by those greenhouse gases.
Regards
Remember that sea surface is only sea surface. There are miles / kilometers more sea depth below. SSTs are easy come easy go, as next year will show when there will likely be a strong La Nina starting around Feb.
No-one said anything a few months ago when North Pacific temperatures were anomalously cold. Bill Illis (above) has the correct explanation – strong uncorrected seasonality in the N Pacific SST record peaking now in August. This may be deliberate – periodic faux warming scares serve media and political agendas as I’m sure James understands very well.
An additional metric that can used to determine if AGW is significant – the length of the pause. The length of the pause should be proportional to the severity of the AGW. As it is, the pause is already close to long enough, if not already long enough to negate the possibility of CO2 caused CAGW. The EPA should NOT be enacting any CO2 regulations for at least the next ten years. If the pause lasts longer than 20 years, then that is very strong evidence that AGW is negligible, a TCS well under 1C. Right now it is a stretch to get TCS much more than 1C with the current data.
Also, since the climate modelers have assumed very small values for natural variation (in order to fit with Mann’s Hockey stick) there should have been no way that a TCS value of greater than 2C should have been able to allow for a pause more than a couple of years in the first place.
Too bad it snowed on Labor Day in northwest Wyoming down to 9,000 feet to ruin the story. Strange stuff this climate change.
“We’re not just talking a record high for the month of August…we’re talking a record high for any month during the satellite era.”
After over a decade of hearing and seeing bad science on effects of CO2 as GHG, bogus claims of AGW, absolute fabrications by IPCC, Faux Hockey Schtick, Tree Ring Circus, molested data, cherry picked results, Climate Change Alarmism, and blatant ties of AGW to political agendas; Pardon me if the story of Boy who cried Wolf comes to mind with any thing involving NASA/Government satellites and “data” from them.
Don’t blame us, Climatologists and GWers (Hansen, Mann, Gore), and those Scientists who failed to call them out are responsible for cries falling on deaf ears.
Darren Potter says: “Pardon me if the story of Boy who cried Wolf comes to mind with any thing involving NASA/Government satellites and “data” from them.”
The in situ data from buoys and ship inlets show the same thing, Darren. The following graph is of the North Pacific SST anomalies based on ICOADS data, which is the source data for the “non-satellite” ERSST.v3b data from NOAA and the HADSST3 data from UKMO:
Sorry, you can’t blame satellites.
Cheers
Seriously, ICOAD data from NOAA? Same group who has tweaked GHCN data by eliminating more Weather Stations located in colder regions vs. Weather Stations located in warmer regions? Same group who has tweaked GHCN data be eliminating more and more Weather Stations as time progressed? Same group who has ignored issues with poorly located Weather Stations due UHI? Same group who takes “Raw” weather station data, adds a warming bias to create “Official Adjust” data” instead of subtracting warming bias due to UHI. Same group who reports to same current Global Warming Alarmist Government NASA does?
Wolf, Wolf, Wolf, Wolf!
Are the graphs in this post based on this analysis (I Googled “Reynolds sea surface temperature” to find this)?
http://www.nhc.noaa.gov/aboutsst.shtml
If so then firstly it says “The actual areal coverage of the analysis and the anomally (sic) data is roughly between 60°S and 60°N globally”, so it doesn’t include the Arctic which according to Joe B. above has been exhibiting record low temperatures. What percentage of the earth’s surface / oceans is covered? I don’t have time to do the math, but it seems that calling the anomaly ‘global’ might be a bit inaccurate. If a part of the oceans outside the coverage is showing lower-than-average temperatures then one might expect a hotspot inside the coverage area to maintain the same global average temperatures.
Secondly the above-linked page says “The analysis uses buoy and ship data, satellite SST data, and SST’s simulated by sea-ice coverage. Before the analysis is computed, the satellite data is adjusted for biases using the method described by Reynolds (1988) and Reynolds and Marsico (1993).” So it’s not just satellite data.
I realise the graphs in this post may not be derived from the Reynolds “analysis” I linked to but that they may rather all derive from some common underlying dataset, but I am not clear whether or not this is the case, and I wonder if the points above about coverage, and non-satellite (and adjusted) data, still apply to the graphs in the post.
SJF says, “If so then firstly it says “The actual areal coverage of the analysis and the anomally (sic) data is roughly between 60°S and 60°N globally”, so it doesn’t include the Arctic which according to Joe B. above has been exhibiting record low temperatures.”
First, the graph from DMI that Joe Bastardi presented was not of Arctic sea surface temperature.
Second, the word “roughly” was used in the quote you provided. Seasonally, sea ice extends “roughly” to 60S and 60N, and if there’s sea ice, there’s no sea surface temperature data.
Here are last week’s maps of the daytime and nighttime AVHRR retrievals from the satellites used for the Reynolds OI.v2 data. They extend as far as the sea ice and that’s farther poleward than 60S and 60N.
http://www.emc.ncep.noaa.gov/research/cmb/sst_analysis/images/satcol.png
And while I’m providing links, here are the maps of the locations of the in situ measurements:
http://www.emc.ncep.noaa.gov/research/cmb/sst_analysis/images/inscol.png
Both of those maps are linked to this webpage about the Reynolds OI.v2 data:
http://www.emc.ncep.noaa.gov/research/cmb/sst_analysis/
SJF says, “So it’s not just satellite data.”
I never said it was “just satellite data”. I used the terms “satellite-enhanced sea surface temperature data” and “satellite era”.
Regards
Bob, in case it came across that way, my comment was not a criticism of your post, which as is usually the case I found to be careful and quite convincing. I was rather questioning (in the sense of I genuinely was not sure) some possible features of the Reynolds dataset which might further affect our certainty that there is cause for alarm.
Another very good article as usual, Bob. Thanks.
+++++++++++++++++++++++++++++
James Abbott,
Global warming has stopped. That is indicated in the numerous references to the “pause”, and the “hiatus”. They all mean the same thing: global warming has stopped. Deal with it. It’s a fact.
=============================
JohnWho says:
Not too be confused with the “half-vastness” of the Alarmist/Warmist belief.
Their beliefs are always half-vast.
I think it is interesting and a little alarming to see this huge change in temperatures over the last 2 – 3 years. There is to much rationalisation and clever interpretations in most of the comments, to get a deeper understanding of what happens. One question is if there is less cooling of the ocean surface, and what can cause that. Has there been changes in evaporation? Or is the sun over oceans brighter. It is a very interesting observation that the SST can change that much. Is it only the first mm or is it the first meters. If it is some meters deep in the ocean it is huge energies that is in play. For me it is more questions than answers.
So, global sea surface temperatures are at a record level and we’re not even having an El Nino.
We really are screwed.
Just to see how the sea surface temperature anomalies have gotten out-of-whack with ridiculous seasonality still embedded in the numbers, …
… here are the Northern Ocean anomalies 20N-90N (just going back to 2004 so it is more apparent).
http://s28.postimg.org/c3st9eiql/Northern_Oceans_20_N90_N.png
… and then the Southern Ocean anomalies 20S-90S.
http://s24.postimg.org/c02uq1y2d/Southern_Oceans_20_S90_S.png
Sorry, they are not supposed to look like this.
I think the reason for the higher SST in the North Pacific is the number of eastern Pacific tropical cyclones i heading more north this year rather than west. What does all this mean ? A cold winter again as the extra warm surface water and atmosphere disrupt the pattern of the Polar vortex forcing part of it again further south than normal and changing the jet stream pattern . A repeat of the 2013/2014 winter ? Cold winters lead to cooler spring and summer which lead to lower annual temperature anomalies which extend the pause to include 2015.
Bill ILLIS
Bob’s previous track updating the JULY 2014 SST anomalies showed both the Southern Oceans and Southern Pacific SST anomalies were declining .
I might add that the Eastern Pacific SST has been rising giving the Eastern Pacific Cyclones energy to move further north
dbstealey
You say
“Global warming has stopped. That is indicated in the numerous references to the “pause”, and the “hiatus”. They all mean the same thing: global warming has stopped. Deal with it. It’s a fact.”
Sounds like a mantra there.
But back to the article by Bob Tisdale, the data presented suggests otherwise. It shows record sea surface temperatures. The oceans hold vastly more heat energy that the atmosphere. Therefore, warming has not stopped. Its basic physics.
Bob Tisdale stated in his article – his words, not mine:
“With the apparent upward shift in the North Pacific sea surface temperature anomalies last year, and the early El Niño conditions this year, we’re looking at the possibility of record-high global sea surface temperatures for the year 2014”.
James,
You continually confuse global sea surface temperature with global temperature and global ocean temperature.
Sea SURFACE is only the SURFACE and is not reflective of the OVERALL temperatures of the oceans.
Also, if you pay ANY ATTENTION, you would know that global average temperature has been the same for the past 15-18 YEARS depending on which dataset you choose to use.
Now please go troll somewhere else.
On the one hand, it isn’t surprising to see an uptick in SST temps because the PDO recently shifted to positive significantly and because of the arctic minimum (which came again with unusual warm water around the arctic sea ice).
On the other hand, it’s just ridiculous how much the surface measurements (especially from NOAA) diverge from satellite measurements recently. The SST measurements from UAH, for example, isn’t even close to a new record:
http://www.climate4you.com/images/MSU%20UAH%20SST%20GlobalMonthlyTempSince1979%20With37monthRunningAverage.gif
I know that UAH measures the entire lower troposphere, but, to be honest: If the ocean temps were on record high and the temperatures in the middle troposphere were quite far away from any record, it would lead to more storm activity. But due to the recent hurricane/storm activity data contradicting my assumption, I would say that the SST measurements are either incomplete or complete nonsense (because of manipulation for example).
Please note that I am not a scientist (maybe I will be one in a few years) and, even when I know very much about climate and the AGW scammers, it is just my opinion of what the SST data represents.
PeterB in Indianapolis
I am not confusing anything and certainly not the parameters you raise, which if you had followed the whole thread you would have seen I did discuss air temperature.
Record high sea surface temperature is clearly significant and if you were paying any attention you would understand the physics of why that is the case.
James,
I have a degree in Chemistry, and I do understand physics quite well.
I am not sure of your understanding of the physics, however.
Record high sea surface temperature is NOT NECESSARILY significant. First of all, our records of sea surface temperatures are pitifully insignificant on geological time-scales, so we have no earthly idea of whether the current sea surface temperatures are in any way, shape, or form unusual or unnatural at all.
Since we have no real idea of whether current sea surface temperatures are even unusual, there is no way to assign any “significance” to them whatsoever.
Prove to me that over the past 1000 years (or better yet, 10,000 years) we have never had any occurrence of sea surface temperatures as high as the current ones, and then I will perhaps be willing to lend credence to the idea that the current temperatures have some “significance”.
Unfortunately, our records of sea surface temperature only go back about 43 years or so, and so, there is no way, other than hyperbole, to assign any “significance” to what is currently happening.
High pressure means clear skies, which means maximum sunlight. A blocking high which has persisted for over a year in the North Pacific would mean generally clear skies in that region for a very long period of time.
Clearly, one would naturally expect sea SURFACE temperatures in that region to be unusually warm (but they certainly aren’t unnaturally warm!).
Further, the existence of such a region of unusual warmth, especially in an area as large as the “North Pacific” is going to skew the average of all SST data higher, once again, naturally.
This has happened before (mid 1970s) and it will likely happen again in another 40 years or so.
For those of us who had to live through the winters of 1976 through 1980 in (for example) the Milwaukee, Chicago, or Minneapolis areas, we would prefer this DID NOT HAPPEN, because when the North Pacific SST anomaly goes strongly positive (especially in late Summer), the Winter temperature anomalies tend to go STRONGLY NEGATIVE in the “Upper Midwest”.
For example, the HIGH temperature projected for September 15th in Indianapolis is supposed to be 57F (or about 14C). This is WAY below normal for that time of year in the Indianapolis area, and it isn’t supposed to be a 1-day event either, it is supposed to last about 3 days due to a mid-September shot of “Polar Vortex”.
Nature makes adjustments for abnormally warm conditions in certain areas… it makes other areas abnormally cool.
PeterB in Indianapolis
Glad to read you have a degree in chemistry. I have a physics degree.
You are trying to sidetrack the issue by talking about past temperature records, which, agreed are of course less certain.
So lets be more specific. In the past 30 years, reference the data produced by Bob Tisdale in his article, currently global sea surface temperatures are at record levels, are clearly on an upward trend over those 30 years and 2014, according to Mr Tisdale, could well be a record warm year – for that period.
The reason this is significant – within that period of recording – is that the oceans hold vastly more heat energy than the atmosphere and are relatively slow to respond to external forcing compared to the atmosphere – thermal inertia. Water requires much more heat energy to warm it by 1C per unit mass than most other substances including the gases in the atmosphere – specific heat capacity.
So if the oceans are warming it means something is dumping heat energy into them. Not something 10,000 years ago, something now and in the recent past.
That heat dumping can be estimated. It is enormous and the only plausible explanation – unless you have another one of course – is that the increase in GHGs is leading to enhanced radiative forcing from the GHE which is warming the system and that much of increased heat energy is going into the oceans. Its actually no surprise whatsoever.
The interesting bit from a physics angle is the detailed reasons why we are seeing the pause in lower atmosphere temperatures.
But renewed warming of the atmosphere is inevitable if the oceans keep warming.
I hope that explains why it is significant.
One warm region, for one warm month, caused by one stationary High. Sounds like weather to me. What it doesn’t sound like is “global” or “climate”.