Yes, I’m using the term Mulligan as in a replayed golf shot. Ocean-atmosphere processes have consumed most of the warm water in the eastern equatorial Pacific from the downwelling (warm) Kelvin wave that had crossed the Pacific earlier this year. But we recently discussed and illustrated how a pool of subsurface warm water had broken off that Kelvin wave, returned west, and has now fed back into the western equatorial Pacific—priming the equatorial Pacific once again. (See Part 14 – Warm Water Recirculated?) With that recent “restocking” of warm water in the western equatorial Pacific, it looks like Mother Nature might be giving El Niño a second chance to develop this year.
This post provides an update on the progress of the evolution of the 2014/15 El Niño with data through the beginning of August 2014. The post is similar in layout to the May, the June and the July updates. The post includes 3 gif animations and 13 illustrations so the post might take a few moments to load on your browser. Please click on the illustrations and animations to enlarge them.
Included are updates of the weekly sea surface temperature anomalies for the four most-often-used NINO regions. Also included are updates of the GODAS map-based animations of sea surface height anomalies, T300 anomalies (depth-averaged temperature anomalies to 300 meters), sea surface temperature anomalies, and the cross sections of temperature anomalies at depth along the equator. These animations start in January 2014 for the full progress of this year’s event. Also included are a couple of graphs of the BOM Southern-Oscillation Index (SOI).
We compared the evolution of the 2014/15 El Niño to the 1982/83 and 1997/98 El Niños in a number of posts in this series, back when this El Niño was being compared to those two strong events. We don’t see those comparisons as often, but people may still expect to see the comparisons in my posts, so I’ve updated those graphs. And since we’ve been watching the downwelling (warm) Kelvin wave as it makes its way east along the equator in the Pacific, also included in this post are evolution comparisons using warm water volume anomalies and depth-averaged temperature anomalies from the NOAA TAO project website.
Then, we’ll take a look at a number of Hovmoller diagrams comparing the progress so far this year to what happened in 1982. We had been using 1997 as a reference, but we’re well past this year’s event coming anywhere close to the one in 1997, so I’ve switched to 1982, which was a late bloomer.
NINO REGION TIME-SERIES GRAPHS
Figure 1 includes the weekly sea surface temperature anomalies of the 4 most-often-used NINO regions of the equatorial Pacific. From west to east they include:
- NINO4 (5S-5N, 160E-150W)
- NINO3.4 (5S-5N, 170W-120W)
- NINO3 (5S-5N, 150W-90W)
- NINO1+2 (10S-0, 90W-80W)
As of last week, the sea surface temperature anomalies in the NINO4 and NINO1+2 regions were still elevated, while the NINO3 and NINO3.4 regions have dropped out of El Niño conditions, where El Niño conditions are defined as sea surface temperature anomalies equal to or greater than +0.5 deg C.

Figure 1
EL NIÑO EVOLUTION COMPARISONS FOR NINO REGION SEA SURFACE TEMPERATURE ANOMALIES
Using weekly sea surface temperature anomalies for two NINO regions, Figure 2 updates the comparisons of the evolutions of this El Niño with the 1982/83 and 1997/98 events. The NINO3.4 and NINO1+2 comparisons were originally provided in the post Part 3 – Early Evolution – Comparison with 1982/83 & 1997/98 El Niño Events. As a further reference, I’ve also included the evolutions of the two other years during which sea surface temperatures in the equatorial Pacific rose into El Niño conditions early in the year (1993 and 2012), but then failed to remain there and become an “official” El Niño. The evolutions in 1993 and 2012 were first presented in Part 11 – Is the El Niño Dying?

Figure 2
The weekly Reynolds OI.v2 data for Figures 1 and 2 are available through the NOAA NOMADS webpage here.
ANIMATION UPDATES
In the first post in this series, we discussed a number of animations of maps and animations of equatorial cross sections available from the NOAA Global Ocean Data Assimilation System (GODAS) website. Each cell of the animation is a 5-day (pentadal) average. Those animations ran from January 3rd to March 29th. The following are updates, again starting in January 3rd. GODAS only maintains their animations for 3 months. I’ve stored the maps since the first of the year and will continue to add maps as time progresses. That way we can watch the El Niño unfold from the beginning and then try to keep track of the warm water when El Niño is over.
Animation 1 provides the sea surface height anomalies and the depth-averaged temperature anomalies for the top 300 meters (T300) side by side. Again, please click on the animations to enlarge them.

Animation 1
Animation 2 is a similar side-by-side comparison, but on the left are maps of sea surface temperature anomalies and on the right are the H300 maps. The sea surface temperature maps trail the others by a pentad or two, which is why they do not run through July 2. My apologies for the shift in the color scaling for the range of +0.5 to +1.0 deg C in the sea surface temperature anomaly maps. That appears to be a quirk of my computer, not the GODAS website.

Animation 2
Animation 3 is an update of the cross sections of temperature anomalies at depth along the equator.

Animation 3
The new warm anomaly in the western equatorial Pacific is highlighted in Figure 3. It has strengthened in the past few weeks. If the anomaly works its way eastward with the Equatorial Undercurrent in the Pacific (the Cromwell current), as it should, then the anomaly will increase as it works its way to the east, because the subsurface waters in the east are normally cooler than they are in the west. And if more of the warm water that’s off the equator (just south of the equator in the western tropical Pacific as highlighted in Figure 4) is drawn into the equatorial undercurrent, there would be more subsurface warm water to help fuel an El Niño later this year. Yup, lots of ifs and shoulds and woulds in that.

Figure 3
# # #

Figure 4
EL NIÑO EVOLUTION COMPARISONS WITH TAO PROJECT SUBSURFACE DATA
The NOAA Tropical Atmosphere-Ocean (TAO) Project website includes data for two temperature-related datasets for the equatorial Pacific. See their Upper Ocean Heat Content and ENSO webpage for descriptions of the datasets. The two datasets are Warm Water Volume (above the 20 deg C isotherm) and the Depth-Averaged Temperatures for the top 300 meters (aka T300). Both are available for the:
- Western Equatorial Pacific (5S-5N, 120E-155W)
- Eastern Equatorial Pacific (5S-5N, 155W-80W)
- Equatorial Pacific (5S-5N, 120E-80W)
Keep in mind that the longitudes of 120E-80W stretch 160 deg, almost halfway around the globe. For a reminder of width of the equatorial Pacific, see the protractor-based illustration here.
In the following three graphs, we’re comparing data for the evolution of the 2014/15 El Niño so far (through month-to-date August 2014) with the data for the evolutions of the 1982/83 and 1997/98 El Niños. The Warm Water Volume data are the top graphs and the depth-averaged temperature data are the bottom graphs. As you’ll see, the curves of two datasets are similar.
Let’s start with the Western Equatorial Pacific (5S-5N, 120E-155W), Figure 5. The warm water volume and depth-averaged temperature data show the Western Equatorial Pacific had slightly less warm water or was slightly cooler this year than during the opening months of 1997. But 2014 had more warm water or was warmer than 1982. The warm water volume and temperature to depth in the west dropped as the Kelvin wave carried some water east, but it has since rebounded.

Figure 5
In the second post in this series, we showed that the ocean heat content for the entire eastern tropical Pacific (24S-24N, 180-80W), for the depths of 0-700 meters, was cooler before the start of the current El Niño than it was in before the start of 1997 El Niño. (See the graph here.)
Returning to the TAO Project data, the warm water volume and depth-averaged temperature data shown in Figure 6 for the eastern equatorial Pacific also show lower values in 2014 than in 1997. This year, the eastern equatorial data both rose, a result of the Kelvin wave carrying warm water from the West Pacific Warm Pool to the east. Most of that warm water in the east has now been consumed, released to the atmosphere through evaporation or distributed away from the equator.

Figure 6
As a result, across the entire equatorial Pacific, Figure 7, warm water volume is lower and depth-averaged temperatures are less in 2014 than they were in 1997. Then again, they’re higher than they were in 1982. For this year, the warm water initially increased across the entire equatorial Pacific, as warm water from off the equator circulated to the equator. Then the warm water decreased as it evaporated or was redistributed from the equator.

Figure 7
We’re still waiting for update of the NODC ocean heat content data. It will be interesting to see what effect this off-season El Niño has had on the ocean heat content of the tropical Pacific. Did it drop as a result of this off-season El Niño? We’ll have to wait for their April-June 2014 update, which should be available in August or September.
SOUTHERN OSCILLATION INDEX (SOI)
The reasons an El Niño did not continue to form this year in response to the Kelvin wave are well established. First, the atmospheric component of ENSO, the “SO” part, refused to cooperate. That is, the trade winds in the western equatorial Pacific did not weaken as expected to help reinforce the El Niño development. (The other reason, of course, was the upwelling (cool) Kelvin that formed in the wake of the downwelling (warm) Kelvin wave, the latter of which had everyone so excited earlier this year. That trailing cool Kelvin wave has now helped to counteract the warm Kelvin wave.)
The Southern Oscillation Index (SOI) from Australia’s Bureau of Meteorology is another widely used reference for the strength, frequency and duration of El Niño and La Niña events. We discussed the Southern Oscillation Index in Part 8 of this series. It is derived from the sea level pressures of Tahiti and Darwin, Australia, and as such it reflects the wind patterns off the equator in the southern tropical Pacific. With the Southern Oscillation Index, El Niño events are strong negative values and La Niñas are strong positive values, which is the reverse of what we see with sea surface temperatures. The July 2014 Southern Oscillation Index value is -3.0, which is still well within ENSO-neutral conditions. The BOM threshold for El Niño conditions is an SOI value of -8.0, so there’s a long way to go. Figure 8 presents a time-series graph of the SOI data.

Figure 8
The top graph in Figure 9 compares the evolution of the SOI values this year to those in 1982 and 1997, the development years of the strong 1982/83 and 1997/98 El Niños. The Southern Oscillation Index this year is lagging well behind the values in 1982 and 1997. Because the SOI data is so volatile, I’ve smoothed them with a 3-month filter in the bottom graph.

Figure 9
For those of you interested in keeping a closer eye on the BOM Southern Oscillation Index, see the BOM Recent (preliminary) Southern Oscillation Index (SOI) values webpage. For the past month, the 30-day running-average of the SOI has been cycling in the -1.5 to -8.0 range, never quite reaching into El Niño conditions.
COMPARISONS OF HOVMOLLER DIAGRAMS OF THIS YEAR (TO DATE) WITH 1982
In past updates, in the following Hovmoller diagrams, I’ve used the development of the 1997/98 El Niño as a reference for this year’s El Niño. That now seems to be overkill, because the feedbacks never kicked in this year…where all of the feedbacks freakishly aligned for the 1997/98 El Niño. The 1982/83 El Niño was a late bloomer; that is, it didn’t really start to take off until later in the year, and it was a very strong El Niño too. So I’ve switched reference years for this post.
Hovmoller diagrams are a great way to display data. If they’re new to you, there’s no reason to be intimidated by them. Let’s take a look at Figure 10. It presents the Hovmoller diagrams of thermocline depth anomalies (the depth of the isotherm at 20 deg C) with 2014 on the left and 1982 on the right. GODAS, unfortunately, furnishes the illustrations (not the data) in different dimensions for the two years. The vertical (y) axis in both is time with the Januarys for both years at the top and Decembers at the bottom. The horizontal (x) axis is longitude, so, moving from left to right, we’re going from west to east…with the Indian Ocean in the left-hand portion, the Pacific in the center and the Atlantic in the right-hand portion. We’re interested in the Pacific. The data are color-coded according to the scales below the Hovmollers.

Figure 10
Figure 10 is presenting the depth of the 20 deg C isotherm along a band from 2S to 2N. The positive anomalies, working their way eastward since the beginning of 2014, were caused by the downwelling Kelvin wave, which pushes down on the thermocline (the 20 deg C isotherm). You’ll note how the anomalies grew in strength as the Kelvin wave migrated east. That does not mean the Kelvin wave is getting stronger as it traveled east; that simply indicates that the thermocline is normally closer to the surface in the eastern equatorial Pacific than it is in the western portion.
Figure 11 presents the 2014-to-date and 1982 Hovmollers for wind stress (not anomalies) along the equator. The simplest way to explain them is that they’re presenting the impacts of the strengths and directions of the trade winds on the surfaces of the equatorial oceans. In this presentation, the effects of the east to west trade winds at various strengths are shown in blues, and the reversals of the trade winds into westerlies are shown in yellows, oranges and reds.

Figure 11
The two westerly wind bursts shown in red in the western equatorial Pacific in 2014 are associated with the downwelling Kelvin wave, and the westerly bursts in March and May 1982 are associated with the Kelvin wave that year. (See the post ENSO Basics: Westerly Wind Bursts Initiate an El Niño.) Note how in 1982, as the June progressed through December, the negative wind stresses decreased (associated with a weakening of the trade winds), with the neutral whites expanding eastward. Also note the repeated westerly wind bursts in the western equatorial Pacific from June through November, with the big one in November 1982. Those westerly wind bursts throughout 1982 continued to help push warm water from the western equatorial Pacific into the east, strengthening the 1982/83 El Niño.
Figure 12 presents the Hovmollers of wind stress anomalies…just a different perspective. Note how there were more positive wind stress anomalies in the western equatorial Pacific in 1982 than there have been so far this year.

Figure 12
And Figure 13 presents the Hovmollers of sea surface temperature anomalies. Unfortunately, the Hovmoller of sea surface temperature anomalies is delayed a few weeks…thus the purplish line in 2014. But as we’ve seen in the comparison graphs in Figure 2, the sea surface temperature anomalies of the NINO3.4 region in 2014 are well behind those of 1982, and the sea surface temperature anomalies this year in the NINO1+2 region are in line with those in 1982. As you’ll note in the Hovmoller for this year, it didn’t take long for the La Niña conditions in the eastern equatorial Pacific to disappear. The El Niño conditions also disappeared as quickly.

Figure 13
CLOSING NOTE
I’m in the process of preparing a post about the apparent 2013 climate shift in the Pacific and its impacts on global sea surface temperatures.
EARLIER POSTS IN THIS SERIES
- The 2014/15 El Niño – Part 1 – The Initial Processes of the El Niño.
- The 2014/15 El Niño – Part 2 – The Alarmist Misinformation (BS) Begins
- The 2014/15 El Niño – Part 3 – Early Evolution – Comparison with 1982/83 & 1997/98 El Niño Events
- The 2014/15 El Niño – Part 4 – Early Evolution – Comparison with Other Satellite-Era El Niños
- The 2014/15 El Niño – Part 5 – The Relationship Between the PDO and ENSO
- The 2014/15 El Niño – Part 6 – What’s All The Hubbub About?…
- The 2014/15 El Niño – Part 7 – May 2014 Update and What Should Happen Next
- The 2014/15 El Niño – Part 8 – The Southern Oscillation Indices
- The 2014/15 El Niño – Part 9 – Kevin Trenberth is Looking Forward to Another “Big Jump”
- The 2014/15 El Niño – Part 10 – June 2014 Update – Still Waiting for the Feedbacks
- The 2014/15 El Niño – Part 11 – Is the El Niño Dying?
- The 2014/15 El Niño – Part 12 – July 2014 Update – The Feedbacks Need to Kick in Soon
- The 2014/15 El Niño – Part 13 – More Mixed Signals
- The 2014/15 El Niño – Part 14 – Warm Water Recirculated?
And for additional introductory discussions of El Niño processes see:
- An Illustrated Introduction to the Basic Processes that Drive El Niño and La Niña Events
- El Niño and La Niña Basics: Introduction to the Pacific Trade Winds
- La Niñas Do NOT Suck Heat from the Atmosphere
- ENSO Basics: Westerly Wind Bursts Initiate an El Niño
FURTHER READING
My ebook Who Turned on the Heat? goes into a tremendous amount of detail to explain El Niño and La Niña processes and the long-term aftereffects of strong El Niño events. Who Turned on the Heat? weighs in at a whopping 550+ pages, about 110,000+ words. It contains somewhere in the neighborhood of 380 color illustrations. In pdf form, it’s about 23MB. It includes links to more than a dozen animations, which allow the reader to view ENSO processes and the interactions between variables.
I’ve lowered the price of Who Turned on the Heat? from U.S.$8.00 to U.S.$5.00. A free preview in pdf format is here. The preview includes the Table of Contents, the Introduction, the first half of section 1 (which was provided complete in the post here), a discussion of the cover, and the Closing. Take a run through the Table of Contents. It is a very-detailed and well-illustrated book—using data from the real world, not models of a virtual world. Who Turned on the Heat? is only available in pdf format…and will only be available in that format. Click here to purchase a copy. Thanks. (I also am very happy to receive tips or donations.)
Three or four days ago I would have agreed with you but in the past two days the trade winds are picking back up again. The winds are just about completely nominal from 100W to 180 and now only a slight slackening from 180 to 140E. Still looks like a continued “La Nada” to me.
crosspatch, it’ll take a while for that warm water to migrate eastward.
Mulligan is a good term for this: like a golf shot, there’s no way to be sure beforehand that the second shot will be any more successful than the first one.
Hey Bob,
Just wondering if you’ve ever consulted with the two Joe’s at WeatherBell. Their long range record with respect to forecasting these events has been superb. As I’ve mentioned before, they’ve been calling for a weak to perhaps moderate, “Modoki” type El NIno since late last winter, which given other factors at play argues strongly for another miserable winter season in the east and southern U.S. this year. They’ve been having lots of fun ridiculing the easily ridiculed climateers…now gone oddly quiet… who were clamoring for a “super El NIno” last spring, of course with no understanding of relevant climate dynamics whatsoever.
Thanks, Bob. Excellent GODAS movies.
This year’s alleged Super El Niño almost died for lack of warm water and is now trying to regroup and try again, much diminished.
I think El Niñito will be warming the South American Pacific Ocean tropical coast, we shall see what it does.
Since 15 years separated the Super El Niños of 1982 & 1997, Warmunistas got their hopes up for salvation from the dreaded “Pause” in 2012, 2013 & now again this year, all to be cruelly dashed by Mother Nature. Bob may yet prove right in expecting or not ruling out an El Niño later this year, but IMO should one develop, it will be mild to normal, not extremely super.
The PDO has flipped or is flipping, so the frequency of El Niños in general & especially of supers should drop in this & coming decades.
I call it echoes of Hansen 2006. Ocean heating by CO2 was supposed to provide a bigger El Nino than 1997. It is one more example, that settles the debate, that there is a lot they do not know about climate.
In my inexpert opinion, the El Nino looks weak and I would be surprised if there is any significant uptick in the Global Mean Temperature metric as a result.
Certainly the prophets of Super El-Nino doom have gone awfully quiet.
Sorry Bob I thought that was another name for stew.
But why do the Team IPCC ™ need a real El Nino?
After all the team motto seems to still be ;”Data that contradicts the Glorious Models, must be wrong”.
I was half expecting them to manufacture a simulated El Nino and then insist their model once again trumpets reality.
Of course without a break in the Pause in, when does it become the End of?
NOAA’s May 2014 Nino 3.4 CFSv2 ensemble forecast was for the 3.4 SST anomaly to about +0.8C by mid-August. It is actually at essentially 0.0 C.
http://www.cpc.ncep.noaa.gov/products/NMME/archive/2014050800/current/images/nino34.CFSv2.png
The June 2014 CFSv2 ensemble forecast was for Nino 3.4 SST to be at +0.6 C.
http://www.cpc.ncep.noaa.gov/products/NMME/archive/2014060800/current/images/nino34.CFSv2.png
The July 2014 CFSv2 ensemble forecast was for Nino3.4 to be at +0.3 for mid-August.
http://www.cpc.ncep.noaa.gov/products/NMME/archive/2014070800/current/images/nino34.CFSv2.png
And still the NOAA bravado continues and No admissions they’ve been dead wrong so far.
http://www.climate.gov/news-features/blogs/enso/details-august-7th-enso-discussion-how-has-forecast-changed
Based on the speed of the Jan – May/14 warm water, this new patch will take to mid-Nov to breach. Weaker than previous, pattern (?) suggests 0.5C rise, no El Nino. Right?
Where is observation saying patch will heat up?
I don’t know. Doesn’t look to me like there is a whole bunch of warm water to migrate.
http://www.bom.gov.au/climate/enso/sub-surf_anim.gif
I know a golfer who gets really angry with the golfers who use a Mulligan to get an extra shot.
Myself, I am more foregiving. But I also agree with the old expression that ” What’s good for the Goose is good for the Gander. ” So, if you get to have a Mulligan then you should be willing to give your opponents a Mulligan when they make a wrong prediction about future climate events.
That seems fair to me.
Thanks again Bob. I especially appreciate the graphs comparing this year with the “mulligans” in the past. I may never be an expert, but your tutorials make me feel like I can at least discuss El Ninos intelligently.
With a surname of Mulligan – I resemble that headline!
Seriously though, thank you for another fascinating article.
I’m always drawn to the fact that despite Bob’s obvious expertise and the ‘lateness’ of the year – the real answer, is still, we don’t know.
It’s that kind of outcome, I guess, that has always kept me firmly in the sceptic (or more correctly, realist) camp.
Thanks Bob (and Anthony et al)
I don’t think there is enough energy in the re-gathering warm pool to drive an El Nino.
New climate term eh? El Mulligan!
Seems Mulligans are rampant in the climate change industry, so why not…..
Since we are talking anomaly at 150m and deeper, how warm, in fact, is this water. It may be 2C above what it should be at 150m but this same water would be rather tepid at the surface, wouldn’t it?
Thank you Mr. Tisdale. Another excellent teaching aid.
Bob,
Thanks. Your work is among the best in climate science.
A question for those who track things. I have watched the Ocean Page here for some time (think in terms of years, not months), especially the animation that includes the ‘7 day forecast’ at the end. It seems to me that, almost uniformly, every time this animation gets to that forecast part it forecasts warming, sometimes substantial. Obviously I don’t have hard data on this, but If anyone out there has been keeping track, is this real or just a fignewton of my imagination? It is especially apparent in the NRL Global SST 30 day animation, both in the western equatorial pacific and in Arctic north of the bering strait.
For the kajillionth time. an enso event similar to 02/03 09/10 is on the way.. centered in the central Pacific, and one that will likely give the US a cold snowy winter in the south and east relative to averages….IMO
@Joseph Bastardi – How cold? Snow I can take. Polar blasts are different.
More charts …
http://s21.postimg.org/4p3cid5lh/Indices.png (338K)
http://s21.postimg.org/oifgb2iz9/Troup_SOI.png (93K)
http://s21.postimg.org/7gmm8z445/Pressures.png (42K)
Click on image in browser to enlarge.
Given the above I suspect the “Mulligan” will turn into a Muff.
😉
Makes me wonder if Tren[d]b[r]e[a]th suffers from depression.
If so that would explain his “kill all the human race” instrumentality.
In his mind, he can accomplished his wish by killing himself.
And if so facto it is a sad fact of the Tren[d]b[r]e[a]th.
Such a species not long for our world.
Someone please, please correct me if I’m wrong, but my reading is that we’re likely to have a weak El Nino this winter — enough to end the CA drought, but not enough to end the “hiatus.” The weak El Nino is what Prof. Cliff Mass, of the U of Washington, tentatively predicted several months ago, with the proviso that no one would really know very much before mid- to late summer.
Bill Illis says:
August 12, 2014 at 5:45 pm
I agree, but we’ll see. I’d be surprised if come Christmas, there’s a warm baby boy off the coast of Peru.
I’m very suspicious of the confusion about warm water and a anomalously warm water at depth. In my experience every where that I have been the water is largely cooler at depth and often a lot cooler. So a very anomalously warm pool of water at depth is very likely cooler than the surface water.
In addition warm water at surface is often only a thin layer, so from an energy content perspective the top few meters may have a lot more energy than the atmosphere above but the 1000’s of meters of cooler water below dominates the energy total.
We have satellites that can calculate the atmospheric energy content quite accurately they say, and the satellites can also quite accurately determine the very near surface water temperature but from there we are into limited data territory and models.
Pretty red plumes are not all tropical beach water!
“I don’t think there is enough energy in the re-gathering warm pool to drive an El Nino.”
And the temperature gradient is still “wrong”. Lots of warm water in the Western Pacific. Nonetheless, NOAA models are strongly predicting El Nino. Half the BOM models are predicting El Nino, and the other half neutral.
Bob, the Kelvin wave keeps getting forced to the surface by upwelling deep water in the eastern Pacific right where ninos are supposed to form. All of the work is “currently” coming from the Humboldt current. A bunch of the residual Kelvin warm water has flowed north in the absence of a strong California current.
This is a “wrong” scenario because the “Hawaiian High” is supposed to create a strong California current in the northern hemisphere summer and defer to “Aleutian lows” in the winter. Ain’t happened lately. For some reason the Hawaiian high has been strong in the winter and the Aleutian lows have pestered us all summer. When there has been a ridge offshore the western US the monsoon has followed it like mildew, possibly because water vapor is lighter than dry air?
So is it that cold air persistently digging into the central Pacific allows the warm water north when Kelvin bestows it, and this warm water sabotages the ridges with monsoon when they do form?
Anyway there is still time before nino season. I submit that the best analogues would be not 1997 and 1982 but those that occurred about 1946 and 1957.
An American Alarmist traveled to Scotland to play some golf with a Scotish Sceptic. After a particularly bad drive the American reached into his pocket pulled out a second ball and laced a perfect drive down the middle of the fairway. He looked at his Scotish friend and said “In the States we call that a Mulligan, What do Scotsman call it here?” the Scotish Sceptic quickly replied, “We call it a Three”.
I like a Milligan better. This could be translated as a “stupid funny statement” -see here for the founder http://en.wikipedia.org/wiki/Spike_Milligan. Hopefully apt as he influenced the late Robin Williams. The Ying tong song would fit AGW
As many claims as have been made by as many people (each one seemingly different), maybe we shouldn’t call it a “Mulligan”, maybe a “Gilligan”
And I don’t mean that in disrespect to Mr. TIsdale or Mr. Bastardi, I mean that to the bazillions of people (including myself) who all seem to have a different notion. It’s going to be what it is and in my opinion it will be up to the trades to decide.
Jake J says:
August 12, 2014 at 7:48 pm
========================================
This is speculative, but it could well be that California is going to see the rain come in late winter and early spring.
Why not be a hurricane in the Atlantic?
http://earth.nullschool.net/#2014/08/17/0600Z/wind/isobaric/250hPa/orthographic=-26.73,0.98,481
Or typhoons will bypass Hawaii?
http://earth.nullschool.net/#2014/08/17/0600Z/wind/isobaric/850hPa/orthographic=-106.06,6.47,481
So far the 2014 el Nino has been the smallest el Nino EVAH. Must be global warming wot dunnit.
The last-gasp pimple of an el Nino that might appear at the end of the year will serve only to “prime the pump” to give a strong La Nina cooling in the first half of 2015 – similar to the La Nina of 2007-2008 that also followed a period of near neutrality.
Sea temperatures seem to proceed in 8-year jumps. We should be near the end of one now thus my prediction of the early 2015 La Nina.
pokerguy says: “Just wondering if you’ve ever consulted with the two Joe’s at WeatherBell.”
Joe Bastardi has commented on earlier threads about the 2014/15 El Nino here at WUWT.
Gary Pearse says: “Since we are talking anomaly at 150m and deeper, how warm, in fact, is this water. It may be 2C above what it should be at 150m but this same water would be rather tepid at the surface, wouldn’t it?”

It depends where it reaches the surface, due to the subsurface temperature gradient from east to west across the equatorial Pacific. Here’s the GODAS climatology for August.
Bill Treuren says: “I’m very suspicious of the confusion about warm water and a anomalously warm water at depth. In my experience every where that I have been the water is largely cooler at depth and often a lot cooler. So a very anomalously warm pool of water at depth is very likely cooler than the surface water.”
See reply to Gary Pearse above.
Jake J says: “Someone please, please correct me if I’m wrong, but my reading is that we’re likely to have a weak El Nino this winter — enough to end the CA drought, but not enough to end the ‘hiatus.'”
If an El Nino forms, big if, I wouldn’t bet on it ending the drought conditions in California.
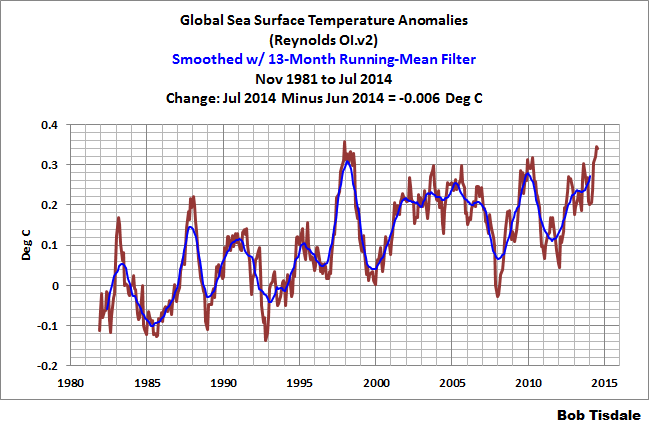
Additionally, global sea surface temperature anomalies are at record high levels as a result, primarily, of the elevated sea surface temperatures in the extratropical North Pacific and secondarily as a result of the off-season El Nino conditions.
Thanks Bob. I learn a lot here.
Bob…..As I look at the chart posted above, Global Sea Surface Temperature Anomalies, I notice that the sea temp is close to the temps around 1998, when we had what many consider our hottest year. Why then, are we not seeing a rise in temps like we did then? Is it just a lack of an El Nino that keeps the temps from spiking? Or, are we “leveled out”? I know this may have been covered many times on this site, but I’m still getting my feet wet here.
All it means is that the heat that has taken years to build up with such an active sun is now escaping to space in a very short period of time.
It means more cooling methinks.
Kenny, to understand why global sea surface temperature anomalies show little warming after 1997/98, we need to show why they warmed beforehand. But we can’t look at global data to do that. We have to divide the global oceans into logical subsets. And we can use a trend map to identify the subsets.

http://bobtisdale.files.wordpress.com/2014/05/01-trend-map.png
The additional warming of the surface of the North Atlantic (more than twice as fast as the rest of the global oceans) is a result of the Atlantic Multidecadal Oscillation, so we can put it aside for now, because it stopped warming about a decade ago.
The East Pacific data…
…on the other hand, shows little warming during the satellite era. That leaves us with the sea surface temperature data for the South Atlantic, Indian and West Pacific Oceans:
And it warmed in steps in responses to the strong El Niño events of 1986/87/88, and 1997/98, and 2009/10.
A strong El Niño can release a tremendous volume of sunlight-created warm water from beneath the surface of the western tropical Pacific. While it’s below the surface, that warm water is excluded from the surface temperature record. During and after the El Niño, the warm water is included in the surface temperature record. The end result: instant global warming in response to strong El Niño events.
We see the warm water temporarily in the East Pacific data; thus the large swings in surface temperatures there and no long-term trend. But the warm water discharged by the El Niños takes up long-term residence on the surfaces of the South Atlantic, Indian and West Pacific oceans, which causes the upward shifts.
I provided a more detailed overview of this in my free illustrated essay “The Manmade Global Warming Challenge”:
http://bobtisdale.files.wordpress.com/2013/01/the-manmade-global-warming-challenge.pdf
Cheers.
Additionally, global sea surface temperature anomalies are at record high levels as a result, primarily, of the elevated sea surface temperatures in the extratropical North Pacific and secondarily as a result of the off-season El Nino conditions.
I understand the sentence, but how does it affect the understanding of what’s going on? Can you help me interpret it? Bob, you give a lot of data — which is great — but sometimes the context and interpretation is too thin for the non-specialists in the room.
I’m hoping for at least a modest El Nino, we so badly need the moisture here in California. While one must accept the harsh realities of the Negative PDO (which means a dry tendency here) El Nino helps to mitigate such realities.
Jake J, I have a post in the works about the elevated sea surface temperatures in the North Pacific. I should be posting it by Friday.
Cheers.
I’m fairly new to much of this and love learning about it, or atleast trying to. These updates are awesome.. One thing I’d like to see, is the comparison between this years El nino and the 2009/2010 one as well. The ’82/83 and ’97/98 events are considered strong el nino events, it would be interesting to compare this years events to some of the more moderate events. Just for offering a bit of a different perspective
Bob, you’re a star.
I am in Jakarta and everyone is mentioning the unseasonable rain during what is supposed be the cool time of year. This is the time of year when the biofuel projects set fire to the jungle to plant oil palms. The gasp/hack/cough brown haze of Singapore is the direct result of European CDM projects designed to offset AGW. It is obviously working.
Why is it so cool and soaking wet in dry season in Western Indonesia?
gymnosperm on August 12, 2014 at 9:46 pm
Bob, the Kelvin wave keeps getting forced to the surface by upwelling deep water in the eastern Pacific right where ninos are supposed to form. All of the work is “currently” coming from the Humboldt current.
Didn’t you get the memo? We’re not supposed to talk about east Pacific deep upwelling. ENSO is sbout wind only. The ocean is a passive puddle reacting in reak time to wind and sun. It has no memory.
/sarc off
Bob Tisdale says:
August 13, 2014 at 8:57 am
That’s as close as I’ve ever read you come to stating what you consider the cause of ENSO, PDO & AMO fluctuations. I’d appreciate your elaborating on the solar contribution to these, for want of a better term, cycles. Thanks.
Ryan J says: “The ’82/83 and ’97/98 events are considered strong el nino events, it would be interesting to compare this years events to some of the more moderate events….”
Ryan J, see the 4th installment of the series:
http://bobtisdale.wordpress.com/2014/04/17/the-201415-el-nino-part-4-early-evolution-comparison-with-other-satellite-era-el-ninos/
milodonharlani says: “That’s as close as I’ve ever read you come to stating what you consider the cause of ENSO, PDO & AMO fluctuations. I’d appreciate your elaborating on the solar contribution to these, for want of a better term, cycles. Thanks.”
I’ve been presenting that discussion and documenting it with data for more than 5 years. (BTW, I didn’t mention the PDO in that comment.)
Solar contribution? As in correlation of ENSO and AMO with the solar cycle? I’ve never seen any credible evidence of it.
ENSO is fueled by sunlight, though. La Ninas recharge the warm water released by the preceding El Ninos by reducing cloud cover over the tropical Pacific. And ENSO varies the temperature of the North Atlantic by varying cloud cover…a lagged decrease in cloud cover over the North Atlantic in response to El Nino events according to Trenberth, so a period when El Ninos dominated would contribute to the warming phase of the AMO.
Regards
Bob Tisdale says:
August 13, 2014 at 6:00 pm
What I haven’t seen despite repeated requests here is an explanation of what you consider drives the multi-decadal, centennial & millennial scale variability in the ENSO, PDO, AMO & other oceanic oscillations. That you didn’t mention PDO surely doesn’t mean that you think there is no connection between the phases of the PDO & frequency & magnitude of ENSO events, does it?
I’m surprised you haven’t seen the numerous studies linked here showing strong solar cycle influence on the ENSO itself & the weather & climate events connected with it. The connection has been recovered in so many studies that this one had to comment on the lack of correlation it recovered:
http://journals.ametsoc.org/doi/abs/10.1175/JAS-D-11-0277.1
I’m surprised that in your years of studying ENSO you have encountered no studies linking that oscillation with solar cycles. I haven’t been able to avoid them in my reading of the relevant literature, both direct effect & modulatory. A sampling of a few recent ones:
Influences of the 11-year solar cycle on the tropical atmosphere and oceans
http://www.google.com/url?sa=t&rct=j&q=&esrc=s&source=web&cd=2&ved=0CCwQFjAB&url=http%3A%2F%2Fwww.mpimet.mpg.de%2Ffileadmin%2Fpublikationen%2FReports%2FWEB_BzE_113.pdf&ei=UA3sU-2QK6irigK14IDoCA&usg=AFQjCNGvjssywFooZV6HnD56k07s5bbAzw&sig2=Vv7c8f5pYrRrsHVSOyfLIw&bvm=bv.72938740,d.cGE
Solar Activity Controls El Niño and La Niña
http://www.john-daly.com/sun-enso/sun-enso.htm
Solar cycle modulation of the ENSO impact on the winter climate of East Asia
http://onlinelibrary.wiley.com/doi/10.1002/jgrd.50453/abstract
Meehl’s work on Pacific amplification of solar cycle effects:
http://www.google.com/url?sa=t&rct=j&q=&esrc=s&source=web&cd=4&ved=0CEMQFjAD&url=http%3A%2F%2Fwww.swpc.noaa.gov%2Fsww%2Fsww11%2FSWW_2011_Presentations%2FFri_1030%2FSolar.April.2011.ppt&ei=UA3sU-2QK6irigK14IDoCA&usg=AFQjCNFBWXryVJsHmGqwcZp41Xcb-vq8Jg&sig2=IS2SLwJ54wqn35JSayZjUg&bvm=bv.72938740,d.cGE
It also apparently works the other way, too. ENSO mediates solar effects:
http://hockeyschtick.blogspot.com/2013/01/paper-finds-el-nino-acts-as-mediator-of.html
IMO all of these & others have been linked on this blog, maybe more than once.
Ryan J says:
“The ’82/83 and ’97/98 events are considered strong el nino events, it would be interesting to compare this years events to some of the more moderate events….”
If you are looking for historic analogies, my estimation is that 2015 and 2016 will look a lot like 2007 and 2008 (La Nina).
milodonharlani says:
August 13, 2014 at 6:25 pm
Bob Tisdale says:
August 13, 2014 at 6:00 pm
What I haven’t seen despite repeated requests here is an explanation of what you consider drives the multi-decadal, centennial & millennial scale variability in the ENSO, PDO, AMO & other oceanic oscillations. That you didn’t mention PDO surely doesn’t mean that you think there is no connection between the phases of the PDO & frequency & magnitude of ENSO events, does it?
Personally I’m dubious that ENSO is driven directly by solar variations or anything else. However I certainly accept that solar cycle does deliver an important cyclical signal to all climate systems and one ignores this at one’s peril. Thus my view is that a solar driver may well exist but it is complex and nonlinear, not simple and linear. A promising paper on this is:
http://onlinelibrary.wiley.com/doi/10.1029/2008GL034831/pdf
With claims of solar forcing one needs to be careful to be on solid ground, not just eyeball-wiggle matching, or else Willis Essenbach could drop by and trash the notion by demonstrably failing to replicate a correlation. However such testing by Willis in the past has not included the nonlinear methods in the above paper which I believe is the direction in which one should be looking.
Bob Tisdale has stated many times his view – which I share also – that ENSO is a nonlinear oscillator (e.g. delayed oscillator) and thus has its internal dynamic and is not passively forced from outside – at least not directly in a linear way. Many in the solar “peleton” make the flawed assumption of passivity of the oceans and the climate (they are one and the same) to cyclic forcing by either CO2 or solar changes. The oceans/climate are NOT passive. They exert their own internal dynamic which dominates climate change. The only route available for “forcing” of climate by the agent of your choice (CO2, solar etc.) is weak forcing of a nonlinear chaotic oscillatory system.
phlogiston says:
August 14, 2014 at 4:10 am
The parameters of the oscillator, ie the frequency & magnitude of its fluctuations & where they occur, ultimately depend upon the energy fed into the system. More clouds, less insolation at the surface, but also more radiant energy “trapped”. More UV rays & less visible & IR light, the higher the energy state of the system. More ozone, less UV. It doesn’t explain much, if anything at all, simply to observe oceanic oscillations. They do themselves affect climate, of course, but science should be trying to figure out what causes or at least modulates the oscillations in the first place.
The “modern” ENSO has been in effect all during the Pleistocene, since the closure of the Isthmus of Panama. During glacials, naturally enough, ENSO is more sluggish, lower in frequency & weaker in strength. It is subject to the same orbital mechanical cycles as other climatic & hydrological phenomena.
https://www.sciencemag.org/content/291/5508/1511?cited-by=yes&legid=sci;291/5508/1511
I would quibble with the phrase “interannual climate”, since annual fluctuations are weather, not climate. If by interannual the authors mean comparing different periods of three or more decades, then OK.
I like the study you link, too, but Willis rejects out of hand solar cycle-supporting papers which rely upon modeling.
milodonharlani says:
August 14, 2014 at 8:27 am
phlogiston says:
August 14, 2014 at 4:10 am
…
The “modern” ENSO has been in effect all during the Pleistocene, since the closure of the Isthmus of Panama. During glacials, naturally enough, ENSO is more sluggish, lower in frequency & weaker in strength.
It would be interesting to look at data on ENSO during glacials, and find out if their reduced rate and strength were a result or a cause of the glacial cooling – or a bit of both.
I just opened the paper you linked – this looks interesting and does address ENSO during the last glacial – but its behind a paywall.
On the subject of chaos – I was reading on the web about current developments in superstring theory and came across something very exciting which confirmed a suspicion I formed a while ago that there could be some kind of link between string/superstring/multidimensional membrane theory and chaotic/nonlinear dynamics. String theory is all about geometry and shape. In contrast to the standard model which considers particles as mathematical points only. Well chaotic nonlinear pattern formation also sees exotic geometries appearing as if out of no-where, emergent structure with intuitively no cause. Perhaps chaotic patterns were revealing string geometries somehow (e.g. Calabi-Yao multidimensional manifolds). Anyway – now it seems that there could indeed be a link – in the form of non-commutative geometry.
Imagine an algebra in which xy does not equal yx. Or a geometry with no space. This is the exotic maths that was envisioned by French mathematician Alain Connes. It turns out that both superstring theory and dynamical nonlinear systems could be linked to noncommutative geometry.
http://en.wikipedia.org/wiki/Superstring_theory
with link to…
http://en.wikipedia.org/wiki/Noncommutative_geometry
whth link to…
http://en.wikipedia.org/wiki/Dynamical_systems
So an “organic” link between all three might be a possibility. Brian Greene in his book “The Elegant Universe” said that there was no reason on theory why strings should not expand to macroscopic size. Perhaps emergent chaotic/nonlinear patterns are connected with string geometries?
I doubt anyone will read this but I have to say it to get it out of my system and help me remember it later.
Bob
You might as well call this your final post on a possible 2014/2015 El Nino. I don’t think there will be one .. I originally thought that there was outside chance for a weak one, but now I see that the conditions are not there even for the 2002/2003 or 2009/2019 type of an EL Nino as J. Bastardi suggests
phlogiston says:
August 14, 2014 at 9:38 am
If you sign up for a free account, you can access the whole article here:
http://www.researchgate.net/publication/12108260_Variability_in_the_El_Nio-Southern_Oscillation_through_a_glacial-interglacial_cycle
Its figures are available here:
https://www.ncdc.noaa.gov/paleo/pubs/tudhope2001/tudhope.html
Hope these links help answer your questions.
milodonharlani on August 15, 2014 at 1:41 pm
Thanks
El Nino or not in 2014/15, it’s looking like a pretty safe bet that the next El Nino, whenever it finally shows up, will prelude new record global surface temperatures.
This low solar thing that David Archibald warned would plunge us all into global cooling doesn’t appear to be having much of an impact.