Allan MacRae says: Thanks to Alberta Jacobs
“Solar physicist Habibullo Abdussamatov predicts the current lull in solar activity will continue until about the middle of the 21st century and lead to a new Little Ice Age within the next 30 years.”
If this is true, then mankind is in for some very, very hard times. We have built our societies and infrastructure based on the mistaken belief that the climate could never return to that of the Little Ice Age but we might be very wrong in that. Feeding 7 Billion people in a little ice age will be demanding at best.
* Solar physicist Habibullo Abdussamatov predicts the current lull in solar activity will continue until about the middle of the 21st century and lead to a new Little Ice Age within the next 30 years.
_______________________
Any attempt to overlay even the most accurate solar cycle prediction onto the dynamic earth climate and then to predict an outcome, is akin to making a wild guess.
@Alan Robertson
Well, Alan, it’s just another piece to the jigsaw. Not sure if you’re being deliberately negative, but it’s interesting, and another dot to join.
I wonder what happens to comments that are not shown?
[They sit in the “To be Looked At” pool until a well-paid, handsome, over-vacationed, healthy, wealthy and infinitely wise moderator gets around to approving them. Since there aren’t any of those this week, the rest of us stumble across them as we get time and sign them in. .mod]
markstoval says:
August 11, 2014 at 12:18 pm
——–
Here in the US we pay farmers to not grow crops as well as paying them to grow crops for fuel.
There are also millions of acres that have allowed to go fallow because they couldn’t compete with richer farmlands in the mid-west.
“The Centennial Gleissberg Cycle (CGC) is a 90-100 year variation observed on the Sun, in the solar wind, at Earth and throughout the Heliosphere. The CGC is expressed as a systematic variation of the amplitude of the 11-year sunspot cycle. The reality of the CGC was a matter of some debate, but the very weak solar wind that occurred during the recent transition from solar cycle 23 to 24 followed by a low cycle 24 maximum sunspot number, strongly supports the concept. In this paper we demonstrate the strong similarities among the CGC minima observed at the beginnings of the 18th, 19th, 20th, and 21st century. These similarities support the notion that we are now experiencing a typical CGC minimum solar wind that is significantly different from the solar wind observed earlier in the space age. We suggest that the current CGC minimum may be implicated in producing some aspects of the unexpected observations at the heliosphere boundary reported at this conference.”
http://aspbooks.org/custom/publications/paper/484-0036.html
That this Gleissberg cycle is true, can be seen in the second curve here,
http://blogs.24.com/henryp/2012/10/02/best-sine-wave-fit-for-the-drop-in-global-maximum-temperatures/
where I had very good data from the Elmendorff weather station in Anchorage, going back to 1942.
Every place on earth is apparently on its own ca. 88 year curve depending on its specific composition TOA.
‘In Section 3.3we summarized the characterization of the CGC cycle minimum as a period of several years when galactic cosmic-ray fluxes are intense, geomagnetic activity is very low, mid-latitude auroras are rarely seen and high-latitude auroras are common. Figure 2 shows that the period of lowest geomagnetic activity during the 23/24 cycle can be identified as the time when the ring current index Dst is consistently close to zero i.e. from November 2005 until the present i.e. March 2011.
Record breaking cosmic-ray intensities were reported for a 1.5-year period during 2008 – 2010 (Mewaldt et al., 2010). A comparison of the cosmic-ray intensities over five solar minima showed that the estimates for late 2009 exceeded those in 1997 by 20% and those in 1965 and 1987 by about 40 percent. Most neutron monitors were also at record levels during 2009 (Ahluwalia and Ygbuhay, 2010).”
http://www.predsci.com/eswe-workshop/session2_9/The%20Sun%E2%80%99s%20Strange%20Behavior%20Maunder%20Minimum%20or%20Gleissberg%20Cycle.pdf
Groups of sunspot cycles do form longer centennial patterns characterised by about a century (~103 years) of longer and a century (~97 years) of shorter cycles.
Centennial SC pattern
Very recently I also found that the Maunder minimum, although did not have distinct sunspot cycles, spectral analysis of the cosmic rays modulation suggest strong 11 years magnetic cycles were present.
see http://wattsupwiththat.com/2014/08/06/recent-paper-finds-recent-solar-grand-maximum-was-a-rare-or-even-unique-event-in-3000-years/#comment-1706707
“Solar physicist Habibullo Abdussamatov predicts the current lull in solar activity will continue until about the middle of the 21st century and lead to a new Little Ice Age within the next 30 years.”
He is already falsified. His WAG depended on the last minimum having a low TSI http://www.leif.org/research/Abdussa1.png but since TSI did not show such a dip [it was an artifact in the PMOD dataset] and since TSI since then [blue trace on http://www.leif.org/research/Abdussa3.png ] has not decreased as extrapolated [‘predicted’ is too strong a word for this], there does not seem to be any basis for Abdussa’s claim.
I have identified the precise heliocentric planetary progression that causes solar minima. This minimum will be shorter like the last two, with the colder years roughly between the sunspot maxima of the first two weak cycles, e.g. 1807-1817, 1885-1896, and 2016-2024. The latter half of SC 25 will not be so cold, and SC 26 will be well past the grand minimum.
I would be pleased to demonstrate these findings to Anthony Watts when he is in the UK in September if he is interested.
SunSword says:
August 11, 2014 at 1:44 pm
However — is it the case that TSI correlates with solar wind and magnetic field strength? Because the magnetic field strength has been decreasing while TSI has not — correct?
It is a little bit more complicated than that. TSI basically correlates with the magnetic field at low latitudes [e.g. with the sunspot number] while the solar wind magnetic field at solar minimum basically comes out of higher latitudes, including the poles: http://www.leif.org/research/AMJ-100-Years-Polar-Fields.pdf
vukcevic says:
August 11, 2014 at 1:03 pm
Very recently I also found that the Maunder minimum, although did not have distinct sunspot cycles, spectral analysis of the cosmic rays modulation suggest strong 11 years magnetic cycles were present.
Vuk, this has been known for 20 years, e.g. http://www.leif.org/EOS/2009GL038004-Breggren.pdf
From a pure science standpoint, having an extended minimum would be very good for categorically testing the solar driven climate hypothesis. From the outside looking in, I think both sides of this argument make some good points but I don’t feel either side has enough data to slam the door on the other side (at least from the arguments / data I have seen presented). Perhaps an extended minimum could provide that data.
Leif Svalgaard says: August 11, 2014 at 2:09 pm
Vuk, this has been known for 20 years
Not exactly.
In your presentation
http://www.leif.org/research/Does%20The%20Sun%20Vary%20Enough.pdf
you quote 12.5 years (page 25), now you have a more accurate value, you are welcome to quote my finding of 11.4 years.
11.4 years with the amplitude of 9.3% is very close to number of cycles with the 11+ years periods.
Additionally I found (of almost equal amplitudes to the 11.5 year one)
two more periods that distinguish the Maunder Minimum epoch from the rest of the solar cycles progression and that was not known 20 years ago, actually was not known not until earlier this morning when it was announced on the WUWI blog.
These two additional periods within the GCR magnetic modulation, strictly specific to the Maunder Minimum are:
16,7 years at 8.5%
16 years is one of the three most prominent component of the Earth’s magnetic field (Jackson & Bloxham based on Jault Gire & LeMouel)
27.5 years at 8.2%
28 years is GCR modulation period quoted by Hiroko Miyahara (University of Tokyo), most likely a cross-modulation product between 5 and 21.3 years, the two other most prominent components of the Earth’s magnetic spectrum.
NZPete54 says:
August 11, 2014 at 12:38 pm
@Alan Robertson
Well, Alan, it’s just another piece to the jigsaw. Not sure if you’re being deliberately negative, but it’s interesting, and another dot to join.
________________
My intent was to comment on the reliability of long range climate predictions, especially since correlations of past climate response to solar influence fail at some point.
LIef …
“It is a little bit more complicated than that. TSI basically correlates with the magnetic field at low latitudes [e.g. with the sunspot number] “
Leif … explain this to me, because above just doesn’t jibe well to me. While TSI basically correlates with the sun spot number as you say, yet the % change in sun spots is magnitudes higher than that of TSI, which is what .. 0.1% or something.
It seems to me that the value of the TSI being set up at some 1360-something makes it a poor proxy for what ever in the heck is going on with the sun magnetically. As I said, sun spots go from 0 at minimum to anywhere from 50-200 at maximum. Those are big changes. Solar Wind changes are large as well. The aa index changes are huge comparatively .. YET .. TSI, has only changed 0.4% over the entirety of the temp rise since the Maunder Min. and varies 0.1% from min to min.
Climate guys have replaced Sun Spot numbers with TSI, but, IMO, they aren’t interchangeable, even if they do correlate with some sort of factor. I mean, a 50% change in sun spot number over several cycles, when pluged into a mathmatical formula is going to have a heck of lot bigger influence on the final product than will a 0.1% TSI change. I’m not saying I buy the solar gig, but IF the solar wind, or the aa index or something like that interacts with Climate, it would seem impossible to detect that using just the TSI, which is only a measure of w/m.
Dr. Deanster says:
August 11, 2014 at 5:00 pm
It seems to me that the value of the TSI being set up at some 1360-something makes it a poor proxy for what ever in the heck is going on with the sun magnetically. As I said, sun spots go from 0 at minimum to anywhere from 50-200 at maximum. Those are big changes. Solar Wind changes are large as well. The aa index changes are huge comparatively .. YET .. TSI, has only changed 0.4% over the entirety of the temp rise since the Maunder Min. and varies 0.1% from min to min.
The 1360-something comes from the nuclear furnace at the core of the Sun. The energy production there is very stable because the sun is so big. In addition to that, there are magnetic fields near the surface of the Sun. The phenomena caused by those vary with the sunspot number etc, but are still a very small part of the whole [the 0.1-0.2%]. In addition to the tiny, tiny magnetic changes, TSI changes some 70 W/m2 through the year due to the changing distance to the Sun. Here is an illustration of the changes: http://www.leif.org/research/TSI-through-a-year.png What you see is a full solar cycle [11 years] plotted such that all the January 1st,s are plotted on top of one another, all the Jan 2nd on top of each other, so all 365 days are plotted for each year. They look like a single curve because they all fall on top of one another [i.e.the Sun is very constant]. If you look VERY carefully you may see little wiggles now and then. They are major solar storms and give you a feeling for how insignificant hey actually are compared to the steady outpouring from the solar core.
It is the cyclic variation in sunspots and faculae that changes TSI. Dark sunspots decrease the total solar irradiance (TSI), while the bright structures called faculae increase it. The balance is towards increased TSI at maximum and decreased TSI at minimum as these two TSI opposing structures battle it out on the way up and down the cycle.
Chime in Leif. This is clearly not at my pay scale. Not even close.
Allan MacRae says: Thanks to Alberta Jacobs
The name is “Albert Jacobs”. The item comes from Albert Jacobs’ Climate Science Newsletter, issue CliSci # 176, second item at:
http://www.friendsofscience.org/index.php?id=771
This newsletter is emailed to the public about three times per month, then posted on the FriendsofScience.org website. This is one of three newsletter issued by the Friends of Science Society. http://friendsofscience.org/index.php?id=605
Regarding Leif’s link: http://www.leif.org/research/TSI-through-a-year.png.
I bet if you plot “Global Temperature” versus month, there would barely be a signal, within an order of magnitude of the irradiance that the earth sees. The earth must respond slowly to delta irradiance! There must be a cumulative effect. Of course the north and south hemispheres are radically different.
Leif’s “TSI through a year” graph is very impressive. What a succinct demonstration of the constancy of our sun!
(Yet, with something as immense and powerful – and close – as our sun, don’t the “tiny” variations represent an enormous delta in power? At least to this orbiting piece of rock we affectionately call home? I mean, if a billionaire’s stock portfolio changed by a mere single percent in an afternoon, it could represent more money made or lost than I will earn in my lifetime.)
Leif Svalgaard says:
August 11, 2014 at 5:15 pm
////////////////////////
I do not disagree with what you said, but you completely ignored Dr Deanster’s question. Since you very obviously know more about the sun than anyone else on this blog, it would be interesting to read your views on the point that he is postulating.
Should there be no warming, or indeed should there be some cooling, over the course of the next 15 to 20 years, and if the solar cycle(s) exhibit a low sunspot count, do you rule out that the sun may have played a role in the continuance of the pause (or cooling) on the basis that TSI will have remained ‘constant’ during that period? (when I say ‘constant’ I mean stayed within the the very small and usual variations that you have so often evidenced). .
Richard, I would be more interested in what amount of energy is needed to make a change in temperature trend. All temperature trends are based on weather, and weather systems are rather hard to change. They eat energy. What amount of solar change would there need to be in order to affect weather patterns? Think pushing the jet stream out of its present location and into another location. It would take a lot of energy to move something like that. Try moving a blocking high. Not easy. Imagine heating the oceans more than they are normally heated. That would take a LOT of energy. I don’t see change in any solar parameter having that kind of energy. Heck, the change in TSI from max in min isn’t enough so you have have to go beyond that. Can you imagine the panic in the streets to see a change greater than a sun full of spots or a sun rather blank? It would be news.
Leif Svalgaard says:
August 11, 2014 at 5:15 pm
Here is an illustration of the changes: http://www.leif.org/research/TSI-through-a-year.png What you see is a full solar cycle [11 years] plotted such that all the January 1st,s are plotted on top of one another, all the Jan 2nd on top of each other, so all 365 days are plotted for each year. They look like a single curve because they all fall on top of one another [i.e.the Sun is very constant].
But I understand from an earlier reply you made was that Top Of Atmosphere radiation over the day-of-year could be expressed in Excel terms by:
TOA =TSI*(1+0.0342*(COS(2*3.141*((H1-3)/365))))
Where TSI = 1362 for recent years. H1 = day of year.
Am I incorrect, or just not accurate enough?
Is there a better formula: The plot hits a low of 1320 at the end of July, and a high of 1420 watts/sec on the first week of January, neither of which matches the plot.
http://wattsupwiththat.com/2014/03/07/jli-final-forecasts-for-2014/#comment-1585141
I cannot make short term predictions of weather / temperature.
I can only make long term predictions – about 15- 20 years or more. 🙂
I wrote an article in the Calgary Herald published on September 1, 2002, which included this prediction of global cooling:
“If (as I believe) solar activity is the main driver of surface temperature rather than CO2, we should begin the next cooling period by 2020 to 2030.”
When I wrote this in 2002, SC 24 was predicted to be strong, and we now know it is quite weak.
I still think my 2002 global cooling prediction will materialize, although I wonder if this cooling will start a bit sooner than 2020.
Good people, if you must worry about something, worry about global cooling.
Bundle up!
Regards, Allan
____________________________________________________________
http://wattsupwiththat.com/2014/03/07/jli-final-forecasts-for-2014/#comment-1585378
To be clear, the serious work on the 2020-2030 global cooling forecast came from Paleoclimatologist Tim Patterson of Carleton University.
I was writing an article for the Calgary Herald and phoned Tim and said: “Tim, you and I both believe climate change is natural and cyclical, correct?” Tim immediately agreed. So I said “OK, when is it going to get colder?” He then said, with a pause of just a few seconds, “2020 to 2030”. I asked why, and he explained that he based his answer on his research into the Gleissberg Cycle, which is about 90 years long. I asked Tim if the ~60 year PDO cycle might be a better fit, but he preferred the Gleissberg.
If the PDO governs, then global cooling has probably already begun, but it will take a few more years to be sure.
I am increasingly convinced that CO2 is utterly irrelevant as a driver of global temperature. Wait ten years and this will be the new conventional wisdom in climate science. Some people will say they knew it all along… 🙂
Regards to all, Allan
_________________________________________________________________
http://wattsupwiththat.com/2014/02/23/study-volcanoes-contribute-to-recent-warming-hiatus/#comment-1575178
From a previous post – note the coldest CET in the Dalton was 1814, one year BEFORE Pinatubo.
______________
I have no Sunspot Number data before 1700, but the latter part of the Maunder Minimum had 2 back-to-back low Solar Cycles with SSNmax of 58 in 1705 and 63 in 1717 .
http://www.ngdc.noaa.gov/stp/space-weather/solar-data/solar-indices/sunspot-numbers/international/tables/
http://www.ngdc.noaa.gov/stp/solar/image/annual.gif
The coldest period of the Maunder was ~1670 to ~1700 (8.48dC year average Central England Temperatures) but the coldest year was 1740 (6.84C year avg CET).
http://www.metoffice.gov.uk/hadobs/hadcet/data/download.html
The Dalton Minimum had 2 back-to-back low SC’s with SSNmax of 48 in 1804 and 46 in 1816. Tambora erupted in 1815.
Two of the coldest years in the Dalton were 1814 (7.75C year avg CET) and 1816 (7.87C year avg CET).
Now Solar Cycle 24 is a dud with SSNmax estimated at ~65, and very early estimates suggest SC25 will be very low as well.
The warmest recent years for CET were 2002 to 2007 inclusive that averaged 10.55C.
So here is my real concern:
IF the Sun does indeed drive temperature, as I suspect, then global cooling probably WILL happen within the next decade or sooner.
Best regards, Allan
richard verney says:
August 11, 2014 at 9:07 pm
I do not disagree with what you said, but you completely ignored Dr Deanster’s question
I didn’t see a question mark in his comment. What question do you see?
Should there be no warming, or indeed should there be some cooling, over the course of the next 15 to 20 years, and if the solar cycle(s) exhibit a low sunspot count, do you rule out that the sun may have played a role in the continuance of the pause
A low sunspot count should make a difference of something like 0.05C from that alone. I doubt that we can even measure that.
RACookPE1978 says:
August 11, 2014 at 9:27 pm
Is there a better formula: The plot hits a low of 1320 at the end of July, and a high of 1420 watts/sec on the first week of January, neither of which matches the plot.
The low [as plotted] is on July 4th [not end of July] and the high on Jan. 3rd.
RACookPE1978 says:
August 11, 2014 at 9:27 pm
But I understand from an earlier reply you made was that Top Of Atmosphere radiation over the day-of-year could be expressed in Excel terms by: TOA =TSI*(1+0.0342*(COS(2*3.141*((H1-3)/365))))
A bit too crude. The actual value of TSI as measured at Earth is in column 10 of
http://lasp.colorado.edu/data/sorce/tsi_data/daily/sorce_tsi_L3_c24h_latest.txt
which is what is plotted.
Leif Svalgaard says:
August 11, 2014 at 3:21 pm
The quality of the data does not allow a finer determination.
…………..
Not exactly correct.
If data allows determination of 12.5 years that you found, then it does for 11.4 years which I found in the factual McCracken data.
http://www.leif.org/research/Does%20The%20Sun%20Vary%20Enough.pdf
(see page 25),
Alan says
I still think my 2002 global cooling prediction will materialize, although I wonder if this cooling will start a bit sooner than 2020.
Henry says
It already did. Global cooling already started. Don’t trust any other data set but the ones that you have established yourself from trusted sources.
Look at all three graphs underneath my tables and tell me where we are going?
http://blogs.24.com/henryp/files/2013/02/henryspooltableNEWc.pdf
Danger from global cooling is real and it will start with the droughts coming to the great plains of America, similar to 1932-1939, starting around 2020 or 2021.
BTW, if you take the time to look at my last graph, would you agree with me that there is no room for any AGW whatsoever? So don’t think that by putting morre GHG up in the air that we will escape global cooling. Global cooling will stay with us until around 2040. As per the current Gleissberg cycle.
Leif said:
“The sunspot number is the lowest in a hundred years and the global temperature is at all-time highs. ”
===
That’s the continuously-adjusted historically-revised Orwellian temperature record.
But when did “all time highs” ever correlate with Niagara freezing twice in the same year?
http://www.dailymail.co.uk/news/article-2572681/Niagara-Falls-comes-frozen-halt-AGAIN-subfreezing-temperatures-freeze-millions-gallons-water-normally-flow-Falls.html
When did “all time highs” correlate with record ice extent for the Great Lakes?
http://www.huffingtonpost.com/2014/06/11/great-lakes-ice-cover_n_5483993.html
When did “all times” correlate with a blizzard of cold weather reports in the UK?
http://www.metoffice.gov.uk/news/releases/archive/2010
When did “all time highs” ever correlate with meridional circulation patterns normally associated with global cooling?
When did “all time highs” correlate with the polar vortex extending itself almost precisely over formerly glaciated regions of Nth America?
When did “all time highs” correlate with record lows outnumbering record highs by 10:1?
Why are those “all times highs” going to show up in the weather on Earth where people live?
“The temperature will rise, our models say so.”
Baloney
“The temperature will fall, my prediction says so”.
Baloney
…..
Whatever happens, whichever camp turns out be right, it won’t be due to mankind’s present level of climate knowledge, just luck. We don’t know enough yet to know what we don’t know.
Feel free to prove me wrong. Go ahead and explain the pause.
We do have tremendous understanding in certain areas and we are getting better at formulating creative hypotheses while dismantling false ones, but we are still far from seeing the big picture. The more of us which exist, well fed and safe, with access to accumulated knowledge and inspiration, with easy and available communications, then the better able we shall be to peer beyond the edge of what we can not yet either conceive of, or perceive.
Fjord = (fewered + fee-ewe-erred + f’your’d) / 3
You see? Understanding can be achieved.
vukcevic says:
August 11, 2014 at 11:16 pm
“The quality of the data does not allow a finer determination.”
If data allows determination of 12.5 years that you found, then it does for 11.4 years which I found in the factual McCracken data.
It can’t be both. There is an error bar or uncertainty associated with those numbers.
Leif Svalgaard says:
August 12, 2014 at 12:11 am
Edim says:
August 11, 2014 at 11:25 pm
Leif, supposedly low sunspot numbers correlate with periods of cooling (temperature gradient, not level) with some lag.
—–
“With the proper lag [possibly even variable to fit] you can correlate anything. What lag do you prefer?”
_______________________
Why go through all the extra computational work? One can go right over to WoodForTrees and use their cool graphing tools. Any amateur can use that online etch a sketch to maneuver parameters around all over the place and fit just about anything.
Alan Robertson
Feel free to prove me wrong. Go ahead and explain the pause.
henry
the pause is explained by some idiotic idea of some [luke] warmist of going back further in time [when it was still warming].
The truth is that it has been cooling, since 2002
http://www.woodfortrees.org/plot/hadcrut4gl/from:1987/to:2015/plot/hadcrut4gl/from:2002/to:2015/trend/plot/hadcrut3gl/from:1987/to:2015/plot/hadcrut3gl/from:2002/to:2015/trend/plot/rss/from:1987/to:2015/plot/rss/from:2002/to:2015/trend/plot/hadsst2gl/from:1987/to:2015/plot/hadsst2gl/from:2002/to:2015/trend/plot/hadcrut4gl/from:1987/to:2002/trend/plot/hadcrut3gl/from:1987/to:2002/trend/plot/hadsst2gl/from:1987/to:2002/trend/plot/rss/from:1987/to:2002/trend
There is no pause. It is either cooling or warming.
Do you understand probability theory?
http://wattsupwiththat.com/2014/08/11/a-gleissberg-solar-minimum/#comment-1707364
Leif, I don’t prefer any lag. The weakish SC 23 already had an effect – the temperature plateaued and are cooling this century (roughly).
http://www.woodfortrees.org/plot/wti/plot/pmod/normalise/plot/sidc-ssn/from:1975/normalise/plot/wti/from:2002/trend
I expect the global temperature indices to start plummeting after ~2015. Furthermore, like Khwarizmi said, the reality is probably somewhat cooler than the ‘continuously-adjusted historically-revised’ records.
Leif,
Looking at the L&P graphs http://www.leif.org/research/Livingston%20and%20Penn.png:
– Is it still allowed to conclude that the next solar cycle would have no spots at all?
– Earlier you declared that the ‘flattening’ of decline is a consequence of the bottom of the distribution being cut off. Is the still an acceptable explanation for the persistent flattening of the curve?
Edim says:
August 12, 2014 at 12:51 am
Leif, I don’t prefer any lag. The weakish SC 23 already had an effect
And [according to your graph] when we went from the strong cycles 21 and 22 into the weakish SC23, temperatures shot up.
Rik Gheysens says:
August 12, 2014 at 12:55 am
Looking at the L&P graphs http://www.leif.org/research/Livingston%20and%20Penn.png:
– Is it still allowed to conclude that the next solar cycle would have no spots at all?
That is probably going too far. The behavior right now is consistent with losing the small spots, but how far that will go is anybody’s guess. We must just keep observing and learn.
Leif Svalgaard says:
“And [according to your graph] when we went from the strong cycles 21 and 22 into the weakish SC23, temperatures shot up.”
So what? Numerous factors influence global temperature indices (including AGW confirmation bias). Surface temperatures shooting up for a few years is short-term ‘noise’. It does increase the surface cooling flux though and helps with the upcoming cooling.
Sun seems to be the main knob, but it’s not the only influence. By ~2020 we will know much more.
vukcevic says: August 11, 2014 at 11:16 pm
If data allows determination of 12.5 years that you found, then it does for 11.4 years which I found in the factual McCracken data.
Leif Svalgaard says: August 12, 2014 at 12:08 am
It can’t be both. There is an error bar or uncertainty associated with those numbers.
…………..
Now, you are finally correct
indeed, it can not be both, but as has been demonstrated on more than one occasion your FFT spectrum analysis lacks good resolution.
See link bellow showing higher resolution output ; your McCracken data appear to be a bit fuzzy too.
vukcevic says: August 11, 2014 at 2:43 pm
http://wattsupwiththat.com/2014/08/11/a-gleissberg-solar-minimum/#comment-1707088
Leif Svalgaard says:
you have never found anything of scientific value. The rest of your comment is garbage.
…………………..
Well that is rather funny, since your spectrum is of very similar content to what I found but lacks good resolution (hence your error of about one year in the principal component).
The world’s most prominent expert on the Maunder Minimum, Hiroko Miyahara from University of Tokyo, also found same frequencies as I did and ‘almost’ you did.
Here Maunder min spectrum Svalgaard, Miyahara, etc
I compare similarities and minor differences between findings from:Svalgaard, Miyahara and vukcevic. All three contain common elements, that you describe so figuratively as garbage .
M Simon says:
“And yet low sun spot numbers correlate well with periods of cooling.”
The decadal ‘cycles’ in surface temperature drift in and out of phase with SSN cycles. Not good for correlation. The period seems more clearly related to period of precession of lunar apsides:
http://climategrog.wordpress.com/?attachment_id=981
The centennial scale variability does seem to follow SSN reasonably well with a relaxation to equilibrium response. There is a divergence in this relationship starting around 1990, When temperatures fail to drop noticeably despite reducing solar activity.
This may be due to the surface warming effect of major volcanoes caused by the reduction in stratospheric ozone that they cause.
http://climategrog.wordpress.com/?attachment_id=902
The step nature of the drops in TLS and no significant long term trend since 1995 ( as opposed to the steady downward trend that would result from GH effect ) is now recognised by IPCC AR5 WG1 in chapter 10. But they avoid following through to what this implies for surface temps.
http://climategrog.files.wordpress.com/2014/07/tls_icoads_70s-20s.png
Thompson and Solomon, 2009 shows most of the change in TLS outside the immediate (warming) effects of volcanoes can be attributed to ozone variation. The biggest changes in ozone are coincident with the two major eruptions.
I derived the change in energy budgetat the tropopause after Pinatubo settled out to be 1.8W/m2 extra SW making it into the lower climate system ( ERBE data ) . Estimating El Chichon to have a comparable effect would account for much of the late 20th c. warming that was the cause for the initial alarm calling.
It would also explain why temperatures failed to drop noticeably and hence the divergence between the surface SST record and SSN relaxation response.
Greg Goodman says: August 12, 2014 at 2:50 am
The decadal ‘cycles’ in surface temperature drift in and out of phase with SSN cycles. Not good for correlation.
Good quote, but incomplete, I would say:
The decadal ‘cycles’ in surface temperature drift in and out of phase with SSN cycles. Not good for correlation until the geomagnetic effect is taken into the account
Sun-Earth link
Why? You might ask
As my early ‘mentor’ Dr. J. Feynman says (quote from above)
The “aa” index of geomagnetic activity carries information about the two components of the solar magnetic field (toroidal and poloidal), one driven by flares and CMEs (related to the toroidal field), the other driven by co-rotating interaction regions in the solar wind (related to the poloidal field). These two components systematically vary in their intensity and relative phase giving us information about centennial changes of the sources of solar dynamo during the recent CGC over the last century.
( on Jun 16, 2003 she also said: Best of luck to you, joan Feynman, since than I took a long pause, but recently have more time available to pursue the hobby)
Then NASA adds their recent discovery:
Solar coronal mass ejections CMEs in the even-numbered solar cycles tend to hit Earth with a leading edge that is magnetized north. Such CMEs open a breach and load the magnetosphere with plasma starting a geomagnetic storm .
I always enjoy a blog here about the sun, it is interesting reading. The fact that the sun is our only source of heat, and the world varies wildly between glacials and interglacials, gives me pause to imagine that the sun, our companion planets and our place in our galaxy must interplay to vary our climate. TSI is probably the only thing about the sun that is nearly a constant and seems irrelevant to our constantly changing climate.
People such as Lief seem incapable of seeing the forest for the trees and to my mind the information in data he is capable of accessing and analysing is wasted on what appears to me to be a closed mind. Unless one thinks outside the square occasionally in science nothing ever changes and nothing new is discovered. Superiority in attitude is a failing not an attribute.
Vuk’ says: Not good for correlation until the geomagnetic effect is taken into the account
Sun-Earth link
What is your point here? This shows exactly the phase drift I referred to.
You’re in phase around 1965; anti-phase in 1935; in phase in 1915 and anti-phase in 1885
Over that time I see 8.5 “geo” cycles and 11 SST cycles. The phase drift is fairly steady, not random back and forth.
That seems to be a fairly clear indication of a period mismatch. I don’t see anything in your graph that goes contrary to what I posted, it is essentially showing the same thing. Whether you want to measure it using SSN or ‘geo’ , you get the same answer: this decadal SST pattern is not solar induced,
Ulric Lyons “I would be pleased to demonstrate these findings to Ant*ony Watts when he is in the UK in September if he is interested. ”
I’m sure he will be very flattered. Is there any reason you don’t demonstrate that here? Sounds like important stuff. If it’s a secret, no point in posting about it , just keep quite about it and hide you results in a safe place.
Leif Svalgaard says:
August 11, 2014 at 5:15 pm
” In addition to the tiny, tiny magnetic changes, TSI changes some 70 W/m2 through the year due to the changing distance to the Sun”
————————————————————————————————————————–
My understanding is that the TSI you are referring to here is TOA. However, I believe too many people do not understand that and believe the actual output of the Sun changes by that amount. Is there a better way to refer to TSI so the meaning is clear to all, or is the TSI always TOA by definition?
A glorious sunrise is developing in Calgary today. The sun is coming up, and I predict with some confidence that the day will be warmer than the night (who knew?). I suspect a correlation, but cannot be sure… 🙂
We have been enjoying a wonderful summer, after a long cold winter – but central and eastern North America had it even colder and longer – record ice on the Great Lakes, and Chicago (among many other locations) had the coldest four winter months on record.
I’m guessing that the Sun has something to do with the climate, although I have not studied the matter in detail – those who do have many different opinions, and clarity seems to be a distant hope.
Here is a compilation of predictions for SC24. As you can see, there are 45 of them, more than enough to fill a roulette wheel, and they are “all over the map” ranging from a low of 42 to a high of 169, so somebody had to be close. Not sure that this supports any conclusion, except fundamental concepts of probability. 🙂
http://users.telenet.be/j.janssens/SC24.html
SC25 is just around the corner and predictions can start soon – Ladies and Gentlemen, faites vos jeux!
God, I hope to be wrong about imminent global cooling – I’m getting old and hate the cold.
Regards to all, Allan
Skill Testing Question:
How many people predicted imminent global cooling more than a decade ago?
Answer:
A very few people predicted global cooling more than a decade ago, but most “coolists” were stoned or burned at the stake by warmist zealots. Since then, “the pause” has caused global warming fanaticism to be debunked, and former warmist fanatics have covertly formed a new group, reportedly called ISIS.
re Vuk’s graph.
The roughly 80y period I picked out by eye ( since you refuse to provide a clear explanation for a reproducing your results ) gives the following estimated average cycles: 80/11=7.2 , 80/8.5=9.4
Within the accuracy of my eyeballed “8.5” cycles, I would guess that latter in 9.3*8.6=80
The former may be 7.5*10.7=80 , note how Hadley adjustments to SST severely attenuate the circa 9y periodicity and accentuate 7.5y.
http://climategrog.files.wordpress.com/2013/03/icoad_v_hadsst3_ddt_n_pac_chirp.png
I’m guessing your AMO is derived from Kaplan et al which adopts most of the Hadley “corrections”.
So I was incorrect in thinking that your graph was showing the same lunar cycle this I had identified but it does show the same kind of phase drift which disputes your claimed linkage.
It may be interesting to plot your geo index against ICOADS and see how well the phase lines up.
9.3 is suggestive of 18.6/2 : lunar declination Perhaps E-M-S alignments is a key factor in determining the variation in your ‘geo’ index.
wayne Job
http://wattsupwiththat.com/2014/08/11/a-gleissberg-solar-minimum/#comment-1707464
henry says
there is so much fiddling with the data that one has wonder……Better to rather establish your own data sets. My data set says we are currently cooling at a rate of -0.015K/annum since 2000 but it appears we are still accelerating further downwards. Up to now, that is 14 x -0.015 = -0.2 K
The other 4 major data sets that I quoted earlier say it is around -0.1K but none of those data sets are properly balanced NH / SH
I have a [simple] theory as to why we are cooling, and why it will continue to cool…
We know that there is not much variation in the total solar irradiation (TSI) measured at the TOA. However, there is some variation within TSI, mainly to do with the more energetic particles coming from the sun. It appears (to me) that as the solar polar fields are weakening,
http://ice-period.com/wp-content/uploads/2013/03/sun2013.png
more of these particles are able to escape from the sun to form more ozone, peroxides and nitrogenous oxides at the TOA. In turn, these substances deflect more sunlight to space when there is more of it. So, ironically, when the sun is brighter, earth will get cooler. This is a defense system that earth has in place to protect us from harmful UV (C).
That ozone is increasing, is easily proven. About the others, I don’t know [if we can measure them]
In any case, you can see that the acceleration of the cooling can be correlated with the decreasing solar polar field strengths.
Most likely there is some gravitational- and/or electromagnetic force that gets switched every 44 year, affecting the sun’s output.
{that 2 x 44 years brings the total actual Gleissberg cycle at around 87 or 88 years}
We are now waiting for the switch on the sun, where we cycle back to increasing polar field strengths again, which I predict must happen around 2016.
henry said
The other 4 major data sets that I quoted earlier say it is around -0.1K but none of those data sets are properly balanced NH / SH
henry says
The other 4 major data sets that I quoted earlier say it is around -0.1K but [ I think] none of those data sets are properly balanced NH / SH
It seems to me that a buried [insert favorite driver] signal in noisy temperature data kinda closes the case re: [repeat name of favorite driver]. Most solar proponents stipulate that there are any number of Earthly bottom up confounding/amplifying factors, ergo case closed in my opinion. CO2 modelers stipulate that there are any number of natural confounding/amplifying factors, ergo case closed in my opinion.
I’m all for looking for a needle in a haystack, but it has to be a pretty goddamn big one. So far the only big one I have seen is over on Bob Tisdale’s site related to El Nino correlated step-rises in sea surface temperature. Each one of those steps indicates warm water evaporating off the surface into the air, adding heat to the atmosphere from the ocean’s gas tank. Now that’s a pretty goddamn big needle.
Pamela Gray
Each one of those steps indicates warm water evaporating off the surface into the air, adding heat to the atmosphere from the ocean’s gas tank. Now that’s a pretty goddamn big needle.
Henry says
What you say is true. In fact that is the reason we are cooling. The reason why we are cooling is that there is less [UV] radiation coming into the oceans.
This can be easily understood from this graphic presentation:
http://blogs.24.com/henryp/files/2011/08/Atmospheric_Transmission.png
If ozone is getting more, there is less UV coming through which is a big chunk [look at the chi square distribution]
Obviously this graphic presentation was before we realised that besides ozone, peroxides and nitrogenous oxides are also formed by the most energetic particles coming from the sun {Trenberth’s missing energy}
and just ignore the fact that Sun incoming- and earth outgoing radiation it is completely out of proportion…..
UV into the oceans must eventually convert to heat, even if it is only at higher depths.So if UV is getting less, there is your explanation as to why earth is cooling.
There is no “other” way around this. I hope you understand.
Greg Goodman says:
……………..
Hi Greg
GeoSolar cycle is derived directly from geomagnetic field response to the solar activity.
Its spectrum’s principal components are 9.1 and 64.5 years, which is more or less the AMO’s spectral composition.
If you count from 1882 to 2010, there are 14 GS cycles, giving ~ 9.14 years period, while the 60’s periodicity (GS back extrapolated to 1700, varies between 58 and 67) isn’t as obvious. Neither the GS or the AMO cycles are of equal length or shape, one is affected by irregularities in the solar activity and geomagnetic shocks, http://www.geomag.bgs.ac.uk/images/image018.jpg, the other by occasional volcanic eruptions.
How does it work ?
Solar input is totally independent variable.
Terrestrial part of the equation has a degree of positive feedback, i.e. the geomagnetic input contributes to temperature changes (Svensmark, stratosphere etc), the equatorial temperature changes (mainly ENSO and monsoon strengths) move the geomagnetic field by altering the rate of rotation i.e. LOD..
Thus, I would suspect that the + or – 0.1C change, that can be without any doubt directly attributed to the solar cycles (via TSI, even Dr. S admits to that) is enhanced (~ doubled) by this positive feedback, but as every feedback introduces a phase shift (due to delay in the FB loop), so does the above, result decadal/multi-decadal ‘oscillations’.
This does not explain or says anything about the long up/down trends as experienced during the MWP, the LIA or ‘modern epoch’ warming. I attribute those to tectonics, but that is an even more controversial idea.
I do not expect or ask for any support of these ideas, universal rejection is the most likely outcome, just making my views (right or wrong) publicly known.
***
Leif Svalgaard says:
August 11, 2014 at 5:15 pm
In addition to the tiny, tiny magnetic changes, TSI changes some 70 W/m2 through the year due to the changing distance to the Sun. Here is an illustration of the changes: http://www.leif.org/research/TSI-through-a-year.png
***
When I look at this 70W/m2 annual TSI variance and knowing that global avg annual temps actually defy this trend somewhat (I know, land vs ocean in SH vs NH), then I see all kinds of posters linking the tiny 1.5W/m2 solar-cycle variance to significant climate changes, I have to shake my head in wonder….
vukcevic says:
August 12, 2014 at 2:29 am
indeed, it can not be both, but as has been demonstrated on more than one occasion your FFT spectrum analysis lacks good resolution.
The problem is not FFT, but the data themselves that are too noisy. The garbage part is your nonsense about the geomagnetic connection. Noisy data has all kinds of spurious peaks. Garbage in, garbage out. As usual, you have no idea what you talking about.
vukcevic says:
August 12, 2014 at 3:52 am
Then NASA adds their recent discovery:
Solar coronal mass ejections CMEs in the even-numbered solar cycles tend to hit Earth with a leading edge that is magnetized north.
This is simply not so. If it were, geomagnetic activity would show a 22-yr variation in phase with the sunspot Hale cycle from minimum to minimum, contrary to observations since the 1840s which show that the variation follows the polar fields, i.e goes from maximum to maximum. All this has been well-understood and observed for decades.
Tom in Florida says:
August 12, 2014 at 5:27 am
Leif Svalgaard says:
My understanding is that the TSI you are referring to here is TOA.
For the climate, TOA at the Earth is the proper measure. For stidy of the Sun, TSI at 1 AU is the proper measure. What is not to understand?
Thompson & Solomon 2009:
http://www.atmos.colostate.edu/ao/ThompsonPapers/ThompsonSolomon2_JClimate2009.pdf
figure 2 from above showing temp drop in TLS and the drop in ozone following each event.
http://climategrog.wordpress.com/?attachment_id=1002
changes in TLS compared to changes in SH SST.
http://climategrog.wordpress.com/?attachment_id=988
@Greg
for example:
https://sp.yimg.com/ib/th?id=HN.608056146891899248&pid=15.1&w=162&h=126&p=0
Ozone has been increasing since 1995.
CFC scare was a red herring as well. Complete nonsense,
[and to think that I worked on projects getting rid of CFC’s]
I have a complete set of data from 1927 from a station on the swiss alps showing that ozone is decreasing since 1951 and has started increasing again from 1995
exactly 44 years difference
is that not curious?
As I said, it is either warming or it is cooling. There no such thing as a pause.
HP: “I have a complete set of data from 1927 from a station on the swiss alps showing that ozone is decreasing since 1951 and has started increasing again from 1995”
Can we see it. Where’s the data ? ( BTW that graph is illegible.)
Ozone is not uniformly mixed, hence ozone hole etc.
The paper I linked above concludes a very small rise since 1995. NCAR and IPCC say essentially no significant change in TLS since 1995.. Surface temps say: pause. Ozone seems to be a key player.
Less ozone , less scatter back into space. Also less opacity in stratosphere means this gets down into lower climate system.
Following each eruption 0.5 drop in TLS and 0.1 rise SH SST.
The famous “ozone layer” you were trying to save is in the lower stratosphere. You may have helped stop global warming ! Well done.
Leif Svalgaard says:
August 12, 2014 at 6:55 am
The garbage part is your nonsense about the geomagnetic connection. Noisy data has all kinds of spurious peaks. Garbage in, garbage out. As usual, you have no idea what you talking about.
Now we blame data, if it is ‘garbage in’ why do you use it to justify spurious LP effect?
Are you now claiming that changes in the Earth’s magnetic (geo-magnetic) field do not affect 10Be deposition rate?
Despite the great experience and knowledge, when you put in the service of obscurantism, rather than the advance of science, it will not serve well to your legacy.
I have learned a great deal from many of your comments, but I do not read everything anyone says through the rose tinted spectacles, there are plenty of others who do that, one less shouldn’t be a distraction to the intended endeavour. Even a blindfold has its uses.
Near 22 year cycle is observable in:
– Heliospheric current sheet (yes I know ….) inclination, the Earth transverses through it frequently.
– Neutron count (difference between odd and even cycles)
– Global and hemispheric land and ocean temperature records.
Its presence may be ignored but not credibly denied.
Greg Goodman says: August 12, 2014 at 7:52 am
Where’s the data ?
ftp://iaclin2.ethz.ch/pub_read/maeder/totozone_arosa_monthly
Steven Mosher says:
“post your code and data.. saves on the air faire.. and more eyes on the problem.. always a good thing.”
It requires demonstration on a solar system model, and I have not yet produced a narrated animation. But I can give very simple instructions to anyone who has a copy of the TheSky or Alcyone astronomy programs on how to track the progression. As well as identifying when solar grand minima occur, it also shows where the sunspot maximum of most cycles occur, typically within less than a year.
Ulric would you be able and willing to give instructions here that illustrate your point using this easy to use program http://www.solarsystemscope.com/ ?
@Bob Weber
No that is not suitable at all, user defined step time periods are required.
AJB , thanks. The accompanying paper attempts to detect the turnaround expected from Montreal protocol limiting CFCs.
ftp://iaclin2.ethz.ch/pub_read/maeder/CANDIDOZ/documents/deliv1_eth.pdf
Total column ozone at that site seems to have recovered about half the post Mt Pinatubo drop since 1995.
@Greg
Like I said: cfc: red herring
1995 is when global cooling started looking at maximum temperatures.
You can calculate that from my best fit curve
MoreCarbonOKetcHenryP says:
August 12, 2014 at 9:49 am
@Greg
Like I said: cfc: red herring
1995 is when global cooling started looking at maximum temperatures.
You can calculate that from my best fit curve
====
Why does that make it a red herring. It may be a part of reason if there has been a recovery of ozone since that date.
@Greg
There is no AGW whatsoever, caused by any GHG. No room for it in my last equation for minima. 1995 lies exactly in the middle of Gleissberg. Has to do with planets and stuff. I think Ulric figured it out as well.
Greg Goodman says:
August 12, 2014 at 9:46 am
Vuk’ , no comment on the phase drift in you geo index vs SST plot ?
9.3 / 9.4 y look more like a lunar signal than solar.
…………..
There is another phase drift developing currently, the AMO trails the GSC, complex reasons, but Dr. Dickey’s (JPL-NASA) work on diff rotation of the liquid core (in relation to the mantle) where the primary component of geo-magnetic field is generated (solar being the secondary) gives a good match for the delay.
Nothing is perfect; for some of the reasons see:
http://wattsupwiththat.com/2014/08/11/a-gleissberg-solar-minimum/#comment-1707534
I don’t see either you or Ulric presenting anything credible, just vague claims.
All I recall seeing from you is an attempt to represent the whole to climate by one sinusoid, fitted to a ridiculously small segment of data. There’s “no room” for anything in that kind of model so it’s hardly an argument that carries much weight.
Is your latest equation any more sophisticated?
vukcevic says:
August 12, 2014 at 8:16 am
Now we blame data, if it is ‘garbage in’ why do you use it to justify spurious LP effect?
The data is not good enough to fix the 11-yr cycle with precision better than 1-2 years during the Maunder Minimum. different ice cores and tree data give different results [noise].
The garbage is not the data itself [which is just noisy] but your baseless pseudo-scientific claims.
Are you now claiming that changes in the Earth’s magnetic (geo-magnetic) field do not affect 10Be deposition rate?
The Earth’s magnetic field determines the production rate, not the deposition rate [which is determined mainly by climate and weather and volcanic eruptions].
rather than the advance of science
Nothing of what you post in any way serves the advance of science.
Near 22 year cycle is observable in
The 22-yr cycles [as I have explained many times] are tied to the reversals of the solar polar fields [and goes from maximum to maximum], not to the even and odd cycles. Again you have not learned anything.
vukcevic says:
August 12, 2014 at 10:09 am
diff rotation of the liquid core (in relation to the mantle) where the primary component of geo-magnetic field is generated (solar being the secondary)
There is no solar influence on the mantle-core interaction. Again you are off the rail. This has been explained to you many times, but you are impervious to learning.
Leif Svalgaard says: Near 22 year cycle is observable in
The 22-yr cycles [as I have explained many times] are tied to the reversals of the solar polar fields [and goes from maximum to maximum], not to the even and odd cycles.
===
I don’t get the point you are making here. Is anything more than an objection to him calling them odd and even?
IIRC, the polarity change happens around max SSN so each half of the Hale cycle ( +ve or -ve in number) has opposite polarity.
Greg Goodman says:
August 12, 2014 at 10:46 am
I don’t get the point you are making here. Is anything more than an objection to him calling them odd and even?
If CMEs have a magnetic field determined by the parity of the solar cycle, geomagnetic activity [and all the other 22-yr cycles he mentions] should be higher in even cycle from minimum to minimum and lower in odd cycles from minimum to minimum. This is not what is observed. Rather geomagnetic activity is higher the last half of even cycles and the first half of the following odd cycle. This is a well-known and well-understood and well-observed and well-documented effect.
Greg Goodman says:
August 12, 2014 at 10:53 am
Leif, what is the mathematical fn that is fitted as the generalised skewed bell shape when predicting how a cycle is expected to run?
Eq. (6) of http://solarphysics.livingreviews.org/Articles/lrsp-2010-1/download/lrsp-2010-1Color.pdf is generally thought to be good.
As I grow more knowledgeable, these solar threads get easier to scan quickly. For example, as soon as Ulric Lyons said “I have identified the precise heliocentric planetary progression that causes solar minima.” I knew I could skip over his scribblings, although there still might be something worthwhile in the replies correcting him.
Then there’s Henry Pool, who has no room for any AGW anywhere in his tables and graphs and equations whatsoever, who tosses logic grenades like:
(…) Don’t trust any other data set but the ones that you have established yourself from trusted sources.
Look at all three graphs underneath my tables and tell me where we are going?
Don’t trust any data set other than your own for the truth. Trust my data set and see the truth it shows.
Then there is ultimate curve-fitter Greg Goodman. Whom I have caught processing these small bits of solar data with a “filter” used for digital image processing, amongst other crimes against responsible data handling. His talents might be better used searching for patterns on the grassy knoll.
After noting these and a few others, that removes about 60% of the vertical space from needing closer inspection, sometimes 70% or more. Quite a time saver!
Thanks , a interesting paper.
” Rather geomagnetic activity is higher the last half of even cycles and the first half of the following odd cycle. This is a well-known and well-understood and well-observed and well-documented effect. ”
Well-understood as in the mechanism is understood?
KDK: Then there is ultimate curve-fitter Greg Goodman. Whom I have caught processing these small bits of solar data with a “filter” used for digital image processing, amongst other crimes against responsible data handling.
LOL, which filter was that that you “caught” me using and why is its use in one field mean it is not suitable for another, for example solar?
Greg Goodman says:
August 12, 2014 at 11:40 am
Well-understood as in the mechanism is understood?
Yes, of course: section 9 of http://www.leif.org/research/suipr699.pdf
Yes, of course: section 9 of http://www.leif.org/research/suipr699.pdf
Thank you. So the presence of a 22y solar signal in SST is not surprising.
In figure 23, apart from the max appearing later/earlier , from the 3rd to the 7th year the changes seem to be in multiphase, so this seems to be the essence of the 22y component. I’m sure all this has been well dug into over the centuries we’ve been counting spots but it’s all very intriguing.
From Greg Goodman on August 12, 2014 at 11:45 am:
LOL, which filter was that that you “caught” me using and why is its use in one field mean it is not suitable for another, for example solar?
You mentioned it here in your first comment on August 12, 2014 at 2:50 am:
http://climategrog.wordpress.com/?attachment_id=981
Which says:
Processing:
A 75 month low-pass lancos filter was applied to SST. This almost totally removes any variation at or below 5 years in period.
http://climategrog.wordpress.com/2013/11/28/lanczos-filter-script/
Among many places referencing a Lanczos filter for digital photography (and rarely anything else), there’s Wikipedia:
https://en.wikipedia.org/wiki/Lanczos_resampling
Lanczos resampling or Lanczos filter is a mathematical formula used to smoothly interpolate the value of a digital signal between its samples. (…)
Lanczos resampling is typically used to increase the sampling rate of a digital signal, or to shift it by a fraction of the sampling interval. It is often used also for multivariate interpolation, for example to resize or rotate a digital image. It has been considered the “best compromise” among several simple filters for this purpose.[1]
It is used for processing huge amounts of digital data like pictures and video of many megabytes and even many gigabytes in size. You used it on piddling bits of monthly SST values while searching for solar signals. It is used for interpolation, to “fill in data” to increase perceived sharpness of images, etc. You say you have used it essentially remove data, to smooth away variations.
Thus I ignore you.
KDK: Whom I have caught processing these small bits of solar data with a “filter” used for digital image processing….
Maybe because a gaussian filter is used to ‘soften’ photographs we should not use it in any other kind of data processing.
Or perhaps it’s the Lanczos you refer too, which does sometimes get used in image processing. Not because it is limited to case but because it is a filter with good general properties. Nothing about Lanczos’ theoretical work is specific to image processing, in fact I don’t think he made any reference to such an application. It was a rather abstract mathematical attempt to produce an optimal filter.
Or was it the gaussian-derivatative that you “caught” me using. Quelle horreur!
This can be used for edge detection in medical and other image processing but again that application does not prevent its use elsewhere.
It is also a more efficient ( and slightly more accurate ) way of gaussian “smoothing” the time derivative ( rate of change ) of a time series.
Since the whole debate seems to focus on “trends” which are the ultimate low-pass filter of rate of change, I don’t see why you would see that as a “crime” either.
Your idea that the use of a filter in image processing in some way makes improper to use it in another field seems particularly ill-informed. But for some reason I’m not surprised by that.
KDK “It is used for processing huge amounts of digital data like pictures and video of many megabytes and even many gigabytes in size. You used it on piddling bits of monthly SST values while searching for solar signals. It is used for interpolation, to “fill in data” to increase perceived sharpness of images, etc. You say you have used it essentially remove data, to smooth away variations.”
Oh, so it was the Lanczos. If you main source of information is Wankipedia, I’m not surprised you are ill-informed.
Not only that you don’t even seem able to understand what you read at WP. It is a low-pass filter so one this it will not do is “increase perceived sharpness of images”.
Next time you set up a kangaroo court to accuse someone of “crimes” of data processing, don’t forget to call some expert witnesses. 😉
Leif Svalgaard
Geomagnetic field has a great influence on the ionization of the atmosphere, and hence the climate. Just compare the neutron counts at the pole and at 65 degrees latitude.
http://www.bartol.udel.edu/~pyle/TheSpnPlot2.gif
http://cosmicrays.oulu.fi/webform/monitor.gif
Isotopes produced in the atmosphere by the GCR react with ozone.
Us see ozone loss over the southern polar circle.
http://www.cpc.ncep.noaa.gov/products/stratosphere/strat-trop/gif_files/time_pres_TEMP_ANOM_JAS_SH_2014.gif
Greg Goodman
The records of the 14C content of the atmosphere and oceans contain a remarkable array of information about Earth history. Produced by cosmic rays in the upper atmosphere, 14CO2 rapidly mixes throughout the troposphere and exchanges with the reactive carbon reservoirs of the oceans and biosphere, where it decays. For the past 11,000 years, fluctuations in the atmospheric 14C have been largely produced by changes in the solar magnetic field. Many researchers believe that carbon cycle changes, tied to deep ocean circulation changes are a significant cause of atmospheric 14C fluctuations between 11,000 and 15,000 years before present. On longer time scales, changes in the Earth’s magnetic field intensity impact the 14C content of the atmosphere, producing positive 14C anomalies during intervals of weaker geomagnetic field.
@Greg@vukcevik
it is really very simple. 4 Hale cycles of 4 x 22 years makes for one whole Gleissberg cycle. 44 years of warming followed by 44 years of cooling.
in 1985, before they started with the CO2 nonsense, William Arnold had all of this figured out more or less correct,
http://www.cyclesresearchinstitute.org/cycles-astronomy/arnold_theory_order.pdf
but he was out with the dates by about 7 years, I think.
I have told you what [I think] the mechanism is for the G cycle.
From earth this cycle appears as a 90-100 year weather cycle. 1995 was the middle of that cycle. This is when we turned from warming to cooling. You can calculate this from the formula of the first graph on the deceleration of maximum temperatures.
http://blogs.24.com/henryp/files/2013/02/henryspooltableNEWc.pdf
Note that my tables are not a “model”. The projection forward and backwards in the graphs is only
for illustration. Note the 100% correlation on the [natural] deceleration of minimum temperatures which is supposed to show us chaos, i.e. Rsquare [40 latitude], where the Dust Bowl drought took place, meaning: less weather (read: rain). According to my calculations, this will start around 2020 or 2021…..i.e. 1927=2016 (projected, by myself and the planets…)> add 5 years and we are in 2021.
Danger from global cooling is documented and provable. It looks we have only ca. 7 “fat” years left……
WHAT MUST WE DO?
We urgently need to develop and encourage more agriculture at lower latitudes, like in Africa and/or South America. This is where we can expect to find warmth and more rain during a global cooling period.
We need to warn the farmers living at the higher latitudes (>40) [except Europe} who already suffered poor crops due to the droughts that things are not going to get better there for the next few decades. It will only get worse as time goes by.
We also have to provide more protection against more precipitation at certain places of lower latitudes (FLOODS!), <[30] latitude, especially around the equator.
Best wishes to all of you
Henry
whilst uploading my last message,the computer made a mistake.
@Greg@vukcevik
it is really very simple. 4 Hale cycles of 4 x 22 years makes for one whole Gleissberg cycle. 44 years of warming followed by 44 years of cooling.
in 1985, before they started with the CO2 nonsense, William Arnold had all of this figured out more or less correct,
http://www.cyclesresearchinstitute.org/cycles-astronomy/arnold_theory_order.pdf
but he was out with the dates by about 7 years, I think.
I have told you what [I think] the mechanism is for the G cycle.
From earth this cycle appears as a 90-100 year weather cycle. 1995 was the middle of that cycle. This is when we turned from warming to cooling. You can calculate this from the formula of the first graph on the deceleration of maximum temperatures.
http://blogs.24.com/henryp/files/2013/02/henryspooltableNEWc.pdf
Note that my tables are not a “model”. The projection forward and backwards in the graphs is only
for illustration. Note the 100% correlation on the [natural] deceleration of minimum temperatures which is supposed to show us chaos, i.e. Rsquare [40 latitude], where the Dust Bowl drought took place, meaning: less weather (read: rain). According to my calculations, this will start around 2020 or 2021…..i.e. 1927=2016 (projected, by myself and the planets…)> add 5 years and we are in 2021.
Danger from global cooling is documented and provable. It looks we have only ca. 7 “fat” years left……
WHAT MUST WE DO?
We urgently need to develop and encourage more agriculture at lower latitudes, like in Africa and/or South America. This is where we can expect to find warmth and more rain during a global cooling period.
We need to warn the farmers living at the higher latitudes (>40) [except Europe} who already suffered poor crops due to the droughts that things are not going to get better there for the next few decades. It will only get worse as time goes by.
We also have to provide more protection against more precipitation at certain places of lower latitudes (FLOODS!), <[30] latitude, especially around the equator.
Best wishes to all of you
Henry
@KD Knoebel
Why don’t you show us your data set that will show us all whether we on earth are currently cooling or warming? We all wait for your show of your own figures in anticipation. But we all know what we get from you: constipation.
If you think I am here to listen wiseguys like you and Leif you are thoroughly mistaken. I am trying to educate you all on what is lying ahead of us. Note the first comment on this thread. It seems markstoval also figured it out.
@all
It really was very cold in 1940′s….In Holland, snowfall in the winter of 1941-1942 was the highest ever recorded. Transport came to a complete standstill. The Dust Bowl drought 1932-1939 was one of the worst environmental disasters of the Twentieth Century anywhere in the world. Three million people left their farms on the Great Plains during the drought and half a million migrated to other states, almost all to the West. http://www.ldeo.columbia.edu/res/div/ocp/drought/dust_storms.shtml
I find that as we are moving back, up, from the deep end of the relevant curve, there will be standstill in the change of the speed of cooling, neither accelerating nor decelerating, on the bottom of the wave; therefore naturally, there will also be a lull in pressure difference at that > [40 latitude], where the Dust Bowl drought took place, meaning: less weather (read: rain). According to my calculations, this will start around 2020 or 2021…..i.e. 1927=2016 (projected, by myself and the planets…)> add 5 years and we are in 2021.
Danger from global cooling is documented and provable. It looks we have only ca. 7 “fat” years left……
WHAT MUST WE DO?
We urgently need to develop and encourage more agriculture at lower latitudes, like in Africa and/or South America. This is where we can expect to find warmth and more rain during a global cooling period.
We need to warn the farmers living at the higher latitudes (>40) [except Europe} who already suffered poor crops due to the droughts that things are not going to get better there for the next few decades. It will only get worse as time goes by.
We also have to provide more protection against more precipitation at certain places of lower latitudes (FLOODS!), <[30] latitude, especially around the equator.
Best wishes to all of you
Henry
Solar activity has shifted from a very active state prior to 2005 to a very inactive state post 2005. Review the data from the two periods .
The question is what will happen going forward. Those trying to justify future solar conditions based on data post Dalton are making a big mistake in my opinion. Post Dalton to 2005 the sun was in a Grand Maximum Cycle, post 2005 it is very likely in a Grand Minimum Cycle.
Therefore to make solar projections going forward based on what the sun did during a Grand Maximum Cycle is quite absurd.
Also climatic implications will very likely materialize from the sun switching from a Grand Maximum to a Grand Minimum mode of activity.
Yes, of course: section 9 of http://www.leif.org/research/suipr699.pdf
!977 was a very, very long time ago, many new things have been discovered since, now there are 5 Themis satellites mapping solar-magnetosphere interactions.
Leif Svalgaard wrote:
The 1360-something comes from the nuclear furnace at the core of the Sun. The energy production there is very stable because the sun is so big.
The second sentence is not inherently true. Being big allows for longer oscillations and variations.
Energy production (fusion) is non-linear with T and P. Consider what would happen if fusion totally stopped. The core temperature of Sol would follow an equation equation like:
T(t) = T0 exp(-t/τ)
What is the value of τ?
I believe the second sentence (above) can be paraphrased as:
“There are no significant oscillations in energy production over periods between the time we’ve observed and τ.”
That seems like a pretty big extrapolation.
Greg Goodman says:
August 12, 2014 at 10:27 am
I don’t see either you or Ulric presenting anything credible, just vague claims.
All I recall seeing from you is an attempt to represent the whole to climate by one sinusoid, fitted to a ridiculously small segment of data
…………………
I have no idea what Ulric is up to, I am sure he can speak for himself.
Even less it is clear to me why you would you assume that THIS is a single sine; it doesn’t look like one, and certainly doesn’t have properties of one. It is not even a regular oscillation, no two of its ‘cycles’ are the same.
I see it, strong case of confirmation bias, as a complex result of number of major, and multitude of minor variables starting with the sunspot cycles leading into atmo & hydro -spheric forces, angular momentum change, differential rotation of the Earth’s core, all forced into a disorderly positive feedback loop, which by nature of a feedback as it is, with a non-stationary delay, attains a form of very irregular oscillation, as long , that is, as there is an uninterrupted supply of energy to power it, in this case made available by the solar irradiance.
Well, that is as clear as mud, so it is by far wiser to ignore it all, stick to the already individually held ideas and beliefs, but for the climate natural change understanding direct attention to elsewhere !
“Even less it is clear to me why you would you assume that THIS is a single sine; ”
What is even less clear is where I said anything that even claim close. How you about you quote my words rather than make a spurious assertion about what I allegedly said.
Would you like to answer my question about the phase drift on that plot?
Counting peaks and troughs it does not support the idea of the geo index correlatiing with the SST measurements.
“Well, that is as clear as mud, so it is by far wiser to ignore it all, stick to the already individually held ideas and beliefs, but for the climate natural change understanding direct attention to elsewhere ! ”
Every couple of months you link this same graph but refuse to provide enough for anyone to recreate it. Now you say it’s “far wise to ignore it”.
Seems like you are in agreement with Leif at last.
kadaka (KD Knoebel) says:
“As I grow more knowledgeable, these solar threads get easier to scan quickly. For example, as soon as Ulric Lyons said “I have identified the precise heliocentric planetary progression that causes solar minima.” I knew I could skip over his scribblings, although there still might be something worthwhile in the replies correcting him.”
I would call that disparaging flippancy rather than knowledge, you have no information by which to form an opinion, at least not that I have supplied, I have only made an offer to disclose my findings. But then if you had bothered to read my scribblings, you would be that much wiser.
Leif Svalgaard says:
August 12, 2014 at 11:52 am
“Yes, of course: section 9 of http://www.leif.org/research/suipr699.pdf”
Let me guess, done on an IBM Selectric typewriters with the “ball” instead of the “type hammer” models. I remember when our high school got ONE Selectric. We rotated onto using it. The rest of the time in class we were busy separating lodged hammers from their constant hand to hand combat with each other.
Salvatore Del Prete says:
August 12, 2014 at 1:31 pm
Therefore to make solar projections going forward based on what the sun did during a Grand Maximum Cycle is quite absurd.
since there were no Grand Maximum your opinion is moot.
vukcevic says:
August 12, 2014 at 1:37 pm
!977 was a very, very long time ago, many new things have been discovered since, now there are 5 Themis satellites mapping solar-magnetosphere interactions.
Nothing had been discovered that overturns the 1977 view on this.
Produce a link to a paper that shows the ‘new discovery’ if you persist.
As usual, you do not know what you are talking about.
Q. Daniels says:
August 12, 2014 at 2:58 pm
“The 1360-something comes from the nuclear furnace at the core of the Sun. The energy production there is very stable because the sun is so big.”
The second sentence is not inherently true. Being big allows for longer oscillations and variations.
It is true for the Sun, as the time for adjustment of the balance is of the order of hours.
Somebody way upstream asks, what causes topical oceans evaporate? If the ocean is warmer than the air above it (IE when it calmly layers itself with the warmest layer on top), the ocean evaporates. If the ocean surface is colder (IE when is it mixed and agitated by wind), less evaporation transpires. There are lots of lectures online about this. Here is just one of them.
http://www.st-andrews.ac.uk/~dib2/climate/tropics.html
From Ulric Lyons on August 12, 2014 at 6:07 pm:
I would call that disparaging flippancy rather than knowledge, you have no information by which to form an opinion, at least not that I have supplied, I have only made an offer to disclose my findings. But then if you had bothered to read my scribblings, you would be that much wiser.
You said, bold added: “I have identified the precise heliocentric planetary progression that causes solar minima.”
Apparent minimums and maximums are caused by the outer layers of the Sun modulating the constant output of the core. The only force the planets could exert on the Sun that is possibly worth mentioning is gravity. The Sun has 99.8% of all the mass in the solar system, most of the rest is Jupiter.
You would have to provide a mechanism whereby planetary movement controls the modulating of the core output by the outer layers, to substantiate that said planetary movement causes solar minimums. But this is like proposing how the regular dispersal of handfuls of rubber ducks onto a certain river will control the output of Niagara Falls.
Thus in that one line you did supply me with enough information to form an opinion, and the opinion was and is you’re spouting quackery. Further reading of your scribblings cannot improve that opinion, only the retraction of your obviously erroneous statement could help. The only way further reading could make me that much wiser, would be wiser in the ways of quackery and deception, presumably self-deception. And I can study more refined versions daily in climate science.
Thus I ignore you.
“2014 has featured a wet and cooler-than-average summer across a wide swath of the country from the central Plains to the mid-Atlantic, including the Northeast and Great Lakes. As children get ready to go back to school, some people are asking where all the summer warmth was and why was it so cool and wet?”
Air circulation in the lower stratosphere.
http://earth.nullschool.net/#current/wind/isobaric/70hPa/orthographic=-88.74,26.93,481
There will be no hurricanes in the Atlantic.
Leif Svalgaard says:
August 12, 2014 at 7:01 pm
Nothing had been discovered that overturns the 1977 view on this.
Produce a link to a paper that shows the ‘new discovery’ if you persist.
As usual, you do not know what you are talking about.
Your theoretical treatise from 1977, may have been at the time, the corner stone of understanding, then at the end of 2008 NASA’s Themis project comes with the series of observational data that contradict conclusions of your work. Such things happen all the time, nothing new about that.
It is not me, or anyone on this blog, and I would suggest that may include you, but it is the observational data which will decide (if it hasn’t already) what is the actual reality.
I’ll go with Feynman’s ruling….
In the west, US will be hot as in Africa. Meridional circulation.
http://earth.nullschool.net/#2014/08/17/0600Z/wind/isobaric/1000hPa/overlay=temp/orthographic=-88.74,26.93,481
Greg Goodman says:
………
You probably missed my earlier comment:
Its spectrum’s principal components are 9.1 and 64.5 years, which is more or less the AMO’s spectral composition.
http://wattsupwiththat.com/2014/08/11/a-gleissberg-solar-minimum/#comment-1707534
Aliasing frequency? You bet, there is!!
Interaction between variables all run by different clocks.
Solar magnetic input:
Carrington rotation of 27.2753 days
Ocean tidal system:
The draconic month 27.212days
The anomalistic month 27.554days
The tropical month 27.321 days
The sidereal month 27.321 days
Earth’s magnetic input:
The outer liquid core (generator of the magnetic field) also responds to the above luni-solar tides clock (as per A. Jackson, major expert in the field).
Energy input:
Solar insolation at 365.25 days
Monthly data averaged at a rate 11% longer than the luni-solar time base.
Data is synchronized with the energy input, but out of sync with factors controlling the energy distribution. .
From moreCarbonOK[&theWeatherisalwaysGood]HenryP (Henry Pool) on August 12, 2014 at 1:30 pm:
If you think I am here to listen wiseguys like you and Leif you are thoroughly mistaken. I am trying to educate you all on what is lying ahead of us. Note the first comment on this thread. It seems markstoval also figured it out.
From markstoval on August 11, 2014 at 12:18 pm:
(…) We have built our societies and infrastructure based on the mistaken belief that the climate could never return to that of the Little Ice Age but we might be very wrong in that. Feeding 7 Billion people in a little ice age will be demanding at best.
We have significantly advanced in agriculture since the previous Little Ice Age. Crop yields per worker have greatly increased from just mechanization. We have developed techniques like nutrient film hydroponics and even aeroponics that allow people to inexpensively grow their own food without tilling soil, even where they have no soil to till.
Feeding 7 billion people in a little ice age will not be demanding at all, from a capability standpoint. We could feed twice that many. What will be demanding then is the same thing making it demanding now, paying for it all, at sufficient levels of financial compensation to induce producers and distributors to continue supplying it.
What Mark Stoval was saying is the colder climate will make the feeding demanding. That is not the case.
And as for our societies and infrastructure, our building codes generally require greater insulation and weatherization than what was known in the LIA, we have more durable roads and snowplows, we have central heating and grid-supplied electricity. We even have safer food supplies, from improved canning to refrigeration to better food preservatives. We have 4×4 and all-terrain vehicles, and snowmobiles.
We have built our societies and infrastructure to far better withstand the possible conditions of a new little ice age than they were at the end of the last one. If the mistaken belief was we would never see those conditions again, it certainly doesn’t show.
You said it seemed Mark Stoval had figured it out. He’s wrong on both of his two major points. If you agree with him that is what’s to come and why, then you are also wrong.
Thanks Vuk’ , i had indeed missed that earlier post:
“Hi Greg
GeoSolar cycle is derived directly from geomagnetic field response to the solar activity.
Its spectrum’s principal components are 9.1 and 64.5 years, which is more or less the AMO’s spectral composition.”
This 9.1 is found everywhere ( until Hadley start messing with the spectral content of the data ).
It is a strong component in cross-correlation of N. Atl and N. Pacific SST. Scafetta finds it in Aurora data.
So what IS this “geomagnetic field response”? Give me something I plot and analyse, not words !
http://climategrog.wordpress.com/?attachment_id=754
NB refer to the text for accurate periods, graph is approximate cursor readout only.
http://climategrog.wordpress.com/?attachment_id=755
As I said above this period corresponds to the superposition of two periods of lunar origin 8.85 and 9.3y . That combo will produce a modulation frequency of about 365 _years_. Odd number, but that’s another storey.
If this is a prominent feature in some “geo-solar” magnetic effect, it would be very interesting to see how that could arise but I still have no idea what you are actually plotting and what the data source(s) is(are).
It’s a couple of years that you’ve been posting this graph, it’s long over due that you say _exactly_ what it is you are plotting, so others can reproduce it. Otherwise it becomes a joke.
Greg Goodman says:
August 13, 2014 at 1:53 am
It (9.1 years) is a strong component in cross-correlation of N. Atl and N. Pacific SST. Scafetta finds it in Aurora data.
…………..
Not surprised, it doesn’t come from the sun directly, it comes from the geo-solar (sun-earth) magnetic cycle
9.1 years is rock steady, while 64 when extrapolated back to 1700, it drifts in range 58-67 years .
GSC-spec
“The sunspot number is the lowest in a hundred years and the global temperature is at all-time highs.” – Leif Svalgaard
This sequence of flashbacks begins at a time in history when it was still safe to print a story titled “snowfalls are now a thing of the past” in a newspaper without being ridiculed.
==============
Scientists blame sun for global warming
BBC
February 13, 1998
Climate changes such as global warming may be due to changes in the sun rather than to the release of greenhouse gases on Earth.
Climatologists and astronomers speaking at the American Association for the Advancement of Science meeting in Philadelphia say the present warming may be unusual – but a mini ice age could soon follow.
==============
Sunspots reaching 1,000-year high
By Dr David Whitehouse (BBC)
July 6, 2004
A new analysis shows that the Sun is more active now than it has been at anytime in the previous 1,000 years.
Scientists based at the Institute for Astronomy in Zurich used ice cores from Greenland to construct a picture of our star’s activity in the past.
They say that over the last century the number of sunspots rose at the same time that the Earth’s climate became steadily warmer
==============
A First! Snow Falls in Baghdad
By CHRISTOPHER CHESTER (AP)
Jan 11, 2008
==============
Arctic blast brings London earliest snow for 70 years
Mark Prigg (Evening Standard)
Oct 10, 2008
It is a sight not seen in the capital since 1934.
Londoners today woke up to the earliest snow cover for more than 70 years as a freezing blast of wind from the Arctic hit the capital.
==============
Spokane, Washington., residents cope with record snow
By NICHOLAS K. GERANIOS (AP)
Jan 7, 2009
SPOKANE, Wash. (AP) – More than 6 feet of snow in the past three weeks has left Spokane residents frustrated. Tempers are so frayed that a man was arrested for shooting at a snow plow operator.
==============
The day the sea froze: Temperatures plunge to MINUS 12C and forecasters say it won’t warm up until Sunday
By Daily Mail Reporter
Jan 8, 2009
Temperatures plunged so low yesterday that the sea actually began to freeze as Arctic conditions continued to grip the UK.
In the exclusive enclave of Sandbanks in Poole, Dorset, a half-mile stretch along the shoreline reaching about 20 yards out to sea is covered in ice.
================
Where’s global warming?
By Jeff Jacoby, Globe Columnist
March 8, 2009
[…] The United States has shivered through an unusually severe winter, with snow falling in such unlikely destinations as New Orleans, Las Vegas, Alabama, and Georgia. On Dec. 25, every Canadian province woke up to a white Christmas, something that hadn’t happened in 37 years. Earlier this year, Europe was gripped by such a killing cold wave that trains were shut down in the French Riviera and chimpanzees in the Rome Zoo had to be plied with hot tea. Last week, satellite data showed three of the Great Lakes – Erie, Superior, and Huron – almost completely frozen over. In Washington, D.C., what was supposed to be a massive rally against global warming was upstaged by the heaviest snowfall of the season, which paralyzed the capital.
===================
‘Quiet Sun’ baffling astronomers
By Pallab Ghosh (BBC News)
April 21, 2009
The Sun is the dimmest it has been for nearly a century.
[…] In the mid-17th Century, a quiet spell – known as the Maunder Minimum – lasted 70 years, and led to a “mini ice-age”.
This has resulted in some people suggesting that a similar cooling might offset the impact of climate change.
According to Prof Mike Lockwood of Southampton University, this view is too simplistic.
“I wish the Sun was coming to our aid but, unfortunately, the data shows that is not the case,” he said.
=========
Children die in harsh Peru winter
By Dan Collyns (BBC News, Lima)
July 12, 2009
Almost 250 children under the age of five have died in a wave of intensely cold weather in Peru.
==========
‘Quiet’ sun could mean cooler days
STEPHEN CAUCHI (The Age)
September 13, 2009
THE number of sunspots has declined dramatically in the past two years – but scientists say it is too early to tell if it is the start of a solar depression that could lead to cooler weather on Earth.
Over the past millennium, whenever the sun has had long periods of low sunspot numbers, Earth has weathered equally long cold snaps. The most famous of these was the Maunder Minimum of 1645 to 1715, when sunspots all but vanished for 70 years. It coincided with the coldest period of the Little Ice Age.
For the past two years, sunspots – dark and intensely magnetic blotches on the sun’s surface – have been at their fewest since 1913.
============
Beijing’s Heaviest Snow in 54 Years Strands Thousand
Bloomberg News
Nov 12, 2009
[…] In Beijing, snowfall is the heaviest since weather data began in 1955, according to the administration’s Web site.
============
Heavy snow continues as temperatures set to plunge minus 20C
Herald, Scotland
Jan 6, 2010
Heavy snow has brought more chaos to parts of Scotland amid warnings that temperatures could plunge to minus 20C this weekend.
The prolonged Arctic blast is now the worst cold spell seen in Scotland for almost 50 years, according to the First Minister.
============
Quiet sun puts Europe on ice
New Scientist
May 4, 2010
[…] The research finds that low solar activity promotes the formation of giant kinks in the jet stream. These kinks can block warm westerly winds from reaching Europe, while allowing in winds from Arctic Siberia. When this happens in winter, northern Europe freezes, even though other, comparable regions of the globe may be experiencing unusually mild conditions.
Mike Lockwood at the University of Reading in the UK began his investigation because these past two relatively cold British winters coincided with a lapse in the sun’s activity more profound than …
============
Freeze Challenges Power Supply
(Xinhua, China)
Jun 1, 2010
Most parts of China were seized by a sustained cold snap Wednesday, when the minimum temperature hit a 40-year low in Beijing and a rare snowstorm in the central Hubei Province kept all school children at home.
The Beijing weather bureau said the capital had its lowest temperature in 40 years at daybreak Wednesday, when the low was minus 16.7 degrees Celsius.
============
BRITAIN FACES A MINI ‘ICE AGE’
By Laura Caroe (Express UK)
Oct 11, 2011
BRITAIN is set to suffer a mini ice age that could last for decades and bring with it a series of bitterly cold winters.
And it could all begin within weeks as experts said last night that the mercury may soon plunge below the record -20C endured last year.
Scientists say the anticipated cold blast will be due to the return of a disruptive weather pattern called La Nina. Latest evidence shows La Nina, linked to extreme winter weather in America and with a knock-on effect on Britain, is in force and will gradually strengthen as the year ends.
The climate phenomenon, characterised by unusually cold ocean temperatures in the Pacific, was linked to our icy winter last year – one of the coldest on record.
And it coincides with research from the Met Office indicating the nation could be facing a repeat of the “little ice age” that gripped the country 300 years ago, causing decades of harsh winters.
The prediction, to be published in Nature magazine, is based on observations of a slight fall in the sun’s emissions of ultraviolet radiation, which may, over a long period, trigger Arctic conditions for many years.
=============
US weather in pictures: ‘Polar vortex’ brings big freeze to North America
Telegraph UK
Aug 13, 2014
=============
http://en.wikipedia.org/wiki/2013%E2%80%9314_North_American_cold_wave
“The typical polar vortex configuration in November, 2013”
http://en.wikipedia.org/wiki/File:November2013_polar_vortex_geopotentialheight_mean_Large.jpg
“A wavy polar vortex on January 5, 2014”
http://en.wikipedia.org/wiki/File:Jan52014_polar_vortex_geopotentialheight_mean_Large.jpg
=============
And that’s only the tip of the Gleissberg.
kadaka (KD Knoebel) says:
“The only force the planets could exert on the Sun that is possibly worth mentioning is gravity.”
It’s not really worth mentioning, and as it happens, the nature of the configurations involved precludes any gravitational mechanisms.
“Thus in that one line you did supply me with enough information to form an opinion, and the opinion was and is you’re spouting quackery. Further reading of your scribblings cannot improve that opinion, only the retraction of your obviously erroneous statement could help.”
No it was not enough information to form an opinion, the erroneous statements and quackery are your own, by assuming that you know best about the mechanisms.
Predicted shape of the polar vortex on 23 August. Further cooling of the South Pacific. Blockade in the region of Australia.
http://www.cpc.ncep.noaa.gov/products/stratosphere/strat_a_f/gif_files/gfs_z70_sh_f240.gif
Vuk : “Not surprised, it doesn’t come from the sun directly, it comes from the geo-solar (sun-earth) magnetic cycle” ….. WHICH IS …. ????
Your reluctance to say exactly what it is that you plotted, despite numerous explicit requests is starting to look suspect.
I’m trying to take what you present seriously but it’s getting harder in the face of this constant evasion.
Greg.
Khwarizmi:
500 mb (hPa) is not the polar vortex, but the troposphere (about 5 km). Circulation at this altitude is consistent with the jet stream, which in the winter is strictly dependent on velocity (strength) of the polar vortex.
http://upload.wikimedia.org/wikipedia/commons/b/bb/Jan52014_polar_vortex_geopotentialheight_mean_Large.jpg
“Since polar vortices exist from the stratosphere downward into the mid-troposphere,[2] a variety of heights/pressure levels within the atmosphere can be checked for its existence. Within the stratosphere, strategies such as the use of the 4 mb pressure surface, which correlates to the 1200K isentropic surface, located midway up the stratosphere, is used to create climatologies of the feature.[7] Due to model data unreliability, other techniques use the 50 mb pressure surface to identify its stratospheric location.[8] At the level of the tropopause, the extent of closed contours of potential temperature can be used to determine its strength. Horizontally, most polar vortices have a radius of less than 1,000 kilometres (620 mi).[9] Others have used levels down to the 500 hPa pressure level (about 5,460 metres (17,910 ft) above sea level during the winter) to identify the polar vortex.”
http://en.wikipedia.org/wiki/Polar_vortex
Khwarizmi says:
August 13, 2014 at 4:00 am
I’m not sure what your list of newspaper article is supposed to show. There are one or two predictions which haven’t been borne out (yet) and a few cold weather related headlines. However, there have been plenty of warm weather records broken over the same period. For example
The CET is currently showing that, to date, 2014 is the warmest year on record.
From Ulric Lyons on August 13, 2014 at 4:52 am:
It’s not really worth mentioning, and as it happens, the nature of the configurations involved precludes any gravitational mechanisms.
Ah, so in your system it is planetary configurations that cause solar minimums, namely special ones where the gravitational effect of Jupiter is minimized.
Well why don’t you just come right out and say you’re talking about Astrology? I evaluated your statement like you were presenting real-world science. My mistake.
Ulric says
http://wattsupwiththat.com/2014/08/11/a-gleissberg-solar-minimum/#comment-1708152
Henry says
My point exactly. That is why I said: better to ignore wise guys here who know it all. What are they doing here anyway?
What is your date for the sun reaching its minimum solar field strengths, I would be interested to know. You don’t have to give me the planetary configurations, I figured that out myself. I just want to check if we have the same date for the switch to higher field strengths.
kadaka (KD Knoebel) says:
“Ah, so in your system it is planetary configurations that cause solar minimums, namely special ones where the gravitational effect of Jupiter is minimized.”
I have already told you that the nature of the configurations precludes gravitational mechanisms. I will address the proposed mechanisms after I have exhibited the various configurations.
Edison’s light bulb filament
http://sohowww.nascom.nasa.gov//data/REPROCESSING/Completed/2014/c2/20140812/20140812_2224_c2_1024.jpg
Milo, how long have you been reading this blog????
The step wise increase rate as been seen before. Same rate of increase (though at different starting points in term of SST). The mechanism is easily identified. A series of El Nino’s with few strong La Ninas inbetween the step rises. That was a very easy question. I didn’t, as you say, dodge it because the mechanism is so obvious I figured you would understand the El Nino process from my first response, and recall the several excellent posts on how the SST data set has demonstrated this before.
You will love this site. It’s from the EPA. Note the rate of increase in previous decades and then a partial cooling down. It just happens that the increase started again. That is not uncommon given that El Nino increases and La Nina decreases in sea surface temperatures are not opposites of each other. It is a herky jerky battle that sways one way and then another but over long periods of time kinda evens out. Humans do well when oceans are evaporating stored heat.
http://www.epa.gov/climatechange/science/indicators/oceans/sea-surface-temp.html
vukcevic says:
August 13, 2014 at 5:28 am
Greg Goodman says: August 13, 2014 at 5:15 am
I’m trying to take what you present seriously but…
…………..
I don’t, no reason why you should either, … I did say Well, that is as clear as mud, so it is by far wiser to ignore it all…
===========
Well I agree about that in relation to your rather vague explanations of feedbacks, delays etc. I was inclined to ignore that but the graph looked interesting. A very strong 9.1y peak in some magnetic data would certainly be worth investigation.
So are you also saying that, having linked to this graph on at least half a dozen threads, you are now too embarrassed to provide a usable account of what it was you were plotting as “geo-solar cycle” and we should better forget you ever mentioned it?
I get the impression there’s a rather big “oops” behind all this, that you’re trying to avoid admitting.
Greg
HenryP: “You don’t have to give me the planetary configurations, I figured that out myself”
Oh cool. Then perhaps you could explain what this planetary configurations thing is, Ulric does not yet seem to have this in a form that can be communicated. There have been several attempts but no one seem quite there yet.
Since you’ve already figured it all out, perhaps you can explain it.
vukcevic says:
August 13, 2014 at 12:03 am
Your theoretical treatise from 1977, may have been at the time, the corner stone of understanding, then at the end of 2008 NASA’s Themis project comes with the series of observational data that contradict conclusions of your work.
Wrong on two points:
1) my 1977 paper was a observational paper. Modern data fully support the earlier findings: http://www.leif.org/research/Coupling-Function-AMS93.pdf
2) no contradictions were found. If you think so, produce links to papers contradicting me
Greg Goodman says:
“Ulric does not yet seem to have this in a form that can be communicated.”
Err, yes I do…
http://wattsupwiththat.com/2014/08/11/a-gleissberg-solar-minimum/#comment-1707627
John: “The CET is currently showing that, to date, 2014 is the warmest year on record”
Well it’s mid August, most of the cold part of the year is still missing , quite what they are showing as 2014 seems undocumented. Also it is pretty obvious they are using this spurious incomplete year to pad out the data to run filter up to the end of data. Also undocumented and fundamentally unsound practice, especially since they even use the same line colour for the fictional padded part of the filter.
The Met Office web site no longer seems to show the SST record as a time series !!!
I wonder why that is .
Ulric: Err, yes I do…
http://wattsupwiththat.com/2014/08/11/a-gleissberg-solar-minimum/#comment-1707627
So we all have to come round for a cup of tea and sit on your lap while you run through it one astronomic software you have.
Let us know when you have it in a more conventional form of scientific communication. But hurry up because it’s looks like HenryP is about to get the jump on you. He’s got it all figured out 😉
I wonder why some people insist on not evaluating the data properly. As is obvious by looking at the data the sun had a Grand Maximum last century. Post 2005 the sun is likely in a Grand Minimum so to extrapolate future solar activity based on the Grand Maximum of last century is absurd.
If one post data showing sunspot cycles 19-23 versus solar cycle 24 post 2005 one will see that the sun has under gone a significant change in activity.
The severe solar lull of 2008-2010 was not seen by anyone and is a great example of how absurd it is to try to imply what will happen to solar activity going forward based on solar variations last century. The lull of 2008-2010 did not come close to happening during the recent solar maximum of the last century and because it did not happen then it was assumed nothing of the sort would happen post 2005.
The problem is the denial that solar variability is indeed greater then thought and that a dramatic change in solar activity (variability ) took place post 2005 in comparison to the last century.
Based on what has happened expect solar activity to be much weaker then is forecasted which is based on a bogus premise of forecasting future solar activity based on a period of time when the sun was in an extremely active mode of activity.
Again very foolish and absurd.
To carry this further expect the climate to also respond since the sun has gone from an extremely active mode of operation last century to an extremely quiet mode of operation post 2005.
The trend in global temperatures was up when the sun displayed very high activity last century conversely the trend in global temperatures will be down this century as the sun now is once again in a very inactive mode of operation.
The data will bear this out and already is indicating this to be so since the global temperature trend rise has now ended and the atmospheric circulation has now become much more meridional.
Two predictions I made several years ago.
Greg Goodman says:
“Well it’s mid August, most of the cold part of the year is still missing ,”
Most of the “cold part” of the year is in Jan & Feb, and the deviations from the average can be greater in the winter, which is why CET is running so warm this year.
http://climexp.knmi.nl/data/tcet.dat
“anyone who wishes to inspect the findings in detail would need their own astronomy program anyway.”
Well I don’t know what you are seeing that you think explains solar activity. I would not be at all surprised to find there is a link to planets in some way. Everyone has astronomy software available in the form of the openly accessible JPL ephemeris. You just need to explain what you are doing and it should be reproducible.
“The sunspot number is the lowest in a hundred years and the global temperature is at all-time highs.” – Leif Svalgaard
,
The reality is sunspot activity and solar magnetic activity was at an all time high through out last century and global temperatures responded to that high solar/magnetic activity as expected.
Further lag times are involved due to the accumulation of ocean heat content which was due to the high prolonged solar activity of the last century. This has now come to end and global temperatures going forward will no longer rise but fall. They will no longer be near all time highs while the sun exhibits prolonged minimal activity.
More bad assumptions and a lack of understanding of the climatic system and how it responds.
Greg Goodman says:
Your comment is awaiting moderation.
August 13, 2014 at 6:56 am
reposting this one, stuck in moderation for using the name of he shall not be mentioned….
vuk says:
August 13, 2014 at 5:28 am
Greg Goodman says: August 13, 2014 at 5:15 am
I’m trying to take what you present seriously but…
…………..
I don’t, no reason why you should either, … I did say Well, that is as clear as mud, so it is by far wiser to ignore it all…
===========
Well I agree about that in relation to your rather vague explanations of feedbacks, delays etc. I was inclined to ignore that but the graph looked interesting. A very strong 9.1y peak in some magnetic data would certainly be worth investigation.
So are you also saying that, having linked to this graph on at least half a dozen threads, you are now too embarrassed to provide a usable account of what it was you were plotting as “geo-solar cycle” and we should better forget you ever mentioned it?
I get the impression there’s a rather big “oops” behind all this, that you’re trying to avoid admitting.
Greg
More of the same and solar is not any where near my criteria for cooling effect, although overall solar activity has been quite low post 2005 despite this recent maximum of solar cycle 24 which is now in the process of ending. Once it ends solar conditions should approach my criteria over a long duration of time which should start global temperatures on the decline.
What has taken place in year 2005 is a complete change from active to inactive solar activity.
This change in my opinion will be more then enough to have another climatic impact just as is the case when one reviews historical climatic data.
My challenge remains- Which is to show me the data which shows a prolonged solar minimum period being associated with a rising temperature trend or a prolonged maximum solar period being associated with a falling temperature trend.
I find no such data and the same result is going to happen as this decade proceeds.
Already solar activity is falling off and we are no where near the bottom of the solar cycle 24-solar cycle 25 minimum.
I think the data (especially post 2005/prior to 2005 ) supports the view that the sun can be quite variable and this variability can happen over a short period of time as is the case in the first decade of this current century.
Expect climate implications if this prolonged solar minimum keeps advancing going forward.
The problem with so many postings is there is a lack of understanding of noise in the climate system, thresholds in the climate system ,lag times in the climate system and that the climate system is non linear and never in the same state.
Therefore my point (which I have made many time previously) is DO NOT EXPECT an x change in the climate from given x changes in items that control the climate. This I have preached but with little fanfare.
Why- look read below.
The initial state of the global climate.
a. how close or far away is the global climate to glacial conditions if in inter- glacial, or how close is the earth to inter- glacial conditions if in a glacial condition.
b. climate was closer to the threshold level between glacial and inter- glacial 20,000 -10,000 years ago. This is why the climate was more unstable then. Example solar variability and all items would be able to pull the climate EASIER from one regime to another when the state of the climate was closer to the inter glacial/glacial dividing line, or threshold.
The upshot being GIVEN solar variability IS NOT going to have the same given climatic impact.
Solar variability and the associated primary and secondary effects. Lag times, degree of magnitude change and duration of those changes must be taken into account.
Upshot being a given grand solar minimum period is not always going to have the same climatic impact.
This is why solar/climate correlations are hard to come by UNLESS the state of solar activity goes from a very active state to a very prolonged quiet state which is what has happened during year 2005.
So the nonsense that post Dalton no definitive solar /climate correlations exist just supports my notions of what I just expressed.
Meanwhile, a quiet sun is correlated with a stronger more meridional jet stream pattern which should cause a greater persistence in Wx. patterns which I think is evident post 2005 for the most part.
vuk says:
August 13, 2014 at 12:03 am
Your theoretical treatise from 1977, may have been at the time, the corner stone of understanding, then at the end of 2008 NASA’s Themis project comes with the series of observational data that contradict conclusions of your work.
Wrong on two points:
1) my 1977 paper was a observational paper. Modern data fully support the earlier findings: http://www.leif.org/research/Coupling-Function-AMS93.pdf
2) no contradictions were found. If you think so, produce links to papers form the Themis project contradicting me
http://www.actuaries.org/HongKong2012/Papers/WBR9_Walker.pdf
Great info. on solar/climate connections which I subscribe to .
Ah look, you’re on the tweety!
(1 in 100 might know that line.)
https://twitter.com/Ulric_Lyons
Originator of Planetary Ordered Solar Theory. The only deterministic long range weather and climate forecasts.
Somerset, England
Joined April 2010
You tweeted a reply back on Jan 2, and before that you retweeted, and retweeted, and retweeted…
Why did the little yellow Tweety bird lose a Twitter war with Sylvester the cat? Too many retweets.
Ah, here’s one, October 23, 2013:
https://twitter.com/Ulric_Lyons/status/392955820368883712
“Arctic sea ice loss is due to negative NAO, the opposite of a warming signal.”
http://www.cpc.ncep.noaa.gov/products/precip/CWlink/pna/month_nao_index.shtml
So from the heights of 1979 at the start of the satellite record, there was a positive NAO regime during the ongoing extent losses to about 1995… Wait, that can’t be right, you said it was negative NAO.
But then it switched over to a negative regime for the ongoing extent loss from which the ice is only now perhaps starting to recover. Likewise it can be seen it was primarily a negative regime from 1950 to 1979… Preceding the 1979 Arctic sea ice highs.
I think that tweet needs some expanding as to what type of negative NAO signal and when it will bring about the sea ice loss. It’s going negative right now. Will this be another terrible year for the ice?
Kadaka
Jupiter, on the other hand, is 318 times as massive as Earth. Therefore, the barycenter of Jupiter and the Sun is a bit further from the Sun’s center. So, as Jupiter revolves around the Sun, the Sun itself is actually revolving around this slightly off-center point, located just outside its surface.
The barycenter “wobble” gives us a way to find planets around other stars.
Thus, a planet the size of Jupiter will make its star wobble a tiny bit. This picture shows you that the center of mass of a star and the barycenter of a star and a planet can be slightly different points.
http://spaceplace.nasa.gov/barycenter/en/barycenter.en.gif
http://spaceplace.nasa.gov/barycenter/en/
ren says:
August 13, 2014 at 8:43 am
Jupiter, on the other hand, is 318 times as massive as Earth. Therefore, the barycenter of Jupiter and the Sun is a bit further from the Sun’s center. So, as Jupiter revolves around the Sun, the Sun itself is actually revolving around this slightly off-center point, located just outside its surface.
Consider a double star system with both stars having the same mass. Each star is then ‘actually’ orbiting their common barycenter which is halfway between the two stars, but an observer on either star would not feel a thing. Orbiting a barycenter position, no matter where, has no effect on either star, or on the Sun [for the Sun-Jupiter system].
kadaka (KD Knoebel) says:
“Why did the little yellow Tweety bird lose a Twitter war with Sylvester the cat?”
No not all, I don’t like using twitter.
“So from the heights of 1979 at the start of the satellite record, there was a positive NAO regime during the ongoing extent losses to about 1995… Wait, that can’t be right, you said it was negative NAO.”
There was a very positive NAO late 1978 which is why the ice extent peaked then. Cherry picking that start point doesn’t prove anything about the trend up to 1995, why not start earlier in the 1970’s: http://snag.gy/gSIaw.jpg
The Arctic ocean cooled from late 1979 to early 1995: http://snag.gy/mfOI7.jpg
As did the heat content of the high Atlantic:
http://bobtisdale.files.wordpress.com/2012/10/4-northern-no-atl.png
The acceleration of sea ice loss is in two steps, from 1995-1998, and from 2005 onwards (albeit with a slight recent respite due to moderately more positive NAO conditions in the last ~2yrs):
http://arctic.atmos.uiuc.edu/cryosphere/IMAGES/seaice.anomaly.arctic.png
“The acceleration of sea ice loss is in two steps, from 1995-1998, and from 2005 onwards ”
Rate of ice loss was increasing until somewhere around 2007 when it started slowing.
http://climategrog.wordpress.com/2013/09/16/on-identifying-inter-decadal-variation-in-nh-sea-ice/
@kadaka
I forgot the NAO link, increased negative NAO 1995-1998, and 2005 onwards:
http://www.cpc.ncep.noaa.gov/products/precip/CWlink/pna/nao.timeseries.gif
Salvatore Del Prete says:
August 13, 2014 at 8:05 am
The reality is sunspot activity and solar magnetic activity was at an all time high through out last century
No so. Solar activity has been about equally high in each of the last three centuries.
Greg Goodman says:
August 13, 2014 at 9:33 am
“Orbiting a barycenter position, no matter where, has no effect on either star…”
… insofar as the bodies can be treated as point masses.
Just make the distance between the stars large enough. For small distances, tidal effects become important, but they do not depend on where the barycenter is, only on the ratio between the diameter and distance.
Dr. Svalgaard says: produce a paper !
Greg Goodman says: there’s a rather big “oops” behind all this !
Pamela Gray says: Vuk keeps secrets!
I mention a back extrapolation to 1700, so let’s see how it compares with the AMO/NAO.
There is also Mann’s reconstruction (I’ll show that on another occasion), however the rainfall in British isles is well correlated to the AMO; a stalagmite proxy from Scotland :
(ftp://ftp.ncdc.noaa.gov/pub/data/paleo/treering/reconstructions/amo-gray2004.txt
data scaled down by factor of 4)
correlation with the GSO 1710-1815 looks good, but it totally fails during the Dalton minimum.
Miss Gray tells us it is the burst of volcanic activity, managed to cool instantly the ocean surface, no evaporation in the N. Atlantic no rain, but the geo-solar magnetic oscillations suggest positive AMO for the period.
However, there is another well known N. Atlantic variable, the NAO (often in and out of phase with the AMO), reconstruction from C. Folland –MetOffice
data: ftp://ftp.ncdc.noaa.gov/pub/data/paleo/treering/reconstructions/snao-folland2009.txt )
Indeed the NAO-GSO correlation at time of Dalton confirms the fact that Dalton SST fell because of the volcanic eruptions at the time.
Comparison result is shown here:
GSO-AMO-NAO-reconstructions 1700+
Thus:
@ Dr. Svalgaard: I don’t bother with papers, data clearly shows that the Earth’s climate parameters responds to solar magnetic polarity input.
@ Greg Goodman: there’s NO a big “oops” (may be a modest ‘wow’) behind all this !
@ Pamela Gray: No secrets, the Dalton AMO was trashed by volcanic eruptions.
Ms Gray, congratulations; you win this contest.
Greg Goodman says:
“Rate of ice loss was increasing until somewhere around 2007 when it started slowing.”
These are the steps that correlate to the increased negative NAO episodes:
http://snag.gy/3mgZy.jpg
Ren
Thanks for the links.
Intensity of solar activity is closely synchronised with the periods when the Jupiter’s magnetosphere tail (once every 19.6) years links into the Saturn’s magnetosphere.
Leif Svalgaard says:
August 11, 2014 at 9:54 pm
“M Simon says:
August 11, 2014 at 9:52 pm
And yet low sun spot numbers correlate well with periods of cooling.
“Doesn’t look that way to me. The sunspot number is the lowest in a hundred years and the global temperature is at all-time highs”.
Leif, with all due respect but the claim you just made of lowest sunspot numbers in a hundred years and all time global temp records is flabbergasting from my point of view and hopefully also from the view of WUWT crowd.
Your all time high global temperature claim is total BS of course and reflects the debunked hockey stick saga.
Nice to know which doctrine you really support.
R. de Haan says:
August 13, 2014 at 11:26 am
Global temperature was higher than now c. 1000, 2000, 3000 & 5000 to 8000 years ago. It was probably also higher during the 1930s-40s, but the books have been thoroughly cooked to a crisp, so can’t be sure.
And of course the Eemian & other previous interglacials were warmer than the Holocene, the Pliocene was warmer than the Pleistocene, the Miocene warmer than the Pliocene, at least parts of the Oligocene warmer than the Miocene, the Eocene a lot warmer than the Oligocene, the Paleocene about as warm as the Eocene and parts of the Cretaceous even hotter still.
R. de Haan says:
August 13, 2014 at 11:26 am
Your all time high global temperature claim is total BS of course and reflects the debunked hockey stick saga.
We just need to go back a bit more than 100 years [to stay out of hockey-stick trouble]:
http://jameswight.files.wordpress.com/2010/07/global-land-temperature-reconstructions.png
You want to quibble with the data? The data that some people say support their notion that ‘it is the Sun, Stupid’. Keep me out of that.
Greg says
Since you’ve already figured it all out, perhaps you can explain it.
Henry says
This is the same old story. William Arnold picked up on it, 1985, I followed up on it and confirmed it, including the bending points on the ozone decrease/increase, as discussed earlier,
http://blogs.24.com/henryp/2013/04/29/the-climate-is-changing/
My results are there for everyone to read, if they want to. Ridicule me if you like, check the worry about that in my eyes?
I suspect Ulric also figured it out, since he is not open and honest with me about it [trying to hide it? until when?]
@Salvatore del Prete;
When you make a comment, tell us whom you are addressing it to. That makes the blog more interesting. Otherwise it looks like you are talking to yourself (using an another alias to answer your positions). Please stop this nonsense
FYI
It is globally cooling, from before the millennium. You should be able to work that out from the formulae at the end of each table;
http://blogs.24.com/henryp/files/2013/02/henryspooltableNEWc.pdf
It is either globally cooling or warming. There is no pause. There is no AGW, as my table for minima shows.
Leif Svalgaard says: August 13, 2014 at 11:05 am
You didn’t do that and you “don’t bother with papers”. I say ‘put up or shut up’.
…………….
Some you win, but this one you loose, science doesn’t stay still, new evidence tramps outdated views.
The evidence is in the data all the way back to 1700, and the NASA says there is the observational evidence as shown in their video presentation
There is also the LOD variability as shown from the data by Jeremy Bloxham from Harvard University, who just happen to be in the Ren’s Jupiter video (further up in the thread).
I hope you aren’t going to accuse him of fiddling the data.
Data here, there, everywhere… your honour the defence calls on ‘R. Feynman v.s. Crown’ case.
Greg says
Since you’ve already figured it all out, perhaps you can explain it.
Henry says
This is the same old story. William Arnold picked up on it, 1985, I followed up on it and confirmed it, including the bending points on the ozone decrease/increase, as discussed earlier,
http://blogs.24.com/henryp/2013/04/29/the-climate-is-changing/
My results are there for everyone to read, if they want to. Ridicule me if you like, check the worry about that in my eyes?
I suspect Ulric also figured it out, since he is not open and honest with me about it [trying to hide it? until when?]
@SdP;
When you make a comment, tell us whom you are addressing it to. That makes the blog more interesting. Otherwise it looks like you are talking to yourself (using an another alias to answer your positions). Please stop this nonsense
FYI
It is globally cooling, from before the millennium. You should be able to work that out from the formulae at the end of each table;
http://blogs.24.com/henryp/files/2013/02/henryspooltableNEWc.pdf
It is either globally cooling or warming. There is no pause. There is no AGW, as my table for minima shows.
Greg says
Since you’ve already figured it all out, perhaps you can explain it.
Henry says
This is the same old story. William Arnold picked up on it, 1985, I followed up on it and confirmed it, including the bending points on the ozone decrease/increase, as discussed earlier,
My results are there for everyone to read, if they want to. Ridicule me if you like, check the worry about that in my eyes?
I suspect Ulric also figured it out, since he is not open and honest with me about it [trying to hide it? until when?]
@Salvatore del Prete;
When you make a comment, tell us whom you are addressing it to. That makes the blog more interesting. Otherwise it looks like you are talking to yourself (using an another alias to answer your positions). Please stop this nonsense
FYI
It is globally cooling, from before the millennium. You should be able to work that out from the formulae at the end of each table;
http://blogs.24.com/henryp/files/2013/02/henryspooltableNEWc.pdf
It is either globally cooling or warming. There is no pause. There is no AGW, as my table for minima shows.
Without any comment: http://chiefio.wordpress.com/2014/08/04/what-a-coincidence/
R de Haan [must be a clever dutchman like me]
says
of Leif Svalgaard:
Nice to know which doctrine you really support.
Henry says
You got that right. Anyone can/should be able to figure out that it is globally cooling
http://blogs.24.com/henryp/files/2013/02/henryspooltableNEWc.pdf
and that there is no AGW
following the correct sampling technique
http://blogs.24.com/henryp/2013/02/21/henrys-pool-tables-on-global-warmingcooling/
but he has to find a way to keep the money rolling [into his pocket]?
Greg Goodman says:
August 13, 2014 at 7:14 am
John: “The CET is currently showing that, to date, 2014 is the warmest year on record”
Well it’s mid August, most of the cold part of the year is still missing , quite what they are showing as 2014 seems undocumented.
The coldest months are January and February but that’s irrelevant. The comparison I made is with the Jan-July period of previous years. See here
http://www.metoffice.gov.uk/hadobs/hadcet/cet_info_mean.html
Every month in 2014 has been 1 to 2 degrees above the 1961-90 mean.
vukcevic says:
August 13, 2014 at 11:40 am
“The evidence is in the data all the way back to 1700, and the NASA says there is the observational evidence as shown in their video presentation”
_________________________
You have embedded a video which shows the Solar wind’s interaction with the Earth’s magnetosphere is influenced by gravitational effects of a mysterious Planet X.
Did I get that right?
John Finn says:
August 13, 2014 at 12:34 pm
The Met’s books are cooked, but even so, every month in 2014 has been lower than many years during the Medieval Warm Period, let alone the even warmer Roman & Minoan Warm Periods & the long Holocene Climatic Optimum. The majority of years during the Holocene have been warmer than 2014, to say nothing of the Eemian & MIS 11 interglacials.
Vuk’ : “Greg Goodman says: there’s a rather big “oops” behind all this !”
No, Greg Goodman says: “I get the impression there’s a rather big “oops” behind all this, that you’re trying to avoid admitting.”
Greg Goodman says: “A very strong 9.1y peak in some magnetic data would certainly be worth investigation.”
But yet again, again, you evade saying what the actual data you call “geo-solar cycle” actually is and refuse to provide a source for whatever it is you are plotting.
I have no idea what your game is, or why you keep popping up these plots of meaningless, unreferenced squiggles in the pretence that it shows something.
There is no logical reason in a scientific discussion that you would so pointedly and repeatedly avoid saying what it is you are plotting. It makes the whole thing without any merit or value.
Unattributed squiggles are of ZERO interest.
Looks like Leif is not far off the mark calling your stuff garbage.
Ulric says
The totals for each century are nothing like equal.
Henry says
from my own particular results, I have only been able to identify the Gleissberg cycle & I know where we are in that cycle. I think I can even estimate how much the variation in earth’s global temp. is within that cycle.
But there is also the DeVries/Suess cycle and perhaps even others
http://www.nonlin-processes-geophys.net/17/585/2010/npg-17-585-2010.html
I have no idea where we are within that cycle, let alone the others
but I think you can figure it out from the planets……
Makes you wonder, does it not: what if something happens to one of our planets?
Ulric: We’d be dead would we not?
John Finn. : The coldest months are January and February but that’s irrelevant. The comparison I made is with the Jan-July period of previous years. See here
http://www.metoffice.gov.uk/hadobs/hadcet/cet_info_mean.html
Every month in 2014 has been 1 to 2 degrees above the 1961-90 mean.
===
No, the comparison you made was “the warmest year on record”
Have the last 6 months of CET been “the warmest on record”. No.
@John Finn
Here you are again
I told you, I fixed that problem. There is no AGW. None whatsoever.
My bet is that AGW will go down in history as a scientific erroneous theory, just like the Phlogiston theory.
Unless you have any idea how we can add it, so that my formula for the deceleration of minimum temperatures still shows 100% correlation?
http://blogs.24.com/henryp/files/2013/02/henryspooltableNEWc.pdf
see graph at the bottom of the last table.
Leif Svalgaard says:
August 13, 2014 at 11:36 am
“R. de Haan says:
August 13, 2014 at 11:26 am
Your all time high global temperature claim is total BS of course and reflects the debunked hockey stick saga.
We just need to go back a bit more than 100 years [to stay out of hockey-stick trouble]:
http://jameswight.files.wordpress.com/2010/07/global-land-temperature-reconstructions.png
You want to quibble with the data? The data that some people say support their notion that ‘it is the Sun, Stupid’. Keep me out of that.”
Just giving you my personal opinion.
I am the last person on the world to “quibble” any data unless it has become evidently clear the data has been has rigged.
Appreciate to see you correct your own BS claim about current Global temps.
Saves me the trouble.
vuk says:
August 13, 2014 at 11:40 am
I said: produce a link to papers from the Themis project that contradicts my earlier findings.
You didn’t do that and you “don’t bother with papers”. I say ‘put up or shut up’.
You still didn’t do this and keep waffling about irrelevant [and dumbed down presentations].
Try again.
Ulric Lyons says:
August 13, 2014 at 11:56 am
“Solar activity has been about equally high in each of the last three centuries.”
The totals for each century are nothing like equal.
We only have ‘good’ sunspot data since 1759, but we can calculate the means of each half-century since then [using the revised sunspot count]. And we can calculate the spread of those means. The result is 56+/-10, that is how small the variation is. Graphically it looks like this
http://www.leif.org/research/New-Group-Numbers.png
Alan: You have embedded a video which shows the Solar wind’s interaction with the Earth’s magnetosphere is influenced by gravitational effects of a mysterious Planet X.
Did I get that right?
====
That seems to be copy of some NASA video with some planet X crap text stuck on the screen which has no bearing to the sound track. Not sure why Vuk linked that unless he’s really losing his grip.
Greg Goodman says:
August 13, 2014 at 12:57 pm
……………
Re: video
If you listen to second part narrative, all the way to the last sentence, ignoring the NASA’s promotional text, you would find out more about the context of Dr. S’s and mine disagreement.
If you are interested to see what “NASA video with some planet X crap text”, here is link to Science at NASA
http://science.nasa.gov/science-news/science-at-nasa/2008/16dec_giantbreach/
Re: GSO
I spent months of research, collecting data, emailing institutions, and worked out calculations and now you demand to be served over to you on a plate.
In 2012 I wrote a paper, which has been accepted by an important European scientific institution, copy was sent to an independent scientist, university climate professor, who number of times appeared in front of US Senate climate panel. Response was absolutely positive, only remark was that it would benefit from condensing and have a wider number of references.
Dr. S calls garbage anything he doesn’t like, but he has an advantage over you here, since he knows exactly what and how I have calculated, but then as Chinese say: the rich man’s garbage is the beggar’s treasure.
Now if you consider yourself in Dr. Svalgaard’s class and join the good doctor in attaching ‘the garbage’ attribute to whatever I write, you are not only entitled but also welcome to do it, but do not demand what you are not entitled to
Good day to you, sir.
I think the graph I showed gets my point across: solar activity now and a century ago were comparable, but the temperatures were not
That gets my point across which was solar activity has been quite active and the temperatures have responded in an upward trend.
In addition if one looks at the graph one will see in the two solar lulls the Dalton and the 1890-1910 period global temperatures were down not up..
p.s. here is link to ScienceNASA’s sound only
http://science.nasa.gov/media/medialibrary/2008/12/16/16dec_giantbreach_resources/story.m3u
“We only have ‘good’ sunspot data since 1759, but we can calculate the means of each half-century since then [using the revised sunspot count]. And we can calculate the spread of those means. The result is 56+/-10, that is how small the variation is.”
Not that the difference between 46 and 66 is small, but we were talking centuries earlier and not half centuries. The 19th century total is clearly much lower than the 20th century total.
From Ulric Lyons on August 13, 2014 at 9:45 am:
kadaka (KD Knoebel) says:
“Why did the little yellow Tweety bird lose a Twitter war with Sylvester the cat?”
No not all, I don’t like using twitter.
You cut off the punchline. Philistine.
Cherry picking that start point doesn’t prove anything about the trend up to 1995, why not start earlier in the 1970’s: http://snag.gy/gSIaw.jpg
Because 1979 was the recognized start of the satellite-based Arctic sea ice records. It’s not cherry-picking. Duh!
You made a horrible choice for picture hosting, it never loaded in its own window. I had to resort to the powerful hacking tool favored by Edward Snowden, wget.
I’m seeing an overlain mash-up of two graphs of completely unknown provenance, while the axes are matched up I have no idea if this is extent or area and if both are the same.
Uh-oh, huckster behavior detected. You stole that from Goddard and denied him attribution. The source he lists gives the left side graph, indicating the compilation is his.
http://stevengoddard.wordpress.com/2014/02/22/understanding-the-1979-arctic-ice-cherry-pick/
The acceleration of sea ice loss is in two steps, from 1995-1998, and from 2005 onwards (albeit with a slight recent respite due to moderately more positive NAO conditions in the last ~2yrs):
More huckster behavior with a modified Rorschach test, asking us to see what you say is there. Assuming 1995-1998 was inclusive:
http://woodfortrees.org/plot/nsidc-seaice-n/from:1979/to:2013/mean:13/plot/nsidc-seaice-n/from:1979/to:2014/trend/plot/nsidc-seaice-n/from:1995/to:1999/trend/plot/nsidc-seaice-n/from:2005/to:2014/trend/plot/nsidc-seaice-n/from:2000/to:2007/trend/
Click “Raw data”. The rate of loss from 2000 up to 2007 was greater than those two periods. And as your chosen regions are straddling peaks, indicating deceleration followed by acceleration for as much as such short periods can show, your choice of periods is quite mystifying.
milodonharlani says:
August 13, 2014 at 12:44 pm
John Finn says:
August 13, 2014 at 12:34 pm
The Met’s books are cooked,
Rubbish. You have no evidence for your accusation. I have compared the CET record with other station records and there is nothing to suggest the CET data is rigged.
but even so, every month in 2014 has been lower than many years during the Medieval Warm Period,
Again Rubbish. The MWP “temperatures” are based on proxies which are no more reliable than any other proxy. Craig Loehle, Ljungqvist (2010) and Moberg (2005)have all produced reconstructions which show a warmer MWP but the timing of the MWP (according to them) is totally different to the Lamb MWP. They can’t all be right. Also Lamb waffles on about wine production in England during the MWP which supposedly declined after the “MWP”. This was not true. At the beginning of the 16th century (reign of Henry VIII) there were 3 times as many vineyards as there were in the 11th century.
let alone the even warmer Roman & Minoan Warm Periods & the long Holocene Climatic Optimum.
Even less reliable evidence for the Roman warm period. There were good reasons for the Holocene warm period.
Ulric Lyons says:
August 13, 2014 at 11:56 am
“Solar activity has been about equally high in each of the last three centuries.”
The totals for each century are nothing like equal.
Here are the Group Number Record since 1749 http://www.leif.org/research/New-Group-Numbers-21-yr-Means.png
“R. de Haan says:
August 13, 2014 at 11:26 am
Appreciate to see you correct your own BS claim about current Global temps.
Here is the temperature record since 1753 http://www.leif.org/research/BEST-Temperature-Anomaly.png
Nice to know which doctrine you really support.
The above two graphs are what I support.
Ulric Lyons says:
August 13, 2014 at 2:11 pm
The 19th century total is clearly much lower than the 20th century total.
http://www.leif.org/research/New-Group-Numbers-21-yr-Means.png
Why cherry pick precisely a century?
@kadaka
Philistine yourself, there’s no difference between 1981 and 1994, and no difference between 1995 and 2004 :
http://snag.gy/3mgZy.jpg
Leif Svalgaard says:
“Why cherry pick precisely a century?”
You did so here:
http://wattsupwiththat.com/2014/08/11/a-gleissberg-solar-minimum/#comment-1708384
quote:
“Solar activity has been about equally high in each of the last three centuries.”
And for the slow-witted who still don’t see it, here are the two graphs combined:
http://www.leif.org/research/Solar-Activity-Temperature-Anomalies.png
John Finn says:
August 13, 2014 at 2:30 pm
Commenters here have showed you not just the evidence, but the objective, incontrovertible fact that the Met has cooked the books.
The Medieval, Roman & Minoan WPs are warmer than present globally, not just in the CET & other Atlantic reconstructions. Any study trying to show otherwise is a crooked CACA concoction.
For whatever reasons, the Holocene “warm period”, by which I assume you mean its Climatic Optimum, since we’re still in the Holocene, was warmer than now, just as were the warm periods since then, which have been getting cooler. The same is true for other interglacials before the Holocene. Since all these prior periods have been so much warmer than now, why do you imagine that human GHGs explain the current not very warm by historical standards warmth?
Leif, where can we find your new composite GSN time series data? I’d like to sum the SSN from your reconstruction for each century, to compare each of the past centuries. If the century mark is not the best starting point for such 100 year comparisons, please state your preference.
John Finn
You talk about vineyards but we need some context. Here is a history of English vineyards
http://www.englishwineproducers.co.uk/background/history/
The Romans established the vine here. There was a vineyard recorded in Exeter near the present day Met office. Tacitus said the climate was not suitable but it seems to have warmed up later in the roman rule.
Expertise was then mostly lost when the Romand departed as the Anglo Saxons preferred mead and it was not until the last couple of decades of the 11 th century that the French Vikings, the Normans, conquered England and restarted vineyards but the record in the domesday book shows an industry in its very early stages.
The reformation of the monasteries, the black death and the English having ready access to good French wine through their poessions in France all had an effect on vineyard numbers. Better husbandry today together with more time and money make comparisons with past times difficult.
The climate blip in the 13 th and 15 th century would not have helped wine production either
Tonyb
milodonharlani says:
August 13, 2014 at 2:49 pm
John Finn says:
August 13, 2014 at 2:30 pm
Commenters here have showed you not just the evidence, but the objective, incontrovertible fact that the Met has cooked the books.
I take it you can provide some of this evidence?
milodonharlani says:
August 13, 2014 at 2:50 pm
The adjusted “data” of HadCRU & GISS most certainly have been rigged. The satellite sets, not so much.
Well HadCRU and GISS are not making a very good job of their “data rigging”. Since 1990 the surface trends are both lower than the UAH trend.
Bob Weber says:
August 13, 2014 at 2:49 pm
Leif, where can we find your new composite GSN time series data? I’d like to sum the SSN from your reconstruction for each century, to compare each of the past centuries. If the century mark is not the best starting point for such 100 year comparisons, please state your preference.
You can find it here http://www.leif.org/research/Revised-Group-Numbers.xls column F
But what is so special about 100-yr periods? Take e.g. the first half [mean 55.3] and the last half [mean 57.1]. In any case, this is a work in progress and the early part is still subject to revision as we learn more.
Commenters here have showed you not just the evidence, but the objective, incontrovertible fact that the Met has cooked the books.
Not true. No-one has provided me with any evidence. Someone did give a link to Philip Eden’s “alternative CET readings” but these were higher than the CET readings. I’ve actually checked a number of station records which are either in the CE region (but not included in the CET record) or nearby and I can find no evidence of any deliberate inflation recent CET readings. On the contrary, the CET trend is generally lower than other station trends.
vuk says:
August 13, 2014 at 1:50 pm
If you listen to second part narrative, all the way to the last sentence, ignoring the NASA’s promotional text, you would find out more about the context of Dr. S’s and mine disagreement.
Which is that you claim that the Themis team has ‘discovered’ things which contradict my earlier research, but you are evading producing links to their papers showing such contradiction.
Dr. S…has an advantage over you here, since he knows exactly what and how I have calculated,
Well, not ‘exactly’ as you are at times inconsistent and less than precise [and you are concerned that somebody will steal your brilliant discoveries and deprive you of the serious income you feel must flow from those], but well enough to classify it as first-rate garbage. I’ll state here for the record, that in my opinion you have never produced anything of any value. Referring to un-named institutions and un-named persons does not help your credibility. If you want consideration you must produce your ‘results’ such that they can be evaluated by anybody.
Tonyb says:
August 13, 2014 at 3:10 pm
John Finn
You talk about vineyards but we need some context. Here is a history of English vineyards
I don’t talk about vineyards as I agree with most of what you write. Using wine production in England as a proxy for climate is flawed. However, there are plenty of commenters who openly cite Roman and medieval wine production on these blogs.
John Finn
Yes, using vineyards as a comparison is difficult as there are so many variables. All it demonstrates is that it was warm enough to grow grapes at some points and it wasn’t warm enough at others but that the variables make it difficult to quantify precise temperatures as far as England goes.
Ladurie however produces a very useful temperature/ grape index for the continent which shows the ups and downs of temperatures over some 500 years.
I carried out my own CET temperature reconstruction back in December 2011
http://judithcurry.com/2011/12/01/the-long-slow-thaw/
I started at the instrumental record of 1659 and am back to 1538 .at the same time I compared the reconstructions of Dr Mann and Hubert Lamb.
I am now working on going back further in time with particular emphasis on the period 1200 to 1350 which exhibits astonishing variability from very cold in parts of the first part of the 13 th century to at least as warm as today in the first decades of the 14 th century. I use the met office archives amongst other sources, as well as Cathedral records.
I hope to have the next article ready covering this period by the end of the year. Research takes a great deal of time as it needs to be correlated with other records
Tonyb
From Leif Svalgaard on August 13, 2014 at 2:32 pm:
Here is the temperature record since 1753 http://www.leif.org/research/BEST-Temperature-Anomaly.png
Ideally it should note BEST is land only, thus only 30% of the globe is represented, at best.
But as the historical SST records are sparse crap with the “datasets” modeled advanced guesswork, BEST land-only may just be the best approximation of a global record to that far back.
Thanks for providing the new Group Number values.
Leif Svalgaard says: August 13, 2014 at 3:27 pm
……………
Hi doc
Although it is none of my business to question either your judgment or your memory, it appears that at least the memory is failing you. You had a copy and delivered a judgment that two magnetic fields can’t mix, but I maintain that the data does imply such possibility.
You also said:
“the video is NASA nonsense of the worst kind”
I suppose that is a grade or two above “ the first-rate garbage”
the attribute ‘the first rate’ is a superior to “the worst kind”
It’s getting late, good night doc.
Vuk says: Re: GSO
I spent months of research, collecting data, emailing institutions, and worked out calculations and now you demand to be served over to you on a plate. In 2012 I wrote a paper, which has been accepted by an important European scientific institution,….”
I do not demand to be served on a plate, I demand to know what I’m being asked to look at.
So now we know that it took months of work but we still don’t know what it is we are looking at.
We now know that it is not a currently available and recognised measurement but is a result of “calculations” based on multiple undisclosed sources of some undisclosed presumably physical measurement.
We now know that you have a paper accepted by an undisclosed but important russian journal, presumably to be printed at some undisclosed point in the future.
We still don’t know whether you will make the mysterious data available once published.
So, it seems like, having evaded about a dozen requests for an explanation of what this “data” represents, you are now implying the following reasons for posting a meaningless graph of an unknown quantity:
1. It is part of on going current research, so it is secret pending publication.
2. You have years of work invested in it so why should you let anyone else have it.
If that is the case what prevented you saying so in reply to my first request instead of persistent evasion. It would have looked more credible, not it just looks like a defensive excuse.
You may wish to add :
3. You do not have the permission of all the institutions who provided the data to make it public.
4. You require signature of a non-disclosure agreement before you will provide the data.
5. There is a “distribution charge” of several hundred euros for the work involved in extracting the data from your database.
6. Why should you let me have it , I only want to find something wrong with it.
I get the picture. I apologise for having wasted your time by taking you seriously. My bad.
Leif Svalgaard says: August 13, 2014 at 3:27 pm
“and you are concerned that somebody will steal your brilliant discoveries and deprive you of the serious income you feel must flow from those”
Missed that bit.
Wrong again, everything has been available with a free access to anyone for about two years now.
I did earn living for number of decades with a world wide known, privately owned company, where nonsense was not tolerated, and now and in foreseeable future have no reason to either solicit, look for or work to earn income.
milodonharlani says:
August 13, 2014 at 3:33 pm
John Finn says:
August 13, 2014 at 3:21 pm
Did you forget about or miss all the references on how the Met cooks its UHI adjustments? I recall them, so wonder why you don’t.
A simple link to one of these references would be useful. However, I’m not interested in opinions or baseless accusations. I will look at data which claims to show that the recent CET record includes spurious UHI warming.
Look – when I first started to become interested in global warming a decade or so back, I tried to look for evidence of UHI and I started with the CET record. I live in the CE region so had access to a number of local station records which were in locations I knew very well. I felt sure I’d turn something up but I soon became discouraged. It became obvious to me that, if there was any UHI influence in the CET record, it was pretty small.
At that time, a number of respectable commenters sceptical of CAGW had been praising the quality of the Armagh Observatory record (as constructed by Butler et al). The Armagh Observatory is located in an area which has been virtually unchanged for 200 years. Armagh is about 200 miles from the CE region. I got hold of that data and found the trends over comparable periods were higher at Armagh than CE.
If the CET record is not adequately compensating for UHI then it should be possible to detect it. Philip Eden has produced an alternative record which supposedly reflects the stations that Gordon Manley used in his original reconstruction. The Eden readings are actually higher than the official CET readings.
By all means provide details of a proper analysis which shows a significant UHI influence in the CET record but don’t expect me to read some rubbish which hints at a “problem”.
Tonyb says:
August 13, 2014 at 3:50 pm
John Finn
I carried out my own CET temperature reconstruction back in December 2011
http://judithcurry.com/2011/12/01/the-long-slow-thaw/
Tony
I will read this but not on a laptop. I’m going to print it. Do you have a PDF/Word version?
From Ulric Lyons on August 13, 2014 at 2:37 pm:
Philistine yourself, there’s…
Wait a moment. What myself? That word is not a verb. I think something was lost in the English-to-English translation.
Philistine yourself, there’s no difference between 1981 and 1994, and no difference between 1995 and 2004 :
Your middle yellow highlighter line actually goes to 2005.
It is strange you are also showing 2006 to present as also being flat, after declaring “from 2005 onwards” to be one of the periods of sea ice loss acceleration.
http://woodfortrees.org/plot/nsidc-seaice-n/from:1979/to:2014/mean:13/plot/nsidc-seaice-n/from:1981/to:1995/trend/plot/nsidc-seaice-n/from:1995/to:2005/trend/plot/nsidc-seaice-n/from:2006/to:2014/trend/
And now I’m wondering how you are drawing flat lines through what is clearly not flat. Moreover, why go 1995 to 2004 inclusive, when clearly that section of ice loss extends to 2007 inclusive? Likewise 2008 to 2014 inclusive is another run of ice loss.
Are you picking periods that correspond with the NAO to show the NAO corresponds to ice loss?
Vuk says @ 1:50pm August 13, ’14
“Re: video
If you listen to second part narrative, all the way to the last sentence, ignoring the NASA’s promotional text, you would find out more about the context of Dr. S’s and mine disagreement.
If you are interested to see what “NASA video with some planet X crap text”, here is link to Science at NASA…”
_______________________
Good grief!
If the best you could muster was a video to support your claims, couldn’t you at least, have found something without all the Planet X looney- bin bait?
————————————
In other news: Finn is a troll and has appeared in these pages, before. He has never displayed anything but classic troll behavior. Any response to him is wasted effort. He will never play it straight.
John Finn says:
August 13, 2014 at 4:12 pm
Strange that you don’t recall the UHI links posted on this blog, since you replied to them. How hard would it have been for you to find them? But because you’re so helpless, I’ll help you:
Even Dr. Phil has been forced to acknowledge problems, post-Climategate. Somehow you didn’t get the memo:
http://wattsupwiththat.com/2013/04/16/revisiting-temperature-reconstructions-used-in-climate-change-modeling/
http://www.warwickhughes.com/climate/uk.htm
Re. Armagh:
http://wattsupwiththat.com/2010/08/26/uhi-study-of-the-uk-armagh-observatory/
You make people foolish enough to respond to your ranting drivel do the same work over & over again, pretending you didn’t see prior replies, classic trollish behavior.
Clearly Alan has you pegged.
Ignore henceforward.
kadaka said
“Your middle yellow highlighter line actually goes to 2005.”
By about a month, so what, I made it clear that the period that I was referring to was 1995-2004.
“And now I’m wondering how you are drawing flat lines through what is clearly not flat. Moreover, why go 1995 to 2004 inclusive, when clearly that section of ice loss extends to 2007 inclusive?
Because with the data series that I am using, there is no real difference between 1995 and 2004:
http://snag.gy/3mgZy.jpg
From Ulric Lyons on August 13, 2014 at 6:34 pm:
Because with the data series that I am using, there is no real difference between 1995 and 2004:
Wait, we have a varying time series, different trends and curves, and you’re picking endpoints that just happen to have about the same value? Are you nucking futs?
http://woodfortrees.org/plot/nsidc-seaice-n/from:1979/to:2014/compress:12/plot/nsidc-seaice-n/from:1981/to:1995/trend/plot/nsidc-seaice-n/from:1995/to:2005/trend/plot/nsidc-seaice-n/from:2006/to:2014/trend
Raw data, “compressed” to annual averages:
1995 11.5667E6 km^2, 2004 11.3475E6 km^2, difference 0.219200E6 km^2.
2002 11.5692E6 km^2, only -0.0025E6 km^2 difference from 1995.
1995 is two whole orders of magnitude closer to 2002 than it is 2004. Why wasn’t 2002 chosen instead?
Of course back at the Cryosphere Today home page it is clear you are using an area chart, which is using data from NSIDC, while I am using the more-common extent data, which is also coming from NSIDC.
You really should make note you have selected the less-common data that people might not be aware even exists, as extent is the default standard when talking about sea ice.
When you don’t note it as such, people might think you are being deceptive.
vukcevic says:
August 13, 2014 at 3:53 pm
Although it is none of my business to question either your judgment or your memory, it appears that at least the memory is failing you.
Nonsense, my memory is very good on this. All your antics are just unsuccessful attempts to save some face. I say again: everything you ever ‘produced’ is and has always been garbage.
If all your ‘data’ and ‘methods’ have been available for years show it again [for Greg]. Your references to un-named persons and un-named institution and un-named journal are pathetic. If you got something, show it.
Ulric:
KDK:
“And now I’m wondering how you are drawing flat lines through what is clearly not flat. Moreover, why go 1995 to 2004 inclusive, when clearly that section of ice loss extends to 2007 inclusive?
Because with the data series that I am using, there is no real difference between 1995 and 2004:
http://snag.gy/3mgZy.jpg
====
So you still don’t explain how you drew those lines. It is so obvious that I did not even bother commenting before. They are freehand lines, drawn to fit your perception of steps. They have no objective value and do not substantiate your erroneous handwaving account of “acceleration”.
Here is a fully documented method looking at decadl variability in Arctic sea ice:
http://climategrog.wordpress.com/2013/09/16/on-identifying-inter-decadal-variation-in-nh-sea-ice/
The main areal acceleration was from 1997 to 2007. It has slowed since.
However, there is a fairly close connection between AO and the length of the Arctic melting and freezing seasons, so you are correct to point it out. You may need more that thick yellow pen to establish it though.
Note post 2007 drop in AO matches the shortening melting season and the deceleration in ice losss that I noted above.
1989 seems to be the most significant event in the satellite record. What was that about , goemagnetic activity ??
Alan Robertson says:
August 13, 2014 at 5:51 pm
Good grief! ….
……….
Hi Mr. Robertson
I had video link on my PC for some time ago. In the original, there was no screen text, since I listened to it on number of past occasions, I reviewed only the first few 2-3 min in order to check that it is correct link. As soon as Greg drew my attention to it, I provided link for NASA’s article and audio link only.
My impression was that for occasions when the science isn’t presented in an exact and rigorous manner, many may prefer to listen to a narrative than make effort to read a long text, but it appears I was wrong.
Lesson learned. My apologies to you and everyone concerned.
vukcevic says:
August 13, 2014 at 4:07 pm
Leif Svalgaard says: August 13, 2014 at 3:27 pm
“and you are concerned that somebody will steal your brilliant discoveries and deprive you of the serious income you feel must flow from those”
Missed that bit.
Wrong again, everything has been available with a free access to anyone for about two years now.
I did earn living for number of decades with a world wide known, privately owned company, where nonsense was not tolerated, and now and in foreseeable future have no reason to either solicit, look for or work to earn income.
====
“Everything ” except the data , the calculations and what it is you are plotting? Or is it hidden in plain view?
I have 50,000 euros freely available to anyone. I’m just not saying where it is. LOL
“Wrong. Not Russian journal, but a French science institution.”
Oh, so you are not even getting it published, it has just been “accepted” by some yet again undisclosed “institution”.
And what good is that? If you have something with any significance, stop dancing around and tell us where the “free access to anyone ” is, so we can be done with this CO2 fallacy before it’s too late.
So far you are encapsulating the very worst of the secretive, defensive and obstructive attitudes to science that this site and others has been battling for years.
{MODS} If you want to put all links to vuk’s site on moderation, please block that and not his name. Every time I quote him, I have to remember to change his name.
vuk says:
August 13, 2014 at 4:07 pm
Leif Svalgaard says: August 13, 2014 at 3:27 pm
“and you are concerned that somebody will steal your brilliant discoveries and deprive you of the serious income you feel must flow from those”
Missed that bit.
Wrong again, everything has been available with a free access to anyone for about two years now.
I did earn living for number of decades with a world wide known, privately owned company, where nonsense was not tolerated, and now and in foreseeable future have no reason to either solicit, look for or work to earn income.
====
“Everything ” except the data , the calculations and what it is you are plotting? Or is it hidden in plain view?
I have 50,000 euros freely available to anyone. I’m just not saying where it is. LOL
“Wrong. Not Russian journal, but a French science institution.”
Oh, so you are not even getting it published, it has just been “accepted” by some yet again undisclosed “institution”.
And what good is that? If you have something with any significance, stop dancing around and tell us where the “free access to anyone ” is, so we can be done with this CO2 fallacy before it’s too late.
So far you are encapsulating the very worst of the secretive, defensive and obstructive attitudes to science that this site and others has been battling for years.
KDK “You really should make note you have selected the less-common data that people might not be aware even exists, as extent is the default standard when talking about sea ice.”
There is no “default standard when talking about sea ice” you are making that up. There are two measures, both of which are featured on the sea ice page here on WUWT. You are correct it is good practice to be clear about what data is being referred to.
In estimating the length of the Arctic melting season I used the CT ice area data, which is less noisy than ice extent, which is highly dependent on weather conditions.
This does show strong similarities to AO, and is more objective than Ulirics rather vague claims and hand draw “steps”.
http://climategrog.wordpress.com/?attachment_id=226
Greg Goodman
The growth of ice in the Arctic this year will be bigger than we think.
http://arctic.atmos.uiuc.edu/cryosphere/arctic.sea.ice.interactive.html
http://www.cpc.ncep.noaa.gov/products/stratosphere/temperature/70mb9065.gif
As you can see the temperature in the stratosphere over the northern polar circle below the normal.
http://www.cpc.ncep.noaa.gov/products/stratosphere/strat-trop/gif_files/time_pres_TEMP_ANOM_ALL_NH_2014.gif
john finn said;
‘Tony
I will read this but not on a laptop. I’m going to print it. Do you have a PDF/Word version?’
No there isn’t a pdf. I had intended to produce the next extension as a pdf and convert this one at the same time, but I hadn’t expected there would be three years between the two!
There will be a couple of addendums when I do, as I found additional evidence for the two warm periods that I hadn’t expected and said I would need to investigate further.
tonyb
985 AD
Erik returned to Eriksfiord and named the land Greenland. Twelve chieftains are established,
widely spaced up different fjords. In the autumn one final ship arrived, Herjolf and he
established a prime trading port not far north of cape Farewell. In late summer Bjarni
Herjolfsson sailed for Greenland to meet up with his father Herjolf. A storm drove him off
course to Newfoundland. The land is heavily forested with no ice-covered mountains, therefore
it was definitely not Greenland. Bjarni reckoned he was 800 nautical miles south west of
Greenland. Bjarni sailed north and recorded no signs of human habitation. Bjarni cleared cape
St. Francis and encountered Labrador. The next land sighting was Kaumajet peninsula of
northern Labrador. They then sailed due east for Greenland.
milodonharlani says:
August 13, 2014 at 6:09 pm
John Finn says:
August 13, 2014 at 4:12 pm
Strange that you don’t recall the UHI links posted on this blog, since you replied to them. How hard would it have been for you to find them? But because you’re so helpless, I’ll help you:
http://www.warwickhughes.com/climate/uk.htm
Before we start let’s establish one thing. Warwick Hughes knowledge of the geography of UK and Ireland is a bit suspect. There is no reason to think that Valentia and CET would have identical or even very similar temperature trends. Nevertheless I did check and compare the data for both locations.
The respective trends for the 20th century (1900-2000) are as follows:
Valentia 0.66 degrees per century
CET 0.65 degrees per century
I hope someone will check these for me – I may have made a mistake. Warwick Hughes does appear to get a bigger difference between the two as he shows here:
http://www.warwickhughes.com/climate/cetval.gif
But I think this is more to do with a relatively cooler period in the late 19th century in the CET record. If we extend the analysis back to 1880 (start of the Valentia record) then the trends (1880-2000) are as follows:
Valentia 0.6 degrees per century
CET 0.7 degrees per century
But that, I believe, is a result of differing weather patterns at the 2 locations. I can see no evidence for UHI. I doubt there is a statistically significant difference between the trends over any reasonable time period.
Re. Armagh:
http://wattsupwiththat.com/2010/08/26/uhi-study-of-the-uk-armagh-observatory/
Read the link. Particularly the conclusion which states
However, recent research into the historical temperature records and comparisons with present day data from rural weather stations indicate that any temperature differences which existed between the Observatory site and the countryside 20-30 years ago have not increased over the intervening years. This is contrary to the situation which would be expected if urban development were to influence air temperatures at the Observatory, since much of the growth of Armagh has taken place since the 1960s and still continues .
You really do need to read these things properly. There was a difference – but there has always been a difference. Local stations read higher or lower for a number of reasons which are entirely natural. ‘Nearby’ urban development at Armagh hasn’t changed a thing.
Clearly Alan has you pegged.
I’m sure Michael Mann thought he had me pegged [as a troll] too.
John Finn
Just in case you hadn’t noticed, as it is a little tucked away, there is a separate section providing research details linked to through my article. This part is a pdf. It is here;
http://curryja.files.wordpress.com/2011/12/long-slow-thaw-supplementary-information.pdf
tonyb
@kadaka
Area is the same as extent. This thread was about a Gleissberg Minimum until you hijacked it to air what you thought was dirty washing in my twitter account. Though I still stand by that tweet, “Arctic sea ice loss is due to negative NAO”, which is the opposite of a forced warming signal. as increased forcing of the climate increases positive NAO/AO conditions.
@Greg Goodman
I think that the correlation is better with the NAO than the AO, and really it needs inspection at at least seasonal scales as well to verify the connection, rather than just the trends, e.g., less summer ice extent when the NAO is more negative in those particular months, as in say 2007 and 2012.
milodonharlani says:
August 13, 2014 at 6:09 pm
In addition to my earlier response, I intended to quote more from the Conclusions such as
In addition, the fact that there has been no urban encroachment into the Observatory grounds and that the grounds have not been separated from the adjacent farmland by any development suggests that the Observatory weather station lies outside the urban climatic boundary.
It is concluded that temperature observations made at Armagh Observatory have been unaffected by rapid urbanisation over the past three decades.
So that’s no urban encroachment into the Observatory grounds and that the grounds have not been separated from the adjacent farmland by any development . In other words the Observatory is pretty much as it was 200 years ago, i.e. exactly what I said in a previous post.
Oh, and by the way, the 20th century (1900-2000) trend for Armagh is 0.69 degrees per decade.
So let’s just recap what we’ve learned so far shall we. The 1900-2000 trends for Armagh, Valentia and CET are as follows.
Armagh 0.69 degrees per century
Valentia 0.66 degrees per century
CET 0.65 degrees per century
John Finn says
So let’s just recap what we’ve learned so far shall we. The 1900-2000 trends for Armagh, Valentia and CET are as follows.
Armagh 0.69 degrees per century
Valentia 0.66 degrees per century
CET 0.65 degrees per century
Henry says
John, I am sure I have told you before that one has to be careful with data from before we started with thermo-couples and automatic recording. In fact, I do remember to challenging you to bring me even one certificate of a re-calibration done on a thermometer before 1945. You have not shown me anything on that request. To tell you the truth, the earliest date I found was 1948.
Remember that Means is an average for the day, and it makes a big difference if you observe 4 times per day by a human or every second of the day by a machine (as is done now)
So, I think you are on a wrong track here. You are comparing apples with pears and it does not work that way.
For Armagh, I found a value of +0.024K per annum since 1965, which compares well with that found in my tables
http://blogs.24.com/henryp/files/2013/02/henryspooltableNEWc.pdf
of 0,0234 for the whole of the NH from 1974.
That is 2.3K/century, which increase actually was what people were getting worried about AGW.
However, we are globally cooling now, at a rate of -0.015K per annum, on Means from 2000. As I said before: in nature it is either warming or cooling. There is no “pause”. That was just an idea from someone to keep the money (of the AGW scare) rolling into his pocket. 1995 was the middle of Gleissberg, as we can see further on in each of my 3 tables,Measure the increase from 1960 to 2000 and you will know you by how much we are cooling from 2000-2040.
I am not going to do it for you. The guys who frequent here are clever enough to figure it out for themselves.
vuk says:
August 14, 2014 at 1:46 am
985 AD
Yet another attempt to deflect attention form the core issue. You claimed that the latest research by the Themis team contradicts my earlier findings. I asked you to provide links to their papers showing the contradictions. You keep evading doing so. So again: produce the links.
My musings.
The new darling of the day for solar enthusiasts is the Gleissberg Cycle doncha know. They are all scrambling to find a match maker match maker find me a match find me a match. And they will box car it for sure. Exactly 100 years.
Leif, the temperature data set you refer to is yet another reconstruction replete with observation errors, something you understand well. All long term temperature sensor data sets (not proxy data) is “plagued with plot problems”, to alliterate the point. Take the example of agriculture seed plot experiments for a new grass seed. Start the experiment with a few scattered potted plots in various parts of the planet without regard to geologic location. Begin to take data on plant cycles. Don’t bother with geophysical features of the area the plots are in. Just take plant cycle data and don’t be too worried about when you take data. As the experiment progresses, add more plots here and there on the globe, and occasionally move the plots around locally. Then decide to get rid of a view plots without regard to geologic location. Finally, try and splice/adjust/smear data at the end of this wholly uncontrolled experiment, call the grass seed good for all climates, and put it on the market. I am here to tell you, a country gal who knows a bit about this, no company no matter how rich, would put that seed on the market and the researchers would be dismissed. Given the care you gave to correcting the SSN data sets, I wish we had someone like you who understands that temperature sensor historical data sets have issues similar to your field of work. Is BEST the best? So thought your colleagues with regard to the previous group number.
Pamela Gray says:
August 14, 2014 at 7:04 am
Leif, the temperature data set you refer to is yet another reconstruction replete with observation errors, something you understand well.
I’m willing to use another temperature reconstruction. Just tell me which one is good. If none are, then no claim can be made that ‘it is the Sun’ or anything else, because we don’t know what to compare with. So, tell me which one to use.
@Ulric
I thought your last reaction to me was rather impolite.
Ask yourself this question: If today were the last day of your life, would you have reacted differently than you did? I suspect that if everybody lived as if today were the last day of their life, a lot less time would be spend on silly strife and a whole lot more on love…
e.g. on how to provide food for 7 billion people and counting, in the face of the global cooling period that is coming.
From Ulric Lyons on August 14, 2014 at 4:49 am:
@kadaka
Area is the same as extent. (…)
Rookie mistake. For as long as you’ve been on this site, you should know better.
http://www.ijis.iarc.uaf.edu/en/home/seaice_extent.htm
Definition of sea-ice cover (extent and area)
The area of sea-ice cover is often defined in two ways, i.e., sea-ice “extent” and sea-ice “area.” These multiple definitions of sea-ice cover may sometimes confuse data users. The former is defined as the areal sum of sea ice covering the ocean (sea ice + open ocean), whereas the latter “area” definition counts only sea ice covering a fraction of the ocean (sea ice only). Thus, the sea-ice extent is always larger than the sea-ice area. Because of the possible errors in SIC mentioned above, satellite-derived sea-ice concentration can be underestimated, particularly in summer. In such a case, the sea-ice area is more susceptible to errors than the sea-ice extent. Thus, we adopt the definition of sea-ice extent to monitor the variation of the Arctic sea ice on this site.
With an extent cutoff of 15%, any square kilometer with 15% or greater sea ice is counted as a square kilometer of extent. For area, a square kilometer of 20% sea ice would count as only 0.2 km^2, while 5% would be 0.05 km^2.
Area is not the same as extent.
@Kadaka Knoebel
If we count back 90 years, as the apparent cycle in this post is alleged to be, we are in 1924.
Those still pointing to melting arctic ice and NH glaciers, as “proof” that it is (still) warming, and not cooling, should remember that there is a lag from energy-in and energy-out.
Now look at some eye witness reports of the ice back then? That was almost 1923:
http://wattsupwiththat.com/2008/03/16/you-ask-i-provide-november-2nd-1922-arctic-ocean-getting-warm-seals-vanish-and-icebergs-melt/
Sounds familiar? Back then,they had seen that the arctic ice melt was due to the warmer Gulf Stream waters. However, by 1950 all that same ‘lost” ice had frozen back. I therefore predict that all lost arctic ice will also come back, from 2020-2035 as also happened from 1935-1950. Antarctic ice is already increasing.
Leif, if you wouldn’t mind, can we please also access your reconstructed monthly SSNs that were used to generate the yearly numbers, and also the daily numbers that were used to generate the monthy numbers? I’d like to compare them to the international numbers (yearly, monthy, daily), and then use them to investigate warm and cold periods wrt solar activity per solar rotation.
Can we deduce with confidence the radio flux, F10.7cm, backwards from 1948 using your SSNs and the known recent relationship between SSN and F10.7? Can we reliably use the recent formula relating them going back to the beginning of your reconstruction, and if not exactly, how accurate would you estimate the relationship to be going back that far using that formula, as a percentage?
Thank you.
Leif Svalgaard says: August 14, 2014 at 6:59 am
vuk says: August 14, 2014 at ? am
Yet another attempt to deflect attention form the core issue. You claimed that the latest research by the Themis team contradicts my earlier findings. I asked you to provide links to their papers showing the contradictions. You keep evading doing so. So again: produce the links.
No Problem
I spend morning writing one. Don’t really care if contradicts your 1977 paper or not.
It is in preprint ‘assessment ‘ stage, and for the next day or two is available at:
http://hal.archives-ouvertes.fr/docs/01/05/59/16/PDF/LODvsSSN.pdf
Its implications can be viewed in the light of the NASA’s Themis satellite discovery, as contained in the key statement:
”For reasons not fully understood, CMEs in even-numbered solar cycles (like 24) tend to hit Earth with a leading edge that is magnetized north. Such a CME should open a breach and load the magnetosphere with plasma just before the storm gets underway..”
http://science.nasa.gov/science-news/science-at-nasa/2008/16dec_giantbreach/
“It has been proposed that Earth’s climate could be affected by changes in cloudiness
caused by variations in the intensity of galactic cosmic rays in the atmosphere. This
proposal stems from an observed correlation between cosmic ray intensity and Earth’s
average cloud cover over the course of one solar cycle. Some scientists question the
reliability of the observations, whereas others, who accept them as reliable, suggest
that the correlation may be caused by other physical phenomena with decadal periods
or by a response to volcanic activity or El Nin˜o. Nevertheless, the observation has
raised the intriguing possibility that a cosmic ray–cloud interaction may help explain
how a relatively small change in solar output can produce much larger changes in
Earth’s climate. Physical mechanisms have been proposed to explain how cosmic rays
could affect clouds, but they need to be investigated further if the observation is to
become more than just another correlation among geophysical variables.”
http://oi58.tinypic.com/30s7yau.jpg
Cosmic Rays, Clouds, and Climate
K. S. Carslaw,1 R. G. Harrison,2 J. Kirkby3
P.S, to my comment above:
It is advisable to read whole article before any questions asked are answered, polite or derogatory comments, of course can be made regardless.
Link: http://hal.archives-ouvertes.fr/docs/01/05/59/16/PDF/LODvsSSN.pdf
” A mechanism linking cosmic rays and clouds could operate directly through the influence of ions on such microphysical processes.”
http://oi60.tinypic.com/fwn1xz.jpg
Leif, I wish I could. One area of knowledge that has been developed over time has to do with temperature and precipitation patterns that are used as analogue years when predicting local and regional weather patterns for the immediate growing season. This has been done meteorologically for several areas around the globe that depend on agriculture as a gross domestic product.
How would this data set improve the BEST set?
1. The reason why this ever expanding data set is important is that it considers geophysical climate boundaries and their related weather patterns (extremes, averages, oscillations, etc) corresponding to oceanic/atmospheric conditions. Researchers usually use 4 to 5 analogue years to predict the next three months of agricultural weather patterns. They smear the temperature and precipitation prediction based on geophysical location, not simply on the fact that there is another station 1000km away they can use to smear the data.
2. It is also the case that this data set includes outliers. Years when the temperature varied considerably outside what it should have been. Some oceanic/atmospheric tied analogue sets have more outliers than other sets, owing to the less consistent weather patterns associated with a particular oceanic-atmospheric condition.
3. Correlating geophysical based analogue years with the BEST temperature data series may allow a more accurate global temperature set that considers geophysical features as well as uncertainties. It is similar to correcting solar observation algorithms with none-SSN solar measures. For example, a correction (or at least error bars) to the data could be obtained by saying that based on the geophysical area’s analogue years, the current temperatures for a particular geophysical area should have been thus and so with a range of thus and so, etc.
These sets are so highly regarded that meteorologists from states that have major agricultural investments nearly always use analogue years to predict what’s coming. Oregon uses analogue years that extend back to nearly the turn of the century.
http://www.google.com/url?sa=t&rct=j&q=&esrc=s&source=web&cd=1&cad=rja&uact=8&ved=0CCQQFjAA&url=http%3A%2F%2Fwww.oregon.gov%2FODA%2Fnrd%2Fdocs%2Fdlongrange.ppt&ei=peHsU7ePDeS8igKv7YBQ&usg=AFQjCNHhHqr-KPBcyM9vlgEC4lkTnBaIIQ&bvm=bv.72938740,d.cGE
Some will say these climate zone issues are overcome by using anomalies instead of absolute data. The problem exists for both anomaly and absolute temperature sets. Different climate zones have different characteristic anomaly patterns. Some respond with faster warming than others, and some will show cooling at various rates under the same oceanic/atmospheric condition, relative to their climate average. And these disparate climate zones could be right next to each other.
The point which is most important now if solar activity went from a very active period to a very inactive period with 2005 being the focal point.
Next is to see the climate response.
If historical data is any indication the temperature response will be for the global temperature trend to trend down just like it has done in the past.
The sun’s magnetic field strength during the recent Grand Maximum of last century was among the strongest in over 8000 years. The temperature trend responded. Going forward due now to very weak solar magnetic conditions the temperature trend will respond once again which will be down.
The graph of temperature data I sent yesterday shows this to be the case.
Bob Weber says:
August 14, 2014 at 8:37 am
Leif, if you wouldn’t mind, can we please also access your reconstructed monthly SSNs that were used to generate the yearly numbers, and also the daily numbers that were used to generate the monthy numbers?
The monthly and daily numbers are still being worked on. Only the yearly numbers are ready for release at this point. So have some patience. How can we have the yearly numbers: http://www.leif.org/research/SSN/Svalgaard11.pdfhttp://www.leif.org/research/SSN/Svalgaard11.pdf
Can we deduce with confidence the radio flux, F10.7cm, backwards from 1948 using your SSNs and the known recent relationship between SSN and F10.7? Can we reliably use the recent formula relating them going back to the beginning of your reconstruction, and if not exactly, how accurate would you estimate the relationship to be going back that far using that formula, as a percentage?
We can do much better than that. T10.7 is a proxy for the Far UV which creates the E-layer of the ionosphere. A dynamo process creates an electric current whose magnetic field we can measure on the ground [the effect was discovered in 1722] and we have reliable data going back to 1781, so we know what FUV was at least back to then, and with some gaps back to 1722. Slides 7-11 of http://www.leif.org/research/SSN/Svalgaard11.pdf describes the process.
vuk says:
August 14, 2014 at 8:42 am
I spend morning writing one. Don’t really care if contradicts your 1977 paper or not.
It is in preprint ‘assessment ‘ stage, and for the next day or two is available at:
I am not interested in what you write.
What I want is the paper where this is published:
“the NASA’s Themis satellite ‘discovery’, as contained in the key statement:
”For reasons not fully understood, CMEs in even-numbered solar cycles (like 24) tend to hit Earth with a leading edge that is magnetized north.”
I think there is no such ‘discovery’. If it were as you quote, geomagnetic activity would be different from what is observed, so the data is in direct contradiction to what is claimed.
http://wattsupwiththat.com/2012/09/13/paper-demonstrates-solar-activity-was-at-a-grand-maxima-in-the-late-20th-century/
Which is what I subscribe to until proven otherwise. I have yet to see any evidence to support a counter argument.
How can we have the yearly numbers: http://www.leif.org/research/SSN/Svalgaard11.pdf
F10.7:
http://www.leif.org/research/What-Geomagnetism-can-Tell-Us-about-the-Solar-Cycle.pdf
Leif Svalgaard says @ vukcevic: August 14, 2014 at 9:53 am
1. I am not interested in what you write.
2. What I want is the paper where this is published
3. I think there is no such ‘discovery’
…………….
vukcevic responds to Leif Svalgaard
3. It is none of my business as to ‘what you think’.
2. If you want something or another you have to go and look for it
1. Your interests are least of my concerns, but do I welcome it.
http://www.met.reading.ac.uk/users/users/1513
[Always tell your potential readers what the video or link you are providing will do, and what you want them to learn from it, and why you feel they should invest their time and energy and resources watching it or clicking on the link. .mod]
vuk says:
August 14, 2014 at 10:08 am
2. “What I want is the paper where this is published”
2. If you want something or another you have to go and look for it
There is no such paper[s], but you claim there is, so it is for you to supply the link. If you cannot [will not?] your statements that the ‘discovery’ contradicts my findings and the data are false and shameful.
@ren
you are on the right track there but by now you should be able to distinguish between cause and reaction
Predictably, due to cooling from the top latitudes downwards,
[e.g
it has been cooling significantly in Alaska, at a rate of -0.55K per decade since 1998 (Average of ten weather stations).
http://oi40.tinypic.com/2ql5zq8.jpg
]
there would be a small (?) shift of cloud formation and precipitation, more towards the equator, on average. At the equator insolation is 684 W/m2 whereas on average it is 342 W/m2. So, if there are more clouds in and around the equator, this will amplify the cooling effect due to less direct natural insolation of earth (clouds deflect a lot of radiation). Furthermore, in a cooling world there is more likely less moisture in the air, but even assuming equal amounts of water vapour available in the air, a lesser amount of clouds and precipitation will be available for spreading to higher latitudes. So, a natural consequence of global cooling is that at the higher latitudes it will become cooler and/or drier.
Below is an abstract from the link I sent earlier.
The behavior of the Sun and near-Earth space during grand solar minima is not understood; however, the recent long and low minimum of the decadal-scale solar cycle gives some important clues, with implications for understanding the solar dynamo and predicting space weather conditions. The speed of the near-Earth solar wind and the strength of the interplanetary magnetic field (IMF) embedded within it can be reliably reconstructed for before the advent of spacecraft monitoring using observations of geomagnetic activity that extend back to the mid-19th century. We show that during the solar cycle minima around 1879 and 1901 the average solar wind speed was exceptionally low, implying the Earth remained within the streamer belt of slow solar wind flow for extended periods. This is consistent with a broader streamer belt, which was also a feature of the recent low minimum (2009), and yields a prediction that the low near-Earth IMF during the Maunder minimum (1640-1700), as derived from models and deduced from cosmogenic isotopes, was accompanied by a persistent and relatively constant solar wind of speed roughly half the average for the modern era.
Ulric says: @Greg Goodman
I think that the correlation is better with the NAO than the AO, and really it needs inspection at at least seasonal scales as well to verify the connection, rather than just the trends, e.g., less summer ice extent when the NAO is more negative in those particular months, as in say 2007 and 2012.
===
I find a lot of these “seasonal” metrics rather contrived. I’ve not seen one that I found more informative than a careful analysis of the full year. They are usually desperate attempts to find a correlation where none really exists.
However, if you have some data that shows a better correlation than what I showed with AO, I’d like to see it. I was quite surprised how well AO followed melting season ( or vice versa ).
I think there was some significant geomagnetic activity in 1989 but I never followed it up thoroughly.
ren says:
Greg Goodman
The growth of ice in the Arctic this year will be bigger than we think.
http://arctic.atmos.uiuc.edu/cryosphere/arctic.sea.ice.interactive.html
http://www.cpc.ncep.noaa.gov/products/stratosphere/temperature/70mb9065.gif
ren says:
As you can see the temperature in the stratosphere over the northern polar circle below the normal.
http://www.cpc.ncep.noaa.gov/products/stratosphere/strat-trop/gif_files/time_pres_TEMP_ANOM_ALL_NH_2014.gif
====
Firstly, there’s no such thing as “normal” in climate. If you are referring to some average it is best to say so.
Second, Arctic ice coverage tends to alternate ( though not infallibly ) so I’d be a little surprised if there a higher min than last year, even though I think we are now heading towards more ice on a multi-annual basis.
Best to avoid predictions, it’s a bit of coin flip and the one day annual min is pretty worthless as a metric. I used a 20 day low-pass to detect the length of melting seasons.
Leif Svalgaard says: August 14, 2014 at 10:27 am
…………………………..
NASA official statement in full regarding their observations: can be found here:
http://science.nasa.gov/science-news/science-at-nasa/2008/16dec_giantbreach/
Author of the article is Dr. Tony Phillips
It contradicts your contradiction: “I think there is no such ‘discovery’. If it were, geomagnetic activity would be different from what is observed, so the data is in direct contradiction to what is claimed. “
In my article
http://hal.archives-ouvertes.fr/docs/01/05/59/16/PDF/LODvsSSN.pdf
I have not relied on, or even mentioned the NASA’s discovery, but as it happens the analysis of geomagnetic datafrom Jackson & Bloxham is in full agreement with the NASA’s discovery.
I have to conclude that geomagnetic activity is not different from what is observed, what is your interpretation of the observed geomagnetic data, now or in the past I do not know.
We can go about this ad infinitum, but I have better things to do.
I am prepared to answer questions on my article, you ask the NASA’s Dr. Tony Phillips about his.
If you think that the NASA ‘screwed it up’, as you put it elsewhere, you take it up with them, I am not their spokesman.
vuk says:
August 14, 2014 at 11:29 am
I am prepared to answer questions on my article, you ask the NASA’s Dr. Tony Phillips about his.
He is not making the false statement that Themis contradicts my earlier finding. You are making that statement. So it is up to you to admit that you just made that up. You see, there is no paper showing this. And the data contradicts your claim.
Leif Svalgaard says: August 14, 2014 at 11:39 am
And the data contradicts your claim.
…………..
Paper is here:
http://hal.archives-ouvertes.fr/docs/01/05/59/16/PDF/LODvsSSN.pdf
– I used two sets of data: state which one.
– Quote directly from the above link which specific ‘claim’
Don’t bother going back to your tedious denigrating of the NASA’s findings, I read it one time too many.
“Another group has a paper in print in 2013 based on 2008 data from the five THEMIS spacecraft in conjunction with three of NOAA’s GOES (Geostationary Operational Environmental Satellites) spacecraft, and the ESA/NASA Cluster mission. Led by Michael Hartinger at the University of Michigan in Ann Arbor, this group compared observations at the bow shock where the supersonic solar wind brakes to flow around the magnetosphere to what happens inside the magnetosphere. They found that instabilities drive perturbations in the solar wind particles streaming towards the bow shock and that these perturbations can be correlated with another type of magnetized wave – ULF (ultra low frequency) waves – inside the magnetosphere. ULF waves, in turn, are thought to be important for changes in the radiation belts.
“The interesting thing about this paper is that it shows how the magnetosphere actually gets quite a bit of energy from the solar wind, even by seemingly innocuous rotations in the magnetic field,” says Angelopoulos. “People hadn’t realized that you could get waves from these types of events, but there was a one-to-one correspondence. One THEMIS spacecraft saw an instability at the bow shock and another THEMIS spacecraft then saw the waves closer to Earth.”
Since all the various waves in the magnetosphere are what can impart energy to the particles surrounding Earth, knowing just what causes each kind of wave is yet another important part of the space weather puzzle.”
http://www.nasa.gov/mission_pages/themis/news/six-years.html#.U-0Nn1V_sup
vukcevic says:
August 14, 2014 at 11:29 am
NASA official statement in full regarding their observations: can be found here:
http://science.nasa.gov/science-news/science-at-nasa/2008/16dec_giantbreach/
Author of the article is Dr. Tony Phillips
It contradicts your contradiction: “I think there is no such ‘discovery’. If it were, geomagnetic activity would be different from what is observed, so the data is in direct contradiction to what is claimed. “
If CMEs during even cycles have more southward magnetic field so that ‘more giant breaches’ are created geomagnetic activity for the magnetic storms caused by such CMEs should be significantly higher during even cycles than during odd cycles. The data since 1905 show that there is no difference between even and odd cycles http://www.leif.org/research/Even-Odd-Dst.png thus disproving yours [and as you claim NASA’s – except that NASA don’t make such ‘official’ statements -although NASA supported scientists may make any wild claim they want] contention. The result I show is perfectly understandable in the light of what we have learned since the 1970s.
I have not relied on, or even mentioned the NASA’s discovery, but as it happens the analysis of geomagnetic data from Jackson & Bloxham is in full agreement with the NASA’s discovery.
If your ‘analysis’ agrees with the false statement that geomagnetic activity is different between even and odd cycles, then your analysis is simply wrong [as is also painfully evident from just looking at it]. It should be clear that this silly ‘discussion’ can be ended right here with my conclusive demonstration of your folly.
“We call them X-points or electron diffusion regions,” explains plasma physicist Jack Scudder of the University of Iowa. “They’re places where the magnetic field of Earth connects to the magnetic field of the Sun, creating an uninterrupted path leading from our own planet to the sun’s atmosphere 93 million miles away.”
http://www.nasa.gov/mission_pages/sunearth/news/mag-portals.html#.U-0RilV_sup
vukcevic says:
August 14, 2014 at 12:33 pm
Paper is here:
That is your ‘paper’, not theirs. I your write-up you make a fundamental error: assigning a sign to the sunspot number that is opposite for the even and odd cycles. Thar alone creates a false 22-yr cycle even if all cycles were exactly alike. There is no 22-yr cycle in solar activity. The 22-yr cycles we see in cosmic rays and geomagnetic activity are geometrical effects that have nothing as such to do with the Sun and they go from maximum to maximum, not from minimum to minimum.
Don’t bother going back to your tedious denigrating of the NASA’s findings, I read it one time too many
Just shows that you are impervious to learning.
ren says:
August 14, 2014 at 12:47 pm
“We call them X-points or electron diffusion regions,” explains plasma physicist Jack Scudder of the University of Iowa. “They’re places where the magnetic field of Earth connects to the magnetic field of the Sun, creating an uninterrupted path leading from our own planet to the sun’s atmosphere 93 million miles away.”
Just confirming what has been surmised for decades.
Leif Svalgaard says: August 14, 2014 at 12:35 pm
If CMEs during even cycles have more southward magnetic field …..etc, etc
I have searched my article linked HERE
I could not wind such a quote, it is not my claim, as you apparently purported, thus I stop reading the further your tedious harangue.
Quote from my article (providing you read it), and you will get a polite answer to the best of my ability.
…
From Greg Goodman on August 14, 2014 at 12:39 am:
There is no “default standard when talking about sea ice” you are making that up. There are two measures, both of which are featured on the sea ice page here on WUWT.
The ARCUS predictions use extent, since they used NSIDC which uses extent. I quoted the reason IARC-JAXA uses extent. DMI has extent.
Cryosphere Today may use area. But their major product is slow-loading overly-decorative globe images of where the ice is and what concentration. A great triumph for graphics programmers, those images with their archives can be done automatically. Yet currently the image archive only shows to the end of 2013. Click for the “historical sea ice dataset”, note the first documentation link is 404, see the lack of updates. But also note there they have concentrations and extent available for download, not area.
Sea Ice page, “Arctic Sea Ice Forecast from NOAA”, extent. Nansen, extent and area.
NSIDC “Arctic Sea Ice News & Analysis”, extent. NSIDC does provide area data in their archives, but only monthly and in the same files with the monthly extent, and in no better form.
Clearly the default standard to use when talking about sea ice is extent. Area is “also used” status, and you should notice how people can talk about area while using extent figures. BTW there are also those pushing sea ice volume with PIOMAS, which technically is a third measure which you didn’t mention.
ren says:
August 14, 2014 at 12:47 pm
“They’re places where the magnetic field of Earth connects to the magnetic field of the Sun, creating an uninterrupted path leading from our own planet to the sun’s atmosphere 93 million miles away.”
As I showed conclusively 46 years ago: http://www.leif.org/research/DMI-R6.pdf
From Greg Goodman on August 14, 2014 at 12:45 am:
In estimating the length of the Arctic melting season I used the CT ice area data, which is less noisy than ice extent, which is highly dependent on weather conditions.
Cryosphere Today doesn’t have their own sea ice area data, their graphs clearly state it comes from NSIDC.
As IARC-JAXA pointed out, area is more error-prone than extent. By choosing area over extent because of noise, you are choosing the less accurate metric in the hope of being more accurate.
From your graph there, you list this file as source:
http://arctic.atmos.uiuc.edu/cryosphere/timeseries.anom.1979-2008
The numbers are small enough to be area. That link is on the Sea Ice page. But it is not an official product, the link is not found on the Cryosphere Today site, at least nowhere I can find it. It lacks documentation.
Can you tell me what climatology is used for the baseline for the anomalies? Sea Ice page says it is Northern Hemisphere Sea Ice Area. You said you were using it for the “Arctic melting season”, presumably Arctic Ocean sea ice. Do you know if this is Arctic Ocean basin data, or for the entire hemisphere, or is it using “Arctic” as above a certain arbitrary latitude?
If you can’t answer that, you shouldn’t be using that file. By the CT charts, they use NSIDC data. Can you show where that area info was sourced from NSIDC for verification purposes? If so, then why not go straight to NSIDC for it?
Have you noticed that strange numbering quirk, where YEAR.0027 is the first day of the YEAR, and YEAR+1 (no decimal) is the last day of YEAR?
This one is simple. Vuk says that, “…at the end of 2008 NASA’s Themis project comes with the series of observational data that contradict conclusions of your [1977] work”. Leif has demonstrated that the data shows it does not. Vuk is wrong. Either through ignorance of what he is looking at, or pigheaded unwillingness to admit that his mouth runneth over. Or in this case, his fingers.
vukcevic says:
August 14, 2014 at 1:10 pm
I could not find such a quote, it is not my claim, as you apparently purported
You should search this thread
vuk says:
August 12, 2014 at 3:52 am
Then NASA adds their recent discovery:
Solar coronal mass ejections CMEs in the even-numbered solar cycles tend to hit Earth with a leading edge that is magnetized north.
vuk says:
August 12, 2014 at 1:37 pm
!977 was a very, very long time ago, many new things have been discovered since, now there are 5 Themis satellites mapping solar-magnetosphere interactions.
vuk says:
August 13, 2014 at 12:03 am
Your theoretical treatise from 1977, may have been at the time, the corner stone of understanding, then at the end of 2008 NASA’s Themis project comes with the series of observational data that contradict conclusions of your work
vuk says:
August 13, 2014 at 11:40 am
NASA says there is the observational evidence as shown in their video presentation
vukc says:
August 14, 2014 at 8:42 am
Its implications can be viewed in the light of the NASA’s Themis satellite discovery, as contained in the key statement: ”For reasons not fully understood, CMEs in even-numbered solar cycles (like 24) tend to hit Earth with a leading edge that is magnetized north. Such a CME should open a breach and load the magnetosphere with plasma just before the storm gets underway..”
vuk says:
August 14, 2014 at 11:29 am
NASA official statement in full regarding their observations: can be found here:
http://science.nasa.gov/science-news/science-at-nasa/2008/16dec_giantbreach/
Author of the article is Dr. Tony Phillips
It contradicts your contradiction: “I think there is no such ‘discovery’. If it were, geomagnetic activity would be different from what is observed, so the data is in direct contradiction to what is claimed. “
vuk says:
August 14, 2014 at 11:29 am
<I have not relied on, or even mentioned the NASA’s discovery, but as it happens the analysis of geomagnetic datafrom Jackson & Bloxham is in full agreement with the NASA’s discovery.
That makes it your claim. But as I showed it is not supported by the data http://www.leif.org/research/Even-Odd-Dst.png , so can safely be ignored and put away [as your so-called paper can]. What you need to do is to admit that you have been fooled [again] by your zealous application of confirmation bias.
Pamela Gray says: August 14, 2014 at 2:21 pm
Vuk is wrong.
…………
Dear Ms Gray
Quote from my article
http://hal.archives-ouvertes.fr/docs/01/05/59/16/PDF/LODvsSSN.pdf
(providing you read it), submit your query or assessment of error/s, and you will get a polite answer to the best of my ability.
richard verney says:
August 11, 2014 at 9:07 pm
I do not disagree with what you said, but you completely ignored Dr Deanster’s question
I didn’t see a question mark in his comment. What question do you see?
Leif Says:
Should there be no warming, or indeed should there be some cooling, over the course of the next 15 to 20 years, and if the solar cycle(s) exhibit a low sunspot count, do you rule out that the sun may have played a role in the continuance of the pause
A low sunspot count should make a difference of something like 0.05C from that alone. I doubt that we can even measure that.
———————————————————-
The point I was getting at Leif, is that the equation that determins the amount of radiation reaching the surface is not just dependent upon TSI, but on a host of factors. TSI seems to be only relevant at the TOA. IF the sun in some way influences other atmosphereic processes, clouds, ocean currents, ozone characteristics, etc that influence the actual amount of TSI that would reach the surface, then it would seem to me that TSI would be a poor proxy to use for solar variation.
I”ve seen no research that conclusively excludes solar impacts on the other processes. Thus, the equation of S(1-a) is incomplete, as “a” itslef may contain some solar influences that are separate from variation in TSI. As I said, if aa index is a factor in some other process, like ocean currents, or cloud formation, then the conclusion that all solar variation is tied up in the TSI is incomplete, as “a” itself would be influenced by solar.
Dr. Deanster says:
August 14, 2014 at 3:11 pm
The point I was getting at Leif, is that the equation that determins the amount of radiation reaching the surface is not just dependent upon TSI, but on a host of factors.
Unless you have identified and quantified what those other factors might be [CO2 some would say 🙂 ] what you say is just hand waving with no substance. Your comment has too many ‘weasel words’ [would, seem, if, may, some], in fact ten of them in such a short comment.
Leif Svalgaard says: August 14, 2014 at 12:54 pm
assigning a sign to the sunspot number that is opposite for the even and odd cycles. Thar alone creates a false 22-yr cycle even if all cycles were exactly alike. There is no 22-yr cycle in solar activity.
Not exactly a quote.
Each hemisphere has 22 year sunspot magnetic cycle, open fluxes of opposite polarities, separated by the HCS and do not cancel out.
Direction of the magnetic vector in the northern hemisphere coincides with the direction of solar rotation during even-numbered cycles, B>0, while in the southern hemisphere B<0.
Relationship between direction of rotation and direction of the magnetic vector B is reversed
during odd-numbered cycles, hence 22 year magnetic cycle in each hemisphere.
No, cycles are not exactly alike
The long term the Earth’s core generated magnetic field is of a long term (thousands of years) of a fixed polarity, but as shown by authors quoted in the article, it has a variable ripple. This was converted into LOD by process described by the authors of the data, and quoted ad verbatim in the article.
Further on, it is shown that filtered remainder of the LOD has following property:
– periodic oscillation with period of ~ 22 years, spectrum is on page 7, and on page 6
– LOD increases (rotation slows down) are coincidental with even cycles
– LOD decreases (rotation speeds up) are coincidental with odd cycles
( the article’s title is ‘Length of day (LOD) coincidental correlation with solar activity’)
As an increase is normally associated with positive and a decrease with negative sign, the corresponding sunspot cycles are also assigned corresponding polarity.
vuk says:
August 14, 2014 at 4:11 pm
Each hemisphere has 22 year sunspot magnetic cycle, open fluxes of opposite polarities, separated by the HCS and do not cancel out. Direction of the magnetic vector in the northern hemisphere coincides with the direction of solar rotation during even-numbered cycles, B>0, while in the southern hemisphere B<0
And the direction of the magnetic vector in the southern hemisphere coincides with the direction of solar rotation during odd-numbered cycle, B>0), while in the northern hemisphere B<0.
The situation is completely symmetric, so no 22-yr cycle results. You make up a false cycle by reversing the sign.
As I said many times, you have no clue and what you ‘produce’ has no value. And you are still evading the real issue: show by providing links to relevant papers that the Themis project contradicts my earlier findings.
Vuk. I quoted your words. Are you saying those were not your words in the comment up thread? Is someone else typing under your name? I don’t give a pattuty about your article. We aren’t talking about your article. Either back up your own words from up stream or say you were wrong/spoke without thinking.
Salvatore Del Prete says:
August 14, 2014 at 3:04 pm
Anthony would it be possible to have an interview set up with Professor Lockwood and his latest solar findings and views that could be seen and heard over this web-site? I think at the very least it would create much interest and commentary.
Especially their key finding [which you say you subscribe to] that ‘there was no little ice age’.
Oooo Leif. For many here them’s fightin words! From all the reconstructions I have been able to find, there were a series of sudden cold events with warming in-between. The one mechanism that fits are the catastrophic series of sulfur laden stratospheric volcanic explosions that pepper that span of time. In my studies I learned that a VEI number in the high end does not necessarily mean a global event. There are volcanic explosions that are huge, but do not have a high sulfur content. There are other volcanic explosions that expel a tremendous amount of material but little of it gets into the stratosphere or stays very long. There are also explosions that are huge but because of their location, do not cause global [effects]. And finally there are yet still others that disrupt ENSO processes to the extent that as the local [effects] travel through the grand ocean highway, they affect local climates in a staggered fashion.
Taken all together, this is a subject I enjoy in the ring and love the fight!
[And your affections clearly have their intended effect. 8<) .mod]
Pamela Gray says:
August 14, 2014 at 8:20 pm
Oooo Leif. For many here them’s fightin words!
Regardless of the debate about volcanoes, Owens and Lockwood et al. claim that there was no little ice age [and that it therefore was not due to the Sun], and, strangely enough, SdP claims he subscribe to the Lockwood et al. view and wants him to come here and show us why there was no little ice age.
@Vukcevic
@Ulric
@Kadaka
this is from a paper from William Arnold, written in 1985. Had they not started with the CO2 nonsense at around the same time, I am sure we would ALL have carried on with this, building on it, rather than breaking it down, especially in the light of my latest finding that AGW is exactly 0.000K per annum…….
My comment in [BOLD]
VII. Theory of a Special Order
A positive correlation between the Primary 22-Year Sunspot Number Cycle and the Saturn-Uranus Synodic Cycle can be demonstrated by analysis of Figures 1 and 2. The data suggests that the synods or conjunctions and the oppositions occur during the downside of the Primary 22 Year Sunspot Number Cycle (“negative” alternation) as depicted in Figure 1. The 90°-quadratures of the Saturn Uranus Synodic Cycle occur during the upside (“positive”alternation). The Saturn-Uranus Synodic Cycle appears primarily causal to the Primary 22-Year Sunspot Number Cycle.
Other synodic cycles (probably, the “regular” Jupiter-Saturn) appear to enhance maximums, minimums, turnpoints and nodes. The Jupiter-Saturn Synodic Cycle appears to “alternate” in step with the 11-year alternating interval of the primary sunspot cycle.
A positive correlation between the Secondary 100-Year Sunspot Cycle, the 100-Year Weather Cycle (the Nile Flood Cycle) and Planetary Synodic Cycles can be demonstrated by analysis of Figures 1, 2, 3> 4 and 5. The data suggests that the smoothed cycle and lower number of sunspots at nodes during the 1648-1714, 1783-1829, 1874-1919 and the 19652009 (predicted) periods
[HERE MY FINDINGS ARE THAT SOMEHOW WILLIAM ARNOLD WAS OUT BY 7 years, i.e. THE SWITCH TIME WAS 1972 AND HOPEFULLY! WE WILL SWITCH AGAIN IN 2016]
corresponds with a lower Nile flood (drought) during the same intervals.
Both of these 100-year full-wave sunspot and weather cycles appear to be caused by the Saturn-Uranus Synodic Cycle of planetary conjunctions-oppositions of Figure 2 when oriented to the Galactic-Solar Axis (a line drawn through their respective centers, the galactic center at longitude 266.1314° and 086.1314′).
Significant enhancement of maximums, minimums, timing of turnpoints and nodal periods of both 100-year cycles appears to be caused also by the Jupiter-Uranus Synodic Cycle (Figure 3), the Uranus-Pluto Synodic Cycle (Figure 4) and the Uranus-Neptune Synodic Cycle (Figure 5) when also oriented to the G-S Axis.
Note the commonality of Uranus and its halfway position between the center and the fringe of our Solar-Planetary System to each of these synodic cycles. Perhaps, Uranus’ apparent “sideways” motion (inclination of equator, 98′) as distinct from the other large planets operates as a pushpull “trigger” of current-magnetic flow changes between the sun, its planets, and the galaxy.
VIII. EMF (Electro-Magnetic Force) of a Galactic-Solar-Planetary System Postulated,
see Figure 6
When Saturn and Uranus synod in the sector behind the sun oriented to the galactic center (circa 356° – 86° – 176°) [Ed.Note: 356° was originally published as 350°] and within the solar wind tail pushed behind the sun by the pressure of the galactic wind (Parker and Van Allens’ “cosmic radiation”), the 100-year sunspot activity reaches maximum values, centered round 1750, 1860, 1950 and 2030 predicted (Saturn and Uranus synod again behind the sun, 87 degrees,2032: see Figure 2, bottom data). In the same way the solar wind pushed the earth’s magnetic field into a tail behind the planet, it is postulated by this author that the galactic wind pushes the solar emf field into a tail behind the sun: a mechanical explanation suggests that the planets operate as conductor-inductors and cut more solar force field lines in the elongated space behind the sun, thus inducing enhanced sunspot activity (and electrical activity, Sheeley, 1964). The conclusion for the reduction of sunspot activity is also supported by the data. When these planets synod in the sector in front of the sun oriented to the galactic center (circa 176°-266°-356°) and outside the solar wind tail with its elongated and compressed force field lines, it is found the planet-conductor-inductors run parallel to the field lines and thereby cut less lines, sunspot activity reaches minimum values, centered round 1670, 1800, 1900 and 1990 predicted [IT WAS IN FACT 1995] (Saturn and Uranus synod again in front of the sun, 268 degrees, 1988: see Figure 2, bottom data). The steeper rise to sunspot maximum of each 11-year interval appears caused by the “narrower” zone of the elongated Solar wind tail behind the sun, while the slower slope of the sunspot minimum approach appears caused by the “wider” zone outside. The role of Jupiter (mass, 3X Saturn, Saturn in turn, 6X Uranus) appears to be secondary, magnifying or dampening maximums and minimums as well as altering the exact timing or turnpoints of both the 22-year and 100-year cycles. [APPARENT 90-100 YEAR CYCLE]
Note particularly (see Figure 2, bottom data) the start of the dampening cycle or curved 22-year Sunspot Cycle with the 1783 opposition, Uranus behind the sun and the middle with the 1806 synod and the end with the 1829 opposition, Saturn behind the sun at end; and finally note the predicted dampened period with the 1964 opposition,Uranus behind the sun, the 1988 synod in the middle and the 2009 opposition Saturn behind the sun; note, for variation of effect, the positions of the synods, or centers of the dampening effect, are rotating forward circa 30
degrees. Analysis of the magnified cycle or pointed 22-year Sunspot Cycle periods, 1829-1874 and 1919-1965, center on Saturn and Uranus synods behind the sun, at 1851 and 1942 [Ed. Note: originally published as 1806 and 1897], respectively. The 1600s and early 1700s reflect a period when the rotation of the synods occurred in an extreme dampening configuration whereas the opposite might occur in the next cycle, with the synod of 2032 resembling that
of 1942, behind the sun-nearly opposite the Galactic Center.
Note, the seemingly unusual start of the earliest dampening cycle with the 1648 opposition, Saturn behind the sun and the seemingly unusual double-middle of the 1671 synod at 340° and the 1691 opposition with Uranus behind the sun,and the seemingly unusual end of the cycle with the 1714 synod at 168°; also note, A. E. Douglass and E. W. Maunder demonstrated a positive correlation between this unusually-long dampened cycle of sunspot activity and tree-ring growth, dated 1645-1715 (Stetson, 1937).
In 1950 Slurzberg and Osterheld demonstrated “Lenz’s law is: when a current flowing through a circuit is varying in magnitude, it produces a varying magnetic field which sets up an induced emf (electro-magnetic force) that opposes the current change producing it ….The value of the induced emf in any conductor is proportional to the rate of cutting lines.” Figure 6 is an illustration diagram of the phenomenon.
IX. Philosophical considerations on an Ordered Galactic- Solar-Planetary System
Apparently, cycle variations, whether in magnitude, length, turnpoint, or nodal, occur because the conductor-inductors of the change (the planets) are not always in the same portion of the Solar field at the same time when the vital synods occur; and the strength and direction of the field blown behind the sun by the galactic wind (“cosmic radiation” of Parker and Van Allen, 1975) is constantly varying. Therefore, the expanding-contracting alternating magnetic field is constantly varying as must be the current supplying the Solar field. The sun appears to operate as a solenoid, a device for converting emf energy into mechanical, and vice-versa. Cycle theory will apply to the problem in the same manner sine-wave theory explains all a-c wave technology. The general laws of electronic inductance will account for the 90-degree lag between the sunfaculae and sunspot cycles. The regular 22-year and [APPARENT] 100 [88] year cycles as orchestrated in the”earthly” sphere by forces from the galactic center will seem at first to be quite deterministic. Certainly, the implications of Order on a cosmic scale down to the microcosm, earth, are staggering not only for science but, perhaps,more so for philosophy. The mechanical movement of planetary conductor-inductors in an impersonal emf field stretching from the Galaxy to the Sun to the Earth might determine broad eras of time in which the flow goes one way and then mechanically turns and flows opposite, but it does not take away “free willed” variations within these broader cycles. Indeed, man ought to be able to welcome Cosmic Order on the horizon as the dawning of the Age of Aquarius,the advent of the Music of the Spheres made manifest.
Author: William Arnold, 1985
I suspect he has passed on and has gone to be with the Lord?.
H
Why SCR and GCR radiation affects particularly the state of the polar vortex?
“BARREL’s job is to improve our understanding of the mysterious Van Allen belts, two gigantic doughnuts of radiation that surround Earth, which can shrink and swell in response to incoming energy and particles from the sun and sometimes expose satellites to harsh radiation. While in Antarctica, the team launched 20 balloons carrying instruments that sense charged particles that are scattered into the atmosphere from the belts, spiraling down the magnetic fields near the South Pole. Each balloon traveled around the pole for up to three weeks. The team will coordinate the BARREL data with observations from NASA’s two Van Allen Probes to better understand how occurrences in the belts relate to bursts of particles funneling down toward Earth.”
http://www.nasa.gov/content/goddard/nasas-barrel-returns-successful-from-antarctica/#.U-21W1V_sur
Leif Svalgaard says: August 14, 2014 at 6:42 pm
The situation is completely symmetric, so no 22-yr cycle results. You make up a false cycle by reversing the sign.
That is factually incorrect and you are well aware of it.
There are two solar hemispheric sunspots counts, not in any single cycle out of the 24 documented, there is a complete symmetricity ( as you claim) between the two hemispheres, but even if it were it would not matter for reasons of the HCS presence, as explained further down.
The facts are:
Even numbered sunspot cycles in the north hemisphere have positive orientated magnetic field i.e. B>0, while the odd cycles have negative orientated magnetic field or B0 followed by 11 years B<0) running simultaneously, one in each hemisphere, but of the opposite sign; however, the open fluxes do not mix and do not cancel out since they are separated by the HCS.
At the 1AU distance, the Earth’s magnetosphere encounters either of these two solar magnetic 22 year cycles, except for the short periods when Earth is transversing the HCS.
Earth therefore encounters two solar signals:
– non-signed 11 year TSI cycles, with a inconsequential variability.
– 22 year magnetic cycle from the either side of the HCS.
The 11 year TSI cycle is not detectable to a degree of significance in the GT data
The 22 year is present to significant degree, in the global and the hemispheric land and ocean temperature data.
Further more it is conclusively shown that:
The 22 year solar magnetic cycle is coincidental to a significant degree with the change in the Earth’s rotation rate. as measured by change in the length of day – LOD
http://hal.archives-ouvertes.fr/docs/01/05/59/16/PDF/LODvsSSN.pdf
Supporters of status quo may dislike the implication, but that will not make it disappear.
Any squabble you might have with the Themis project findings, you are welcome to take up with the NASA and Dr. Phillips, his email as quoted on the NASA’s website is: james.a.phillips (-at-) earthlink.net
..
“It is because of the unprecedented high energy and temporal resolution of our energetic particle experiment, RBSPICE, that we now understand that the inner belt electrons are, in fact, always organized in zebra patterns,” said Aleksandr Ukhorskiy of the Johns Hopkins Applied Physics Laboratory (APL) in Laurel, Md., co-investigator on RBSPICE and lead author of the paper. “Furthermore, our modeling clearly identifies Earth’s rotation as the mechanism creating these patterns. It is truly humbling, as a theoretician, to see how quickly new data can change our understanding of physical properties.”
http://vanallenprobes.jhuapl.edu/newscenter/newsArticles/20140319.php
WordPress garbled section of the second paragraph, something to do with ‘more than’ & ‘less than’ characters:
It should be (es expressed in words)
Even numbered sunspot cycles in the north hemisphere have positive orientated magnetic field i.e. B more than 0, while the odd cycles have negative orientated magnetic field or B less than 0.
In the south hemisphere situation is reverse.
Implication is clear: there are two 22 year (11 years B more than 0, followed by 11 years B less than 0) running simultaneously, one in each hemisphere, but of the opposite sign; however, the open fluxes do not mix and do not cancel out since they are separated by the HCS.
“Beginning with the discovery of a transient third radiation belt just days after the Van Allen Probes launched from Cape Canaveral Air Force Station (Fla.) on August 30, 2012, the mission has produced many findings that are altering our knowledge of the belts and how they operate. The spacecraft have revealed a massive particle accelerator in the heart of the belts; proven that electrons in the belt are undergoing strong local acceleration from very low frequency plasma waves, and not from an external force; discovered electric field transients called double layers that may energize the seed particle population that becomes the radiation belt population, provided data that can improve space weather models which can benefit space-based technologies and human spaceflight; and shown that persistent structures exist in the inner belt, which are caused by Earth’s rotation, a mechanism previously thought to be incapable of such an effect.
“All of these fundamental findings are, in very real ways, changing much of what we thought we knew about the radiation belts and plasma physics,” said Barry Mauk of the Johns Hopkins University Applied Physics Laboratory, Van Allen Probes project scientist.”
http://vanallenprobes.jhuapl.edu/newscenter/newsArticles/20140423.php
For sake of clarity I will re-post again (with apology, it would be appreciated if the moderator would kindly delete two of mine most recent comments)
Leif Svalgaard says: August 14, 2014 at 6:42 pm
The situation is completely symmetric, so no 22-yr cycle results. You make up a false cycle by reversing the sign.
That is factually incorrect and you are well aware of it.
There are two solar hemispheric sunspots counts, not in any single cycle out of 24 documented, there is a complete symmetricity ( as you claim) between the two hemisphere, but even if it were it would not matter for reasons of the HCS presence, as explained further down.
The facts are:
Even numbered sunspot cycles in the north hemisphere have positive orientated magnetic field, while the odd cycles have negative orientated magnetic field.
In the south hemisphere situation is reverse.
Implication is clear: there are two 22 year magnetic cycles (11 years of positive B followed by 11 years of negative B), running simultaneously, one in each hemisphere, but of the opposite sign, however the open fluxes do not mix and do not cancel out since they are separated by the HCS.
At 1AU distance, the Earth’s magnetosphere encounters either of these two solar magnetic 22 year cycles, except for the short periods when Earth is transversing the HCS.
Earth therefore encounters two solar signals:
– non-signed 11 year TSI cycles, with a inconsequential variability.
– 22 year magnetic cycle from the either side of the HCS.
The 11 year TSI cycle is not detectable to a degree of significance in the GT data
The 22 year solar magnetic cycle is present in the global and hemispheric land and ocean temperature data.
Further more now it has conclusively shown that:
The 22 year solar magnetic cycle is coincidental to a significant degree with the change in the Earth’s rotation rate. as measured by change in the length of day – LOD
http://hal.archives-ouvertes.fr/docs/01/05/59/16/PDF/LODvsSSN.pdf
Supporters of status quo may dislike the implication, but that will not make it disappear.
Any squabble you might have with the Themis project findings, you are welcome to take up with the NASA and Dr. Philips email as quoted on the NASA’s website is: james.a.phillips (-at-) earthlink.net
Please pay attention to pressure anomalies over the polar circles. The lower stratosphere.
http://pl.tinypic.com/view.php?pic=148py5h&s=8#.U-3H11V_suo
Pamela Gray says:
August 14, 2014 at 7:00 pm
Vuk. I quoted your words. Are you saying those were not your words
………………
No Ms Gray, I am not, they are mine and mine alone, even if they weren’t I would be indeed terrified of your onslaught, if I attempted deny it. So, yes I wrote the word ‘CONTRADICT’
If someone as clever, handsome, successful and desperately attractive to a let’s say , not so mature lady, has written a paper and disputes alternative findings, in my little primitive mind it means ‘conflict’ or contradiction in the ideas, if they are mutually exclusive then one finding contradicts the other.
However, if they are not mutually exclusive, there is no contradiction, so we all can go back to our pet preoccupations, here, I noted your recent fascination with volcanic eruptions …. I better stop there.
No doubt, you will insist in your opinion being correct one, and having the last word on the matter (such is a nature of things) and by all means do.
.
vuk says:
August 15, 2014 at 12:35 am
22 year magnetic cycle from the either side of the HCS
The sign of the large-scale magnetic field on either side of the HCS changes at solar maximum [more correctly at polar field reversals], not at solar minimum, so is not tied to even-odd cycle parity. Therefore there is no even-odd effect [as I have shown you], but a polar field reversal to polar field reversal cycle, in geomagnetic activity, in cosmic ray modulation, and in HMF polarity. So it is nonsense to assign a sign to the sunspot number based on even-odd considerations. There is no 22-yr period in solar activity. On the Sun, the solar cycle mechanism works by the magnetic field cancelling out across the equator, but transported to the poles [and into the Sun] to act as a seed for the next cycle.
Any squabble you might have with the Themis project findings, you are welcome to take up with the NASA
It is you who claim that their findings contradict the data [and my earlier work] so it is you who must provide links to papers that claim such contradiction. But you seem to be a master of evasion. One might interpret that as you simply being wrong, but not man enough to admit it and leave it at that. I have no problem with the Themis team as they have never published anything that contradicts the data [and my findings].
vukcevic says:
August 15, 2014 at 12:49 am
Implication is clear: there are two 22 year (11 years B more than 0, followed by 11 years B less than 0) running simultaneously, one in each hemisphere, but of the opposite sign; however, the open fluxes do not mix and do not cancel out since they are separated by the HCS.
Again: there is no HCS on the Sun. The HCS appears in space several solar radii above the surface. On the Sun, it is essential for the dynamo that leader sunspot magnetic fields move towards and cancel at the equator while fields of the opposite sign [from the follower spots] move towards the poles to act as seeds for the next cycle. The large scale solar magnetic field [on the sun and in the heliosphere] thus changes at solar maximum when the polar fields reverse, so there is no even-odd cycle but a polar-field-reversal cycle.
It seems that you are not man enough to admit that you made up the contradiction notion, so one might expect your evasion to continue.
@vukcevik
best is to leave Leif alone
my theory, based on my own findings,
is that we have 2 x ca.22 year cycles from 1972,
clearly visible here:
http://ice-period.com/wp-content/uploads/2013/03/sun2013.png
It is called the Hale or the Hale-Nicholson cycle, i.e. one full wave of two Schwabe cycles makes for one whole Hale cycle.
The turning points for the Gleissberg were 1927 and 1972 but the change of sign in Celsius was in 1995.
The 1995 date can be easily calculated from the formulae at the end of my tables:
http://blogs.24.com/henryp/files/2013/02/henryspooltableNEWc.pdf
Note that you can draw bi-nomials for the decrease in solar polar field strengths.
So 1995 is the middle point. Consequently it will not start warming again until 2038.
That is to say: if we donot miss the switch up again in 2015 or 2016…..
At the time the switch on the sun does occur I expect the graph [of the solar polar field strengths] for the next 44 years or so to be the exact mirror of the previous 44 years.
Consequently it will not start warming again until 2038.
Actually, MoreCarbonHenry, Monty Python’s illustrative series on historical events invited William Arnold to appear in this segment in which he did a great job describing the very thing you have referred our attentions to. I believe him to be the third expert (but do correct me if I am in error):
Leif Svalgaard says: August 15, 2014 at 4:06 am
One might interpret that as you simply being wrong, but not man enough to admit it and leave it at that. I have no problem with the Themis team…………….
There is no 22-yr period in solar activity. On the Sun, the solar cycle mechanism works by the magnetic field cancelling out across the equator……
Let’s deal first with the last.
Fearing oncoming onslaught from the Oooo Leif, fightin words! most enthusiastic and passionate defender of the Svalgaard credo , being not man enough is a minor concern, it is finding the nearest exit for flight to safety that matters.
If Themis doesn’t contradict anything you written about in 1977, that it is fine with me, but if it makes you feel better in going on and on about word ‘CONTRADICT’(contra dictum = speak against) there is a little I can do about it. In no way I consider it to be any kind of insult, but even if you do, since I don’t expect or get any apologies from insults thrown at me on numerous occasions, I offer none.
Now after that is out of way, as far as I am concerned, I am happy to discuss validity or not of what I have written.
I’ll just reiterate, the sun’s north hemisphere has 22 year magnetic cycles, made of 11 years of positive magnetic field orientated pairs of sunspots, and 11 years of negative magnetic field orientated pairs of sunspots.
Not only it is not un-physical, but it is correct to have positive and negative sunspot magnetic field cycles in the north hemisphere, coinciding what we know as even and odd numbered cycles.
The opposite is valid for the south hemisphere.
Essential point here is that the 22 year magnetic cycles of open flux associated with sunspot occurrence in the two hemispheres do not mix, do not cancel out, they exist in parallel and are often shown as the north south solar activity asymmetry.
Calling to the rescue on the cancellation across the solar equator, it does not occur with active sunspots, it is assumed that it happens somewhere deep down from the decayed (let’s say dead) sunspots remnants.
There are no images of the active sunspots magnetic fields connecting and cancelling across the solar equator, and until you show that that is a regular, dominating and documented factor in the solar activity, your assertion can not be accepted as valid.
Anyway, even if it were, it wouldn’t matter for the Earth’s interactions, where the open flux is of the essence.
There is 22 cycle all over the global, hemispheric land and ocean temperature records, but no statistically significant 11 year cycle in the same records.
Further more 22 year cycle has significant presence in the Earth’s core magnetic field, as shown in my article. There are two possibilities here:
– either 22 year cycles come from the sun directly (or indirectly, say the ENSO and monsoons) or
– there is a common cause for both, the solar magnetic field and the Earth’s core 22 year magnetic cycles.
Combination of two cannot be excluded.
Blockade over polar circle in the zone of the southern magnetic pole.
http://www.cpc.ncep.noaa.gov/products/precip/CWlink/blocking/real_time_sh/500gz_anomalies_sh.gif
vukcevic
http://wattsupwiththat.com/2014/08/11/a-gleissberg-solar-minimum/#comment-1709632
henry says
well done Vuk!
Looks to me like you have beaten the life out of Leif
@ ren,
Read this:
http://wattsupwiththat.com/2013/03/04/mysterious-electron-stash-found-hidden-among-van-allen-belts/
Shortly after launch, the spacecraft activated their Relativistic Electron-Proton Telescope (REPT) instruments to measure particles within the belts and their immediate environs. The instrument immediately detected on September 1, 2012, the presence of a stable zone of high-energy electrons residing between the belts. This donut-shaped third ring nestled between the belts existed for nearly a month before being obliterated by a powerful shockwave of particles emanating from center of the solar system.
The comments are also very interesting. Example:
lsvalgaard says:
March 4, 2013 at 3:16 pm
vukcevic says:
March 4, 2013 at 1:36 pm
so if there is permanent strong Sun-Jupiter electric current / magnetic field link and the Earth got caught in it, there should be another ‘appearance’ some 13 months later i.e. in October 2013.
But since there is no such link, nothing will happen [and it should happen only then and not at times where there is no lineup]. But, as a prediction, you post is significant. But in keeping with the scientific method, if nothing happens, you must drop the idea. Conversely if shown correct.
I wonder how that turned out.
Pam
http://wattsupwiththat.com/2014/08/11/a-gleissberg-solar-minimum/#comment-1709618
henry says
it is all so simple to me that I cannot – for the life me – get it that you do not understand it.
May be you think that “climate science” must be more complicated?
maybe it is true that only 0.3% of all weight of the solar system is in the planets, but it must be significant. Remember, the planets are turning at great speeds, so it is not just weight. Maybe they work together like a crowbar?
I know that just like Leif you actually believe that out of [absolutely] nothing came [absolutely] everything that we see around us. Now for you to believe that such a miracle could have happened is very funny to me….
[jut poking some fun with you, like you did with me]
Vuk says
http://wattsupwiththat.com/2014/08/11/a-gleissberg-solar-minimum/#comment-1709632
henry says
well done Vuk!
Looks to me like you have beaten the life out of Leif
JUNE 2014 MAGNETIC FIELD.
http://www.esa.int/var/esa/storage/images/esa_multimedia/images/2014/06/june_2014_magnetic_field/14582208-1-eng-GB/June_2014_magnetic_field_node_full_image_2.jpg
http://www.esa.int/Our_Activities/Observing_the_Earth/Swarm/Swarm_reveals_Earth_s_changing_magnetism
“These changes are based on the magnetic signals stemming from Earth’s core. Over the coming months, scientists will analyse the data to unravel the magnetic contributions from other sources, namely the mantle, crust, oceans, ionosphere and magnetosphere.
This will provide new insight into many natural processes, from those occurring deep inside our planet to space weather triggered by solar activity. In turn, this information will yield a better understanding of why the magnetic field is weakening.”
vuk says:
August 15, 2014 at 6:02 am
being not man enough is a minor concern, it is finding the nearest exit for flight to safety that matters.
A coward’s excuse.
If Themis doesn’t contradict anything you written about in 1977, that it is fine with me
So, you [finding a way to the exit] retract your statements that the Themis team has discovered something that contradicts the data and my earlier finding. You are still not man enough to actually say so, but now you have another chance.
positive and negative sunspot magnetic field cycles in the north hemisphere, coinciding what we know as even and odd numbered cycles. The opposite is valid for the south hemisphere.
So combined there is no net effect.
Essential point here is that the 22 year magnetic cycles of open flux associated with sunspot occurrence in the two hemispheres do not mix, do not cancel out, they exist in parallel and are often shown as the north south solar activity asymmetry.
Your big mistake is to believe that the sunspot fields are the ‘open flux’. They are not. Sunspot magnetic fields are Closed Flux and do not map out into space.
Calling to the rescue on the cancellation across the solar equator, it does not occur with active sunspots, it is assumed that it happens somewhere deep down from the decayed (let’s say dead) sunspots remnants.
The cancellation is an observational fact as has been known for decades
http://solarphysics.livingreviews.org/open?pubNo=lrsp-2012-6&page=articlesu1.html :
“This latitudinal separation combined with the effects of meridional flow and the dispersal of magnetic flux out from complexes of activity, leads to the preferential transport poleward of the following polarity. In contrast, the leading polarity in each hemisphere, which lies at lower latitudes, partially escapes the effect of meridional flow to disperse and cancel across the equator.”
http://sun.stanford.edu/LWS_Dynamo_2009/Wang_apj_707_2_1372.pdf :
“What happens is that the leader flux, being located at lower latitudes, preferentially diffuses across the equator and annihilates its opposite-hemisphere counterpart”
http://etd.library.vanderbilt.edu/available/etd-03212014-134603/unrestricted/Upton_Lisa.pdf :
“As the cycle progresses, the active regions emerge closer and closer to the equator, an
effect known as Sporer’s Law. Cancellation of polarity across the equator leaves behind an excess of following polarity that is transported to the poles.
This is a well-known, well-observed, and well-documented process.
even if it were, it wouldn’t matter for the Earth’s interactions, where the open flux is of the essence.
So, it is good that you realize that all your nonsense about sunspots was just a red herring.
The open flux has two components: the polar fields which reverse at solar maximum [i.e. have no even-odd parity] and the magnetic fields dragged by escaping CMEs. CMEs come from both hemispheres and so have no preferred magnetic configuration, so also do not obey any even-odd cycle. Hence the importance of the purported contradiction that you used to peddle, but have now abandoned [running for the exit].
There is 22 cycle all over the global, hemispheric land and ocean temperature records, but no statistically significant 11 year cycle in the same records.
No 22-yr cycle, but there may be a weak 25-yr quasi-cyclic multidecadal variation which may give the very weak signal in the LOD because of changing moment of inertia as the atmosphere ‘breathes’ following the temperature changes.
The Earth’s core has nothing to do with anything solar.
As I said, you have no clue and your ‘paper’ has no value.
Salvatore Del Prete says:
August 15, 2014 at 7:33 am
“Especially their key finding [which you say you subscribe to] that ‘there was no little ice age’.”
More denial. Oh well..
Yeah so much for Lockwood and Owens’ denial. Here are some screenshots from one of their recent presentation: http://www.leif.org/reseach/No-LIA-Lockwood-2014.png
It might be an excellent idea to invite Lockwood to explain to us that there was no LIA.
Checking in on you folks once in a while is so interesting. Re: Our buddy from Poland posting about the magnetic fields. How much has earth’s magnetic field weakened and should we be concerned about it? Does this have an effect on ozone and then pressure anomalies at the polar areas? I’m kind of getting it, Ren.
Salvatore Del Prete says:
August 15, 2014 at 7:33 am
“Especially their key finding [which you say you subscribe to] that ‘there was no little ice age’.”
More denial. Oh well..
Yeah, so much for Lockwood and Owens’ denial. Here are some screenshots from one of their recent presentation: http://www.leif.org/research/No-LIA-Lockwood-2014.png
It might be an excellent idea to invite Lockwood to explain to us that there was no LIA.
One of thousands of studies that show beyond a doubt the LIA was real.
http://muller.lbl.gov/pages/iceagebook/history_of_climate.html
My main interest with h Lockwood is his views on the extent of solar variability the Little Ice Age takes care of itself.
That is 100% provable.
@vuk
3 days before June 3rd 2007: http://snag.gy/36Wm1.jpg
3 days before Sept 1st 2012: http://snag.gy/4JpNj.jpg
Of course a lot of folk here won’t like it, but there are too many stelliums and syzygies of Venus Mercury and Ceres at high solar activity events for it to be chance.
Ed Martin
For example, the South Atlantic Anomaly is an area where the magnetic field is particularly weak – in fact, it is only half as strong as in Europe. This is problematic for satellites orbiting Earth, and the majority of technical faults occur when they pass through this region.
The difference in location between magnetic north and true north is called the magnetic deviation; not only is the gap getting bigger, it is shifting at an increasing rate. Prior to 1994, it was estimated that the magnetic north pole was moving at about 10 km a year, but since 2001 this has increased to around 65 km a year.
In June 2014, after just six months collecting data, Swarm confirmed the general trend of the field’s weakening, with the most dramatic declines over the Western Hemisphere. But in other areas, such as the southern Indian Ocean, the magnetic field had strengthened since January. The measurements also confirmed the movement of magnetic North towards Siberia. These changes are based on the magnetic signals stemming from Earth’s core.
Magnetic field changes:
http://www.esa.int/var/esa/storage/images/esa_multimedia/images/2014/06/magnetic_field_changes/14582173-1-eng-GB/Magnetic_field_changes_node_full_image_2.jpg
Salvatore Del Prete says:
August 15, 2014 at 10:00 am
My main interest with h Lockwood is his views on the extent of solar variability the Little Ice Age takes care of itself.
Clearly he believes that solar variability is not large enough to cause a LIA. And you subscribe to his ideas.
Ed Martin
“Full name: Swarm
Objectives: To offer a unique view inside Earth to study: core dynamics, geodynamo processes and core–mantle interaction; magnetism of the lithosphere and its geological context; 3D electrical conductivity of the mantle related to composition; magnetic signature related to ocean circulation. In addition, Swarm data will be used to study the Sun’s influence on Earth system by: analysing electric currents in magnetosphere and ionosphere; understanding the impact of solar wind on dynamics of the upper atmosphere.”
http://www.esa.int/Our_Activities/Observing_the_Earth/Swarm/Facts_and_figures
Ed Martin, compare the number of counts of neutrons depending on the latitude.
http://neutronm.bartol.udel.edu/~pyle/RTPlots.html
Not only was there a Little Ice Age at high confidence, but also previous cold spells at roughly regular intervals during the Holocene & all prior interglacials & glacials. Here’s the Holocene (the 8.2 Ka event is mislabeled as the “Egyptian Cooling”; “Mesolithic” or “Chalcolithic” would fit better):
http://c3headlines.typepad.com/.a/6a010536b58035970c013482e6a00e970c-pi
Leif Svalgaard says: August 15, 2014 at 9:00 am
……….
Relating to futile, undignified and self-demeaning ‘ad hominem’:
It is not any intention of mine to get involved or answer to a never-ending line of inappropriate provocations, always employed when short of convincing argument.
On items discussed::
Relating to Earth:
the Earth’s rotation: slows down during even cycles
the Earth’s rotation speeds up during odd cycles.
Relating to solar hemispheric magnetic cycles:
The sun’s north hemisphere has 22 year magnetic cycles, made of 11 years of positive magnetic field orientated pairs of sunspots, and 11 years of negative magnetic field orientated pairs of sunspots, coinciding what we know as even and odd numbered cycles. The opposite is valid for the south hemisphere.
Magnetic field of active sunspots pairs does not close and neutralise with opposite pairs across solar equator.
Relating to NASA:
NASA’s statement is on the record on their official website:
For reasons not fully understood, CMEs in even-numbered solar cycles (like 24) tend to hit Earth with a leading edge that is magnetized north.
http://science.nasa.gov/science-news/science-at-nasa/2008/16dec_giantbreach/
None of the above, despite of hundreds of words dispensed, you manage to disprove.
Henry P
“This study has focused on ionospheric electric currents flowing on the nigh side at low and
mid latitudes. Their magnetic field signatures cannot be neglected by main and crustal
magnetic field modellers. These are in particular small- and larger-scale pressure gradient and
gravity-driven currents.”
http://esamultimedia.esa.int/docs/EarthObservation/FR_20943_Swarm_Iono.pdf
@ren
I think that magnetic field story will also turn out to be a red herring.
[In my opinion] the declining solar polar fields [until 2016] is causing a very small shift in the TSI’s chi-square distribution, more towards the release of the most energetic particles. The sun is brighter now, even somewhat hotter, with less spots. Ironically, a brighter sun causes a cooler earth. Our lives depend upon earth’s defense system to protect us from this very harmful radiation of the shortest SW. Hence we have more oxygen and H-O and nitrogen reacting to form more ozone, peroxides and nitrogenous oxides.
More of these compounds TOA means less UV into the oceans. Hence we are cooling,
vukcevic says:
August 15, 2014 at 11:10 am
It is not any intention of mine to get involved or answer to a never-ending line
May I remind you who started this never-ending line, and who is not man enough to admit he was wrong.
Magnetic field of active sunspots pairs does not close and neutralise with opposite pairs across solar equator.
I gave you several references to the fact that they do as this image from today shows http://sdowww.lmsal.com/sdomedia/SunInTime/2014/08/15/f_HMImag_171pfss.jpg . But that this is actually irrelevant as sunspots are closed flux which is not the open flux that exists in the heliosphere and that you think is the important element.
NASA’s statement is on the record on their official website:
“For reasons not fully understood, CMEs in even-numbered solar cycles (like 24) tend to hit Earth with a leading edge that is magnetized north.”
You have not shown any papers that corroborate that. And the data contradicts the claim as there is no difference in geoeffectiveness between even and odd cycles which there would be if the ‘giant breach’ only occurred in even-numbered cycles http://www.leif.org/research/Even-Odd-Dst.png
None of the above, despite of hundreds of words dispensed, you manage to disprove.
The above plot is direct disproof. But you have not managed to find any support for your false claim, not are man enough to admit you are wrong.
Salvatore Del Prete says:
August 15, 2014 at 11:15 am
In denial. It is laughable. .
It seems that your hero is now ‘laughable’, as he denies the existence of the LIA.
sun – global surface temperatures
NASA THEMIS space project:
CMEs in even-numbered solar cyclestend to hit Earth with a leading edge that is magnetized north initiating powerful geomagnetic storms.
http://science.nasa.gov/science-news/science-at-nasa/2008/16dec_giantbreach/
Vukcevic:
the Earth’s rotation rate as measured by the change in the Earth’s length of day – LOD., slows down during even-numbered solar cycles
http://hal.archives-ouvertes.fr/docs/01/05/59/16/PDF/LODvsSSN.pdf
JPL-NASA:
Earth’s surface temperature is correlated with the changes in Earth’s length of day – LOD.
http://www.nasa.gov/topics/earth/features/earth20110309.html
milodonharlani
http://wattsupwiththat.com/2014/08/11/a-gleissberg-solar-minimum/#comment-1709824
henry says
I like your graph there
but I am a bit puzzled about the description “degrees Centigrade”
You mean degrees Celsius? Kelvin?
[maybe it is because I am not USA?]
This plot prepared by Ron Turner of Analytic Services, Inc., shows the smoothed sunspot number of Cycle 24 (red) vs. the previous 23 cycles since 1755.
http://science.nasa.gov/media/medialibrary/2014/06/10/plot.jpg
http://science.nasa.gov/science-news/science-at-nasa/2014/10jun_solarminimax/
Leif Svalgaard says: August 15, 2014 at 11:46 am
………..
Tedious, irrelevant and best ignored.
REPLY: Dear Mr. Vukcevic, regarding your comment above.
Take a time out until Monday of next week. I grow tired of your tedium in comments You cause extra work for everyone. – Anthony Watts
vukcevic says:
August 15, 2014 at 12:00 pm
NASA THEMIS space project:
CMEs in even-numbered solar cycles tend to hit Earth with a leading edge that is magnetized north initiating powerful geomagnetic storms.
Data shows otherwise: there is no difference in geomagnetic storms between even and odd cycles, and that demolishes the whole premise of your ‘paper’. http://www.leif.org/research/Even-Odd-Dst.png [and BTW to initiate a storm you need a leading edge magnetized south, but since your claim is not true in the first place, that particular screw-up is irrelevant].
Earth’s surface temperature is correlated with the changes in Earth’s length of day – LOD.
LOD depends on the extent of the atmosphere, so will depend on the temperature of said atmosphere. Nothing special about that.
moreCarbonOK[&theWeatherisalwaysGood]HenryP said on August 15, 2014 at 12:05 pm:
@all
is there anyone on this blog now who actually denies that it is globally cooling?
They requested 15 years for proof global warming had stopped, then extended to 17. We should wait at least 15 years to declare global cooling, perhaps 17, unless it clearly and undeniably becomes statistically significant before then with no sign of turning back.
And since the lack of significant warming and the recent cooling coincides with the negative phase of the ~60yr PDO pseudo-cycle, and the AMO just flipped, it seems more likely we will see warming again when the natural cycles line up again than it does that we are entering a new little ice age. Much more likely.
kadaka said
” and the AMO just flipped,”
Hardly, it will stay in its warm mode while solar activity continues weak:
http://www.woodfortrees.org/plot/esrl-amo
@kadaka
thanks for that comment
unfortunately it does not fit [my] reality
i.e. downward trend for most of the major indices since 2002 is clear
http://www.woodfortrees.org/plot/hadcrut4gl/from:1987/to:2015/plot/hadcrut4gl/from:2002/to:2015/trend/plot/hadcrut3gl/from:1987/to:2015/plot/hadcrut3gl/from:2002/to:2015/trend/plot/rss/from:1987/to:2015/plot/rss/from:2002/to:2015/trend/plot/hadsst2gl/from:1987/to:2015/plot/hadsst2gl/from:2002/to:2015/trend/plot/hadcrut4gl/from:1987/to:2002/trend/plot/hadcrut3gl/from:1987/to:2002/trend/plot/hadsst2gl/from:1987/to:2002/trend/plot/rss/from:1987/to:2002/trend
but these major indices are not [even] properly balanced by taking equal stations NH and SH
According to my own 3 data sets it is cooling since 2000
http://blogs.24.com/henryp/files/2013/02/henryspooltableNEWc.pdf
and all results show that global cooling is accelerating further downwards.
Unless something drastically happens on the sun I don’t see how you can turn this global cooling back to warming again.
Unfortunately, putting more CO2 up in the air is an idea that simply won’t work.
[note the last graph on minima which is supposed to rise in the face of rising GHG….]
From Ulric Lyons on August 15, 2014 at 12:49 pm:
Hardly, it will stay in its warm mode while solar activity continues weak:
http://www.woodfortrees.org/plot/esrl-amo
http://www.woodfortrees.org/plot/esrl-amo/to:2014/mean:13/plot/esrl-amo/to:2014/mean:61/
Warm mode? At best it’s a multi-pronged peak, two or so. And while the AMO is said to be 40 years, the trough-to-trough looks about 30, and the shape appears sawtooth with a fast ramp-up.
http://www.woodfortrees.org/plot/esrl-amo/from:1950/to:2014/mean:13/normalise/plot/sidc-ssn/from:1950/to:2014/mean:13/normalise/
Did you notice it is normal for the AMO to lead solar activity? The AMO can go warm while solar activity is still weak.
kadaka said
“And while the AMO is said to be 40 years, the trough-to-trough looks about 30,”
It looks more like 65yrs trough-to-trough:
http://www.woodfortrees.org/plot/esrl-amo
And it tends to out of phase with solar cycles in its warm mode, and in phase with solar cycles in its cold mode:
http://www.woodfortrees.org/plot/esrl-amo/every:13/normalise/plot/sidc-ssn/from:1850/normalise
kadaka said
“Did you notice it is normal for the AMO to lead solar activity? The AMO can go warm while solar activity is still weak.”
I noticed that it went warm AS solar activity weakened from 1995, which is why it will stay warm while solar activity remains weak:
http://snag.gy/dXp1s.jpg
REPLY: Dear Mr. Vukcevic, regarding your comment above.
Take a time out until Monday of next week. I grow tired of your tedium in comments You cause extra work for everyone. – Anthony Watts
Dear Mr Watts
Fair enough, will do. Spent far too much time here in the last 2-3 days anyway, you have done me a favour, have some other jobs need doing. Normally I make 2-3 short comments on selected threads, but for some reason this time I’ve got carried away. Apologies to mods for all the trouble.
All the best .
regards
m.a.vukcevic
From Ulric Lyons on August 15, 2014 at 2:07 pm
It looks more like 65yrs trough-to-trough:
Sorry, I was counting tick marks while making supper, was counting by ten.
And it tends to out of phase with solar cycles in its warm mode, and in phase with solar cycles in its cold mode:
http://www.woodfortrees.org/plot/esrl-amo/every:13/normalise/plot/sidc-ssn/from:1850/normalise
Why only display every 13th month for the AMO?
I had truncated it at 1950 as SIDC-SSN does not have the pre-1947 20% correction. Oh well, this is just looking at timing.
http://www.woodfortrees.org/plot/esrl-amo/from:1860/to:1940/mean:61/normalise/plot/sidc-ssn/from:1860/to:1940/mean:61/normalise/plot/hadcrut4gl/from:1860/to:1940/mean:61/normalise/
SSN trough to AMO peak
~1865 before ~1867
~1878 before ~1879
~1889 same
~1901 after ~1899
~1913 after ~1908
~1923 after ~1915
~1933 after ~WHAT? AMO going berserk and up.
http://www.woodfortrees.org/plot/esrl-amo/from:1940/to:2014/mean:61/normalise/plot/sidc-ssn/from:1940/to:2014/mean:61/normalise/plot/hadcrut4gl/from:1940/to:2014/mean:61/normalise/
SSN trough to AMO peak
~1942 same
~1953 after ~1952
~1964 after ~1960
~1975 after ~1969
~1986 after ~1980
~1996 after ~1990
~2008 after ~1999
You know, offhand, that REALLY looks more like two cycles with different period lengths. Did you ever do a match-up like that?
2004
http://hal-insu.archives-ouvertes.fr/docs/00/00/19/81/PDF/solar_synchronisation.pdf
Synchronising effect of planetary resonance
M. A. Vukcevic, M.Sc
This article investigates and demonstrates the combined effect from two major planets at the centre of the Solar system. Gravitational and magnetic effects are considered as possible sources of solar activity synchronisation.
2004
http://adsabs.harvard.edu/abs/2004astro.ph..1107V
Evidence of a multi resonant system within solar periodic activity
Vukcevic, M. A.
eprint arXiv:astro-ph/0401107
To demonstrate a degree of correlation between periodicity in the solar activity and a multi-resonant system three examples are considered. Although only two base frequencies were employed a relatively close correlation was obtained for periodicity, amplitude’s envelope and some well-known longer-term anomalies, by using a simple mathematical formula.
Go to Ver 2: http://arxiv.org/abs/astro-ph/0401107v2
http://arxiv.org/pdf/astro-ph/0401107v2.pdf
2007
http://hal.archives-ouvertes.fr/docs/00/28/98/80/PDF/Hypothesis.pdf
PDF is damaged, won’t display.
HTML version (bad graphs)
http://scholar.googleusercontent.com/scholar?q=cache:lnHqMCmmEGoJ:scholar.google.com/+m+vukcevic+solar&hl=en&as_sdt=1,39
M. A. Vukcevic
( 01/09/2007 )
An alternative view of the solar periodicity
‘the nature is adverse to a coincidence, it is ruled by a cause and the consequence’
The solar periodic activity is due to a feedback from the energy transfer between the heliospheric magnetic flux and the planetary magnetospheres
2009
http://hal.archives-ouvertes.fr/docs/00/40/88/86/PDF/NATA.pdf
North Atlantic Temperature Anomaly
M.A. Vukcevic M.Sc. 2009
Abstract: The author postulates the existence of a high correlation between North Atlantic Temperature Anomaly and the variations of magnetic field over the Hudson Bay region. Post-glacial uplift and convection in the underlying mantle uplift (as reflected in changes of the area’s magnetic intensity) are making significant contribution to the Atlantic basin climate change.
2012
http://hal.archives-ouvertes.fr/docs/00/72/81/45/PDF/GEO-SOLAR-oscillations.pdf
Role of Natural Cycles in the Global Climate Change
M.A. Vukcevic MSc
September 2012
PART ONE
ABSTRACT
It is postulated that the decadal temperature variability in the North Hemisphere can be reconstructed relatively accurately by amplification of the solar magnetic cycle (Hale cycle) by natural oscillations emanating from the liquid part of the Earth’s core, as detected in the secular changes of the Earth’s magnetic field. In this part of the of the study only circumstantial evidence will be considered, while no physical mechanism, although it is hinted at on number of occasions, will be subject of part two.
There are also papers found by M. Vukcevic, first name Miroslava or Mira, affiliation Military Academy, University of Defense, Siberia. While of similar material (plasma, cosmic rays, astrophysics) there are enough differences, like the missing initial, to think that is someone else. Perhaps Vuk’s kid?
No amount of argumentation will change AGW position until it is beyond the fact of, ‘it really is colder’. SC 24 was a surprise since it was predicted as Allan pointed out to be just as strong as the previous cycles. I had in mind that the SC would weaken within +/- a few, which would take it out of my lifetime. There is a lot of talk about the magnetic fields of the sun and the earth. For certain the earth’s magnetic has weaken since the Industrial Revolution. Everyone should know something very basic about the field strength, it is not uniform, the cross sectional strength is squared at the poles. That is a significant decrease in some areas and a minor one in others.
I think that the temperature here is dependent on the solar cycles, extent, duration and strength.
A weakening solar cycle and a weakening earth’s magnetic field would cause some strange weather indeed .
As someone asked, “do we all think it will get colder?” . I certainly do. It is extremely important to know.. how much and when.
rishrac says:
August 15, 2014 at 10:42 pm
SC 24 was a surprise since it was predicted as Allan pointed out to be just as strong as the previous cycles.
It was predicted on sound physical principles to be the weakest in a 100 years http://www.leif.org/research/Cycle%2024%20Smallest%20100%20years.pdf
so no surprise.
Note to moderator
Dear Sir / Madam
I would think it is a bit unfair to publish
kadaka (KD Knoebel) post at August 15, 2014 at 9:38 pm
http://wattsupwiththat.com/2014/08/11/a-gleissberg-solar-minimum/#comment-1710210
with links to some of my old work, while I am temporarily exiled from the WUWT blog.
I would appreciate if it is possible for time being to withdraw the post, until I am in position to respond to it or any forthcoming comments from other readers.
Thank you
regards
m.a.vukcevic
kadaka said
“You know, offhand, that REALLY looks more like two cycles with different period lengths”
I think that there is a phase reversal in the AMO response to solar cycles. depending on the mode of the AMO:
http://www.woodfortrees.org/plot/esrl-amo/every:13/normalise/plot/sidc-ssn/from:1850/normalise
Which is why I expect a renewed warm AMO from 2016 to 2024/25. I was also expecting more negative NAO/AO conditions through this period anyway, which gives more certainty to a warm AMO decade ahead.
The point which is very important is the sun since 2005 has switched gears from an active regime to an inactive regime. Therefore I would say it is not wise to predict future solar activity based on how the sun behaved when it was in an active mode.
Evidence of this would be the extreme unexpected solar lull from 2008-2010 which caught every one off guard.
http://wattsupwiththat.com/2011/07/05/study-solar-activity-lull-increases-chances-of-cold-uk-winters/
This is Professor Lockwood’s take on solar variability and how it may effect the climate for some parts of the globe. He subscribes to three of my beliefs which are the sun has variability ,it was much less active during the Maunder Minimum and it did indeed effect the climate if not global at least regional.
I would say in the balance of things his thinking is more or less the same as mine. Not exactly but pretty close.
Again I think an interview with him over this web-site would generate keen interest. I would look forward to this if it should take place.
Leif Svalgaard says:
“LOD depends on the extent of the atmosphere, so will depend on the temperature of said atmosphere. Nothing special about that.”
I am sure you did not mean this as it came across. LOD is dependent upon the rotation rate of the earth, las time I checked, which is quite consistent over human lengths of time. Did you mean LOD effects?
Leif Svalgaard says:
It would seem that any real effect on LOD by atmosphere extent would be minimal similar to the delta TSI of 0.1 degree you often quote.
“Atmospheric Angular Momentum Fluctuations, Length-of-Day Changes and Polar Motion”
R. T. H. Barnes, R. Hide, A. A. White and C. A. Wilson
Jim G says:
August 16, 2014 at 8:02 am
I am sure you did not mean this as it came across. LOD is dependent upon the rotation rate of the earth, las time I checked, which is quite consistent over human lengths of time. Did you mean LOD effects?
I don’t think there are any LOD ‘effects’. LOD is the effect. If the atmosphere heats up it extends and as an ice scatter pirouettes slower when she extends her arms, so will the Earth.
Salvatore Del Prete says:
August 16, 2014 at 7:44 am
I would say in the balance of things his thinking is more or less the same as mine
Like ‘no little ice age’?
From Jim G on August 16, 2014 at 8:02 am:
I am sure you did not mean this as it came across. LOD is dependent upon the rotation rate of the earth, las time I checked, which is quite consistent over human lengths of time. Did you mean LOD effects?
There are frequent and regular changes, just fractions of milliseconds. It all normally goes back to conservation of angular momentum.
Think of the classic example of the ice skater turning at one speed with limbs extending outward, then they draw their limbs inward and speed up. Same thing normally. When the atmosphere puffs outward the rotational speed of Earth slows slightly, increasing LOD, although the angular momentum stays the same.
Although there are other things affecting LOD. A small one to mention is Earth keeps gaining mass, assorted interplanetary dust and such, causing a gradual slowdown. I mention it because it’s not listed in this authoritative source, likely because it’s not a variation.
http://www.iers.org/nn_10398/IERS/EN/Science/EarthRotation/UT1LOD.html
Universal time and length of day are subject to variations due to the zonal tides (smaller than 2.5 ms in absolute value), to oceanic tides (smaller than 0.03 ms in absolute value), to atmospheric circulation, to internal effects and to transfer of angular momentum to the Moon orbital motion.
The variations in LOD can be split into several components, according to their causes. The total variation is shown in the upper part of the figure, without oscillations induced by the tides of the solid Earth and oceans, are shown separately for the long and short periods. The dynamical influence of the liquid core of the earth and climatic variations in the atmosphere account for slow variations (trend in the upper part of the figure). The rest of the atmospheric excitation can be split into a seasonal oscillation and residual oscillation, which includes 50-day oscillations as well as large anomalies like the one associated with the 1983 El Niño event. Yearly values of LOD since 1623 are available.
There are also sudden changes. Earthquakes can change the shape of the Earth. Often you’ll see the LOD shorten, as the core is cooling thus the globe wants to shrink.
The important things to note, are LOD does change, and for many reasons, see the “variations in LOD” link above. To take such a noisy overlapping of many signals and events, point and say “Ah-ha! There’s the solar signal I knew was there!”, is nonsense.
kadaka KD Knoebel says
http://wattsupwiththat.com/2014/08/11/a-gleissberg-solar-minimum/#comment-1710210
henry says
and your point is?
and what, if anything, has it to do with the subject on hand?
i.e.
the 87-88 year Gleissberg cycle, as posted, and as was determined in earlier work, e.g. in 2002,
Persistence of the Gleissberg 88-year solar cycle over the last ˜12,000 years: Evidence from cosmogenic isotopes
Peristykh, Alexei N.; Damon, Paul E.
Journal of Geophysical Research (Space Physics), Volume 108, Issue A1, pp. SSH 1-1, CiteID 1003, DOI 10.1029/2002JA009390
Among other longer-than-22-year periods in Fourier spectra of various solar-terrestrial records, the 88-year cycle is unique, because it can be directly linked to the cyclic activity of sunspot formation. Variations of amplitude as well as of period of the Schwabe 11-year cycle of sunspot activity have actually been known for a long time and a ca. 80-year cycle was detected in those variations. Manifestations of such secular periodic processes were reported in a broad variety of solar, solar-terrestrial, and terrestrial climatic phenomena. Confirmation of the existence of the Gleissberg cycle in long solar-terrestrial records as well as the question of its stability is of great significance for solar dynamo theories. For that perspective, we examined the longest detailed cosmogenic isotope record—INTCAL98 calibration record of atmospheric 14C abundance. The most detailed precisely dated part of the record extends back to ˜11,854 years B.P. During this whole period, the Gleissberg cycle in 14C concentration has a period of 87.8 years and an average amplitude of ˜1‰ (in Δ14C units). Spectral analysis indicates in frequency domain by sidebands of the combination tones at periods of ≈91.5 ± 0.1 and ≈84.6 ± 0.1 years that the amplitude of the Gleissberg cycle appears to be modulated by other long-term quasiperiodic process of timescale ˜2000 years. This is confirmed directly in time domain by bandpass filtering and time-frequency analysis of the record. Also, there is additional evidence in the frequency domain for the modulation of the Gleissberg cycle by other millennial scale processes. Attempts have been made to explain 20th century global warming exclusively by the component of irradiance variation associated with the Gleissberg cycle.
[Note the reference to the 22 year cycle which we discussed]
Henry quotes
Attempts have been made to explain 20th century global warming exclusively by the component of irradiance variation associated with the Gleissberg cycle.
Henry says
My own investigations confirm that all warming and cooling is natural and that it appears to follow a 88 year pattern, if you look purely at maximum temperatures as a proxy. There are/could be lags, and these lag times may differ, due to a variety of reasons, but in the end it evens out.
There is no man made warming, as my graph for the deceleration of minimum temperatures suggests.
From moreCarbonOK[&theWeatherisalwaysGood]HenryP on August 16, 2014 at 10:19 am:
and your point is?
and what, if anything, has it to do with the subject on hand?
Vuk was getting published. The quality of Vuk’s work was questioned. I checked Google Scholar, found Vuk’s work. Posted search results.
Being more in-depth than the usual graphs, this is not just more evidence for consideration by others to form their own opinions, but better evidence.
And like Mann and Cook and Lewandowsky and Watts and Eschenbach and Svalgaard, Vuk’s work has been published!
That was all.
kadaka (KD Knoebel) says:
August 16, 2014 at 11:13 am
And like Mann and Cook and Lewandowsky and Watts and Eschenbach and Svalgaard, Vuk’s work has been published!
There is published and published. His work has not been reviewed, neither in journals or [even more importantly] at conferences [which is where the real review is done].
From Ulric Lyons on August 16, 2014 at 7:00 am:
I think that there is a phase reversal in the AMO response to solar cycles. depending on the mode of the AMO:
http://www.woodfortrees.org/plot/esrl-amo/every:13/normalise/plot/sidc-ssn/from:1850/normalise
And like a true huckster you ignore and blow off complaints and carry on with the same spiel like nothing was said, as once again you throw out the same graph without addressing why you are only showing every thirteenth month of the AMO, don’t mention the evidence showing you are wrong.
Thus I ignore you.
@Kadaka,
that is going for the man, rather than his argument / current work.
The SS is good at it.
It is generally frowned upon at WUWT
[except by Leif, apparently]
Mr. Vukcevic’s co-sine function works for me, until 2015-2016. I think at some point around 2016 it must go in reverse.
@Kadaka,
that is going for the man, rather than his argument / current work.
The SS is good at it.
It is generally frowned upon at WUWT
[except by Leif, apparently]
Mr. V[]’s co-sine function works for me, until 2015-2016. I think at some point around 2016 it must go in reverse.
moreCarbonOK[&theWeatherisalwaysGood]HenryP says:
August 16, 2014 at 12:03 pm
that is going for the man, rather than his argument / current work.
It is generally frowned upon at WUWT
[except by Leif, apparently]
Now, I call THAT going for the man, but that doesn’t seem to bother you, apparently…
henry said@kadaka
that is going for the man, rather than his argument / current work.
It is generally frowned upon at WUWT
[except by Leif, apparently]
henry says
that is going for the man, rather than his argument / current work.
It is generally frowned upon at WUWT
[except by Leif, apparently, note his comment
http://wattsupwiththat.com/2014/08/11/a-gleissberg-solar-minimum/#comment-1710560
where he agrees with Kadaka, instead of correcting him, like I did].
From moreCarbonOK[&theWeatherisalwaysGood]HenryP on August 16, 2014 at 12:03 pm:
that is going for the man, rather than his argument / current work.
That is just what it is, a publication list. First page of results, sorted by year, author and download availability/quality checked. Note the careful formatting and notations. An “attack list” would go much faster, that was a neutral presentation.
Leif has his old work questioned. We often examine old work when new papers come out. When the next Lewandowsky paper comes out, will we not be bringing up his old work as that would be attacking the man? I don’t think so.
From Leif Svalgaard on August 16, 2014 at 11:57 am:
There is published and published. His work has not been reviewed, neither in journals or [even more importantly] at conferences [which is where the real review is done].
Certain serious solar conferences aside:
How computer-generated fake papers are flooding academia
More and more academic papers that are essentially gobbledegook are being written by computer programs – and accepted at conferences
…
Like all the best hoaxes, there was a serious point to be made. Three MIT graduate students wanted to expose how dodgy scientific conferences pestered researchers for papers, and accepted any old rubbish sent in, knowing that academics would stump up the hefty, till-ringing registration fees.
It took only a handful of days. The students wrote a simple computer program that churned out gobbledegook and presented it as an academic paper. They put their names on one of the papers, sent it to a conference, and promptly had it accepted. The sting, in 2005, revealed a farce that lay at the heart of science.
…
kadaka (KD Knoebel) says:
August 16, 2014 at 1:02 pm
Certain serious solar conferences aside:
How computer-generated fake papers are flooding academia…
The real review is done when presenting to colleagues [who are often the sharpest critics] and getting feedback from them during corridor face-to-face discussions.
From moreCarbonOK[&theWeatherisalwaysGood]HenryP on August 16, 2014 at 12:41 pm:
I am stunned to find that even the mention of mr V[]’s name puts my comment in moderation.
Thus he is often called Vuk, which does not hit moderation.
Note he used to post as “Vuk etc” when, as he put it, “we” were posting together, him and someone else, I forget who. Now only the full last name is used, which avoids charges of avoiding the moderation bin.
kadaka said:
” once again you throw out the same graph ”
It doesn’t make that much difference, and is a only a trivial distraction from the phenomena that I am discussing:
http://www.woodfortrees.org/plot/esrl-amo/mean:25/normalise/plot/sidc-ssn/from:1855/normalise
From Ulric Lyons on August 16, 2014 at 2:50 pm:
It doesn’t make that much difference, and is a only a trivial distraction from the phenomena that I am discussing:
Throwing away 12/13 of your data is a trivial distraction? Well since you’re finally ceasing doing it I’ll take that to mean you have better distractions now that the minor one has been clearly revealed.
http://www.woodfortrees.org/plot/esrl-amo/from:1855/to:1940/mean:25/normalise/plot/sidc-ssn/from:1855/to:1940/normalise/
http://www.woodfortrees.org/plot/esrl-amo/from:1940/to:2014/mean:25/normalise/plot/sidc-ssn/from:1940/to:2014/normalise/
Matching SSN trough to AMO peak still reveals the same as before, they are separate signals with different average periods.
Is the phenomena that you can scrunch the series to such low resolution that people won’t see the truth for themselves? Huckster behavior, again.
kadaka said
“Like a true huckster”
I have noted an interesting phenomena whereby the AMO tends to in phase with solar cycles in its cold mode, and out of phase with solar cycles in its warm mode. While all you have contributed to the discussion is either wrong or baseless, e.g:
“the AMO just flipped”
“The AMO can go warm while solar activity is still weak”
“And while the AMO is said to be 40 years, the trough-to-trough looks about 30”
“You know, offhand, that REALLY looks more like two cycles with different period lengths”
In these discussions where someone resorts to insult rather than facts alone, typically it is a projection, from that list of your comments above, I would say that you are the huckster. And I will now ignore you.
From Ulric Lyons on August 16, 2014 at 4:45 pm:
I have noted an interesting phenomena whereby the AMO tends to in phase with solar cycles in its cold mode, and out of phase with solar cycles in its warm mode.
You have failed to acknowledge the small AMO wiggles and the SSN are two signals with different average periodicities, that give the appearance you mentioned at the moment. To do so would disrupt your sideshow.
While all you have contributed to the discussion is either wrong or baseless, e.g:
“the AMO just flipped”
http://icecap.us/images/uploads/amoarticlel.pdf
The average AMO index or the Atlantic Multidecadal Oscillation index went negative or cool in January 2009
…
Based on this analysis , there is a high probability that the current
cooling phase of AMO which started in 2009 is real and likely sustainable for the next 20 years at least.
Next:
“The AMO can go warm while solar activity is still weak”
http://www.woodfortrees.org/plot/esrl-amo/from:1940/to:2014/mean:25/normalise/plot/sidc-ssn/from:1940/to:2014/mean:25/normalise/
It’s right there, since about 1975 SSN was trending down to the current solar lows while the big AMO trend was heading upwards to the Jan 2009 flip. For the little wiggles, AMO started going up just before SSN around 1984, AMO was going up in 1993 before SSN headed up in 1996. The AMO can go warm while solar activity is still weak.
Next:
“And while the AMO is said to be 40 years, the trough-to-trough looks about 30″
Miscounting while distracted, as admitted to.
“You know, offhand, that REALLY looks more like two cycles with different period lengths”
Which I showed by matching SSN troughs to AMO peaks, which you have not even commented on nor indicated you checked yourself to either confirm or disprove.
In these discussions where someone resorts to insult rather than facts alone, typically it is a projection, from that list of your comments above, I would say that you are the huckster. And I will now ignore you.
Now you will ignore me? Offhand I don’t think you’ve directly addressed a single point. I present facts, you pretend they aren’t there, then a description hits too close to home, so you resort to yet another huckster tactic and accuse the questioner of doing what you are doing.
Like a true huckster you ignore and blow off complaints and carry on with the same spiel like nothing was said.
Note to the moderators
Dear Sir / Madam
In interest of fairness I hope you may either issue a correction or allow this statement to be published
kadaka (KD Knoebel) says:
August 16, 2014 at 1:34 pm
Note he used to post as “Vuk etc” when, as he put it, “we” were posting together, him and someone else, I forget who. Now only the full last name is used, which avoids charges of avoiding the moderation bin.
That statement is total fabrication.
1.At the time my comments were not in moderation
2. In English language usual combination is ‘ck’ while in my name ‘kc’ so other posters were prone to misspelling.
3. Dr. Svalgaard first used Vuk for short, which was OK with me. Thus I thought Vuk etc would avoid misspelling problem.
4. Vuk etc was meant to mean Vuk + cevic (i.e. etc referred to the rest of my surname)
5. It is total fabrication that I claimed I was posting with or in name of someone else.
Thank you
regards
m.a.vukcevic
Kadaka said:
“You have failed to acknowledge the small AMO wiggles and the SSN are two signals with different average periodicities,”
I don’t see why you are bringing up “small wiggles”, and the AMO signal changes frequency in respect to sunspot cycles as it changes from in phase to out of phase with the sunspot cycles.
“The average AMO index or the Atlantic Multidecadal Oscillation index went negative or cool in January 2009”
A very minor cooling for 5 months , big deal, and it has been more positive than negative since then:
http://www.esrl.noaa.gov/psd/data/correlation/amon.us.data
It should be running slightly cooler around sunspot maximum in its warm mode, and it will warm again strongly from just after this sunspot maximum, till around the next sunspot cycle maximum.
“It’s right there, since about 1975 SSN was trending down to the current solar lows while the big AMO trend was heading upwards to the Jan 2009 flip. For the little wiggles, AMO started going up just before SSN around 1984, AMO was going up in 1993 before SSN headed up in 1996. The AMO can go warm while solar activity is still weak.”
Solar cycles 21&22 were higher forcing, the decline in solar forcing is from 1995 onwards, i.e. from when the AMO transitions to its warm mode, which is why it is rising up “1993 before SSN headed up in 1996”, as that is where the phase change is taking place. After 2000 the AMO is anti-phase with the solar cycles. The “little wiggle” around 1984 is just some minor variance, and not the only example, and is superfluous.
“Which I showed by matching SSN troughs to AMO peaks, which you have not even commented on nor indicated you checked yourself to either confirm or disprove.”
Well lets have a look, you said:
“SSN trough to AMO peak
~1865 before ~1867
~1878 before ~1879
~1889 same
~1901 after ~1899
~1913 after ~1908
~1923 after ~1915
~1933 after ~WHAT? AMO going berserk and up.”
When in fact the sunspot minima were in 1867 and 1879, and through solar cycles 14, 15 and 16, the AMO is in its cold mode and is in phase with solar cycles. Which what you cannot seem to get on board. It also shows that the AMO frequency has altered here only for ONE cycle duration the phase change.
“SSN trough to AMO peak
~1942 same
~1953 after ~1952
~1964 after ~1960
~1975 after ~1969
~1986 after ~1980
~1996 after ~1990
~2008 after ~1999”
Same again, you have ignored what I am saying about the phase reversal, the AMO becomes in phase with solar cycle 20, 21 and 22, i.e during the cold mode of the AMO.
My work was also presented at a “conference”. But I didn’t get to be there. The politics and image issues at work that was used to make that decision didn’t matter to me. I was just thrilled to have my lowly Masters degree research presented at a national conference on speech and hearing issues. And yes, the feedback improved the final article, along with the addition of one of the best researchers in the field, brought onto the team after our first submission to a journal failed. We re-wrote it, and submitted to another journal. They loved it. It is the trial by fire that at least tries to weed out snake oil efforts and get rid of impurities in otherwise good efforts.
@Pam
it is easy to prove that somebody’s work is good or not good by attempting to duplicate his result.
My claim here has been that based on my results, there is no man made global warming:
i.e. table 3, http://blogs.24.com/henryp/files/2013/02/henryspooltableNEWc.pdf
(ending up with a completely natural relationship for the deceleration of minimum temperatures)
Anybody can see that the results of all three formulae given by me for Max., Mean, Min. will pass any statistical test for significance of correlation….
The implication here is that everything follows natural relationships / cycles, as far as earth’s temperature is concerned, of which we have identified at least one here, namely the Gleissberg cycle.
We all know that this AGW issue is an important issue as it affects a lot of people and the flow of money…So, one would think that there would be an army out there to repeat my experiment, given that I even disclosed my sampling technique;
http://blogs.24.com/henryp/2013/02/21/henrys-pool-tables-on-global-warmingcooling/
And one whole class of first year statistics students should be able to duplicate my results in a week or so, as a test, given that you only need to analyse a sample of 50 or so weather stations.
Fact is that there is nobody, including everyone here at WUWT that has attempted to try to duplicate the experiment it or expressed a wish to try it.
[I believe that ] the sad reality is that everyone here now depends [for income] on the proposition that at least there must be some AGW, as also proclaimed now at your last conference in LV.
There is only so much I can do. I can bring a horse to the water but I can not make him drink.
I seriously have started to think now that I am wasting my time further with this, even though I am afraid that mankind, 7 billion and counting, might not be ready for the global cooling that will hit us, eventually.
Henry, I wouldn’t duplicate your research even if I were paid to do it. And if you haven’t a clue as to my well founded reasons related to research design, there is likely no benefit to either of us in me listing them. Yet hope springs eternal. For starters you have a decided lack of tight research design and self-critique of the design you chose, you have not disclosed the data (list the stations please), you have not finished your work in terms statistical analysis (how many degrees of freedom does your sample size interaction with number of variables impose?), I see no results reported in standard format- intro, literature review, problem statement, methods, results, discussion, etc (IE standard sectioned research article), and because you have not completed those steps, you have not even begun peer review. Sorry. Your study does not even pass a nose-clipped smell test. If you are going to be disappointed, be disappointed in your effort, not the efforts of others.
Pam says
http://wattsupwiththat.com/2014/08/11/a-gleissberg-solar-minimum/#comment-1711202
Henry says
honey, I don’t do papers. someone else must do that, sorry
I figured out how to test and I DID report the results of all stations.
[note that none of the big data sets are properly balanced]
Why don’t you give it to your stats prof and let him run with it.
henry says:
“honey…”
Maybe you should reconsider using that kind of familiarity, Henry. It might not be appreciated.
Maybe this is just a cultural thing, in which case, please just take this as friendly advice.
REPLY: I second that, it isn’t appreciated. Henry is out of bounds here. – Anthony
From moreCarbonOK[&theWeatherisalwaysGood]HenryP on August 17, 2014 at 1:41 pm:
I seriously have started to think now that I am wasting my time further with this, even though I am afraid that mankind, 7 billion and counting, might not be ready for the global cooling that will hit us, eventually.
Henry, two views to consider:
1. By the demands of evolution, we adapt or die. The cooling will be a stress that will winnow out the weak, which is natural selection. We have an incredible dissonance, evolution is accepted while what it means to be involved in evolution is rejected, fought against. We have evolved beyond evolution, they say, and adapt with the products of our intellect. Fine. But either way, if we cannot figure out how to survive and prosper whatever will come, we deserve the result.
2. As creations of the Living God, we were appointed stewards over this world, which does not mean we are to preserve it like a museum exhibit, but maintain and enhance its productivity and profitability, put it to best use, for the benefit of the owner and we stewards. If we cannot do so whatever will come, we show ourselves to be poor stewards, thus poor creations, and deserve what is to come.
You may pick a view. I’m comfortable with both.
@Pam
Station selection is random. the test is to take 50 or so [preferably] other stations {as long as the no of stations is equal NH and SH and they all balance around zero latitude, or as close as possible.]
I have shown how I did get my results….
http://wattsupwiththat.com/2014/08/11/a-gleissberg-solar-minimum/#comment-1711186
@ vukcevic on August 17, 2014 at 12:18 am:
Really? Ah, it’s been so long, I remember something like you saying “Vuk etc” was used when “we” were being playful. The “we” I remember for how it stuck out, didn’t know you were using it like a research paper “we”.
Thus I retract that “Vuk etc” was you and someone else.
Your first point is not relevant, as I was indicating if you used “Vuk etc” now there would be charges of moderation evasion.
The comment where it was mentioned is now lost in the archives. Although your use of multiple handles was confusing. I found this post where you used “Vuk etc.”, “vukcevic”, AND “vukcevic etc.”
At least now your handle is consistent.
Henry. No and no. To duplicate your study one would need to know the stations you used (and would need to adhere to standard research protocol which you did not). Why is this not plain to you? I take it you have not studied research design nor taken an advanced course in statistical analysis.
kadaka, to educate you on the female use of the term “we”, there is the we “we”, the you “we”, and the me “we”. You must familiarize yourself with which meaning we use when requesting that a trip to the park is needed, a stated desire to go to the grocery store, the lawn be mowed, the house be painted, or the need for midol, a glass of red wine, and chocolate (not particularly in that order).
kadaka (KD Knoebel) says:
August 17, 2014 at 4:48 pm
………………
You continue with your rubbish. I don’t know, or am interested to know who you are.
First you speculate who may or not may be members of my family, now you continue with your inventions (to say it politely).
I do not mind you attacking my let’s call it my ‘science’ but with this personal attacks you are stooping too. I don’t think anyone ever on this or other couple of blogs I comment, doubted who is either ‘vukcevic’ or ‘Vuk etc’.
For the benefit to other few readers who might be swayed by your ranting, I use or used three devices pc, laptop and an old tablet, the last ‘user name’ from whichever device, blog or log in was used (wordpress or Fb) is automatically entered. To override, if I noticed change, it requires logging out and logging in, just lot of pain.
I use to read your comments, but now I realise whatever you write lacks credibility.
Good day to you.
From “vuk” on August 18, 2014 at 12:14 am:
For the benefit to other few readers who might be swayed by your ranting, I use or used three devices pc, laptop and an old tablet, the last ‘user name’ from whichever device, blog or log in was used (wordpress or Fb) is automatically entered. To override, if I noticed change, it requires logging out and logging in, just lot of pain.
You must use strange software. When I wipe cookies I have to re-enter my handle and email before posting here, which sets the appropriate wattsupwiththat-dot-com cookies, which are remembered for next time. I need no logging in for commenting.
If I’m playing with my WordPress blog and load a WUWT page with Javascript on, the comment box warns me I’m commenting with that account and lets me log out. Doing so merely “logs me out” for commenting on WUWT pages, not out of WordPress. My comments will use the typed-in details, no automatic filling in. Likewise with my Twitter login, which I just checked, “logged out” on WUWT but still logged on to Twitter. Didn’t check Facebook.
Testing is completed. I have to allow Javascript for both wp-dot-com and wattsupwiththat-dot-com to have the WP/Twitter/Facebook options. Block either or both and it’s just the typed-in details. Neither are required for general functionality, I use the site just fine without them.
So to override the auto-fill of logged-in account details, I just click to “log out” for WUWT commenting, or just leave Javascript off, either all or selectively, and type in my details once, next time the auto-fill will be from the cookies. I have no need for logging out and in to change my handle.
Of course, different software and OS combinations, different browser settings, etc, YMMV.
kadaka said:
“AMO was going up in 1993 before SSN headed up in 1996”
I thought that I had clear this one up better, it did not go up strongly in fact until 1995, where the solar forcing declined more strongly from:
http://www.woodfortrees.org/plot/esrl-amo/from:1990/to:1996
Pamela
To duplicate your study one would need to know the stations you used
Henry says
You[still] have not understood the uniqueness of my sampling procedure, but I have given you the example of NY Kennedy airport.
http://blogs.24.com/henryp/files/2013/02/henryspooltableNEWc.pdf
The test is whether my sample of 27 weather stations from each HS was random or not and whether or not any other random sample, using the same sampling technique, would re-produce the same results.
I say it will [ because I know my sample was taken randomly]
To duplicate the results you must exactly take another sample, of other weather stations. Not the ones that I have chosen.
But I am probably trying to explain statistics to you and you have not studied that?
@Pam
Sorry,
I quoted the table, instead of the updated blog post
http://blogs.24.com/henryp/2013/02/21/henrys-pool-tables-on-global-warmingcooling/
which explains the results for NY Kennedy airport, as an example.
http://hockeyschtick.blogspot.com/2014/08/new-paper-finds-solar-activity-more.html
Very interesting showing a solar /climate connection. Accumulated solar activity causing the warming since the end of the Little Ice Age. Also the late last century spike.
kadaka says
http://wattsupwiththat.com/2014/08/11/a-gleissberg-solar-minimum/#comment-1711235
henry says
I have been wondering about what response to give here, so I took some time.
Note that Hitler came to power during the dust bowl drought years 1932-1939, and if I remember correctly it was hyper inflation [in Germany] that actually brought him to power. That sort of thing will come again [from 2021] if there is a shortage of food. Note that a large % of our current corn comes from the great plains of America.
The worst story I have ever sat and listened to, was from a hungarian jew who survived the death camps. Suffice to say that I learned from that story that if hunger is staring you in the face at the front door, civilization is gone out through the back door.
In this respect Pams video was prophetic
mocking me….
Hitler needed a scapegoat for all the ills of the world and he chose the jews. He looted everything they had [including the gold from their teeth] and then killed them.
The next Hitler will chose the followers of Jesus Christ.
Just so you know,
Last chapter of my book:
http://www.hourofpower.org/global/south_africa/news/JesusisGodbook.doc
Henry said
the worst story I have ever sat and listened to, was from a hungarian jew who survived the death camps. Suffice to say that I learned from that story that if hunger is staring you in the face at the front door, civilization is gone out through the back door.
Henry says
World at War series, BBC, the episode on the holocaust. You should see it. You will never forget it.
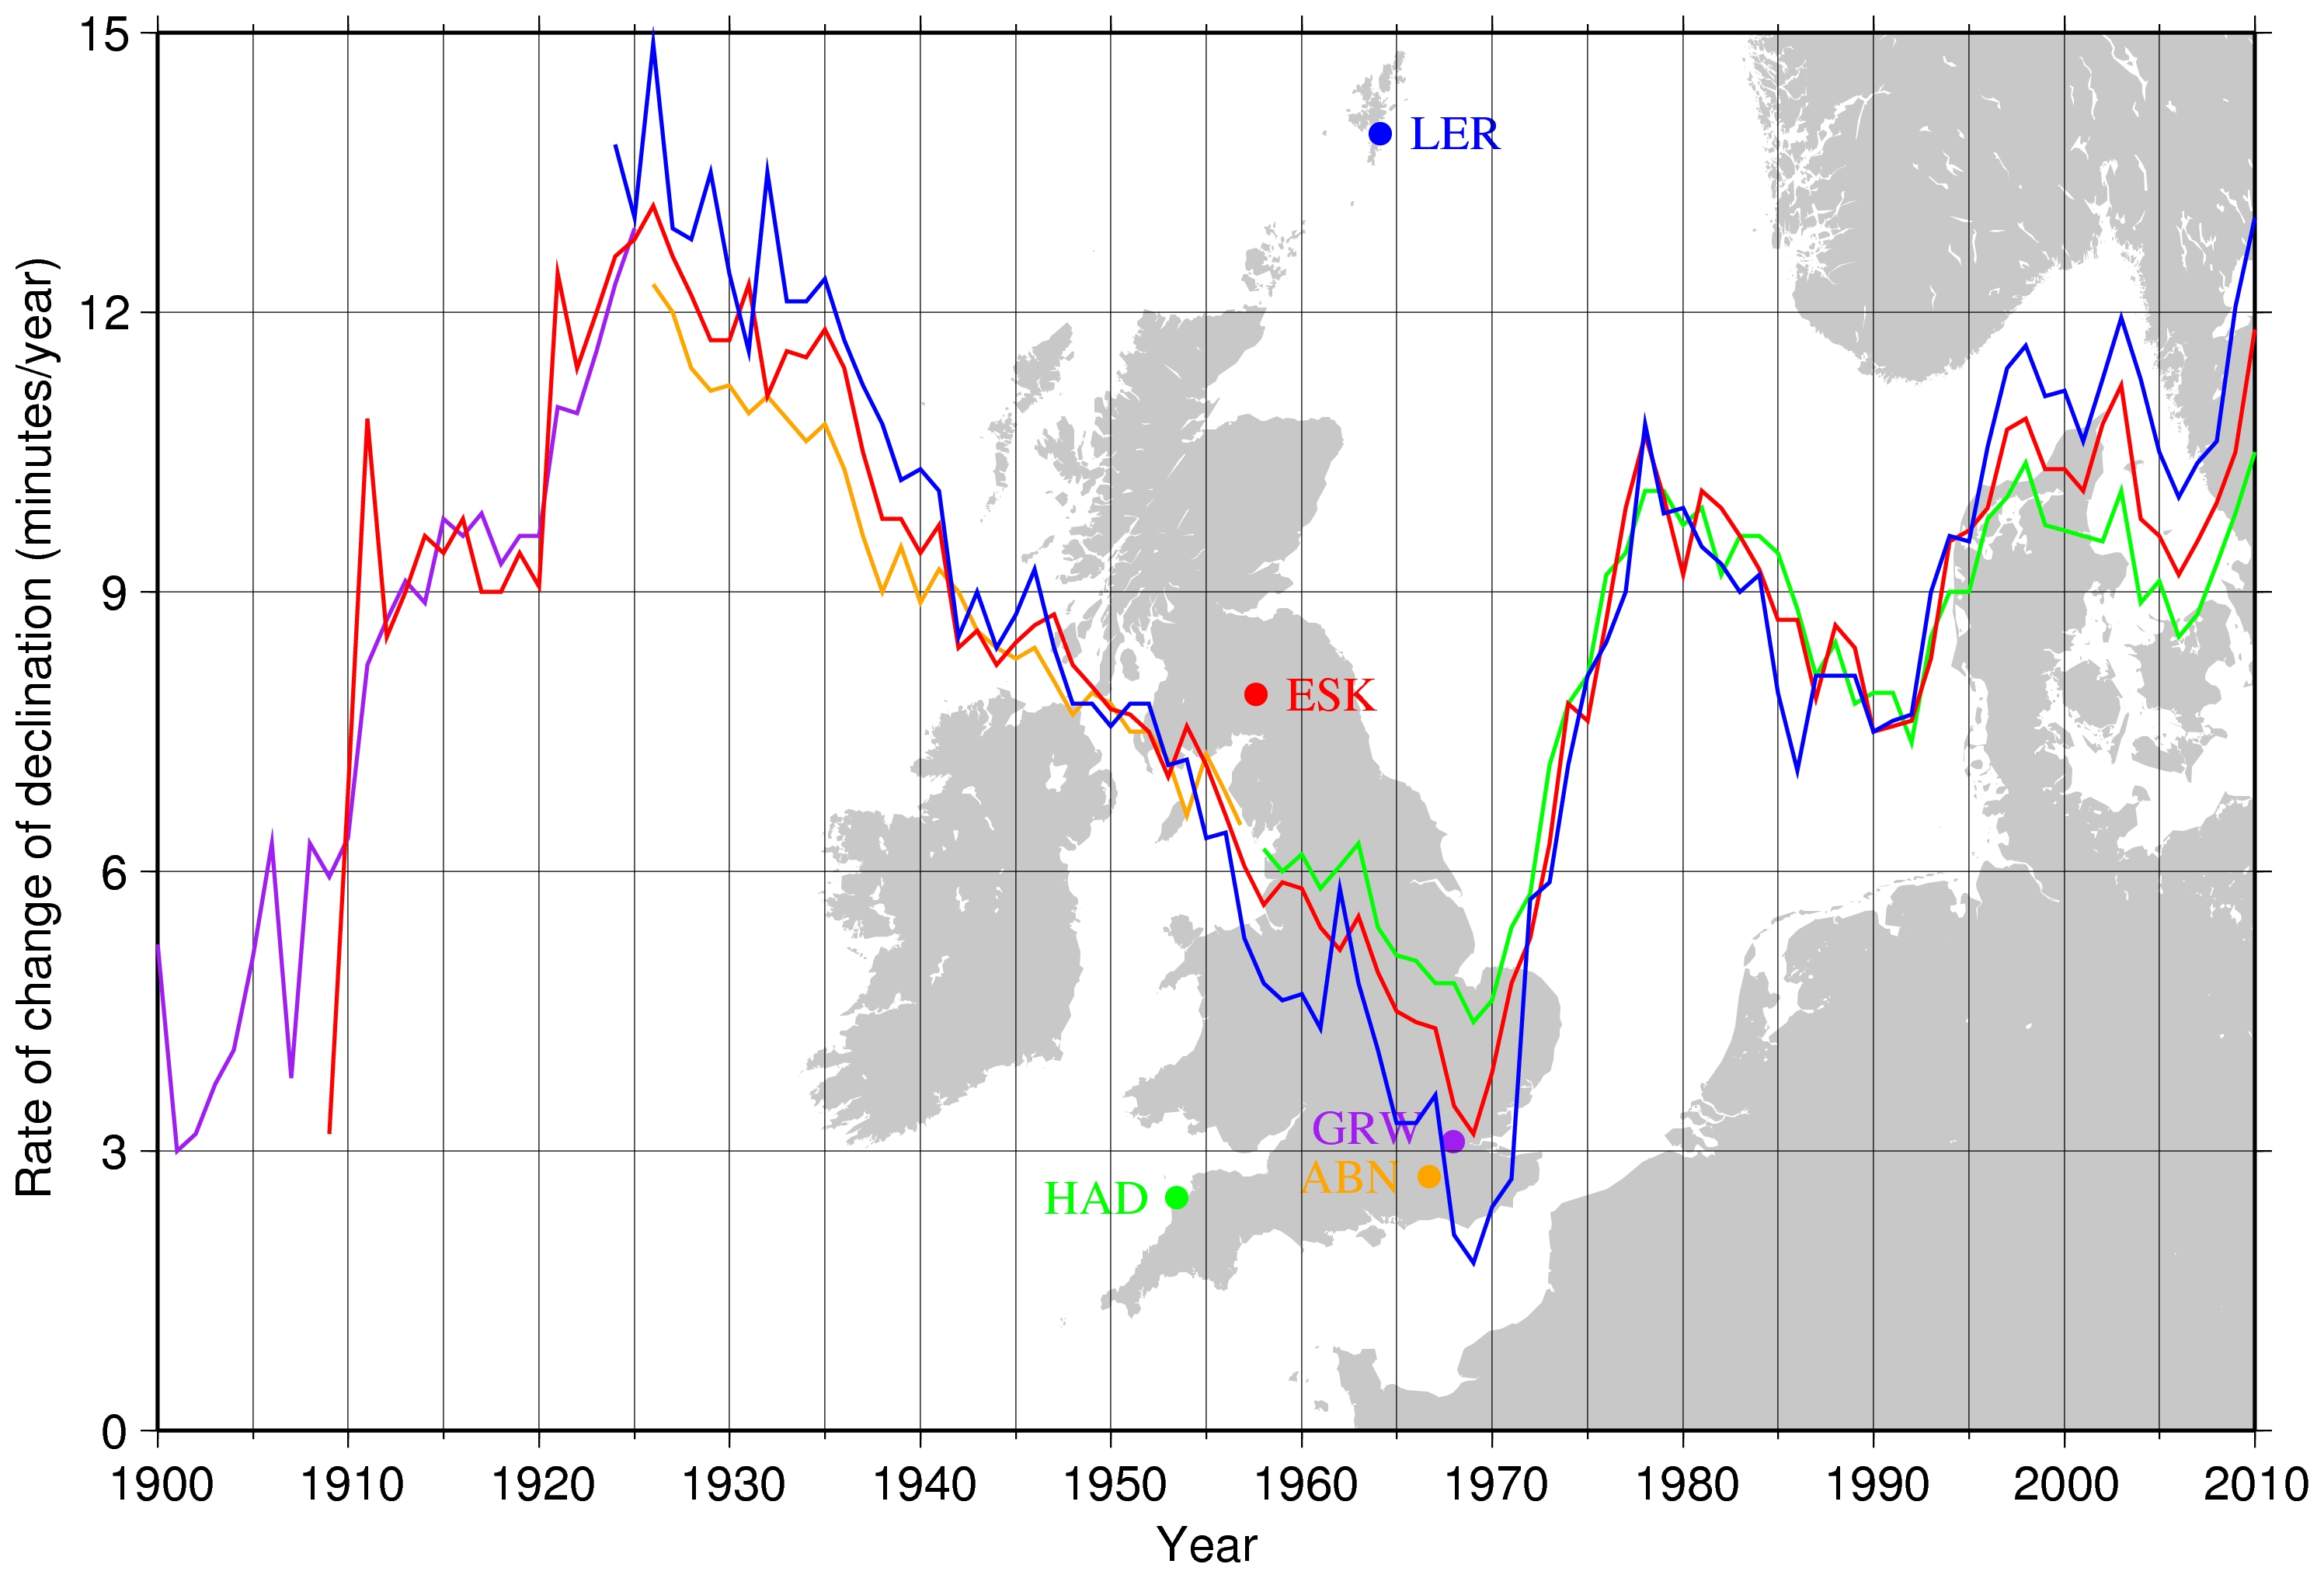
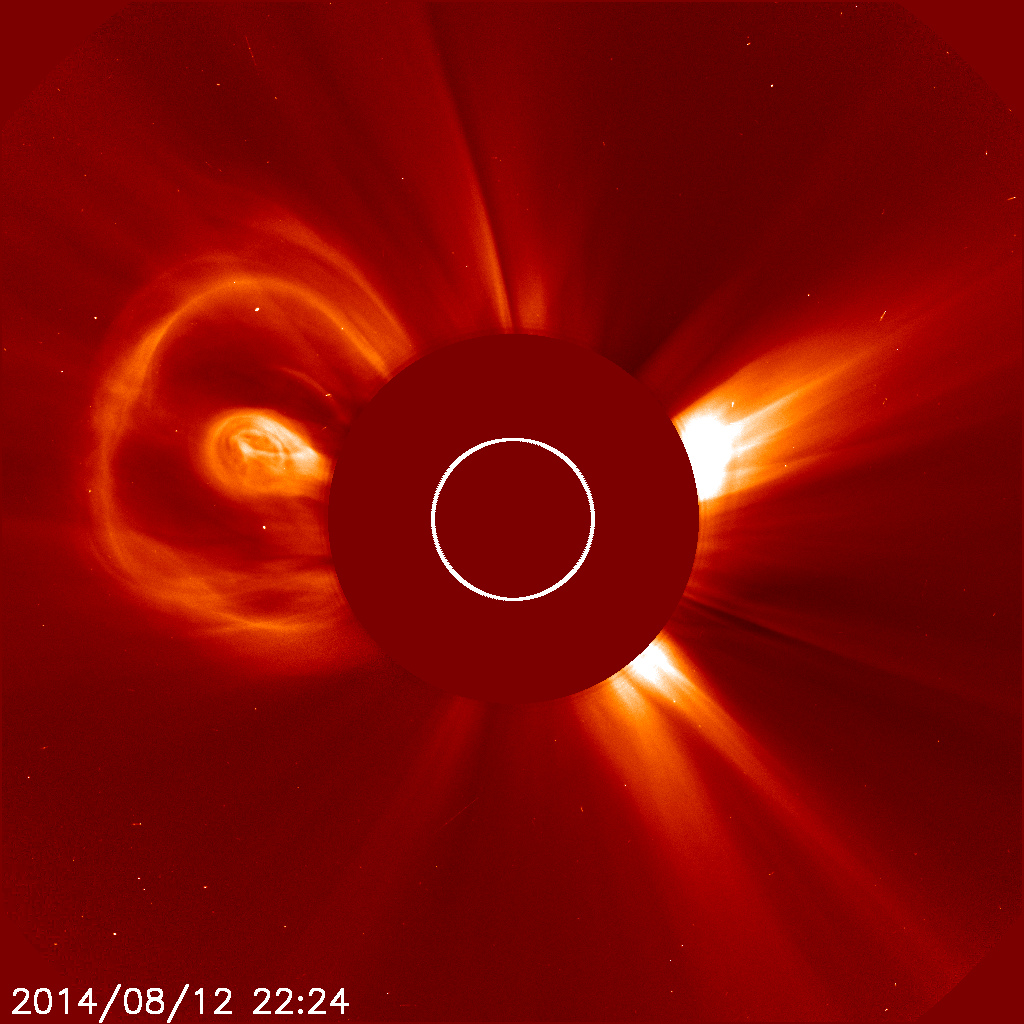
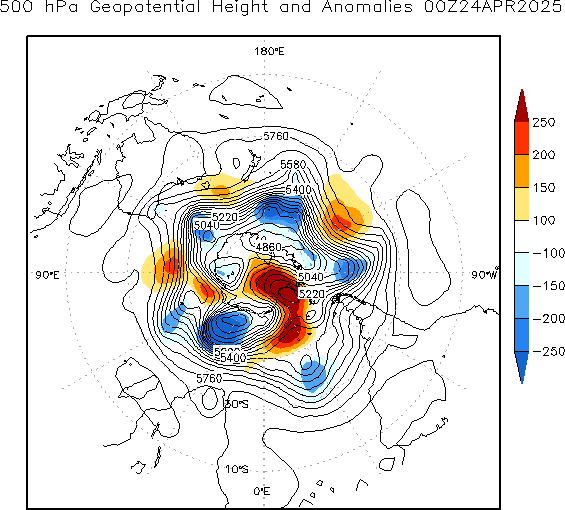
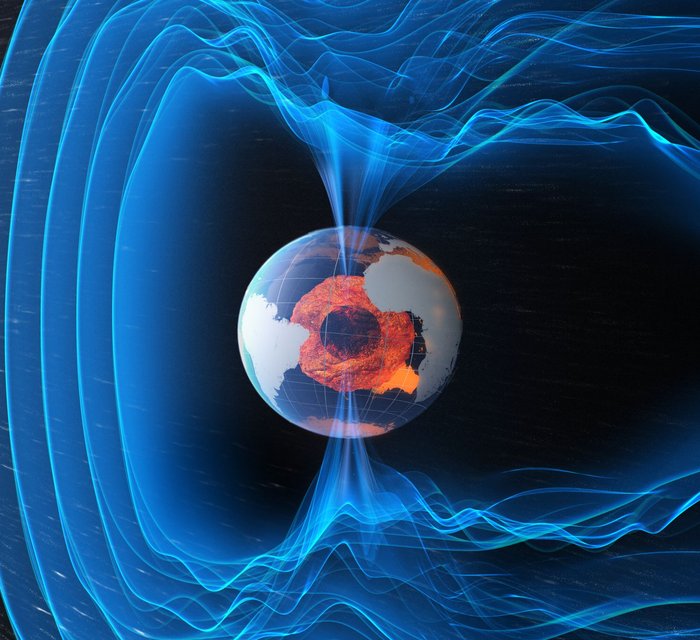
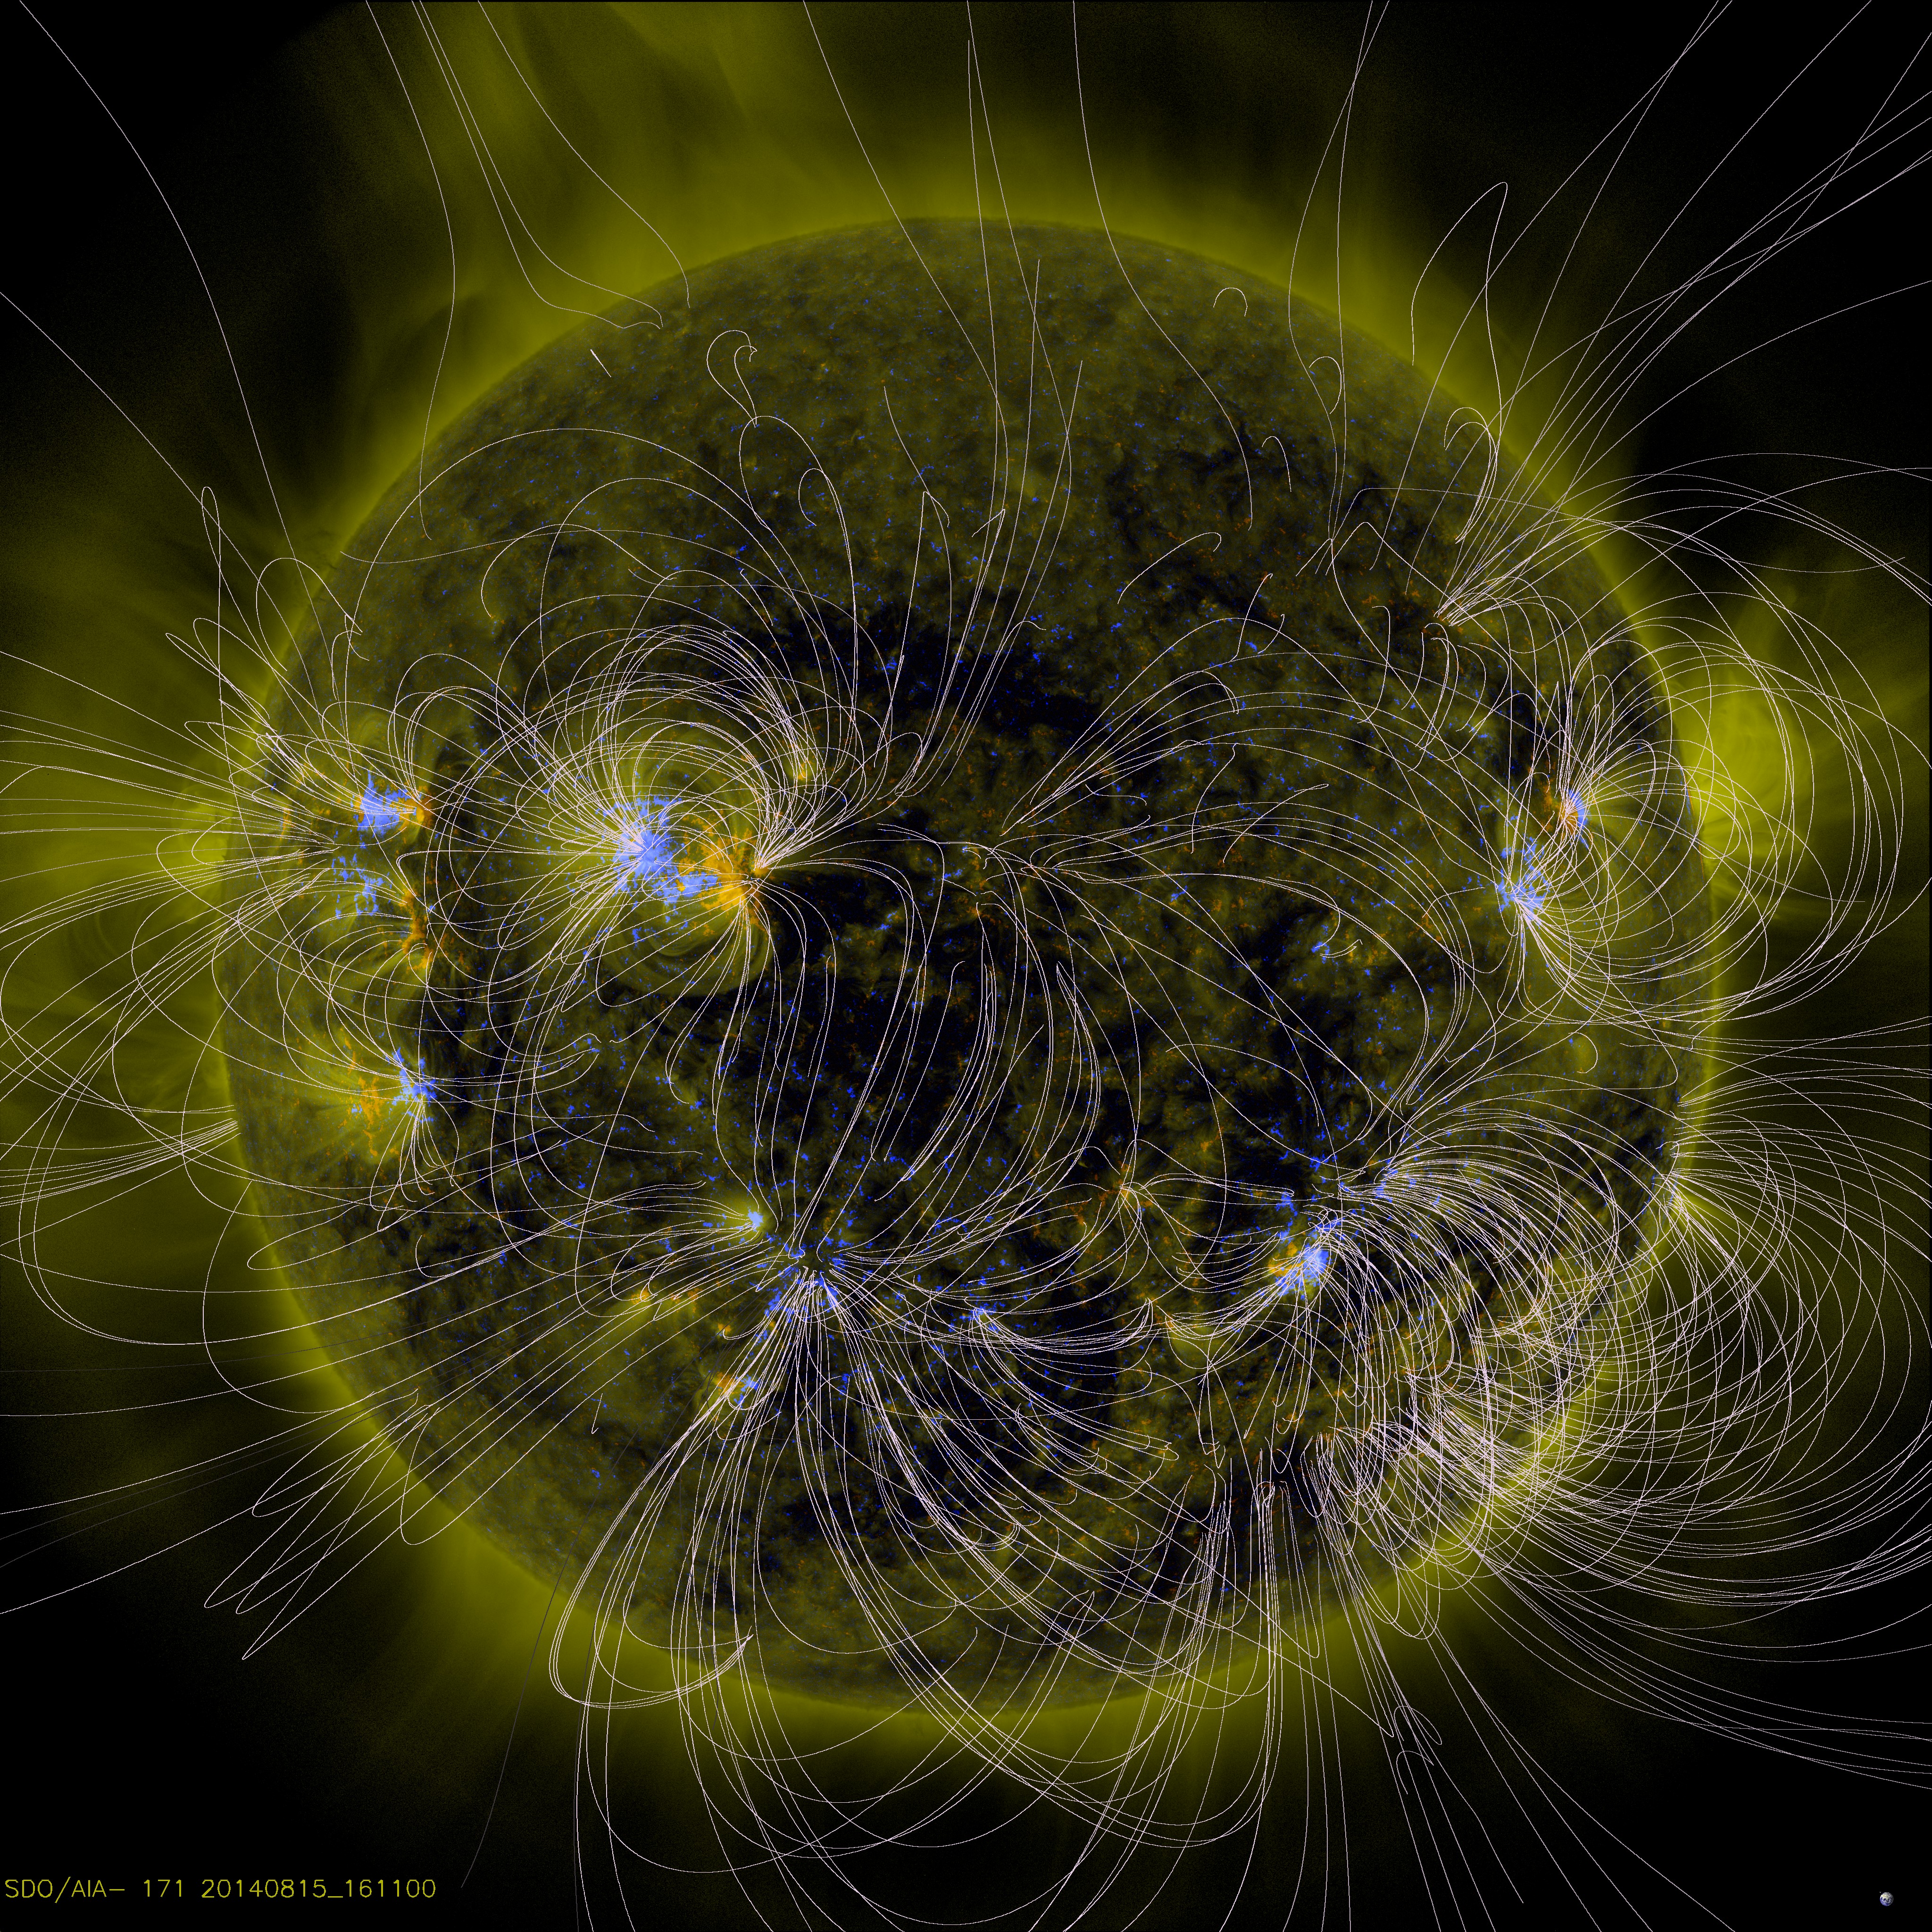
In a recent paper “The Centennial Gleissberg Cycle and its Association with Extended Minima”, to be soon published in JGR/Space, Feynman and Ruzmaikin discuss how the recent extended minimum of solar and geomagnetic variability (XSM) mirrors the XSMs in the 19th and 20th centuries: 1810–1830 and 1900–1910.
Edited abstract:
Such extended minima also were evident in aurorae reported from 450 AD to 1450 AD. The paper argues that these minima are consistent with minima of the Centennial Gleissberg Cycles (CGC), a 90–100 year variation observed on the Sun, in the solar wind, at the Earth and throughout the Heliosphere. The occurrence of the recent XSM is consistent with the existence of the CGC as a quasi-periodic variation of the solar dynamo. Evidence of CGC’s is provided by the multi-century sunspot record, by the almost 150-year record of indexes of geomagnetic activity (1868-present), by 1,000 years of observations of aurorae (from 450 to 1450 AD) and millennial records of radionuclides in ice cores.
The “aa” index of geomagnetic activity carries information about the two components of the solar magnetic field (toroidal and poloidal), one driven by flares and CMEs (related to the toroidal field), the other driven by co-rotating interaction regions in the solar wind (related to the poloidal field). These two components systematically vary in their intensity and relative phase giving us information about centennial changes of the sources of solar dynamo during the recent CGC over the last century. The dipole and quadrupole modes of the solar magnetic field changed in relative amplitude and phase; the quadrupole mode became more important as the XSM was approached. Some implications for the solar dynamo theory are discussed.
* Says The Hockey Schtick: If it is true that the current lull in solar activity is “consistent with minima of the Centennial Gleissberg Cycles,” and the Gleissberg Cycle is a real solar cycle, the current Gleissberg minimum could last a few decades before solar activity begins to rise again.
* Solar physicist Habibullo Abdussamatov predicts the current lull in solar activity will continue until about the middle of the 21st century and lead to a new Little Ice Age within the next 30 years.