EPA document supports ~3% of atmospheric carbon dioxide is attributable to human sources

NOTE: this post has an error, see update below. – Anthony

From a Wry Heat reprinted with permission of Jonathan DuHamel

A new post on The Hockey Schtick reviews a new paper “that finds only about 3.75% [15 ppm] of the CO2 in the lower atmosphere is man-made from the burning of fossil fuels, and thus, the vast remainder of the 400 ppm atmospheric CO2 is from land-use changes and natural sources such as ocean outgassing and plant respiration.”

This new work supports an old table from the Energy Information Administration which shows the same thing: only about 3% of atmospheric carbon dioxide is attributable to human sources.  The numbers are from IPCC data. 

Look at the table and do the arithmetic: 23,100/793,100 = 0.029.

URL for table: http://www.eia.doe.gov/oiaf/1605/archive/gg04rpt/pdf/tbl3.pdf

EPA_Table3pct

If one wanted to make fun of the alleged consensus of “climate scientists”, one could say that 97% of carbon dioxide molecules agree that global warming results from natural causes.

===============================================================

UPDATE:

Thanks to everyone who pointed out the difference in the chart and the issues.

I was offered this post by the author in WUWT Tips and Notes, here: http://wattsupwiththat.com/tips-and-notes/#comment-1696307 and reproduced below.

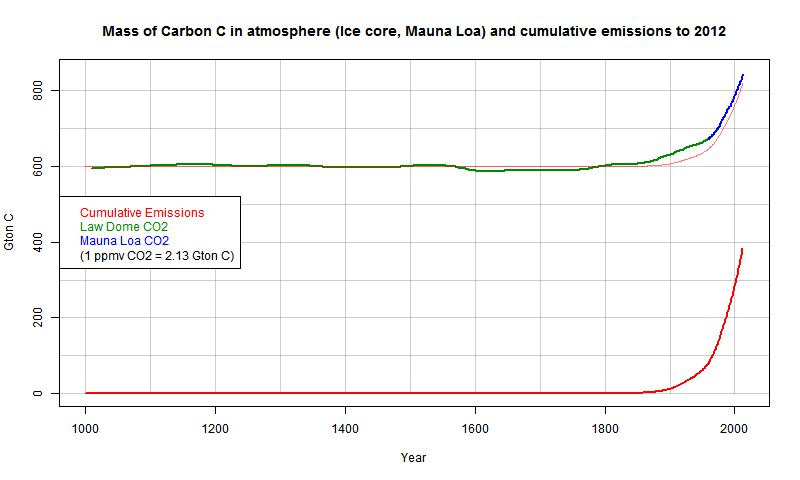
The chart refers to the annual increase in CO2, not the total amount. So it is misleading.

Since the original author had worked for the Tucson Citizen I made the mistake of assuming it was properly vetted.

The fault is mine for not checking further. But as “pokerguy” notes, it won’t disappear. Mistakes are just as valuable for learning. – Anthony Watts

wryheat2 says:

July 28, 2014 at 12:28 pm

Mr. Watts,

John Droz suggested I contact you.

On my blog, I commented on the reasearch by Denica Bozhinova on CO2 content due to fossil fuel burining. She apparently scared The Hockey Schtick into taking down his post on the matter. However, there is an older table from EIA which I reproduce on my post.

Denica Bozhinova has commented extensively, and frankly, I can’t understand her position since she seems to contradict what she wrote in the abstract to “Simulating the integrated summertime Ä14CO2 signature from anthropogenic emissions over Western Europe”

See my post here (you may reprint it if you wish):

http://wryheat.wordpress.com/2014/07/19/only-about-3-of-co2-in-atmosphere-due-to-burning-fossil-fuels/

Jonathan DuHamel

Tucson, AZ

2.3 3 votes
Article Rating
311 Comments
Oldest
Newest Most Voted
Inline Feedbacks
View all comments
David in Cal
July 29, 2014 12:12 am

Note that this result does NOT contradict the likelihood that the increase in CO2 from 300 ppm to 400 ppm was caused (or mostly caused) by man’s emissions.

Zeke
July 29, 2014 12:18 am

Great moment of honesty.
I am not signing for that methane metric. Total sources are not known. Plants release methane in UV light from the sun, which is variable. Methane is released from reserves in the seafloors.
This reminds me of the Josh cartoon, “Stages of Grief” —
http://catallaxyfiles.com/files/2012/07/climate-grief_scr.jpg
“Er, methane?”

Nick Stokes
July 29, 2014 12:19 am

“A new post on The Hockey Schtick reviews a new paper “that finds only about 3.75% [15 ppm] of the CO2 in the lower atmosphere is man-made from the burning of fossil fuels, “
The new paper said nothing of the sort. HS disappeared the entire thread.

glenncz
July 29, 2014 12:27 am

the Hockey Schtick link doesn’t work.
Possibly because the blog post was retracted. The chart does not say that 3.75% of the 400ppm is man-made. Those numbers in the charts refer to annual emissions. The theory is that earth was in a perfect balance before mans fossil emissions and now 50% of that 3.75% is what is causing the 2-3 annual ppm rise in CO2.
The above blog post should be rewritten or deleted.

jaffa
July 29, 2014 12:28 am

Well, David in Cal – Looking at those figures its lucky we started pumping CO2 into the atmosphere or levels would have fallen below 100ppm by now and all the plants would have died.
Or maybe it’s not that simple, maybe climate scietivists haven’t accounted for every mechanism that has kept the climate remarkably stable for hundreds of millions of years.

Nick Stokes
July 29, 2014 12:31 am

glenncz says: July 29, 2014 at 12:27 am
“the Hockey Schtick link doesn’t work.
Possibly because the blog post was retracted.”

The first comment at the Wry Heat link is from one of the authors:
“Denica Bozhinova July 23, 2014 at 2:04 pm
A reply from the authors of the scientific article on the “review” on The Hockey Schtick blog has pointed out that the results cited are grossly misinterpreted and the blog has taken down the entire review and following comments.”

July 29, 2014 1:03 am

Big oops moment?
Don’t fret, you can always fiddle with the figures for a set that better supports the theory.. Go ahead it is hardly considered to be unethical -, just supportive of the pre-established ” morally correct position on CAGW”.

“A reply from the authors of the scientific article on the “review” on The Hockey Schtick blog has pointed out that the results cited are grossly misinterpreted and the blog has taken down the entire review and following comments.”

Siberian_husky
July 29, 2014 1:18 am

Oh. My. God. You are stupid.

July 29, 2014 1:22 am

Anyway it is dated 2001 hardly relevant

Nigel Harris
July 29, 2014 1:26 am

I’d take this whole post down quickly before anyone else notices it. Confirmation bias much?

Wu
July 29, 2014 1:26 am

Excuse my ignorance but I thought plants INHALE CO2 and exhale Oxygen. Was my science teacher wrong? He was a tad old to be frank.

Leo Morgan
July 29, 2014 1:34 am

This post is an embarrassing moment for us sceptics.
As others have mentioned above, this refers to the annual increase in CO2, not the total amount there.
But this has always been a basic tenet of the alarmist’s case.
This does not show any conspiracy by the climate faithful, nor any fact concealed by them. It merely shows that the poster(s) have not understood what both sides have been talking about all along. I must clarify that- in fact its likely that the majority of the faithful do believe humanity is the sole cause of atmospheric CO2- but none of the educated among them do believe that.
The only thing that could make this more embarrassing would be if Anthony were to delete the post. Fortunately he has more integrity than that.
Kudos to all the sceptics who jumped on the mistake and pointed out that the post’s evidence does not support its headline claims.

Dr Ken Pollock
July 29, 2014 1:48 am

Wu, he was right but the message was incomplete. Plants do both – respiration and photosynthesis. The latter fixes CO2 and produces O2, the former uses energy and O2 to produce CO2 and water. All living things respire. Only green plants absorb CO2 to produce the food we all live off.

tonyb
Editor
July 29, 2014 1:48 am

Nick Stokes has already commented that the original article has been completely misinterpreted.
This current article is also therefore misleading and irrelevant
tonyb

July 29, 2014 1:51 am

This new work supports an old table from the Energy Information Administration which shows the same thing: only about 3% of atmospheric carbon dioxide is attributable to human sources.

But land use change (deforestation) is a manmade impact.

July 29, 2014 1:53 am

Oops, should have read the comments first.
This is not worth commenting on.
But fortunately most of my comments are not worth reading either so, fair’s fair.

Allen63
July 29, 2014 1:59 am

If Nature cut its production by roughly 1.5 percent, Mankind would be “off the hook”.
If Nature increases its production by roughly 1.5 percent, Mankind would have to cut its CO2 production to “zero” (to stop the “catastrophe”).
Seems like Mankind is not a big “player” — unless one believes Nature is so “balanced and invariant” that a 1.5 percent change in Natural CO2 is “out of the question”.

holts7
July 29, 2014 2:19 am

How about delete it off WUWT also!!!

Nick Stokes
July 29, 2014 2:20 am

Allen63 says: July 29, 2014 at 1:59 am
‘Seems like Mankind is not a big “player” — unless one believes Nature is so “balanced and invariant” that a 1.5 percent change in Natural CO2 is “out of the question”.’

It can’t be sustained, whereas our continual additions are. The plant biosphere, for example, has about 550 Gtons Carbon. Every year, it takes about 123 Gtons from the air via photosynthesis. 60 Gtons returns via plant respiration and 60 Gt by decomposition. It’s a big annual source, but came from the atmosphere in the first place. We’ve brought to the surface and emitted nearly 400 Gtons C. The plant biosphere can’t compete with that.
Likewise the ocean emits and absorbs 90 Gton/yr. That’s mainly seasonal. Water warms in Spring, and emits. It cools in autumn, and absorbs. It’s been going on for millions of years.

GeeJam
July 29, 2014 2:28 am

Sorry David in Cal, but 400 ppm is such a trivial amount of atmospheric gas when compared to all other gasses. 1 x million divided by 400 is 1 x 2,500th of all the air in the sky. It’s really not a lot.
By comparison . . . .
Nitrogen (N2) is around 780,800 ppm (nearly 1,952 times more than total CO2)
Oxygen (O2) is around 209,500 ppm (nearly 524 times more than total CO2)
Argon (Ar) is around 9,297 ppm (nearly 23 times more than total CO2)
Naturally occurring Carbon Dioxide (CO2) is around 388 ppm
Anthropogenic Carbon Dioxide (CO2) is only around 12 ppm (that’s about 1 x 83,000th of the atmosphere)– and yet it still seems to be widely believed that this microscopic amount of gas has dominated the warming of our Earth during the last century. Even UK vehicle excise duty (road tax) is calculated on how much we contribute to this 1 x 83,000th of the sky.
(Combined total for Neon, Methane, Helium, Krypton, Hydrogen and Xenon is around just 3 ppm)

johnmarshall
July 29, 2014 2:44 am

This claim is totally a guess. Volcanogenic CO2 is more plentiful than anthropogenic CO2 and both are isotopically identical. How can you differentiate?????

Alan Robertson
July 29, 2014 2:47 am

GeeJam says:
July 29, 2014 at 2:28 am
“Anthropogenic Carbon Dioxide (CO2) is only around 12 ppm…”
_________________________
You dropped a digit… 120ppm is more recognized figure.

richardscourtney
July 29, 2014 2:48 am

Nick Stokes:
You repeat the circular mass balance argument in your post at July 29, 2014 at 2:20 am.
Your post says

Allen63 says: July 29, 2014 at 1:59 am

‘Seems like Mankind is not a big “player” — unless one believes Nature is so “balanced and invariant” that a 1.5 percent change in Natural CO2 is “out of the question”.’

It can’t be sustained, whereas our continual additions are.

Really? “It can’t be sustained”? You know that?
There are many possible ways it could be “sustained” because almost all the CO2 circulating in the carbon cycle is in the deep ocean, and it is not known what rate of CO2 exchange occurs between deep ocean and ocean surface layer.
For example, a minute change to ocean surface layer pH of 0.1 would alter the equilibrium of CO2 between air and ocean to induce more change to atmospheric CO2 concentration than has been observed. Such a pH change could not be induced by alterations to CO2 concentrations and fluxes because of the carbonate buffer. But it could be a result of change to the sulphur injected into the thermohaline circulation by submarine volcanoes long ago. When the dissolved sulphur reached the ocean surface layer it would change the ocean surface layer pH with resulting change to atmospheric CO2 concentration. And such a global 0.1 pH change is far too small for the limited available data to indicate it.
I don’t know if the recent rise of atmospheric CO2 concentration (as observed at Mauna Loa since 1958) has a natural cause, an anthropogenic cause, or some combination of anthropogenic and natural causes but I want to know
(ref. Rorsch A, Courtney RS & Thoenes D, ‘The Interaction of Climate Change and the Carbon Dioxide Cycle’ E&E v16no2 (2005) ).
But I do know that the rise is NOT a simple accumulation of CO2 in the air as a result of the anthropogenic CO2 overloading the sinks for CO2: the dynamics of the seasonal variation of CO2 refute such accumulation.
If you want to support the circular mass balance argument then wait for the inevitable arrival of Ferdinand Engelbeen because he promotes it and his knowledge of it is supreme.
Richard

Nylo
July 29, 2014 2:50 am

I don’t think this should disappear from WUWT. Mistakes should be accounted for, not erased as if they never happened. It is only by keeping what was originally said that we can learn some humility, and help in not making similar mistakes so easily in the future. The correct procedure would be to edit the story warning at the beginning that there is some important error in it, and detailing it.

GeeJam
July 29, 2014 2:58 am

Slightly off topic but the following link about UK MP’s bickering over ‘climate reoport’ is worth reading.
http://www.bbc.co.uk/news/science-environment-28531091

GeeJam
July 29, 2014 3:11 am

Alan Robertson says:
July 29, 2014 at 2:47 am
“You dropped a digit… 120 ppm is more recognized figure”.
I’m puzzled. If (as you say) anthropogenic CO2 is 120 ppm, that’s over a quarter of all the total CO2 in the air. Thanks, but I’ll stick with the original figures. About 96.775% of all CO2 is naturally occuring. This leaves 3.225% man-made. I do not know where you got your 120 ppm from.

CodeTech
July 29, 2014 3:13 am

WUWT doesn’t “disappear” posts, and shouldn’t.
There is a nearly infinite capacity for the biosphere to absorb ANY conceivable amount of CO2 that human activity could possibly release. It’s automatic. The naive and, frankly, obtuse belief that there is some sort of “limit” on this is just ridiculous and bizarre, not to mention completely unscientific.
If CO2 levels get high enough, an entirely new level of plant life will remove all that is possible.
CO2 levels DO NOT control temperature. That is backward. But hey, go ahead and continue believing the fiction.

Jake
July 29, 2014 3:22 am

To GeeJam: It is well documented that atmospheric CO2 had been fairly constant at 280 ppm in the time prior to the industrial revolution, at which time CO2 has exponentially increased to its current level of just over 400 ppm. 400 – 280 = 120 …. sorry for the somewhat sloppy sig figs ;). I’m not sure you understand what the values are representing on the table provided.

Another Gareth
July 29, 2014 3:31 am

As others have pointed out this claim rests on considering annual emissions. Half of what is man made emissions this year becomes ‘natural’ the following year as the biosphere keeps expanding.

phlogiston
July 29, 2014 3:32 am

It would be a serious cause for concern if anthropogenic CO2 input to the atmosphere is not responsible for a significant fraction of the recent rise in atmospheric CO2 concentration.
CO2 starvation is a serious threat to the biosphere in the long term and, unlike moderate global warming, has the potential to cause extinction of life on earth.
Anyone interested in biosphere extinction scenarios should read Franck et al 2006:
http://hal.archives-ouvertes.fr/docs/00/29/75/42/PDF/bg-3-85-2006.pdf
This paper points out that CO2 starvation might cause biosphere extinction before heating from solar expansion.
Basically, without human intervention during the next glacial period, as in the last, CO2 levels can be expected to drop below 200 ppm and approach levels that will limit plant growth. Below 150 ppm and you are looking at major plant die-offs.
This might be a situation facing the world population in a few tens of thousands of years time. At that time it might literally be a matter of life and death whether or not we can materially increase CO2 in the atmosphere.
Thus if all the output of the world’s industry, power generation and transport at present is only increasing the atmospheric CO2 level by 3 percent or so, burning fossil fuel as fast as reasonably possible, it suggests we are at the mercy of oceanic exchange processes for CO2 and cant do much about it. This would be bad, not good, news.
Since over the long timescale we are moving toward deepening glaciation, this CO2 starvation scenario might become a reality within the next few glacial cycles.
For this reason I for one sincerely hope that Ferdinand Engelbeen is correct that a substantial fraction of the recent CO2 increase is indeed anthropogenic. If this view is correct it means humanity has some defense available against CO2 starvation, providing our technical-industrial knowledge and infrastructure are preserved.

Alan Robertson
July 29, 2014 3:34 am

GeeJam says:
July 29, 2014 at 3:11 am
Alan Robertson says:
July 29, 2014 at 2:47 am
“You dropped a digit… 120 ppm is more recognized figure”.
—————–
I’m puzzled. If (as you say) anthropogenic CO2 is 120 ppm, that’s over a quarter of all the total CO2 in the air. Thanks, but I’ll stick with the original figures. About 96.775% of all CO2 is naturally occuring. This leaves 3.225% man-made. I do not know where you got your 120 ppm from.
________________________
While the amount of man’s contribution to the rise in CO2 is controversial, 280 ppm/atm is the generally accepted concentration at the beginning of the industrial revolution.
Speaking of “don’t know where you got your figure from”… you are welcome (invited) to post evidence to support your claims.

July 29, 2014 3:40 am

glenncz says: July 29, 2014 at 12:27 am
The chart does not say that 3.75% of the 400ppm is man-made. Those numbers in the charts refer to annual emissions. The theory is that earth was in a perfect balance before mans fossil emissions and now 50% of that 3.75% is what is causing the 2-3 annual ppm rise in CO2.
The above blog post should be rewritten or deleted.

Retraction is no use – the harm is done. But your remark should be added to the original blog post.

DC Cowboy
Editor
July 29, 2014 3:45 am

Alan Robertson says:
July 29, 2014 at 3:34 am
“While the amount of man’s contribution to the rise in CO2 is controversial, 280 ppm/atm is the generally accepted concentration at the beginning of the industrial revolution.”
Alan, are you saying that since pre industiral revolution the CO2 concentration of CO2 was 280ppm and the concentration is ~ 400ppm, then that means that the entire increase (120ppm) is attributable to anthropogenic sources? If so, I am very ‘skeptical’ (or maybe ‘denial inclined’) about that idea. I suppose you could claim that the entire 120ppm is a result of anthropogenic activity and associated feedbacks, but even then I’d have to see some evidence that the proposed feedbacks actually exist.

Alan Robertson
July 29, 2014 3:54 am

dccowboy says:
July 29, 2014 at 3:45 am
Alan Robertson says:
July 29, 2014 at 3:34 am
“While the amount of man’s contribution to the rise in CO2 is controversial, 280 ppm/atm is the generally accepted concentration at the beginning of the industrial revolution.”
Alan, are you saying that since pre industiral revolution the CO2 concentration of CO2 was 280ppm and the concentration is ~ 400ppm, then that means that the entire increase (120ppm) is attributable to anthropogenic sources? If so, I am very ‘skeptical’ (or maybe ‘denial inclined’) about that idea. I suppose you could claim that the entire 120ppm is a result of anthropogenic activity and associated feedbacks, but even then I’d have to see some evidence that the proposed feedbacks actually exist.
_________
I did not make that claim and in fact, said that the attribution of the 120 ppm rise is controversial.

July 29, 2014 3:59 am

Oh brother, yet another thread wasted on trying to explain the obvious.
Here is a 5-year old paraphrase from David J. C. MacKay, professor of natural philosophy in the Department of Physics at the University of Cambridge,
The burning of fossil fuels sends seven gigatons (3.27 %) of carbon dioxide into the atmosphere each year, while the biosphere and oceans account for 440 (55.28 %) and 330 (41.46 %) gigatons, respectively. Total human emissions have jumped sharply since the Industrial Revolution; and it is this added atmospheric carbon that worries many. Yes, carbon is emitted naturally into the atmosphere but the atmosphere also sends carbon back to the land and oceans and these carbon flows have canceled each other out for millennia. Burning fossil fuels, in contrast, creates a new flow of carbon that, though small, is not cancelled.

July 29, 2014 4:04 am

This post and the comments that follow bring up some questions.
1) Why do we suppose that the CO2 concentration in the atmosphere before the industrial revolution was perfect? If it was not perfect then, what is perfect?
2) How much of the 400 parts per million is there because of nature and how much is really there because of mankind’s activities — and how sure of that are we?
3) What average temperature is perfect? How do we know that?
4) Has the earth ever had much more than 400 ppm of CO2 in the atmosphere? If so, did it lead to “runaway warming” leading to the devastation of life on earth?
5) Does more CO2 lead to a “greening effect” that gives us more plant mass? If so, does the more plant mass use up CO2 from the atmosphere? If so, is that a negative feedback to increased CO2?
I wonder if our understanding of the dynamics of all of this is on par with our lack of understanding of “continental drift” was back when I was in school. (now renamed “plate tectonics)

July 29, 2014 4:10 am

Geocraft had it at 3.225% – http://www.geocraft.com/WVFossils/greenhouse_data.html
Given the small percentage, I suspect both are in the ball park

July 29, 2014 4:14 am

markstoval says: July 29, 2014 at 4:04 am
This post and the comments that follow bring up some questions.
You have every right to ask those questions.
But when citing / quoting a paper, one should at the very least correctly convey what the authors’ claims are.

July 29, 2014 4:20 am

Johan says:
July 29, 2014 at 4:14 am
markstoval says: July 29, 2014 at 4:04 am
This post and the comments that follow bring up some questions.
You have every right to ask those questions.
But when citing / quoting a paper, one should at the very least correctly convey what the authors’ claims are.

I made no claim at all as to what the cited paper said. Why would you suggest that I had incorrectly conveyed the author’s claims?

July 29, 2014 4:30 am

markstoval says: July 29, 2014 at 4:20 am
I made no claim at all as to what the cited paper said. Why would you suggest that I had incorrectly conveyed the author’s claims?
Not you – I meant the original blog post. And it would seem that The Hockey Schtick already retracted their review, as numerous posters pointed out their blunder.

July 29, 2014 4:33 am

Of course, on a somewhat different and even more important note; what e.g. Nick Stokes has missed (or is perhaps unaware of) is that; for the stated rate and retention of anthropogenic (fossil-derived) CO2 in the atmosphere claimed by IPCC in AR4 to have caused the small drop observed in atmospheric δ13C, the initial atmosphere CO2 concentration would have been 2,913.9 GtC, some 3.8 times the figure used by IPCC. This is equivalent to 1,453 ppm of CO2 instead of 380 ppm!
The atmospheric 13C mass balance will agree with the measurements only if the atmosphere retains much less than 50% of the estimated anthropogenic emissions. The necessary retention is 13.1%, a factor of 3.8 less than the ~50% supplied by IPCC in AR4. The IPCC AR4 Figure 2.3(b) ‘Keeling Plot’ is fraudulent. They quoted Battle et al. (2000) but they didn’t botgher to read it.
The surge in CO2 seen in the last century was not caused by man (although it may well have been caused by global warming). The CO2 added to the atmosphere is far heavier than the weight attributed to anthropogenic CO2. The isotopic ratio for fossil fuel would have had to be considerably heavier; -13.657‰PDB instead of -29.4‰PDB, for the increase in atmospheric CO2 to have been caused by man. IPCC can’t even get their isotopic geochemistry right. Dig and ye shall find ‘curious’ literature contortions with the 13C data have continued right up into the last decade! Settled science…..not.
.

TimC
July 29, 2014 4:48 am

Sorry if I’m being dense, but are the numbers being discussed up-thread correct?
The “Table 3” chart above shows total (annual) CO2 emissions of 793,100 E6 metric tonnes of gas, being 770,000 E6 natural and 23,100 E6 anthro. If there were no anthro element the emissions would have been just the 770,000 E6 tonnes. Assuming (am I correct?) that absorption is essentially proportional to total atmospheric CO2, the pro-rata absorption would have been 758,640 E6 tonnes, with no athro element. So: without any anthro element these figures anyway show an annual increase of 11,359E6 tonnes.
Doesn’t this mean that the (suggested) anthro annual increase is just 340E6 tonnes, representing at most 3% of the natural annual increase and just 0.043% of total atmospheric CO2? How is it possible realistically to account for a signal as small as that?

Alx
July 29, 2014 4:48 am

The headline is mis-leading, alarmist claim most if not all of the increase in CO2 is man-made. The table presented shows that human contributions are ~3% of total CO2, then shows the effective increase is ~1.5%.
As wrong as the headline is, the alarmist claim that there would be little to no increase to the total CO2 without man-made CO2 contributions is equally wrong. The global system is dynamic not static with the only variable being humanity.
I do not think alrmist claims would even pass as circumstantial evidence in a court of law. If petty crime went up since Michael Mann was hired by his university, could Michael Mann be arrested as the cause?

Jimbo
July 29, 2014 4:49 am

Anthony,
If there is a mistake here then it should be stated now, and further comments are thus unnecessary.

MikeB
July 29, 2014 4:56 am

Although the conclusions drawn by the Hockey Schtick were a load of junk, the table produced by the IPCC is quite reliable. It gives the relative contributions of CO2 to the atmosphere from natural and human-made sources. This shows that the human contribution was about 3% during the 1990s. The figures are a little out of date, but won’t have changed much.
It is easy to see that, without the human contribution, the natural CO2 sinks on the planet could cope with CO2 naturally produced but when human-made CO2 is included these sinks are overloaded and there is an excess of 11,700 tonnes of CO2 left in the atmosphere each year.
So how does this increase of 11,700 tonnes per year compare to the increasing CO2 levels measured by the Mauna Loa Observatory each year?
The Mauna Loa figures show that CO2 concentrations are increasing at a rate of about 2 parts per million(by volume) per year.
Now the mass of the Earth’s atmosphere is about 5.1*10^15 tonnes so, in proportion, an increase of 11,700 tonnes per year represents an increase of 2.29 parts per million (by mass). So we can see that this is in the right ball park and conclude that the rise in CO2 levels of 2 ppmv per year is consistent with the human-made contribution of atmospheric CO2.
From another perspective, we know that a CO2 concentration of about 280 ppm is normal during interglacial periods like this one and this was the level before the industrial era. See ice core records…http://commons.wikimedia.org/wiki/File:Vostok-ice-core-petit.png
The level is now 400 ppm, the highest level for 800,000 years. In the absence of any other theories to the contrary, it is reasonable to suppose that the current enhanced CO2 levels are due to human activity.
This is not to say that there is a problem. Oil and Gas will run out long before we can double the current level ( at 2ppm per annum it will take 200 years) and, as the ‘pause’ indicates the sensitivity of the climate to CO2 is probably much less than the IPCC would have us believe. So increasing CO2 is as likely to be beneficial as it is harmful.

July 29, 2014 5:13 am

MikeB says:July 29, 2014 at 4:56 am
Although the conclusions drawn by the Hockey Schtick were a load of junk, the table produced by the IPCC is quite reliable.
Quite so, but I’m also sure mr. Anthony Watts knows very well the difference between “annual CO2 emissions in the atmosphere” and “annual CO2 concentration in the atmosphere”.
Then why repost that “load of junk” of the Hockey Schtick here? Very hight trust can be too much of a good thing.

GeeJam
July 29, 2014 5:21 am

philjourdan says:
July 29, 2014 at 4:10 am
“Geocraft had it at 3.225%”
Thanks for backing me up Phil (and reinforcing the link to Geocraft). Man-made CO2 is 3.225% of 400 ppm. If posters wish to highlight the significance of pre-industrial levels of CO2, then fine – but suggest you don’t leave it there. Why not go back 2,000 years to the Roman era when there was even less CO2, yet (according to research) it was considerably ‘warmer’ than it is right now. And they didn’t have carbonated drinks, decaffeinated coffee, welding coolant gas, air-con, dry-ice pellets, refrigeration, etc.
Even if anthropogenic CO2 was 5% of the total atmospheric CO2 (which it isn’t) then it’s still an incredibly miniscule amount when compared to all other gasses present in the air – and cannot be totally accountable for a 1 degree rise in temperature during the last century. It’s 26 degrees C here in central UK today. It was only 3 degrees C here in February. My super-human personal ability to adapt to a 23 degree temperature difference in five months is just astonishing! Nuff said.

JRM
July 29, 2014 5:28 am

Question, Mauna Loa ticks up 2ppm it seems every year, this does not come even close to mans increased output? If man caused it to increase 2ppm in the 60’s, should it now not be going up by 10ppm now as our output increases?

Latitude
July 29, 2014 5:39 am

here we go again……man emits a special CO2 that’s cumulative….plants, oceans, and chemistry can’t touch it
“CO2 levels can be expected to drop below 200 ppm and approach levels that will limit plant growth.”
Our current CO2 level is limiting to plants now….increase it in a greenhouse and plants grow faster

July 29, 2014 5:40 am

GeeJam says: July 29, 2014 at 5:21 am
Man-made CO2 is 3.225% of 400 ppm.
GeeJam, can you please tell us the difference between “CO2 emissions in the atmosphere” and “CO2 concentration in the atmosphere”, and in what units both are measured?

July 29, 2014 5:56 am

I would like comments on my attemps to get a handle on the anthropogenic contribution. http://retiredresearcher.wordpress.com/

ROM
July 29, 2014 6:36 am

As has been pointed out innumerable times on WUWT and every other skeptic web site around, plants need CO2 to live and survive and to provide the carbon component from the splitting of the CO2 molecule in the photosynthetic process for the sugars they produce that provide the plants with the energy that allows them to grow, flower and set seed.
Without plants there would be no sentient life on this planet.
Again as has been pointed out innumerable times, the pre industrial atmospheric levels of CO2 are claimed to have been around 280 ppm.
Plant biologists looking at fossilised leaves and counting the stomata that are the pores on the underside of the leaves through which CO2 is taken in by the plant and O2 left after the splitting of the CO2 molecule for it’s carbon component, plus water vapour, is expelled through those same leaf stomata.
High CO2 concentrations mean that the plant needs fewer stomata to access it’s needs for that essential CO2. Fewer stomata also means the plant conserves water better leading to more growth but less water requirements per growth mass to achieve that extra growth.
Consequently plant biologists who have studied the stomata numbers in fossilised leaves have claimed that the pre-industrial CO2 was around the 310 -320 ppm, or 30 or 40 ppm above that long standing claim of 280 ppm of pre-industrial CO2.
But that 280 ppm claim does make the supposed anthropogenic / humanity contribution to atmospheric CO2 by raising the CO2 levels to 400 ppm seem a much greater contribution than is likely the case.
At around the 180 ppm level of CO2 a lot of plant species start to suffer severe slow downs in growth as they become starved for that essential CO2 to split for its carbon component to make those growth essential plant sugars.
Below 150 ppm of atmospheric CO2 some plant species die due to CO2 starvation..
So if we take 180 ppm as the minimum plant requirement for survival then at that pre-industrial level of CO2 of 280 or 300 PPM, the plant kingdom had a pre-industrial CO2 buffer of about 100 to 120 ppm over it’s minimum for survival 180 ppm CO2.
At 400 ppm of CO2 that CO2 buffer stretches out to 220 ppm
Effectively if the increase in plant essential CO2 to 400 ppm is accepted as anthropogenic in origin, we humans have doubled the amount of the available plant useable CO2 from it’s previous buffer of 100-120 ppm pre-industrial levels to a healthy for plants, 200-220 ppms today..
Plants have got to love us for that and as we sentient beings of every calibre are in fact utterly dependent on the plant kingdom for our very existence then that doubling of available and plant useable CO2 over the last 40 or 50 years is of immense benefit to ALL life on this planet.
And if there is a fraction of a degree warming included then that also is of very considerable benefit.
May it long continue although sadly the warmth part of the equation might be coming to an unfortunate end for the next few generations of mankind.

tadchem
July 29, 2014 6:37 am

Footnote (a) is fascinating. It is explicitly assumed that 100% of the ‘natural source’ CO2 is absorbed, based on ‘balanced flux’, but slightly over half of the 23,100 million tonnes of “human-made emissions” go to ‘atmospheric absorption’ (whatever that is.)
One of the first things I learned as a chemistry student was that all molecules have amnesia – there is no way to tell where any particular one has been.

Bernard Lodge
July 29, 2014 6:50 am

The Mauna Loa CO2 trend gives some clues as to how much of the increase in atmospheric CO2 is man-made.
http://www.esrl.noaa.gov/gmd/ccgg/trends/
Although atmospheric CO2 has increasing by 2 ppm each year for many years, every northern spring, CO2 concentrations actually fall by 7 ppm followed by a 9 ppm increase in the northern autumn. This cycle repeats every year without fail. Obviously seasonal changes in temperature are causing the seasonal fluctuations in atmospheric CO2. This raises two points:
1. Natural effects causes atmospheric CO2 to fluctuate hugely every year. Even if you accept that all the 2 ppm net annual increase each year is man-made, the natural annual fluctuations are much greater than the annual man-made effects. Without understanding the natural long term CO2 cycles, to assume that all the long term CO2 increase in the last 100 years is man-made should not be accepted as very likely at all.
2. The seasonal CO2 fluctuations clearly show that the temperature changes first, followed by changes in atmospheric CO2. Temperature is the independent variable and CO2 the dependent variable. This is the opposite of what the IPCC claims. Could someone among the many informed WUWT readers please explain how a dependent variable can also be an independent variable? I did not think that was mathematically possible.

Kyle K
July 29, 2014 6:50 am

Anthony, The Hockey Schtick was thoroughly discredited over this one, days before you picked it up.

July 29, 2014 7:04 am

At one Utah site CO2 varies by 150ppm between summer and winter.
http://co2.utah.edu/co2tutorial.php?site=7&id=1
Rotting vegetation probably explains the yearly variation … not fossil fuels.
So the cycle we are getting all excited about:
LIA recovery = more vegetation = more CO2 when it rots

PhilCP
July 29, 2014 7:07 am

WUWT should not disappear the article. Instead, we should do what we usually do when a substandard article appears. Rip it to shreds. This is how we distinguish ourselves from the alarmists, who lap up any crap that comes out, regardless of its idiocy.
Anthony’s credibility may take a hit, but this is how science should work.

pokerguy
July 29, 2014 7:21 am

“I don’t think this should disappear from WUWT”
Nor is it in any danger of doing so. Good time to ponder alarmist sites with their penchant for disappearing mistakes, and contrast that with most of the skeptic sites I know about. Who doesn’t make a mistake from time to time, especially on such a high volume site? Kudos Anthony.

OK S.
July 29, 2014 7:22 am

Maybe the poster (one of the paper’s authors) of this comment at Wry Heat could be asked to expand on it and guest-post it here at WUWT for discussion. She, I think, deserves a wider audience after all the publicity.

Russ R.
July 29, 2014 7:30 am

Wow.
I’m really disappointed to see such misinformed “analysis” appear here, but I’m encouraged by the fact that so many commentators have promptly weighed in to correct the errors in understanding.

Pamela Gray
July 29, 2014 7:32 am

The long term proxy CO2 records, combined with current modern measurements confirms that CO2 is a noisy and natural part of long term weather pattern variation processes. Given that planet greening to warm temperature swings has a bit of lag, our current measurements may be pointing to that greening and nothing else. The addition of fossil fuel CO2 in the measurement algorithm is a tiny blip in CO2’s wide, swinging, up and down history. Hell, you can’t even find such a human-sourced CO2 molecule in a flask of captured CO2. You have to calculate that it is there.

DMA
July 29, 2014 7:46 am

Remember the work of Murry Salby? He showed that there is no direct correlation of atmospheric CO2 content to anthropogenic emissions. Further he showed that the atmospheric CO2 content varied as a function of the integral of the global temperature. Then he got sacked an had his work taken away for rocking the boat. I have never found a rational rebuttal to his hypothesis.

AnonyMoose
July 29, 2014 7:50 am

“This post is an embarrassing moment for us sceptics.
As others have mentioned above, this refers to the annual increase in CO2, not the total amount there.”
Not overly embarrassing. I noticed the graph was apparently for annual data although there was no context which indicated that, so I came to the comments to ask. Answered already, many times, by our intelligent participants. Things don’t happen the same in the liberal press.

Greg Goodman
July 29, 2014 8:20 am

Nick Stokes: “Likewise the ocean emits and absorbs 90 Gton/yr. That’s mainly seasonal. Water warms in Spring, and emits. It cools in autumn, and absorbs. It’s been going on for millions of years.”
It is interesting to look at the annual cycle of atm CO2 in the Arctic. For much of the year it matches ice area, not SST. This is probably because a mix of ice & water is had a very stable temperature. The variation in how much CO2 is absorbed and sinks to the abyss is related to the amount of exposed water.
http://climategrog.wordpress.com/?attachment_id=996
Only in the Arctic winter does the temperature relationship seem to appear and flattens off the top of the ice area relationship.

GeeJam
July 29, 2014 8:23 am

Johan says:
July 29, 2014 at 5:40 am
GeeJam, can you please tell us the difference between “CO2 emissions in the atmosphere” and “CO2 concentration in the atmosphere”, and in what units both are measured?
Please accept my apologies to all the regular WUWT posters who already know all the following.
Johan, assuming that you genuinely don’t fully understand the difference between the two; ‘emissions’ represents the man-made contribution of CO2 added to the already naturally occurring amount of CO2. When both are added together, they form the total ‘concentration’. Simple.
As CO2 is much denser than most other atmospheric gas, unfortunately the ‘concentration’ of CO2 is found in the lower 50% to 65% of atmosphere. (By comparison, CO2 is 1.97 lbs per sq metre, whilst Oxygen is 1.43 lbs per square metre).
‘Emissions’ are usually measured in metric tonnes (which regrettably sensationalises the ‘warmist’ melodrama because it is still virtually impossible to weigh up against naturally occurring CO2 tonnage, i.e. accurate measurements of CO2 ‘tonnage’ emitted from a volcano, a naturally decaying corpse, flatulence or even the CO2 produced by natural calcification such as stalactite filled underground caverns. Saying that, should someone admit that globally, large-scale bread manufacture produces 85.5M tonnes of CO2 annually*, then someone might start taxing bread. Man-made CO2 through yeast fermentation and the dry-ice sandblast cleansing of the industrial baking equipment afterwards produces the same amount of annual CO2 ‘emissions’ as 61,122,143 family cars (in contrast, there are 32M cars registered in the UK).
Conversely, total ‘Concentrations of CO2’ are nearly always measured in parts per million (which again adds to the warmist melodrama because ppm sounds vast, i.e. in on 10th May 2013, ‘Global Warming Alarmists’ sensationalised the fact that “During the last 40 years, CO2 levels had increased from 314 parts per million to 400 parts per million. Put in perspective, if they had run the story along the lines of “314 parts per million is 0.0314% of our atmosphere. 400 parts per million is 0.040% of our atmosphere. An insignificant increase of just 0.0086%.”, then I doubt if anyone would be concerned.
I trust I’ve answered your question.
GeeJam
*References: http://www.hydrofarm.com/resources/articles/co2_enrichment.php
*Summary Guide: Almost every culture eats bread. When fermented with yeast nutrient, 1lb (453.59 g) of sugar converts to 0.5 lb of Ethyl Alcohol (C2H5OH) & 0.5lb of CO2. If the average large classic farmhouse loaf uses 23.95g of sugars (some natural within flour and milk), then 453.59 g of sugar produces 18.9 loaves which produce 0.5 lb of CO2. If there are 12M large loaves sold each day in the UK (source: UK Flour Advisory Service), then 140.977 tonnes of man-made CO2 is ‘emitted’ each day – or 51,465 tonnes of CO2 per annum. Based on this, and allowing for just 80% of the world’s current population (7.17B) as bread consumers with the average person consuming 62.5 loaves per annum, results in 85.571 tonnes of CO2 per annum.

PhilCP
July 29, 2014 8:29 am

Here’s a layman’s explanation of the subject at hand: :
Say you have an unused and uncovered outdoor swimming pool. The pool is equipped with a filter circuit and a small drain at the base. The filter pump draws 30gallons/minute out of the pool and returns it to the pool. The water level of your pool is not affected by the filter water.
The drain compensates some added water that comes into the system through rainfall. The water level rises and falls if rainfall is greater or lesser than the average. You’ve checked the water level recently and it was at 280mm. At that level, the drain emptied out 0.1gallons per minute. The drain actually waters nearby plants, resulting in a “greening” of your garden, beyond the normal rainwater.
Now, say you add a hose that adds 1 gallon per minute to the pool. It doesn’t matter that the hose adds only 3% of the pump’s in-and-out flow, the water level will still rise gradually. The water level is now at 400mm.
The more the water level rises, the more the pressure increases on the drain, which then increases its flow out of the pool (say from 0.1 to 0.15gpm). There is still a net increase of water flow of 0.95 gallons/minute into your pool. The flow increase from the drain actually increases the greening of your garden.
If you were to stop the flow of added water into the pool, the water level would gradually drop (owing to the larger drain flow) until the water level reaches 280mm again (for the current assumed rainfall level) and the drain flow drops down to 0.1gpm again (goodbye extra greening)
Note that this does not indicate that 280mm or 400mm is “too high” or “too low” but we do know that the pool’s content can be really high, as it once contained 7m of water (long ago) and it did not burst.

July 29, 2014 8:34 am

Anthony Watts says:
July 29, 2014 at 7:42 am
Anthony:
My kudos to you sir for responding to this error in an honest and open way that these days seems to be totally opposite of the way the CAGW alarmists react when they know that they’re wrong. It is refreshing to see and It serves to reinforce my belief that the truth about the CAGW issue does indeed lie here at your blog.
It is my belief that CAGW alarmists are totally off the mark if they think that they are morally and ethically right these days to engage in lies and the perverse manipulation of science to achieve what they feel is a just and righteous end. Among other things, history teaches us that it is technological advances and improvements that usher in new eras in human history. Thus it will be technological improvements and advancements that will someday usher in a post-fossil fuels world (probably a nuclear powered one among other things) and not CO2 taxes, cap-and-trade-schemes, solar and wind boondoggles, and scientifically bogus climate scare campaigns. A campaign built on lies is one built on quicksand.
Anthony, keep up the great work at this blog. You are worth your weight in gold. Let’s see…gold is around $1300 the ounce right now multiplied by……how much do you weigh Anthony?
REPLY: Thanks. I try not to be like John Cook – Anthony

Greg Goodman
July 29, 2014 8:35 am

DMA says:
Remember the work of Murry Salby? He showed that there is no direct correlation of atmospheric CO2 content to anthropogenic emissions. Further he showed that the atmospheric CO2 content varied as a function of the integral of the global temperature. Then he got sacked an had his work taken away for rocking the boat. I have never found a rational rebuttal to his hypothesis.
===
There’s never been a rebuttal because he never published in a journal nor even on the web. All we have is video. That is neither documentation of his “work” nor something that required rebuttal.
Shame he never follow through. He seemed to have something worth assessing.
Until he does make some proper account of his calculations public, it is incorrect there is no validity in comments of the form “Further he showed that … ” He didn’t. He did a video presentation, a lecture.

DayHay
July 29, 2014 8:40 am

“The level is now 400 ppm, the highest level for 800,000 years. In the absence of any other theories to the contrary, it is reasonable to suppose that the current enhanced CO2 levels are due to human activity.”
Huh? Every time I see a house fire I drive up and sure as hell the fire department is there, so I reasonably suppose that these fires are due to fire department activity.
The Vostok ice core graphs also show a major decline in temps over the holocene, with larger temperature swings as we get closer to present time. It also shows temperature rise preceding CO2 rise. It also shows a metric crap ton of temperature swings, all but ONE of which happened before industry showed up. So why would I be out of line to complain when CO2 attribution is used to artificially raise energy costs and reduce my standard of living? The climate “scare” started with the hippy/greeny anti SUV attitude and went on from there. Now it has morphed into a cosmic money and power grab. Need more science please, less MSM and IPCC.

July 29, 2014 9:01 am

Nick Stokes writes

Every year, it takes about 123 Gtons from the air via photosynthesis. 60 Gtons returns via plant respiration and 60 Gt by decomposition.

That’s not quite true. 99.9% is returned to the atmosphere and 0.01% is burried in sediments which ultimately form rocks. This biological source together with natural weathering is the origin of all the oxygen in the atmosphere. Fossil fuels represent a tiny proportion of all that burried carbon taken from the atmosphere. The carbon cycle in effect acts as a negative feedback on temperature changes over the long term. The current stable CO2 level is about 300 ppm because it maximises radiative heat loss by the atmosphere. This level is maintained because removal of CO2 by weathering is temperature dependent and natural sources return CO2 to the atmosphere through plate tectonics. When eventually mankind stops emitting CO2 then levels will return to this level – at least until the next ice age.

PMHinSC
July 29, 2014 9:03 am

MikeB says:
July 29, 2014 at 4:56 am
“…It is easy to see that, without the human contribution, the natural CO2 sinks on the planet could cope with CO2 naturally produced but when human-made CO2 is included these sinks are overloaded and there is an excess of 11,700 tonnes of CO2 left in the atmosphere each year….”.
Ignoring the fact that due to insufficient data on the carbon cycle the statement that “there is an excess of 11,700 tonnes of CO2 left in the atmosphere each year” is a calculation unsupported by data, that statement assumes, left alone, there is an equilibrium level of CO2 in the atmosphere (presumably 280 ppm). All proxy data I have seen indicated otherwise
(E.G. http://wattsupwiththat.files.wordpress.com/2013/06/co2_temperature_historical.png)
The fact that the level of CO2 is rising and that the earth is greening, presumably in response to the increased CO2, also doesn’t support a 280 ppm equilibrium assumption.

Alan Robertson
July 29, 2014 9:10 am

Bernard Lodge says:
July 29, 2014 at 6:50 am
_______________________
Are you attributing the annual Northern Hemisphere change in CO2 concentration solely to temperature change? I didn’t see where you mentioned that the NH biosphere begins thriving in Spring and returns to dormancy each Autumn.

July 29, 2014 9:13 am

Regarding the “right” level of CO2: obviously, there isn’t a per se “right” level. But we do have a planet’s worth of infrastructure that is based on certain assumptions we’ve made about rainfall, temperature, available water supplies and sea level. If those assumptions prove to be incorrect, we will have to do something about it: relocate cities, convert arable land to passive uses and vice versa, and on and on.

David Larsen
July 29, 2014 9:16 am

The joke is, when the earth cools because the sun has gone into remission the greenies will claim it was their action by reducing carbon, even though there is no correlation.

JJ
July 29, 2014 9:22 am

Nick Stokes says:
It can’t be sustained, whereas our continual additions are.

Entirely unsupported assertion, contrary to known facts. When we started pumping CO2 into the atmosphere, only half of what we figured we were adding stayed in the atmosphere. That demonstrates that Nature’s carbon sinks can change capacity. As anthro CO2 emissions have gone up, the proportion of them apparently sequestered has remained constant, indicating that the increase in sink capacity has not only been sustained, but has grown.
No one knows the mechanism by which this annual vanishing CO2 operates. Our concept of the earth’s carbon budget remains unbalanced, and not by a small amount. Until our great grandchildren succeed in sorting it out, pronouncements about carbon sources to the atmosphere are merely the results of political inkblot interpretation.

July 29, 2014 9:23 am

DMA and Greg Goodman
several other people, including me, have had a go at reproducing Murray Salby’s work showing CO2 is proportional to integral of preceeding global temperature (anomaly).
Here’s my attempt which includes links to data, code and spreadsheet
http://jeremyshiers.com/blog/murray-salby-showed-co2-follows-temperature-now-you-can-too/
In this post I compared CO2 levels with RSS. I have also compared CO2 against HadCrut4 and got a similar result (though not identical). Yet to post that though.
Have a play and tell us what you find

Tom J
July 29, 2014 9:25 am

What’s really the point behind these IPCC figures adopted by the EIA in the table above? In the end they’re just numbers burdened by interpretations with the interpretations themselves burdened by the numbers. I assume the listed anthropogenic source of 23,100 million metric tons of CO2 is probably modestly accurate since the records on fossil fuel extraction, sales, and consumption are likely well documented. Unless they’re not, because the stated increase in atmospheric CO2 is considered to be from anthropogenic sources, and that stated increase of 11,700 is almost exactly 1/2 of that 23,100 source. Oh, I know, the biosphere takes up the other 11,700- million metric tons of that 23,100 source! Now, of course that same biosphere can suck up a whopping 770,000 million metric tons (a number itself subject to measurement error and interpretation) of CO2 from natural sources with such precision that there is no net gain whatsoever but add to that volume a mere 23,100, or 3% and, by golly, it just can’t suck up any more. But, it can somehow eat up the first half of that and then it’s belly is full? No further distention than that? Why not? No one knows? Every single one of the numbers in that table; 770,000 million metric tons of CO2 naturally sourced; 23,100 mmt anthropogenic; 793,100 mmt natural and anthropogenic total, 781,400 mmt absorbed, and 11,700 mmt of CO2 annual growth; can be interpreted and explained in more ways than there’s numbers shown. And every one could be wrong.

July 29, 2014 9:33 am

So, the anthropogenic CO2 addition to the atmosphere is calculated by subtracting 280 PPM (pre-industrial) from 400 PPM (current concentration)? That’s how you arrive at 120 PPM as the human contribution?
So: no new trees grew since the pre-industrial age, and no deforestation? No additional crops or chorophyll? No volcanoes belched? The deep ocean water doesn’t slap up the side of Peru in the ENSO cycle, or the Kelvin wave when the trade winds play peek-a-boo? Cosmic rays don’t increase carbon-14.
It’s all the fault of cars and choo-choos, cement and air-conditioning, and the increasing global population exhaling every five seconds.
Do you know how stupid this sounds to a regular person?

sleepingbear dunes
July 29, 2014 9:36 am

Mistake and embarrassment or not, this was a good airing out of the issue and a good chance for those with the knowledge to share it with others. An educational moment for all.
All things considered, a good post.

July 29, 2014 9:38 am

Tom J says:
July 29, 2014 at 9:25 am
What’s really the point behind these IPCC figures adopted by the EIA in the table above?

No kidding. Where’s the water vapor?

July 29, 2014 9:39 am

The fault is mine for not checking further. But as “pokerguy” notes, it won’t disappear. Mistakes are just as valuable for learning. – Anthony Watts
And more honest, too. Something sorely lacking elsewhere. Thank you.

July 29, 2014 9:40 am

Policycritic: I would hope that a regular person would think about this a little more deeply than you suspect. A regular person would probably figure out that trees grew both before and after humans industrialized. Likewise volcanoes. Likewise ENSO. All of those things happened before us and will happen after us. They are a given. What’s new since we industriaized? Only a few things relevant to this: we added carbon dioxide in amounts that the planet cannot readily absorb, and we insitituted land use changes. I think the regular person understands all of this. We took a planet in rough balance and tipped the scales. I think a regular person can figure that out.

PMHinSC
July 29, 2014 9:42 am

claimsguy says:
July 29, 2014 at 9:13 am
“But we do have a planet’s worth of infrastructure that is based on certain assumptions we’ve made about rainfall, temperature, available water supplies and sea level. If those assumptions prove to be incorrect, we will have to do something about it: relocate cities….”
Even if these assumptions are correct cities such as Las Vagas with average July temps of 105 Deg F and annual rainfall of around 10″, use a disproportionate and unsustainable amount of water and energy. You don’t have to believe in CAGW to understand that the earth is getting more crowded putting ever increasing pressure on natural resources. And you don’t have to believe in CAGW to believe that thru land use policies and albedo changes (e.g. carbon soot) man is effecting his environment.

richardscourtney
July 29, 2014 9:43 am

MikeB:
At July 29, 2014 at 4:56 am you say

It is easy to see that, without the human contribution, the natural CO2 sinks on the planet could cope with CO2 naturally produced but when human-made CO2 is included these sinks are overloaded and there is an excess of 11,700 tonnes of CO2 left in the atmosphere each year.

NO!
Considering the dynamics of the seasonal atmospheric CO2 variation (see e.g. here), it is easy to see that the natural CO2 sinks on the planet can cope with all the CO2 produced naturally and anthropogenically.
The seasonal variation has a saw-tooth form. It plummets as net sequestration occurs then rapidly reverses. There is NO reduction to sequestration rate as sinks fill: clearly, the sinks do NOT fill.
However, the annual rise of atmospheric CO2 is the residual of the seasonal variation of atmospheric CO2. So, although the dynamics of the seasonal atmospheric CO2 variation clearly show that the sinks could sequester all the CO2 of a year, the annual rise shows they don’t.
These observed effects are explicable as being a result of adjustment towards changed equilibrium state of the carbon cycle system. The seasonal variation is response to processes with short (i.e. minutes, hours, days, months) rate constants, and the annual rise is response to processes with long (years, decades, centuries) rate constants.
If this explanation of the recent rise in atmospheric CO2 is correct then there are several possible causes of the altered equilibrium. The anthropogenic CO2 emission is one possible cause but the temperature rise from the Little Ice Age (LIA) is more likely.
Please note that by using this assumption we were able to model the rise in atmospheric CO2 concentration as being caused by a variety of effects both natural and anthropogenic.
(ref. (ref. Rorsch A, Courtney RS & Thoenes D, ‘The Interaction of Climate Change and the Carbon Dioxide Cycle’ E&E v16no2 (2005) )
Each of our models matches the Mauna Loa data to within stated measurement accuracy for each year.
The good fit of each our models with the Mauna Loa data contrasts with the poor fit of the Bern Model used by the IPCC: the Bern Model requires unjustifiable 5-year smoothing of the data to obtain agreement with the data. This need for this unjustifiable smoothing is not surprising because the Bern Mode assumes the CO2 sinks are overloaded when it is clear that they are not.
Richard

JimS
July 29, 2014 9:50 am

A regular person should figure out that humans probably contributed one more CO2 molecule per 10,000 atmospheric parts. That one CO2 molecule joined the other 3 that were already there, making four CO2 molecules per 10,000 atmospheric molecules. That is quite the accomplishment for little ole man. If he keeps adding more CO2 molecules like that, who knows what could happen?

Latitude
July 29, 2014 9:59 am

MikeB says:
July 29, 2014 at 4:56 am
It is easy to see that, without the human contribution, the natural CO2 sinks on the planet could cope with CO2 naturally produced but when human-made CO2 is included these sinks are overloaded and there is an excess of 11,700 tonnes of CO2 left in the atmosphere each year.
===
so the planet is static….and every time a volcano erupts and increases the CO2 concentration in the atmosphere…..it stays there
..and man emits a special kind of CO2 that accumulates
tonnes sounds like a whole lot….doesn’t it?

July 29, 2014 10:02 am

Mr. Watts,
First, I apologize for any embarrassment or misunderstanding my post may have caused. I wrote the post before Hockey Schtick took down their post.
It seems that I, and several commenters, did not appreciate or catch the distinction between annual emissions attribution and annual concentration increases.
The comments have been both interesting and helpful. They also show that there is still controversy about the “balance of Nature.”
Jonathan DuHamel

July 29, 2014 10:15 am

Greg
“Until he does make some proper account of his calculations public, it is incorrect there is no validity in comments of the form “Further he showed that … ” He didn’t. He did a video presentation, a lecture.”
I wish more people would get this point.
papers, videos, blog posts, comments are not science. they are advertisements for science.
the Science is the actual work done. the actual data and the actual code.
not a description of the data but the actual data used.
not a description of the math in words, but the actual math or code.

Nick Stokes
July 29, 2014 10:18 am

wryheat2 says: July 29, 2014 at 10:02 am
“I wrote the post before Hockey Schtick took down their post.”

The first comment at your blog was from the author, pointing out that Hockey Schtick had grossly misinterpreted the paper, and on being told of this, taken down the thread (with her comment).
It was five days later that you recommended the post for reproduction at WUWT.

July 29, 2014 10:24 am

claimsguy says:
July 29, 2014 at 9:40 am

Yes, the correlation is simplistiically obvious. But Leif Svalgaard taught me a valuable lesson when I grilled him about his insisting on using the term “correlation” and not causation after 400 years of scientists observing the effect of solar rays on the planet. I don’t recall the exact issue he was making, because his answer was far more important to me. His answer was, and I paraphrase, ‘because we don’t know the physics, and until we do, all we can say is that there is a correlation’.
How do you know that we “cannot readily absorb” additional CO2? Where are those measurements and how does that work in the infrared where all the absorption–all the global warming caused by CO2–apparently takes place. The absorption band for CO2 in the infrared is roughly 13µ to 18µ with radiative opacity at 15µ. That’s where CO2 acts like a greenhouse gas, unless I’ve been reading the science all wrong. The Kelvin temperatures for that range are from -58F to -170F. That’s got to be at the top of the troposphere, no? And since the CO2 molecule itself is 1.5 heavier than the air, it’s the winds that assure it’s well-mixed in the atmosphere.
So where is the physics and where are the papers that describe only naturally derived CO2 molecules make it to the top of the troposphere to perform the natural job of acting like a good greenhouse gas keeping us from freezing, while the evil additions by man lurk close to the earth’s surface where no radiative absorption of CO2 goes on and act like a pollutant and a poison according to the latest riffs from activists who know zip about radiative physics? I’ve been looking for those papers. And although I am not a scientist, I am one of those boring people who read the scientific papers referred to in articles, whether I can understand them or not, to break through my column of ignorance and educate myself.
Frankly, saying 400-280 = 120 PPM, therefore anthropogenic in as many years, is BS. It’s based on supposition. We understand about 3% of what the oceans are doing. The first infrared satellite went up in 1985. Our knowledge of plate tectonics is 50 years old; the uppy-downy of continents is barely understood. And our satellite temperature record is 35 years old. I’m ready to be convinced, but I need to see something solid.

July 29, 2014 10:25 am

Article says:
This new work supports an old table from the Energy Information Administration which shows the same thing: only about 3% of atmospheric carbon dioxide is attributable to human sources.
Look at the table and do the arithmetic: 23,100/793,100 = 0.029.

————————————————-
Table 3: Global and Anthropo Sources and Absorption of G-h Gases in the 1990s
………Gas ……………. Natural ….. Human Made … Total ….. Total …. Annual Increase
Carbon Dioxide Emissions Absorption
(Million Metric Tons) … 770,000 ……. 23,100 …..… 793,100 …. 781,400 …….. 11,700
Human made emissions of 23,100 MMTs and distribution of these emissions (atmospheric absorption 11,700 MMTs, ocean absorption 6,200 MMTs, and land absorption 5,100 MMTs)
—————————————
Given the above Table data, humans are responsible for an annual 11,700,000,000 metric ton increase in atmospheric CO2 during the 1990s.
But the Mona Loa record shows that atmospheric CO2 was 357.29 ppm in 1990 … and was 371.51 ppm in 2000 …. for a total increase of 14.22 ppm in the 1990s ….. or an average 1.422 ppm/year during the 1990s.
And if the average mass of the atmosphere is about 5 quadrillion (5,000,000,000,000,000) metric tons ….. and the atmospheric CO2 was at 357 ppm ….. there was approximately 1,785,000,000,000 (1.785 trillion) metric tons of CO2 in the atmosphere in 1990.
Thus, each one (1) ppm of CO2 is equal to 5,000,000,000 (5 billion) metric tons of CO2
And if there was an average 1.422 ppm/year increase in CO2 during the 1990s then that means there was an average yearly increase of 7,110,000,000 metric tons of CO2.
Which is only 7,110 Million Metric Tons of CO2 …. and which is 4,590 MMT (40%) less than what the above Table is claiming to be the Annual Increase was (11,700 MMT).
Does anyone know what happened to that average yearly loss of 4,590 Million Metric Tons of a decade’s worth of Anthropogenic CO2 emissions?
That’s roughly 45,900 Million Metric Tons of missing Anthropogenic CO2 emissions.

Bernard Lodge
July 29, 2014 10:50 am

Alan Robertson says:
July 29, 2014 at 9:10 am
Bernard Lodge says:
July 29, 2014 at 6:50 am
_______________________
Are you attributing the annual Northern Hemisphere change in CO2 concentration solely to temperature change? I didn’t see where you mentioned that the NH biosphere begins thriving in Spring and returns to dormancy each Autumn.
*********
The seasonal fluctuation of CO2 is a global phenomenon, though the degree of fluctuation does vary by location. My mention of ‘northern’ spring and fall was to avoid confusion with reversal of seasons in the southern hemisphere. To be clearer, the levels of CO2 at Mauna Loa drop 7 ppm in March/April every year then jump by 9 ppm in Sept/Oct each year. The cause of these changes in is believed to be growth in vegetation in the ‘warming’ hemisphere (northern summer) sucking up CO2 due to increased photosynthesis combined with the cooling southern hemisphere (southern winter) causing increased absorption of CO2 into the oceans – both affects happening at the same time. In Sept/Oct, the process reverses as vegetation growth slows down in the north while ocean temperatures rise in the south, both causing global CO2 levels to rise. Don’t forget that the northern hemisphere has most of the land and the southern hemisphere has most of the oceans so the effects don’t cancel out.
So the answer to your question is that yes, the CO2 is changing due to the temperature changing and not the other way around as the IPCC claim. Hence my really basic question .. can a dependent variable be an independent variable at the same time?
Clearly, CO2 levels are driven by seasonal temperature changes every year yet we are told that changes in CO2 cause changes in temperature! This is not a trick question, I really want to know what is the explanation of this?

July 29, 2014 11:13 am

PMHinSC says:
July 29, 2014 at 9:42 am
Even if these assumptions are correct cities such as Las Vagas [sic] with average July temps of 105 Deg F and annual rainfall of around 10″, use a disproportionate and unsustainable amount of water and energy.

When the Colorado River rights were carved up in 1924, California got approx 4 million acre ft per year, Arizona approx 2.2 million acre ft/yr, Utah a little less, and Nevada got 400,000 acre ft/yr because they thought no one would live there.
The entire state of Nevada makes do on 400,000 acre feet of water each year, 1/10th that of California.
So who are the water conservation experts In Nevada? The casino owners. Specifically Steve Wynn, who decided to solve it as soon as he got to town in the 80s. The Mirage and Treasure Island, built in the 80s, were double-plumbed to catch all the grey water (shower, bath, sink). Wynn built water-treatment plants in the basements so that he could use the water to irrigate his golf courses and fill his fountains.
Then he invented, or had someone invent, an absolutely revolutionary way to water the golf courses and lush gardens he wanted for his resorts. (That heat evaporates 60% of the water from over-the-ground sprinklers.)
Las Vegas soil is caliche and as hard as tooth enamel. It contributes to lethal flash floods when it rains because it’s like raining on marble. The soil is ‘hard’ and super alkaline. You can’t put a metal pipe into the ground without deposits forming, clogging them.
Wynn invented irrigation grids of PVC piping placed 20″ below the surface to draw the roots down, and run his grey water through them. The problem was the “+” attachment connecting each square in the grid pattern. They would clog, and he couldn’t dig up his golf courses to fix them. Whatever it was he invented to fix the problem gave him an instant patent. He runs the entire system with a computer monitoring system.
Wynn got the other casino owners to build their casinos his way, and as a result, all the Las Vegas casinos (except the old dives) are so efficient in their water and electrical use, they return 1/3 of their water to the Colorado River every year. They only use 3% of Southern Nevada’s total water usage, even with all their perfectly green golf courses and bright lights. Residential customers used 60% to 75% of the remainder, and industry the rest. So the Southern Nevada Water District went on a campaign to pay people to give up their lawns and embed 3 ft PVC pipes vertically beside each tree’s rootball. Watering whatever remained is on strict schedules monitored by water police. Southern Nevada now supplements their water supply by buying from counties in the middle of the state.
Las Vegas is about the most water and energy aware city in the country.

Mark
July 29, 2014 11:18 am

johnmarshall says:
This claim is totally a guess. Volcanogenic CO2 is more plentiful than anthropogenic CO2 and both are isotopically identical. How can you differentiate?????
IIRC when people have actually looked at isotope ratios of “fossil fuels” they have found that they can vary markedly depending on the source.
Also such fuels can oxidise without any human intervention.

Eric S.
July 29, 2014 11:20 am

Yes folks, the natural CO2 molecules from the table know they should devote themselves to absorption, so the man-made ones can stay in the atmosphere. (Do I need to put a sarcasm warning?) Because, you know, only the man-made component has changed. Sheesh.

Mike McMillan
July 29, 2014 11:29 am

I have a truncated copy of that chart that I copied from WUWT, dated July 19, 2009.

Alan Robertson
July 29, 2014 11:30 am

Man’s first miniscule contributions to atmospheric CO2 concentrations could probably be attributed to the Romans, who set about making cement by heating limestone.
Considering that for most of Earth’s history, atmospheric CO2 concentrations were much higher than they have been in the past 450K years, one could surmise that geologic processes do not ultimately keep up with C sequestration. It is possible that the level of CO2 available to the biosphere could fall to a point unable to sustain life as we know it, without man’s involvement.
Fabled virgin sacrifices to the volcano would have better served all of planetary life had their purpose been to exhort the volcano to erupt.

July 29, 2014 11:51 am

I had added several comments at the article on the HockeySchtick, which all disappeared together with the article. Not so nice that the article disappeared without any comment why. Thanks to Anthony that this blog is of a far better standard of fairness to show that mistakes can be made, but will be corrected if that is pointed to. Not the Skeptical Science way of rewriting history…

July 29, 2014 11:59 am

Wow, I’m quite surprised to see this post at WUWT 6 days after I temporarily put my post back in draft mode while I continue to correspond with the lead author before re-writing my post. This was disclosed in the tip to WUWT from Mr. DuHamel, the author of the Wry Heat post quoted here. Note the EPA document on emissions was added by Mr. DuHamel to his post and nowhere in the Hockey Stick post were emissions conflated with background levels of CO2 as many commenters above have incorrectly blamed upon the Hockey Stick post.
The correspondence with the lead author has been delayed waiting ~5 days for a reply from the author to questions, including about the following.
The Hockey Stick post quoted the conclusions of the paper which state “…the 6-month average CO2ff concentrations in the lower 1 km of the atmosphere across Western Europe are between 1 to 18 ppm” and earlier in the paper stated the mean of CO2ff across Western Europe was 15 ppm. The paper defines CO2ff as “CO2 mole fractions of particular origin, expressed in the index as follows:… ff – fossil fuels…”, thus CO2ff is defined as the mole fraction of CO2 in the lower atmosphere of fossil fuel origin.
I have asked the author if she instead meant to write in the 1st conclusion of the paper, “…the 6-month average CO2ff gradients in the lower 1 km of the atmosphere across Western Europe are between 1 to 18 ppm” and I am still waiting for a reply from her before re-writing the post.
There’s obviously a big difference between absolute concentrations/mole fractions and gradients, and thus could be quite misleading if the paper uses the two interchangeably.
I’ve also asked the author if she has a reply to this comment at Wry Heat before re-writing the post:
http://wryheat.wordpress.com/2014/07/19/only-about-3-of-co2-in-atmosphere-due-to-burning-fossil-fuels/comment-page-1/#comment-5149
As soon as I receive her replies, I will re-write the post incorporating her replies.
Thanks to several other commenters above including richardscourtney, johnmarshall, philjourdan, steve short, fhhaynie, Bernard Lodge, Jeremy Shier, and others demonstrating that the EPA & IPCC assumptions that all of the rise in CO2 levels is anthropogenic is based upon little to no evidence and there are many unanswered questions.
As to the claim that Salby has never written about his work in this area is false. It appears in his textbook, Physics of the Atmosphere and Climate:
http://hockeyschtick.blogspot.com/2013/05/climate-textbook-explains-why-man-made_21.html
In addition, I ask all the “know it alls” here to explain why the airborne fraction of man-made CO2 has declined 20% over the past 60 years, according to none other than James Hansen:
http://hockeyschtick.blogspot.com/2013/03/hansens-mea-culpa-says-man-made-global.html
A decreasing airborne fraction of man-made CO2 over the past 60 years as man-made emissions increased by 4 times is inconsistent with man-made CO2 as the primary source of the increase atmospheric CO2.

Alan Robertson
July 29, 2014 12:09 pm

policycritic says:
July 29, 2014 at 11:13 am
__________________
Fascinating read, thanks.

July 29, 2014 12:19 pm

Bernard Lodge says:
July 29, 2014 at 6:50 am
Could someone among the many informed WUWT readers please explain how a dependent variable can also be an independent variable?
Not so difficult: it is not because one is the major driving force for the other, that the second one can’t have an influence on the first. The point is that both influences should be moderate: the combined reinforcing factors must be below unity to prevent a runaway process.
In the case of temperature and CO2, the influence of temperature on CO2 is 8 ppmv/°C as can be seen in ice cores over the past 800,000 years (Vostok, Dome C) and the MWP – LIA cooling (Law Dome DSS ice core).
The opposite influence should be – according to line by line absorption tests – about 0.9°C for 2xCO2, without taking into account any (positive or negative) feedbacks.
Both are modest influences, so it is possible that they influence each other without a runaway effect. Here a plot which shows the difference between a one-sided influence of temperature on CO2 with and without feedback from CO2 on temperature:
http://www.ferdinand-engelbeen.be/klimaat/klim_img/feedback.jpg
The only difference is that both temperature and CO2 end somewhat higher than without influence of CO2…

sinewave
July 29, 2014 12:26 pm

Regarding taking down this post: if you removed this post all the comments would go away. Posts on Wattsupwiththat are only half the story, the comments, even for a mistaken post like this one, are more informative than the main content on almost all other climate / weather sites out there…..

July 29, 2014 12:43 pm

“Regarding taking down this post: if you removed this post all the comments would go away.”
Not so, I’ve saved all the comments and will repost them as well, although none of them relate to the issues the lead author initially brought up and the possibly incorrect statement in the paper’s conclusion “…the 6-month average CO2ff concentrations in the lower 1 km of the atmosphere across Western Europe are between 1 to 18 ppm,” which it appears should have said “gradients” not “concentrations”.
I have been corresponding with the author via email, received a partial reply after waiting 5 days, and now am still waiting for clarification of the statement above in the conclusion prior to re-writing the post.
If the author wrote “concentrations” when she meant “gradients” and everyone wants to point fingers at the Hockey Stick for reading “concentrations” and then putting the post in draft mode until this issue is clarified by the lead author, then so be it.

July 29, 2014 12:54 pm

Hockey Schtick says:
July 29, 2014 at 11:59 am
MS, OK it is your blog, but why didn’t you put some message at the place of the article, so that people who take the time to respond know that it is under revision? Now it gives the impression that it disappeared because one doesn’t like the critiques…
But again, your interpretation of the article is completely wrong, no matter if the article is based on “human” CO2 concentrations or “human” CO2 fluxes.
Take a fountain which has a water filled pool at its base with a (clogged) overflow drain. A pump delivers 1000 l/minute over the fountain which drops back into the pool.
One day somebody opens the supply valve in the pump discharge which adds 1 l/minute of extra water to the full cycle and promptly forgets about it.
What happens with the level in the pool? Even if it is only 0.1% of the total supply, the level in the pool will increase and the overflow drain will remove some of the extra input. But because it is clogged, it only removes water in ratio to the extra height (=pressure) above the overflow hole. Which isn’t enough to remove all extra water. Even if the extra input is only 0.1% of the main flux.
Humans currently emit some 9 GtC/year as CO2. Nature emits some 150 GtC, but absorbs some 154,5 GtC/year. Thus nature is a net sink for CO2 over every year of the past 55 years (and probably longer):
http://www.ferdinand-engelbeen.be/klimaat/klim_img/dco2_em2.jpg
That the human emissions are hardly measurable in the huge seasonal and permanent emissions and absorptions is completely irrelevant. What is relevant is that nature is a net sink for CO2, but can’t cope with all the extra CO2 in the atmosphere: only 4.5 GtC/year (2 ppmv/year) is removed while the extra CO2 pressure is from 120 ppmv (250 GtC) above the temperature dictated equilibrium. Thus the drain is clogged…
The “airborne fraction” (that is the remainder of human emissions in mass, not original molecules) too is completely irrelevant: even if it dropped to 1% of the emissions, it still is mainly human, as that is the main source of the increase.
Temperature is good for maximum 8 ppmv since the LIA warmed to the current temperature (the MWP-LIA drop was only 6 ppmv CO2).

Nick Stokes
July 29, 2014 1:04 pm

Hockey Schtick says: July 29, 2014 at 11:59 am
“Wow, I’m quite surprised to see this post at WUWT 6 days after I temporarily put my post back in draft mode while I continue to correspond with the lead author before re-writing my post. This was disclosed in the tip to WUWT from Mr. DuHamel, the author of the Wry Heat post quoted here.”

What he disclosed was:
” She apparently scared The Hockey Schtick into taking down his post on the matter.”
” CO2ff is defined as the mole fraction of CO2 in the lower atmosphere of fossil fuel origin”
No, it’s made very clear in her Eq 1:
CO2obs = CO2bg +CO2ff +CO2p +CO2r
+CO2o +CO2s
CO2bg is the background CO2 outside the limited area of the study, measured in her case at the top of Jungfraujoch in the Alps. The other terms, including CO2ff, are the perturbations in her particular location in a plume of recently emitted CO2.
But there’s no future in arguing with the author of the study here. You’ve invoked her as the authority for your claim. She says you have grossly misinterpreted. Even if you can proved that she has worded something incorrectly or whatever, you’re never going to be able to claim her authority for the statement.

richardscourtney
July 29, 2014 1:07 pm

Ferdinand Engelbeen:
Ferdinand, thanks for your post at July 29, 2014 at 12:54 pm.
Early in this thread I suggested to Nick Stokes that he await your explanation of the ‘mass balance argument’. And I was starting to worry that my prediction of your input was mistaken, but it has now been posted. Thankyou.
Richard

Jake J
July 29, 2014 1:08 pm

Mr. Watts, I am impressed by the forthright manner in which you dealt with your error.

July 29, 2014 1:09 pm

PhilCP says:
July 29, 2014 at 8:29 am
Sorry, hadn’t read your comment before replying to HS, the same kind of example, nice read and to the point…

July 29, 2014 1:33 pm

“But there’s no future in arguing with the author of the study here. You’ve invoked her as the authority for your claim. She says you have grossly misinterpreted. Even if you can proved that she has worded something incorrectly or whatever, you’re never going to be able to claim her authority for the statement.”
You once again assume things that are simply not true. I am not arguing with the author at all and in fact wrote to her an apology for misunderstanding her paper, that I was temporarily taking down the post for a re-write pending her reply, and would she kindly answer a few questions to clarify prior to that re-write.
Although I still haven’t received a reply on the issue regarding her statement in the conclusion, it appears there is a significant erroneous statement in the first conclusion which conflates “concentrations” with “gradients”. If you want to blame me for quoting her conclusion in my post including this apparently incorrect conclusion in the paper, and for assuming she meant what she wrote, then so be it.
Apparently, you have an issue with a blogger reading an incorrect statement in the major conclusion of a paper, assuming it was true, but after correspondence with the author realizing she apparently made a significant incorrect statement in the conclusion, and then asking the author if this needs to be corrected. If you want to blame me for the apparent error written in the conclusion, then so be it.

Leon
July 29, 2014 1:35 pm

Anthony & Co,
Don’t be so hasty in dishing out the mea culpa.
My post on WryHeat commenting on Denica Bozhinova’s posts reprinted here:
Am I the only one who caught this? Dr. Bozhinova gave the pipe analogy:
“Now you add a much smaller pipe for the inflow from anthropogenic emissions. This pipe does not have outflow to balance it, so it’s net contribution is in fact the entire inflow of it to the pool. And the net contribution of this pipe is in fact bigger than the net contribution of the other huge pipes and is growing.”
I understand that to mean that it is, in fact, a very small percentage of total CO2 but the argument is that it cannot be absorbed and has a greater effect relative to its actual volume.
1) This acknowledges that the ratio of man-made to natural CO2 is low.
2) The argument is highly problematic. The “outflow” mechanisms are not well understood and the planet has a long history of large variability in CO2 fluxes. Furthermore, there is an awful lot of “estimating” going on with CO2 fluxes and everything else in climate change research. “Estimating” is also known as guessing and assuming.

Leon
July 29, 2014 1:40 pm

To further clarify the point, the study assumes that CO2 will just keep “backing up” like water going down a drain with too much hair in it. I haven’t read the study but it sounds like there’s some assumin’ goin’ on when there needs to be some provin’ goin’ on. That’s also known as begging the question.

Alan Robertson
July 29, 2014 1:43 pm

Jake J says:
July 29, 2014 at 1:08 pm
Mr. W–ts, I am impressed by the forthright manner in which you dealt with your error.
__________________
With past as prologue, there was never any doubt about the fate of this thread.
————-
richardscourtney says:
July 29, 2014 at 9:43 am
________________
Good job.

bw
July 29, 2014 1:44 pm

GeeJam, philcp, courtney, fhhaynie and hockeyschtick are correct. The EPA numbers are good enough estimates to show that human CO2 is about 3 or 4 percent of natural fluxes.
Atmospheric CO2 never “accumulates” because the enormous surface sources and sinks are constantly exchanging 30 to 40 times the anthropogenic CO2 fluxes.
Anthropogenic CO2 can never exceed the 3 to 4 percent now in the atmospheric 400 ppm, until the human flux exceeds 4 percent of the natural fluxes.
Read the fhhaynie post again. He is correct.
Also Tom V. Segalstad at http://www.co2web.info/ who knows something about CO2 isotope ratios. Also Salby, who knows something about the global biogeochemical carbon cycle.
The overwhelming amount of scientific understanding says that human contribution to the global carbon cycle has been around the 3 or 4 percent level for the last few decades.
In 1900, the human proportion of CO2 added to the atmosphere was much less. Maybe 1 percent. So the 300 ppm atmospheric CO2 was 297 ppm natural and 3 ppm anthropogenic.
in 1950 the human proportion of CO2 had risen to 2 percent. Therefore the atmospheric CO2 level of 315 ppm was about 300 ppm natural and 6 ppm anthropogenic.
In 1980 the human porportion of CO2 reached 3 percent of the natural flux. Therefore the atmospheric CO2 level of 340 ppm was 330ppm natural and 10 ppm anthropogenic.
Atmospheric CO2 is a flowing river, from sources to sinks.
The 14C bomb CO2 shows that the longer time period natural loss is 50 percent every 10 years.
50 percent of the atmospheric CO2 from 1980 was lost by 1990. By 2000 the amount of CO2 remaining in the atmosphere since 1980 was 25 percent. As of today, no more than 10 percent of the 1980 CO2 level in the atmosphere remains in the atmosphere. Thats 34 ppm of the total 1980 CO2, so the remaining 306 ppm from 1980 are “forever” gone into slower sinks.
Some CO2 does recycle, about 80 percent annually. So the amount of anthropogenic CO2 in the atmosphere today is more than 4 percent of the 400ppm at 16ppm, but certainly less than the 120 claimed by the IPCC and englebeen.

Nick Stokes
July 29, 2014 1:48 pm

Hockey Schtick says: July 29, 2014 at 1:33 pm
“Although I still haven’t received a reply on the issue regarding her statement in the conclusion, it appears there is a significant erroneous statement in the first conclusion which conflates “concentrations” with “gradients”.”

Mark Morano is still displaying a copy of your post here. It says:
“A paper published today in Atmospheric Chemistry and Physics finds that only about 3.75% [15 ppm] of the CO2 in the lower atmosphere is man-made from the burning of fossil fuels, and thus, the vast remainder of the 400 ppm atmospheric CO2 is from land-use changes and natural sources such as ocean outgassing and plant respiration.
According to the authors,
‘We find that the average gradients of fossil fuel CO2 in the lower 1200 meters of the atmosphere are close to 15 ppm at a 12 km × 12 km horizontal resolution.’
The findings are in stark contrast to alarmist claims that essentially all of the alleged 130 ppm increase in CO2 since pre-industrial times is of man-made origin from the burning of fossil fuels, finding instead that only 15 ppm or ~11.5% of the increase is of fossil fuel origin.”

That statement from the abstract, on which your headline is based, clearly specifies gradients.

July 29, 2014 1:53 pm

Jeremy Shiers says:
July 29, 2014 at 9:23 am
Have a play and tell us what you find
I have played with the data too, but added the δ13C derivative data to the derivatives of temperature and CO2:
http://www.ferdinand-engelbeen.be/klimaat/klim_img/temp_dco2_d13C_mlo.jpg
If the source of the CO2 variation is by the oceans, the δ13C will go slightly up with CO2 increase, as the oceans have a higher δ13C level than the atmosphere. If it is from vegetation decay, then δ13C will go strongly down with increasing CO2 and up with falling CO2, which is the case here.
Thus the response of (tropical) vegetation on temperature variations is at work here. But vegetation is NOT the cause of the increasing trend of CO2 over the full period, as vegetation is an increasing net sink:
http://www.bowdoin.edu/~mbattle/papers_posters_and_talks/BenderGBC2005.pdf
The temperature derivative shows the same variability, but precedes the CO2/δ13C variability with pi/2, which is the result of taking the derivatives (where CO2 changes follow T changes with pi/2). Important is that there is zero trend in the temperature derivative, thus that is not the cause of the dCO2/dt slope either. But if we look at the slope of the human emissions rate of change, that slope is double that of the slope of the increase rate of CO2, simply because human emissions and increase in the atmosphere both increase slightly quadratic over time, giving a linear slope in the derivatives:
http://www.ferdinand-engelbeen.be/klimaat/klim_img/temp_co2_acc_1900_2011.jpg
In conclusion: the match of the variability of (d)temperature and dCO2 is real, but the match of the slopes has nothing to do with temperature…

July 29, 2014 2:08 pm

“That statement from the abstract, on which your headline is based, clearly specifies gradients.”
And the major conclusion of the paper [all of which was also quoted and highlighted in my post] specifies “concentrations” instead of what apparently should have read “gradients”, so woe unto me for assuming the author meant what she wrote as the main conclusion of her paper.
Why are you directing vitriol at me for realizing after clarification from the author that she apparently didn’t mean what she wrote as the major conclusion of her paper, an apparently incorrect and misleading statement conflating “concentrations” with “gradients”, and after I realized that, writing to her to ask if she wants to make a correction?

July 29, 2014 2:16 pm

bw says:
July 29, 2014 at 1:44 pm
bw, it seems one of the most difficult points to explain to people, although most housewives (and -men) know the difference from their household budget…
What the article is about is some small addition in a large cash flow of money in and out of a factory (in the form of raw materials till finished products). Interesting, but largely irrelevant for the gain (or loss) of a business.
If you invest 10,000 euro/year in stock from a factory and the net gain of that factory at the end of each year is 5,000 euro, better sell as fast as possible and look for other opportunities, no matter if your investment is 0.1% or 10% of the capital turnover in that factory.
Turnover and gain (or loss) are quite independent items with little – if any – connection with each other.
BTW, the loss of 14C from the atomic bomb tests in the 1950’s is accelerated by the deep ocean exchanges of ~40 GtC, which release 14C depleted pre-bomb test CO2 of ~1000 years ago. That gives a decay rate of ~14 years. The real decay rate for an extra shot CO2 in the atmosphere is over 50 years:
http://www.john-daly.com/carbon.htm
Calculation from Peter Dietze already near 2 decades ago. Recent calculations give a slightly shorter decay rate.

July 29, 2014 2:23 pm

So human emissions are purported to have added around 50% more CO2 to the atmosphere? Is that roughly in the ball park?
Then can someone explain what would happen if ≈50% of the Atmospheric CO2 was removed? Would the biosphere be better off?
You can see where this is going: the addition of human CO2 has been a net benefit, with no identifiable downside. Certainly the incessant predictions of climate catastrophe have failed.
The alarmist clique began with a wrong premise: that a rise in CO2 would cause runaway global warming. That has not happened. If they had started with the correct premise; that the rise in CO2 was caused by global warming, then they would have come to the correct conclusion.
They got causation wrong, so naturally their conclusion is wrong. The problem is getting them back on the right track. Easier said than done.
Instead, their explanations become more and more fantastic.

July 29, 2014 2:24 pm

Hockey Schtick says:
July 29, 2014 at 2:08 pm
HS, in this case concentrations at ground level are gradients compared to “background” levels.
That is the way total CO2 fluxes are calculated with tall towers, where CO2 is measured at different heights:
http://www.ferdinand-engelbeen.be/klimaat/klim_img/cabauw_day_week.jpg

July 29, 2014 2:32 pm

dbstealey says:
July 29, 2014 at 2:23 pm
It is a very good argument to show that there is no warming for over 1.5 decades despite record levels of CO2, But it is not a good argument to reverse that: a zero temperature increase doesn’t cause record levels of CO2…

July 29, 2014 2:43 pm

Ferdinand, your plot shows absolute concentrations at different heights and doesn’t compute or graph the “gradients” between them. Regardless, the paper under discussion is about “gradients” at the same height, not different heights, but between different surface locations, and using the term “concentrations” when you meant “gradients” is misleading/incorrect.

July 29, 2014 2:44 pm

richardscourtney says:
July 29, 2014 at 2:48 am
For example, a minute change to ocean surface layer pH of 0.1 would alter the equilibrium of CO2 between air and ocean to induce more change to atmospheric CO2 concentration than has been observed. Such a pH change could not be induced by alterations to CO2 concentrations and fluxes because of the carbonate buffer. But it could be a result of change to the sulphur injected into the thermohaline circulation by submarine volcanoes long ago. When the dissolved sulphur reached the ocean surface layer it would change the ocean surface layer pH with resulting change to atmospheric CO2 concentration. And such a global 0.1 pH change is far too small for the limited available data to indicate it.

The usual courtney nonsense. A change in pH of 0.1 is a change in the H+ ion concentration of ~26%, hardly ‘minute’. You also completely misunderstand the ‘carbonate buffer’, try reading the Royal Society article on the subject, for example:
http://coralreef.noaa.gov/aboutcrcp/strategy/reprioritization/wgroups/resources/climate/resources/oa_royalsociety.pdf
Your hypothesis about sulphate is unsupported by the data, sulphate is conserved in seawater at ~8%.

July 29, 2014 3:10 pm

Hi Ferdinand,
Thanks for the response. However, you did not answer my question: what would happen to the biosphere if the accumulated CO2 was taken out of the atmosphere? That is what would happen under some of the more extreme CO2 reduction/mitigation scenarios.

July 29, 2014 3:15 pm

Ferdinand,
As Bart and others have explained to you on many threads, your mass balance argument is a single equation with two unknowns, thus proves nothing. In addition, since T leads CO2 on short, intermediate, and long-term timescales, the cause does not follow the effect
http://wattsupwiththat.com/2013/07/08/professor-critical-of-agw-theory-being-disenfranchised-exiled-from-academia-in-australia/#comment-1359504

sinewave
July 29, 2014 3:20 pm

Hockey Schtick says
“‘Regarding taking down this post: if you removed this post all the comments would go away.’
Not so, I’ve saved all the comments and will repost them as well, although none of them relate to the issues…”
Just for clarification, my real point was that the comments on posts on WUWT are enjoyable and informative. The last three hours worth of comments are a perfect example of that. I wasn’t trying to imply that anything would be disappeared or that anything shady was about to happen. I’m just a random reader of this blog who enjoys it 🙂

Latitude
July 29, 2014 3:39 pm

Hockey Schtick says:
July 29, 2014 at 11:59 am
In addition, I ask all the “know it alls” here to explain why the airborne fraction of man-made CO2 has declined 20% over the past 60 years, according to none other than James Hansen:
http://hockeyschtick.blogspot.com/2013/03/hansens-mea-culpa-says-man-made-global.html
A decreasing airborne fraction of man-made CO2 over the past 60 years as man-made emissions increased by 4 times is inconsistent with man-made CO2 as the primary source of the increase atmospheric CO2.
======
ditto……….

July 29, 2014 4:05 pm

Hockey Schtick says:
July 29, 2014 at 3:15 pm
As Bart and others have explained to you on many threads, your mass balance argument is a single equation with two unknowns, thus proves nothing. In addition, since T leads CO2 on short, intermediate, and long-term timescales, the cause does not follow the effect
HS, as explained in the above examples, the two unknowns don’t play any role at all. It is only the difference at the end of the cycle which matters. It doesn’t matter how much water circulates over a fountain, the pool will overflow if you add only 1% or 0.1% of the circulating flow. Neither does it matter that a factory doubles its throughput: that may give more gain, less gain or even a loss.
The same for the mass balance: it doesn’t matter that one year the natural cycle was 150 GtC in and 154 GtC out and the next year 300 GtC in and 302 GtC out. In all past 55 years there was more natural out than in…
Further, Bart’s arguments were based on the fact that there was a (not so) good agreement between temperature and the CO2 rate of change. That agreement is in the variability, not in the slope, as that are the results of different processes. One can match any linear slope with any other linear slope, that is only a matter of choosing the right factor but has nothing to do with cause and effect.
The only point where Bart could be right is if the natural carbon cycle increased a 3-fold together with the human emissions: then and only then the natural cycle could dwarf the human emissions. But there isn’t the slightest sign that the natural carbon cycle even increased over the past 55 years: the residence time didn’t decrease a 3-fold, instead it slightly increased. There is no sign that the seasonal vegetation cycle increased a 3-fold or that the oceans released and absorbed 3 times more CO2…
Further T leads CO2 on seasonal and (opposite!) on year by year variations. CO2 follows temperature on decades to multi-millennia, but over the past 160 years CO2 is growing much faster than the temperature dictates (8 ppmv/°C) over the past 800,000 years:
http://www.ferdinand-engelbeen.be/klimaat/klim_img/antarctic_cores_001kyr.jpg
The MWP-LIA transition is visible as a ~6 ppmv drop in the Law Dome DSS ice core:
http://www.ferdinand-engelbeen.be/klimaat/klim_img/law_dome_1000yr.jpg
The same for the (reverse) HS in δ13C:
http://www.ferdinand-engelbeen.be/klimaat/klim_img/sponges.jpg
But nature should be the cause of the CO2 increase after 800,000 years simply following temperature with exact the same timing as humans started to emit twice the amounts of CO2 as found as increase in the atmosphere?

DesertYote
July 29, 2014 4:09 pm

Johan says:
July 29, 2014 at 3:59 am
Oh brother, yet another thread wasted on trying to explain the obvious.
Here is a 5-year old paraphrase from David J. C. MacKay, professor of natural philosophy in the Department of Physics at the University of Cambridge,
###
MacKay is a well know liar. What he claims here is ridiculous. Mans contributions to the carbon cycle are little more then a rounding error and are well within natural variability. If what liar MacKay stated was true, he would not exist to state it, and you would not be around to regurgitate it.

July 29, 2014 4:12 pm

Phil. says:
July 29, 2014 at 2:44 pm
In addition, as I explained to Richard, if you add some acid to the oceans, the total amount of carbon forms (DIC: CO2 + bi + carbonates) would decrease because of the loss of CO2, while we see an increase of DIC with decreasing pH.
That proves that CO2 is pressed into the oceans, not the other way out…
Simply add some vinegar to a solution of (baking) soda and weigh both containers before and after the mixing…

July 29, 2014 4:33 pm

Hockey Schtick says:
July 29, 2014 at 11:59 am
In addition, I ask all the “know it alls” here to explain why the airborne fraction of man-made CO2 has declined 20% over the past 60 years, according to none other than James Hansen:
As said before, the “airborne fraction” is completely irrelevant for the cause of the increase. As long as there is an airborne fraction, humans are responsible, no matter if 99% or 1% of human emissions (as mass) remain in the atmosphere. If it was 101%, then nature contributed 1%. If it was -1%, then nature was a larger sink than humans emitted.
But the fraction remained remarkably constant over time:
http://www.ferdinand-engelbeen.be/klimaat/klim_img/acc_co2_1900_cur.jpg
over the past 51 years:
http://www.ferdinand-engelbeen.be/klimaat/klim_img/acc_co2_1960_cur.jpg
for Mauna Loa and the South Pole
Main cause of being that constant: a slightly quadratic increase of yearly emissions which leads to a slightly quadratic increase of CO2 in the atmosphere and a slightly quadratic increase of sink capacity for a remarkable linear CO2 equilibrium process (as proven over 800 kyear).
The removal of the extra CO2 out of the atmosphere is a matter of extra CO2 pressure which changes the uptake/release of the oceans and the uptake by plants. If taken into account the uptake/release of CO2 as function of temperature and atmospheric CO2 pressure, the airborne fraction still is largely within the natural variability:
http://www.ferdinand-engelbeen.be/klimaat/klim_img/dco2_em4.jpg

July 29, 2014 4:38 pm

Ferdinand says “The only point where Bart could be right is if the natural carbon cycle increased a 3-fold together with the human emissions: then and only then the natural cycle could dwarf the human emissions.”
Natural sources and sinks are ~96% of the carbon cycle. Natural sinks would only have to expand by ~4% to accommodate all man-made CO2. Multiple papers show from satellite measurements that the Earth has “greened” 11-20% over the past couple decades, thus the natural sinks could have expanded ~11-19%, considerably more than the 4% man-made sources. No 300% increase in the carbon cycle required as you claim.
Single graph shows T controls CO2 on short timescales:
http://hockeyschtick.blogspot.com/2013/01/single-graph-demonstrates-man-made-co2.html

DesertYote
July 29, 2014 4:41 pm

Someone here needs to learn how to do some simple differential equations. If they did then they would stop getting on there hobby horse every time this discussion comes up!
From -20 to +40 C, the CO2 produced by eukaryote metabolism is directly related to temperature. Don’t ask me to quote a bogus study. Referencing studies is NOT science. Do the experiment for yourself. It easy grade school stuff. Use yeast.

July 29, 2014 5:06 pm

Hockey Schtick says:
July 29, 2014 at 4:38 pm
Natural sinks would only have to expand by ~4% to accommodate all man-made CO2.
Completely right, but they didn’t do that over the past 55 years:
http://www.ferdinand-engelbeen.be/klimaat/klim_img/dco2_em2.jpg
thus the natural sinks could have expanded ~11-19%, considerably more than the 4% man-made sources.
The greening of the planet is a fact, but that is only for ~1 GtC/year of the 9 GtC/year human emissions. That is the net result of the increased cycle. Again, the height of the natural cycle is not of interest, the net source/sink result after a full cycle is what is of interest:
http://www.sciencemag.org/content/287/5462/2467.short
and
http://www.bowdoin.edu/~mbattle/papers_posters_and_talks/BenderGBC2005.pdf
The 300% is only of mathematical interest: human emissions increased a threefold over the past 50 years or so. As plants and oceans don’t make any differentiation between human and natural CO2 (except a slight one in isotopes), if not humans are responsible for the increase of CO2 in the atmosphere, then the natural CO2 cycle should have increased a threefold too, to build enough resistance in the (then theoretically very fast accommodating) sinks so that they can’t remove the extra CO2 flux in short term, but still remove near all of human emissions.
But there is not the slightest indication that that happened: not in the residence time, not in the 14C/12C ratio, not in the 13C/12C ratio, not in the oxygen changes,…

July 29, 2014 5:22 pm

Wu said ”
Excuse my ignorance but I thought plants INHALE CO2 and exhale Oxygen. Was my science teacher wrong? He was a tad old to be frank.”

Plants, chlorophyll pigmented plants, absorb CO2 and when chloropyll are irradiated by light, the chemical reactions produce carbohydrates that the plants use for food and structure and expire oxygen. Plant cells like any other living aerobic cells consume the food, and using oxygen produce the energy to live with and expire CO2. Durring the day the expiration of O2 exceeeds the CO2 from metabolism, at night there is no O2 released from photosynthesis so the CO2 becomes noticable.
This is why fishkeepers worry about their prize Koi on hot July and August nights, the algea in the warm water has a high metabolism and can use up enough oxygen in the water to sufficate the fish.

July 29, 2014 5:26 pm

DesertYote says:
July 29, 2014 at 4:41 pm
From -20 to +40 C, the CO2 produced by eukaryote metabolism is directly related to temperature. Don’t ask me to quote a bogus study. Referencing studies is NOT science. Do the experiment for yourself. It easy grade school stuff. Use yeast.
Sometimes simple sums and subtractions are of more importance than fancy linear equations…
The eukaryotes only produce CO2 that was first captured out of the atmosphere by plants in the form of sugars and other stuff. Thus that is part of the natural cycle and doesn’t add any extra CO2 to the atmosphere, as long as plants capture more CO2 out of the atmosphere than the rest of the biosphere can eat/break down/oxidize again.
Which is the case, based on the net oxygen production by the biosphere.
Thus again, that humans emit only 4% of the natural emissions is of no interest at all, as nature captures 102% of the natural emissions back each year… Which means that the net natural contribution to the atmospheric increase is zero, nada, nul,…

July 29, 2014 6:05 pm

Ferdinand,
Your graph has no data cited to back up your assertion of a declining “sink rate”
Many of your graphs are based upon flimsy assumptions about mass balances, including the 2000 paper from Science you cite which also uses the mass balance argument.
“The greening of the planet is a fact, but that is only for ~1 GtC/year of the 9 GtC/year human emissions.” Where is the data to back up this assertion, and what assumptions are made?
Call me skeptical that a 11-20% greening of the planet over the past couple decades found by satellite observations would only translate according to you to a 4/9 or 0.4% increase in natural sinks.
Of course the carbon cycle hasn’t increased 300%. Natural sinks would have only had to increase a mere 4% to accommodate all man-made CO2, and the error bars on natural sources and sinks are large, as well as on land-use changes.

EricS
July 29, 2014 6:06 pm

Ferdinand said, “As long as there is an airborne fraction, humans are responsible…”
So, *nothing* else is changing in the carbon balance: no volcanoes erupting, no algae blooms blooming, etc.? Gaia is running a controlled experiment I guess? Including any sources/sinks that we have yet to characterize?
Do we even know if we’re in a regime where the D.E.s can be treated as approximately linear?
The problem is far more subtle than the crude lumped averages in the table can possibly illuminate. The conclusion that humans are *solely* responsible for the airborne fraction is unwarranted.

July 29, 2014 6:13 pm

Ferdinand,
Your declining “sink rate” makes the convenient assumption that 100% of the CO2 increase is man-made, that none of the increase is a secondary effect of temperature, ocean outgassing, etc., thus it is a circular argument that proves nothing.

July 29, 2014 10:28 pm

At the end of the day it makes little whether the incremental 120 ppm in the atmosphere is human or not.
Ferdinand is the master of this and he is probably right. However there is a significant wild card in the form of plankton. Our measurements in the ocean are simply pathetic. We have considerable geological evidence that some force has created Carbon isotopic excursions that dwarf human efforts. In deep time there are few alternatives to the oceans if we wish to presume the force is earthly.
Human CO2 is currently about 5% of the Carbon cycle. With any discount for photosynthetic increase, Beer’s saturation, H2O dominance in the incoming greenhouse spectrum, H2O being half the molecular weight of CO2 and therefore representing twice the number of molecules per given weight; to translate from 3 odd percent of concentration to three odd percent of warming is not reasonable. It is way too high.

JJ
July 29, 2014 10:47 pm

Dr. Bozhinova gave the pipe analogy:
“Now you add a much smaller pipe for the inflow from anthropogenic emissions. This pipe does not have outflow to balance it, so it’s net contribution is in fact the entire inflow of it to the pool. And the net contribution of this pipe is in fact bigger than the net contribution of the other huge pipes and is growing.”

That is not what is happening here on earth. Thus far, the net increase of the flow into the pool is NOT equal to the entire flow from the “anthropogenic emissions pipe”. Persistently and inexplicably, the net increase is but half of the supposed flow from that “pipe”. So there must be an outflow pipe, or pipes, that we don’t know about. All we know about them is that they are at least as large as half what we think the anthro pipe is flowing, and growing right along with it. In fact, they could be much larger than half the anthro pipe, perhaps several times that size. They might thus be concealing from the AGW faithful the existence of other, larger inflow pipes. We have no clue. The earths carbon budget is not balanced.

DesertYote
July 29, 2014 11:25 pm

Ferdinand Engelbeen says:
July 29, 2014 at 5:26 pm
DesertYote says:
July 29, 2014 at 4:41 pm
###
Your attempt to model the carbon cycle using naive linear equations is a big fail. The rate at which CO2 is “sequestered” is directly related to the concentration of CO2. The rate at which CO2 is released is directly related to temperature. You can not model a system like this without differential equations. The overestimated rate of anthropogenic CO2 production is well within the measurement uncertainty of vastly underestimated rate of “natural” CO2, and much smaller then the natural variability. What we have here is a naturally stabilizing system with a great deal of negative feed back that totally swamps out mans insignificant contributions. The history of the Earth demonstrates this quite well, else life would have been destroyed when the Deccan Traps were created. Get real. Do some real math for a change. What are planning on doing next, try modeling the solar system using epicycles?
Your “We don’t need no steenking diff eq” stance just makes you look foolish to those of us with real systems engineering experience.

richardscourtney
July 30, 2014 12:01 am

Phil:
I write as a courtesy to say that I have read – and laughed at – your post at July 29, 2014 at 2:44 pm. As is typical of your comments, it is good on untrue abuse from behind the coward’s shield of anonymity, but it is poor on factual content.
I will discuss any flaw in my comments from rational humans and – as always – express gratitude when I am shown to be wrong. But only my disdain is obtained for untrue and irrational twaddle from anonymous internet trolls such as you.
Richard

Bart
July 30, 2014 12:07 am

Ferdinand Engelbeen says:
July 29, 2014 at 5:26 pm
“Thus again, that humans emit only 4% of the natural emissions is of no interest at all, as nature captures 102% of the natural emissions back each year…”
Once again, a complete detachment from the way feedback systems work.
JJ says:
July 29, 2014 at 10:47 pm
“In fact, they could be much larger than half the anthro pipe, perhaps several times that size.”
Bingo! In fact, if one takes it as given that it could be anywhere from half to many multiples, the overwhelmingly greater share of possibilities obviously tends toward the latter.
DesertYote says:
July 29, 2014 at 11:25 pm
Yes. It is a fundamental misconception to try to model this dynamic system as though it were a problem in basic accounting.
It is, again, a detachment from the way feedback systems work. The inflow and outflow are not static, unchanging quantities. The outflow expands in reaction to the inflow.
This static point of view is one of a magical world, in which an equilibrium between natural inflow and outflow simply happened, and stayed that way just because one side wanted to play nice with the other.
That is not how an equilibrium is established in nature in this universe. If there is no push-back from either side, then random fluctuations create a drift, like Brownian motion of a particle suspended in a fluid. Scientifically speaking, the notion that there was a rock solid equilibrium in existence for millennia when there were no opposing forces keeping it there is farcical.
Given the powerful opposing forces necessary to produce such a tight equilibrium, it must be presumed that nature can shrug off our puny inputs with hardly any notice. It is very obvious that nature is in control of the atmospheric CO2 balance on this planet. It never ceases to amaze me how people will rationalize away something which is right before their noses like this. Someday, people will look back on this silly idea that humans control the planet’s CO2 like we now do at leechcraft, phlogiston, or phrenology.

richardscourtney
July 30, 2014 12:17 am

Ferdinand Engelbeen:
At July 29, 2014 at 2:48 am I wrote here saying

There are many possible ways it could be “sustained” because almost all the CO2 circulating in the carbon cycle is in the deep ocean, and it is not known what rate of CO2 exchange occurs between deep ocean and ocean surface layer.
For example, a minute change to ocean surface layer pH of 0.1 would alter the equilibrium of CO2 between air and ocean to induce more change to atmospheric CO2 concentration than has been observed. Such a pH change could not be induced by alterations to CO2 concentrations and fluxes because of the carbonate buffer. But it could be a result of change to the sulphur injected into the thermohaline circulation by submarine volcanoes long ago. When the dissolved sulphur reached the ocean surface layer it would change the ocean surface layer pH with resulting change to atmospheric CO2 concentration. And such a global 0.1 pH change is far too small for the limited available data to indicate it.

Aat July 29, 2014 at 4:12 pm you have replied to that by saying in total

Phil. says:
July 29, 2014 at 2:44 pm
In addition, as I explained to Richard, if you add some acid to the oceans, the total amount of carbon forms (DIC: CO2 + bi + carbonates) would decrease because of the loss of CO2, while we see an increase of DIC with decreasing pH.
That proves that CO2 is pressed into the oceans, not the other way out…
Simply add some vinegar to a solution of (baking) soda and weigh both containers before and after the mixing…

Your post I have here quoted disputes that because, you say,
“That proves that CO2 is pressed into the oceans, not the other way out…”
So what? At issue is how the equilibrium CO2 concentration between air and ocean has changed. The anthropogenic emission is to the air so the equilibrium – whether altered or not – will have a net flux of CO2 from air to oceans.
And nobody can weigh the oceans.
Richard

Pete Mack
July 30, 2014 1:46 am

This number shows emissions and absorptions. In an equilibrium model, emissions and absorption would be equal. They are not. The difference (and a bit more) is due to extra CO2 from fossil fuel and land-use change. On this, at least, I’m glad to see you on the same side as the climate-change people.

A. Scott
July 30, 2014 2:04 am

Anthony … this link:
http://www.geocraft.com/WVFossils/greenhouse_data.html
… appears to contain the data I think people are thinking about – the US Dept of Energy numbers from 2000 on anthropogenic vs. natural share of CO2. And analysis of the concentration.
Tables 1 and 2 show the “share” data and that data adjusted for GWP (global warming potential) of the GHG’s.
This anthropogenic vs. natural share of CO2 data is highly elusive – next to impossible to find a clear succinct representation such as here. This is key information – core data – on the entire CAGW claim. Yet this data is all but non-existent.
For example the reference/source link for the Table data in the Geocraft link above – to the US Dept of Energy, OakRidge – is still active:
http://cdiac.esd.ornl.gov/pns/current_ghg.html
However, that link no longer provides any data on the relative shares between natural and anthropogenic CO2 contributions to the total.
Here is an image – presenting a simple picture showing the natural vs anthropogenic shares of CO2:
http://diggingintheclay.files.wordpress.com/2011/02/ed2.png?w=640
(from this page: http://diggingintheclay.wordpress.com/2011/02/24/the-futility-of-trying-to-limit-co2-emissions/ )
‘Digging in the Clay’ provides this reference link as support for this graphic:
http://cdiac.ornl.gov/faq.html#Q2
Which goes to the same exact link as the Geocraft reference:
http://cdiac.ornl.gov/pns/current_ghg.html
Which, again, NO longer provides any data on the athropogenic vs. natural share of CO2, as it clearly did when the Geocraft table and the ‘Digging in the Clay’ graphics were created..
This perhaps is a good challenge for the WUWT crowd sourced research “team” – find recent data or graphics that show updated data on the respective natural and anthropogenic shares of total CO2, in the simple form as shown in the Dept of Energy tables in the Geocraft link above and in the ‘Digging in the Clay’ graphic.
I would suspect the warming crowd has purposely and intentionally buried this information to every extent possible … as the simple graphics and tables as shown in links above – that clearly show the natural vs anthropogenic share, in perspective – become a real problem for their narrative.
.

July 30, 2014 2:59 am

Hockey Schtick says:
July 29, 2014 at 6:05 pm
Where is the data to back up this assertion, and what assumptions are made?
The net uptake of the biosphere is based on the oxygen balance: fuel consumption is known with reasonable accuracy (if anything wrong, probably underestimated). CO2 emissions and oxygen use for the different fuels can be calculated and the oxygen decrease in the atmosphere can be measured (be it at the edge of analytical possibilities). That shows that since the 1990’s some less oxygen is used than calculated. The difference is what the biosphere as a whole (land + ocean plants, bacteria, molds, insects, animals, humans) has produced (or used) by (plant) uptake or (plant/others) decay/food/feed/burning. This makes it easy to make the distinction between simple ocean release/uptake and the biosphere release/uptake as for the oceans no oxygen is involved (except for its solubility in seawater). Another way is to look at the δ13C balance, which is far more pronounced – and opposite – than the ocean influence. Both methods gives a similar net uptake by the biosphere:
http://www.sciencemag.org/content/287/5462/2467.short and
http://www.bowdoin.edu/~mbattle/papers_posters_and_talks/BenderGBC2005.pdf
Natural sinks would have only had to increase a mere 4% to accommodate all man-made CO2, and the error bars on natural sources and sinks are large, as well as on land-use changes.
It seems quite difficult to understand the difference between an increased cycle and the net result of a cycle.
If we take the ~1.5 GtC/year extra uptake of the biosphere for granted, that gives an increase in total bio carbon mass of ~30 GtC over the past two decades. That is about 5% in total mass.
Does that increase the seasonal cycle? Maybe somewhat, but not in the tropics: the decay rate and growth rate there is near equal, except during El Niño’s (drought, heat) and Pinatubo’s. Thus the difference should be in the extra-tropic (mainly NH) forests. That should be visible in the seasonal cycle, because the NH seasonal cycle is dominated by the NH forests.
I haven’t looked at that in detail, but there are signs that the seasonal cycle increased over time.
But again, and increase in seasonal cycle doesn’t influence the net result of the cycle: more growth is accompanied by more decay, as most debris is from one-year leaves…
While the error bars of the natural cycle are huge, the net result shows a remarkably modest variation: not more than +/- 1 ppmv (2 GtC) from year to year:
http://www.ferdinand-engelbeen.be/klimaat/klim_img/dco2_em2.jpg
including huge influences from the 1992 Pinatubo and 1998 El Niño.
That is less than halve the human emissions and less than 3% of the estimated fluxes. But take into account that seasonal ocean and biosphere fluxes are opposite to each other with the temperature change.
Land use changes only add to the human emissions…

July 30, 2014 3:01 am

You really ought to pay attention to more of your mistakes. For example, in the title of this article, you say “~3% of atmospheric carbon dioxide is attributable to human sources”. And then in the first paragraph of the article it says “about 3.75% [15 ppm] of the CO2 in the lower atmosphere is man-made from the burning of fossil fuels, and thus, the vast remainder of the 400 ppm atmospheric CO2 is from land-use changes and natural sources such as ocean outgassing and plant respiration.” Last I heard, most land-use changes are sourced by humans. I haven’t seen the deer trying to farm rice in my back yard lately.
So, it’s not just that you re-post crap articles without reviewing them, you also lack the reading comprehension and writing skills to make the title of the article match up with the content of the article.

Will Nitschke
July 30, 2014 3:14 am

When I once pointed out how Nick Stokes had misrepresented an article written by Roy Spencer, rather than admit the completely black and white mistake, Stokes obfuscated and misdirected in shameless fashion. What a vast gulf exists between those of intellectual merit who admit mistakes, and the hacks.

July 30, 2014 3:15 am

EricS says:
July 29, 2014 at 6:06 pm
So, *nothing* else is changing in the carbon balance: no volcanoes erupting, no algae blooms blooming, etc.? Gaia is running a controlled experiment I guess? Including any sources/sinks that we have yet to characterize?
The 1992 Pinatubo eruption didn’t even increase the CO2 rate of change of that year: the rate of change dropped more due to extra uptake (more diffuse light – more photosynthesis) than the extra CO2 supply. Volcanic release are estimated at ~1% of human emissions.
There is no reason to believe that any natural flux suddenly increased at the exact rate and time as humans did at twice the measured increase in the atmosphere. Even with a lot of unknowns in individual sinks and sources, the net result of all natural fluxes is more sink than source for the past 55 years…
The biosphere is a proven sink for CO2
The oceans are proven sinks for CO2
Warming land absorbs more CO2
Warming oceans release more CO2 until a new equilibrium is reached at ~17 ppmv/°C
The combination of warming land and oceans gives a historical 8 ppmv/°C
Thus maximum 8 ppmv/°C for the warming since the LIA. Not 120 ppmv…
Do we even know if we’re in a regime where the D.E.s can be treated as approximately linear?
The temperature/CO2 ratio over the past 420,000 years at Vostok (800,000 years at Dome C) is remarkably linear, despite that a lot of underlying reactions are highly non-linear:
http://www.ferdinand-engelbeen.be/klimaat/klim_img/Vostok_trends.gif
The historical rate of change was 8 ppmv/°C

richardscourtney
July 30, 2014 3:31 am

Pete Mack:
Your post at July 30, 2014 at 1:46 am says in total

This number shows emissions and absorptions. In an equilibrium model, emissions and absorption would be equal. They are not. The difference (and a bit more) is due to extra CO2 from fossil fuel and land-use change. On this, at least, I’m glad to see you on the same side as the climate-change people.

Your propaganda contains much falsehood, and in particular makes the untrue assertion that “In an equilibrium model, emissions and absorption would be equal.”.
No! If you hadf read the thread then you would know your assertion is wrong.
For a rational and correct explanation of the matter please read my post at July 29, 2014 at 9:43 am which is here.
Richard

richardscourtney
July 30, 2014 3:37 am

cesium62:
You begin your post at July 30, 2014 at 3:01 am saying

You really ought to pay attention to more of your mistakes.

Say what!?
cesium62, you have been snowing WUWT threads with your mistakes this morning. Your mistakes are so many and so varied that I suspect they are a deliberate campaign intended as disruption of rational discourse.
Richard

richardscourtney
July 30, 2014 3:50 am

Ferdinand,
I write to proffer a warning. At July 30, 2014 at 3:15 am you write

There is no reason to believe that any natural flux suddenly increased at the exact rate and time as humans did at twice the measured increase in the atmosphere.

Absence of evidence is not evidence of absence.
So, using “We don’t know” as evidence is both a logical error and a hostage to fortune.
Also, whilst writing, I add that your post fails to address the point which EricS was making; viz. you claim the natural system was invariate but EricS points to natural sources of variation, and your comment about relative magnitudes of anthropogenic and natural variations does not counter his point.
Richard

July 30, 2014 6:02 am

Bernard Lodge says:
July 29, 2014 at 10:50 am
To be clearer, the levels of CO2 at Mauna Loa drop 7 ppm in March/April every year then jump by 9 ppm in Sept/Oct each year. The cause of these changes in is believed to be growth in vegetation in the ‘warming’ hemisphere (northern summer) sucking up CO2 due to increased photosynthesis combined with the cooling southern hemisphere (southern winter) causing increased absorption of CO2 into the oceans – both affects happening at the same time. In Sept/Oct, the process reverses as vegetation growth slows down in the north while ocean temperatures rise in the south, both causing global CO2 levels to rise. Don’t forget that the northern hemisphere has most of the land and the southern hemisphere has most of the oceans so the effects don’t cancel out.
Clearly, CO2 levels are driven by seasonal temperature changes every year yet we are told that changes in CO2 cause changes in temperature! This is not a trick question, I really want to know what is the explanation of this?
————————-
To better understand your stated per se “CO2 global phenomenon” you will first have to rid your thinking of a few “junk science” claims, two (2) of which I “highlighted” in your above commentary.
I agree with you that “CO2 levels are driven by seasonal temperature changes” but not via the reasons you are thinking, …. except for one that you noted, which is, in my learned opinion, the “primary” driver of both the bi-yearly (seasonal) cycling and yearly average increases in atmospheric CO2 ppm.
Now if you look at this modified Keeling Curve Graph … http://i1019.photobucket.com/albums/af315/SamC_40/keelingcurve.gif …. and/or the actual Mauna Loa CO2 data that is the source of the above graphical data ….. ftp://aftp.cmdl.noaa.gov/products/trends/co2/co2_mm_mlo.txt …. one can clearly see that there has been a “steady and consistent” clock-work pattern of increases and decreases in atmospheric CO2, each and every year …. for the past 55 years.
The yearly maximum CO2 ppm always occurs in mid-May (month 5)of each year following the Vernal equinox and the yearly minimum CO2 ppm always occurs around the 1st of October (month 9/10) of each year following the Autumnal equinox.
The growth in vegetation in the Northern Hemisphere has nothing whatsoever to do with the average 6 ppm decrease in CO2 ppm during the Spring and Summer months simply because the emissions of CO2 via the rotting and decaying of dead biomass, … due to the increase in moisture and warm temperatures, …… will “off-set” and/or negate any “sucking up” of CO2 due to increased photosynthesis.
And the rotting and decaying of dead biomass in the Northern Hemisphere has nothing whatsoever to do with the average 6 ppm increase (average 8 ppm in total) in CO2 ppm during the Fall and Winter months simply because the bacteria, fungi, etc. responsible for said “rotting n’ decaying” adhere to the Refrigerator/Freezer Law which retards and/or diminishes their “activity” when temperatures drop below 60F and/or when the biomass is “too dry” due to lack of moisture. The Fall and Winter months are always either too dry or too cold.
Now the above stated “average 8 ppm in total” includes an average 1-2 ppm yearly increase in CO2 ppm which has also been a “steady and consistent” clock-work pattern of increases in atmospheric CO2, each and every year …. for the past 55 years which is the result of a “steady and consistent” warming of the ocean waters … which are recovering from their Little Ice Age cooling.
Cheers

July 30, 2014 7:56 am

Ferdinand Engelbeen says:
July 29, 2014 at 4:05 pm
But there isn’t the slightest sign that the natural carbon cycle even increased over the past 55 years:
—————–
To support and/or justify your above “statement of fact” ….. you will have to provide factual scientific evidence that the anthropogenic CO2 emissions …. or lack thereof, …. have been “steady and consistent” ….. month after month and year after year ….. for the past 55 consecutive years ….. as is portrayed/recorded via the Keeling Curve Graph and the Mauna Loa Record.
So best you “think up” something that humanity has been doing in a “steady and consistent” manner for the past 55 consecutive years.
=================
Ferdinand Engelbeen says:
July 29, 2014 at 4:12 pm
Simply add some vinegar to a solution of (baking) soda and weigh both containers before and after the mixing…
————-
Iffen you are trying to simulate actual ocean activity ……….
Why not simply “shake-up” a can of cold beer and then “pop-the-top” and weigh the can both before and after the “pop-topping”.

Alan Robertson
July 30, 2014 8:00 am

Samuel C Cogar says:
July 30, 2014 at 6:02 am
“The growth in vegetation in the Northern Hemisphere has nothing whatsoever to do with the average 6 ppm decrease in CO2 ppm during the Spring and Summer months simply because the emissions of CO2 via the rotting and decaying of dead biomass, … due to the increase in moisture and warm temperatures, …… will “off-set” and/or negate any “sucking up” of CO2 due to increased photosynthesis.”
____________________
That’s a bold statement and doesn’t make sense, to me and here’s why: we know that each year, the biosphere is greening and there is a net gain in biomass, which indicates that annual CO2 bio- uptake outpaces CO2 release from the biosphere. Even the Mauna Loa/Keeling data apparently shows that annual CO2 sequestration is increasing, because the annual difference between high/low CO2 is increasing. Maybe I’m looking at this wrong. Otherwise, I think that your statements about the timing of decay are correct.
————————-
“Now the above stated “average 8 ppm in total” includes an average 1-2 ppm yearly increase in CO2 ppm which has also been a “steady and consistent” clock-work pattern of increases in atmospheric CO2, each and every year …. for the past 55 years which is the result of a “steady and consistent” warming of the ocean waters … which are recovering from their Little Ice Age cooling.”
_____________________
Has there been a steady and consistent warming of ocean waters for 55 years?

July 30, 2014 8:08 am

Hockey Schtick says:
July 29, 2014 at 6:13 pm
Your declining “sink rate” makes the convenient assumption that 100% of the CO2 increase is man-made, that none of the increase is a secondary effect of temperature, ocean outgassing, etc., thus it is a circular argument that proves nothing.
The sink rate is not declining, it is increasing in ratio to the extra pressure of CO2 in the atmosphere.
Temperature only gives a small change in input and output fluxes: 17 μatm extra pressure difference for 1°C warming of at the upwelling near the equator and 17 μatm less pressure difference for the intake at the polar sink places. That increases the inflow and decreases the outflow of CO2, such that the CO2 level in the atmosphere will increase. That goes on until the increase of CO2 in the atmosphere is 17 μatm (~17 ppmv). Then the previous in/out fluxes of CO2 between atmosphere and oceans are restored:
http://www.ferdinand-engelbeen.be/klimaat/klim_img/upwelling_temp.jpg
Thus the equilibrium “setpoint” of CO2 from the oceans changes 17 ppmv with temperature. That is all. Not 120 ppmv…
Extra upwelling from the oceans, be it from temperature, increased concentration, more upwelling or pH changes also would increase the δ13C level of the atmosphere, or at least reduce the reduction rate of the human supply of low-13C CO2.
The problem with all the “alternative” CO2 sources is that they all fail one or more observations. Only human emissions fit all observations…

July 30, 2014 8:18 am

@ Paul Jackson says:
July 29, 2014 at 5:22 pm
———————
Thank you Paul J, well stated.
If only more people actually knew and understood the “biology of the natural world” …. then they wouldn’t be mimicking so many half-truths and/or “junk science” claims in support of their miseducated beliefs.

July 30, 2014 8:21 am

Samuel C Cogar says:
July 30, 2014 at 7:56 am
To support and/or justify your above “statement of fact” ….. you will have to provide factual scientific evidence that the anthropogenic CO2 emissions …. or lack thereof, …. have been “steady and consistent”
See:
http://www.ferdinand-engelbeen.be/klimaat/klim_img/temp_co2_acc_1960_cur.jpg
and even in the year by year emissions, there is little variation (less than the detection limit of Mauna Loa):
http://www.ferdinand-engelbeen.be/klimaat/klim_img/dco2_em2.jpg
Iffen you are trying to simulate actual ocean activity
All what I tried to show is that a reduction of pH in the oceans from volcanoes would lower DIC, while more CO2 pressure in the atmosphere will increase DIC and lower the pH.
BTW, try to shake a Coke bottle in a 7 bar CO2 atmosphere: it will take up more CO2…

July 30, 2014 8:53 am

DesertYote says:
July 29, 2014 at 11:25 pm
The rate at which CO2 is “sequestered” is directly related to the concentration of CO2.
AND temperature, but to a lesser extent at current CO2 levels.
The rate at which CO2 is released is directly related to temperature
AND pressure. Temperature is good for 17 ppmv/K increase and decrease (oceans) and more uptake / decay for plants. Average 8 ppmv/K over the past 800,000 years. That shows a reaction of a quite simple linear first order process, no matter the underlying lots of processes involved.
Current 120 ppmv above (dynamic) equilibrium gives not more than 2 ppmv (4.5 GtC) extra uptake. Thus pressure wins by far from temperature, the more that there is no temperature increase in the past 1.5 decade.
The overestimated rate of anthropogenic CO2 production is well within the measurement uncertainty of vastly underestimated rate of “natural” CO2, and much smaller then the natural variability.
Please look at the data. CO2 production is quiet well known. the natural variability is only halve the human emissions and the uncertainty of the natural cycle fluxes is of not the slightest interest, as the net result of that cycle is known with the same accuracy as human emissions: the difference between measured increase and human emissions, thus negative over the past 55 years.
What we have here is a naturally stabilizing system with a great deal of negative feed back that totally swamps out mans insignificant contributions.
Of course nature tries to accommodate with human emissions, but it certainly doesn’t swamp out the human emissions. Currently only halve of them. If you like linear equations, the e-decay rate of the extra CO2 is over 50 years. Too slow to accommodate for all human emissions, but by far fast enough to accommodate for glacials and interglacials:
http://www.john-daly.com/carbon.htm

July 30, 2014 9:33 am

Ferdinand’s point on Oxygen balance should be taken far more seriously. Oxygen has a 300 Gt annual cycle and thus is cycling 30% faster than C (if you step back and think about it the speed of these cycles is astonishing). Respiration cannot take place without consuming O2 in six molecule increments. If we will argue that plankton are producing far more CO2 than we think, The O2 must be accounted for.
As usual there are vast uncertainties. Anaerobic metabolism produces CO2 from Oxygen that is not free in the atmosphere but is already bound in nitrates, phosphates, and sulfates. Its extent is unknown. And this raises the issue of chemical weathering which is more important (approaching a Gt) in the Oxygen than the Carbon cycle. Photochemical oxidation is thought to be about 6Gt …

July 30, 2014 9:53 am

Ferdinand says “CO2 production is quiet well known. the natural variability is only halve the human emissions and the uncertainty of the natural cycle fluxes is of not the slightest interest, as the net result of that cycle is known with the same accuracy as human emissions: the difference between measured increase and human emissions, thus negative over the past 55 years.”
The only thing that is “well known” is fossil fuel emissions. There are large error bars on natural sources & sinks, and on man-made land use changes [some positive and some negative], and it is a dynamic, not static, system. For examples of recent papers showing natural sources that were previously believed to be sinks but have recently been found to be sources instead see several posts including
http://hockeyschtick.blogspot.com/2014/05/settled-science-new-paper-challenges.html
http://hockeyschtick.blogspot.com/2014/05/new-paper-finds-large-erroneous.html
http://hockeyschtick.blogspot.com/2014/02/new-paper-finds-amazon-can-be-net.html
Ferdinand says above “Thus again, that humans emit only 4% of the natural emissions is of no interest at all, as nature captures 102% of the natural emissions back each year…”
And Bart replies: “Once again, a complete detachment from the way feedback systems work.”
Summing up Ferdinand’s hypothesis in his own words:
“that humans emit only 4% of the natural emissions is of no interest at all” and
“the uncertainty of the natural cycle fluxes is of not the slightest interest” as well as non-linear dynamic system responses.
Thus, apparently the only thing “of interest at all” to Ferdinand is his unjustified assumption that 100% of the increase in CO2 levels is man-made

July 30, 2014 9:53 am

Alan Robertson says:
July 30, 2014 at 8:00 am
That’s a bold statement and doesn’t make sense, to me and here’s why: we know that each year, the biosphere is greening and there is a net gain in biomass, which indicates that annual CO2 bio- uptake outpaces CO2 release from the biosphere.
————-
Said “indicates” is what you have been nurtured to believe, ….. but in fact, … IS NOT SO.
The FACT is that the natural biological emissions of CO2 actually begins before the biosphere photosynthetic “greening” begins. For the following reasons, to wit:
1. the initial biosphere “greening” requires a “warming” in the day-time surface temperatures …. as well as a minimum number of day-light hours. Said day-light hours is the primary “trigger” that initiates said “greening” … as well as the “shut-down” process in late summer and fall.
2. the initial biosphere “greening” DOES NOT require any CO2 absorption because it is produced by the stored sugars in the root system.
3. biological emissions of CO2 via rotting and decaying begins just as soon as the surface temperature “warm up”. Ref: my Refrigerator/Freezer Law … @ http://www.fsis.usda.gov/wps/wcm/connect/934c2c81-2a3d-4d59-b6ce-c238fdd45582/Refrigeration_and_Food_Safety.pdf?MOD=AJPERES
4. both biosphere “greening” and biological emissions of CO2 ….. BEGINS around the 1st of February in the southern latitudes of the Northern Hemisphere …. and progresses slowly northward to the northern latitudes until the Summer solstice occurs in June. (That is why the far northern latitudes have a “short” CO2-emitting growing season)
Reference: USDA Planting Zone Map .. http://www.plant-power.com/images/zone_map.jpg
5. both biosphere “greening” and biological emissions of CO2 are neither steady nor consistent each and every year over the entire expanse of the above cited USDA Planting Zone Map therefore it is a figment of one’s imagination to assume that mid-May always reflects the “mid-point” of biosphere photosynthetic activity in the Northern Hemisphere.

July 30, 2014 10:14 am

Ferdinand Engelbeen says:
July 30, 2014 at 8:21 am
See:
and even in the year by year emissions, there is little variation (less than the detection limit of Mauna Loa):
——————–
Don’t be “talking trash” to me ….. by first claiming that atmospheric CO2 has generally been increasing since the Industrial Age and specifically increasing since 1958 ….. and then claiming those increases are undetectable even in the Mauna Loa record.

July 30, 2014 10:57 am

Hockey Schtick says:
July 30, 2014 at 9:53 am
The only thing that is “well known” is fossil fuel emissions.
—————-
I have to disagree with the above statement in you post.
Me thinks it would have been more appropriate to have stated “well believed”….. because there is no way in ell that CO2 emissions from burning fossil fuels is well known by anyone.
“Tracking” fossil fuel sales is almost akin to “tracking” marijuana sales or the number of illegal immigrants in the US. Unless, like a few other things, +-40% is considered a “scientific fact”.
“HA”, like the State DNR does in their “tracking” of Whitetail deer populations. They drive along the roadways …. counting the # of deer they see out in the fields ….. and then multiply that # by ten (10) to account for the # of deer that are surely “hiding” in woods.

Alan Robertson
July 30, 2014 11:42 am

Samuel C Cogar says:
July 30, 2014 at 9:53 am
Alan Robertson says:
July 30, 2014 at 8:00 am
“That’s a bold statement and doesn’t make sense, to me and here’s why: we know that each year, the biosphere is greening and there is a net gain in biomass, which indicates that annual CO2 bio- uptake outpaces CO2 release from the biosphere.”
————-
Said “indicates” is what you have been nurtured to believe, ….. but in fact, … IS NOT SO.”
____________________
Hello Mr. Cogar,
I made a statement to you in response to your assertion that the annual return of CO2 from decay, etc. negates any annual increase within the biosphere.
You just responded and said that my statement, which you quoted, is wrong and that I have been nurtured into a belief system…
Yet, with your response, you didn’t say one single thing to contradict my statement that the planet’s biosphere is greening and biomass increasing.
Satellite data (along with other data,) reveals that globally, net plant productivity is increasing and sequestering C at rate faster than the biosphere is releasing C due to decay/respiration.This process is well- known and is due to enhanced available CO2 to plants and increased temperatures, leading to extended growing seasons. Even NASA, which seems to be operating in support of a political agenda, can’t help but confirm that Earth’s biosphere is increasing in extent and vigor, even in such places as the Sahel and that the carbon sequester/loss ratio is increasing.

July 30, 2014 11:53 am

richardscourtney says:
July 30, 2014 at 12:01 am
Phil:
I write as a courtesy to say that I have read – and laughed at – your post at July 29, 2014 at 2:44 pm. As is typical of your comments, it is good on untrue abuse from behind the coward’s shield of anonymity, but it is poor on factual content.

Really, factual evidence such as “a change in pH of 0.1 is a change in the H+ ion concentration of ~26%, hardly ‘minute’,” and “your hypothesis about sulphate is unsupported by the data, sulphate is conserved in seawater at ~8%”. You’re too much of a coward to face up to the fact that you’re completely wrong on those points and avoid facing up to your errors and instead make pathetic excuses for not doing so.
I will discuss any flaw in my comments from rational humans and – as always – express gratitude when I am shown to be wrong. But only my disdain is obtained for untrue and irrational twaddle from anonymous internet trolls such as you.
You’ve been shown to be wrong on the above points, there’re no untruths and no irrationality, where’s your ‘gratitude’?

richardscourtney
July 30, 2014 12:33 pm

Phil.:
I see that you again demonstrate your self delusion with your post at July 30, 2014 at 11:53 am.
I have NOT been “shown to be wrong” and I would be grateful if I were.
I am content to discuss matters with knowledgeable and honourable people who disagree with me such as Ferdinand.
There is no way I will lower myself to engage with you. I have made that mistake before when I have always discovered the truth of the old maxim, “Never wrestle with a greasy pig: you can’t win and the pig likes it”.
Richard

DesertYote
July 30, 2014 12:44 pm

Ferdinand Engelbeen says:
July 30, 2014 at 8:53 am
CO2 production is quiet well known. the natural variability is only halve the human emissions and the uncertainty of the natural cycle fluxes is of not the slightest interest, as the net result of that cycle is known with the same accuracy as human emissions:
###
And Spock has a beard.

July 30, 2014 12:45 pm

Bart says:
July 30, 2014 at 12:07 am
After 34 years of practical work with feedback systems, I have some knowledge how they work. Not the big theories, which I have forgotten after decades of none-use.
This let’s see how the earth’s CO2 cycle reacts on the extra CO2 supply from humans.
– There is a lot of variability in the CO2 levels over seasons, year by year up to multi-millennia.
That is mainly caused by temperature variability. The reaction of CO2 on temperature is quite modest: 5 ppmv/°C seasonal, 4-5 ppmv/°C year by year (opposite to seasonal variations) and up to 8 ppmv/°C for decades to multi-millennia.
– For whatever reason the CO2 levels increased some 120 ppmv over the past 160 years, of which 80 ppmv since Mauna Loa and South Pole started measuring CO2.
– In the same time frame, humans emitted over 200 ppmv.
– The 100+ ppmv CO2 increase induced a net sink rate in nature of over 2 GtC/year. That is a direct feedback of the whole carbon cycle to the increased CO2 pressure in the atmosphere. Which leads to an e-fold decay rate of ~52 years or a half life time of ~40 years.
That is too slow to remove the extra CO2 out of the atmosphere in a short time frame. But by far fast enough to do that over time frames of centuries to multi-millennia.
It is very obvious that nature is in control of the atmospheric CO2 balance on this planet.
As said last time, but you didn’t react: that plot shows that fast variations of temperature (in fact the derivative) induce fast variations in the CO2 rate of change. That process is caused by the direct influence of temperature (and precipitation) changes on CO2 emissions from (tropical) vegetation. That can be derived from the simultaneous changes in CO2 and δ13C rate of change:
http://www.ferdinand-engelbeen.be/klimaat/klim_img/temp_dco2_d13C_mlo.jpg
CO2 and δ13C data from Mauna Loa and temperature data from HadCRU4_SH.
But as the biosphere is a net increasing sink for CO2, temperature is not responsible for the increase in the CO2 rate of change or the decrease in δ13C rate of change via the biosphere.
That means that the short term variability and the long term increase of the CO2 rate of change are completely disconnected and the first can’t be used as proof that the second also is caused by temperature. The matching of slopes between T and dCO2/dt is simple curve fitting and has no bearing in any known physical process. Moreover, it influences the amplitude of the first (biological) process variations which have nothing to do with the increase of the CO2 rate of change…
Thus while the short term variability of CO2 is largely caused by temperature variability, there is not the slightest reason to assume that the current 100+ ppmv CO2 increase is caused by temperature…

July 30, 2014 12:52 pm

DesertYote says:
July 30, 2014 at 12:44 pm
And Spock has a beard.
Some very smart people have problems with simple math like:
increase in the atmosphere = human emissions + natural emissions – natural sinks
2 ppmv = 4 ppmv + X – Y
X-Y = -2 ppmv
Where the variability of X-Y = +/- 1 ppmv, which is halve the human emissions, without any sign of increased variability over time:
http://www.ferdinand-engelbeen.be/klimaat/klim_img/dco2_em2.jpg.

July 30, 2014 1:08 pm

Ferdinand says “X-Y = -2”
Single equation, two unknowns, no unique solution
Some very smart people have problems with simple math like this

July 30, 2014 1:17 pm

richardscourtney says:
July 30, 2014 at 12:17 am
And nobody can weigh the oceans.
Indeed quite difficult, but one can measure what is in the oceans: all measurements taken at ships tracks and fixed stations show that the pH is decreasing and DIC is increasing over time. Which proves that the pH decrease is not caused by an addition of some acidic components but from increased CO2 input into the oceans…

July 30, 2014 1:34 pm

Hockey Schtick says:
July 30, 2014 at 1:08 pm
Ferdinand says “X-Y = -2″
Single equation, two unknowns, no unique solution
Some very smart people have problems with simple math like this

I have no problems with the unknowns, because the only solution needed is -2, which is all what counts for the increase or decrease of CO2 in the atmosphere.
No matter if X = 150 and Y = 152
or X = 300 and Y = 302
or (some part of) X and Y doubled or halved since last year
or some part of X suddenly got a part of Y
or that many individual fluxes of X and Y are not known to any accuracy
or…
You are looking for the unknowns in the carbon cycle, I am looking for the quite well known gain (or loss in this case) after a full cycle…

July 30, 2014 1:48 pm

Samuel C Cogar says:
July 30, 2014 at 10:14 am
Don’t be “talking trash” to me ….. by first claiming that atmospheric CO2 has generally been increasing since the Industrial Age and specifically increasing since 1958 ….. and then claiming those increases are undetectable even in the Mauna Loa record.
I was talking about the year by year <I<variability of the human emissions. Human emissions indeed are increasing, but the year by year variability and the increase rate from one year to next year is maximum 0.2 ppmv. As about halve of that variation remains in the atmosphere, the variability itself is undetectable in the Mauna Loa record.
That has led Bart, Salby and many others to believe that the increase itself is not caused by human emissions because all observed variability is natural.

richardscourtney
July 30, 2014 3:54 pm

Ferdinand Engelbeen:
Thanks for your post addressed to me at July 30, 2014 at 1:17 pm which says in total

richardscourtney says:
July 30, 2014 at 12:17 am

And nobody can weigh the oceans.

Indeed quite difficult, but one can measure what is in the oceans: all measurements taken at ships tracks and fixed stations show that the pH is decreasing and DIC is increasing over time. Which proves that the pH decrease is not caused by an addition of some acidic components but from increased CO2 input into the oceans…

Firstly, I apologise for using sardonic humour. Your extraordinary linguistic skills make it easy to forget that English is not your first language.
My comment was intended to be ‘shorthand’ for “you can’t do that”.
Your reply clearly demonstrates that my intention was too unclear. Sorry.
There is no possibility that available data can indicate a consistent change of 0.1 to the pH of ocean surface layer. The pH varies at localities by much more than that on an hourly basis and there is insufficient spatial sampling to discern what has or has not happened to the average pH. Please see the data here.
However, let us assume you are right that “the pH is decreasing and DIC is increasing over time”. Then that IS consistent with addition of some acidic components reducing the pH to alter the equilibrium of CO2 concentrations in the air and ocean surface layer. Hence, such an addition being the cause of increased atmospheric CO2 concentration is a possibility. Similarly, the anthropogenic CO2 emission is another possible cause of the increased atmospheric CO2 concentration. And other causes are also possible.
I have yet to see conclusive evidence for any single possibility being the true cause.
Richard

Denica Bozhinova
July 30, 2014 4:15 pm

I apologize in advance for interrupting your fantastic scientific discussion with what might seem like a “blast from the past”. This blog came to my attention only this morning (CET time zone) and took quite a lot of time to read and digest. So if you allow me, I would like to try to address several issues that seem to be recurring and where my name or my work is mentioned.
First, the pipe analogy, part of which was cited here, contained a bit more information. More precisely, my original post was trying to address the problem with the table, also corrected by many people here, that the table is showing gross (annual) fluxes to the atmosphere, not the total amount.
“With regard to your gross fluxes question – imagine the atmosphere (as a reservoir of CO2) as a pool. You have several pipes that control the in/out flow. You have this huge pipe of biospheric inflow, almost as big as the pipe for the biospheric outflow. You have silimar pipes for the ocean inflow and outflow in the pool. Regardless of the actual size of the big pipes – they are relatively balanced between inflow and outflow – their net contribution to the pool is almost zero when compared to the gross fluxes themselves – in some years the pool level is rising, in other it is going down.
Now you add a much smaller pipe for the inflow from anthropogenic emissions. This pipe does not have outflow to balance it, so it’s net contribution is in fact the entire inflow of it to the pool. And the net contribution of this pipe is in fact bigger than the net contribution of the other huge pipes and is growing. Luckily the outflow pipes to the biosphere and ocean are in fact a bit bigger (or you could say flexible) and manage to take up a bit of the inflow from the anthropogenic flux. Still, the pool is getting filled up faster and faster.”
Second, the original review on Hockey Schtick. It’s mistakes were that it
1. Wrongfully attributed the fossil fuel CO2 we report as -all- the fossil fuel CO2 in the atmosphere
2. Wrongfully attributed our findings to the global scale and since the preindustrial era
These were the several major points, which a commenter here caught correctly –
Nick Stokes says on July 29, 2014 at 1:04 pm:
CO2bg is the background CO2 outside the limited area of the study, measured in her case at the top of Jungfraujoch in the Alps. The other terms, including CO2ff, are the perturbations in her particular location in a plume of recently emitted CO2.
Thirdly, reply to some comments here which I found very surprising.
WryHeat says on July 28, 2014 at 12:28 pm (copied in the addendum to the original post here)
“Denica Bozhinova has commented extensively, and frankly, I can’t understand her position since she seems to contradict what she wrote in the abstract to “Simulating the integrated summertime Ä14CO2 signature from anthropogenic emissions over Western Europe”
Considering the time stamp of the cited e-mail/comment and looking back to the conversation on WryHeat’s blog, there is virtually no discussion on what my article results actually are. I would be happy to elaborate on any “contradiction” that WryHeat thinks I have made with regards to my article, although I am puzzled that he would state here that I am conflicted and not in the discussion where I am actually replying.
“She apparently scared The Hockey Schtick into taking down his post on the matter.”
I have no idea what power I must have in order to “scare” an established blog-writer into taking down his work over the internet. In fact, my reply to his “review” of my work never even made it to the comment section – as all comments are required to pass moderator’s approval he read it first and then decided to take down his own work for revision. Then he notified me about it and asked further questions. And connected to that comes the next part..
Hockey Schtick says on July 29, 2014 at 11:59 am
“The correspondence with the lead author has been delayed waiting ~5 days for a reply from the author to questions, including about the following…”
“…then putting the post in draft mode until this issue is clarified by the lead author, then so be it.”
Considering that the reasons why the original review was “put in draft mode” were that Hockey Schtick realized that my paper does not address the issues he described in it, I am really surprised to read this statements. Even more surprised because, again, the time-stamp shows me that I received the email with his new questions (also copied and posted here) only 2-3 hours before he wrote here repeatedly that he is waiting on my so very much delayed reply.
I confess that my previous reply to him had taken me 5 days to write, which were mostly spent in trying to find all the forums/blogs/sites that have reposted his review and trying to minimize the damage done to my and my article’s credibility. Also, because the questions he asked were not issues directly connected with my work or study and as I pointed out in my recent communication – I prefer not to chat about science, but have time to think over the arguments and evaluate them.
Further claims that “it appears there is a significant erroneous statement in the first conclusion which conflates “concentrations” with “gradients”” are in fact inaccurate again. As I wrote few hours ago in an e-mail reply – the statement in the abstract about the result for the gradients in CO2ff concentrations and the conclusion about the concentrations themselves are not contradicting each other at all. However, this discussion made me realize that Hockey Schtick has a much bigger issue he should deal with – taking responsibility for his own writings and doings.
In this particular discussion he has tried to use my delay in reply to him retroactively as an excuse for his retracted review and the delayed republication. And trying to shift the attention from the original mistakes in the review to something “new and shiny” that he had not verified, but yet in only few paragraphs he states repeatedly:
– appears should have said “gradients” not “concentrations”
– If the author wrote “concentrations” when she meant “gradients”
– it appears there is a significant erroneous statement in the first conclusion which conflates “concentrations” with “gradients”
– apparently incorrect conclusion in the paper
– an incorrect statement in the major conclusion of a paper
– she apparently made a significant incorrect statement in the conclusion
– apparent error written in the conclusion
– she apparently didn’t mean what she wrote
– an apparently incorrect and misleading statement conflating “concentrations” with “gradients”
– if you want to blame me, … , then so be it.
Reading this, I am yet forced to post the last part of my reply to his original “review” on his blog (one which I decided to cut off when posting it on the WryHeat).
“I appreciate all the feedback and skepticism about our results as shown by the commenters here, however I would have to ask the author of the blog entry to try and be more conservative in his summary of this and other scientific studies, especially when he makes claims about the findings that are nowhere in the article itself.”
It might be a bit obvious, but APPARENTLY it needs to be said that a good journalist/reporter that is not a specialist tries to do research on his subject -before- he posts an article and not -after-. It APPEARS that contacting the authors of the article you want to review with tabloid title -before- you actually write it might help you not guess what they APPARENTLY MEAN, but actually know it.
Again, I am sorry for the long reply that is nowhere near the real topic of this discussion about the global carbon cycle and climate change in general. I am afraid my article is also nowhere near closely related to this subject, yet somehow it got mixed into it. I will continue following this discussion, in case there are any more questions.

Alan Robertson
July 30, 2014 5:14 pm

Denica Bozhinova says:
July 30, 2014 at 4:15 pm
________________
Wow! That’s quite a response, Ms. Bozhinova.
Welcome to WUWT. I hope that you will look favorably on our gracious host’s decision to leave this thread unredacted. If you stick around long enough, you will find that this is one of the very few places on the internet where the free and open discussion and exchange of ideas is not just given lip service, but is encouraged and condoned.
Excuse us for wandering away from the original discussion in this thread, as there wasn’t much more to say, while everyone here has a thirst for knowledge and understanding and actively joins the fray at every opportunity which might shed a little light on complex issues.
Ps I’m just some guy and not any kind of a spokesman, or even sure if my level of understanding of climate issues even rises to the level of “layman”.

bw
July 30, 2014 5:40 pm

The pipe analogy is flawed by the assumption that the inlet and outlet are fixed.
Sounds like Houghton has a lot of disciples.
Here is a better analogy. Start with a small river of 100 liters per minute. Sink follows source.
Add a dam, such that the resulting reservoir holds 500 liters. In 5 minutes the reservoir is filled, and 100 liters per minute begin to overflow the dam. Sink and source are again matched. The reservoir is the atmosphere. The river is the natural CO2 fluxes into and out of the atmosphere.
Increase the inlet by 3 liters per minute for a total of 103 liters per minute entering the reservoir.
There is a small increase in the reservoir volume, but the overflow reaches 103 liters per minute almost immediately.
The 3 liters per minute is the anthropogenic addition to the atmosphere/reservoir. The amount of anthropogenic CO2 in the reservoir never exceeds 3 percent of the total volume, and never “accumulates” in the atmosphere past 3 percent. 0.03 times 400ppm is 12 ppm. If the source becomes 104 liters per minute, then the outlet adapts almost immediately. 0.04 times 400ppm is 16 ppm.
There may be a transient (short term delay) in the sink response. The stable isotope and other approaches to analysis of atmosphere CO2 indicate a possible maximum of 25 ppm due to anthropogenic addition, with the remaining 100 ppm increase due to slight shifts in natural sources and sinks. Likely eutrophication or tropical forest destruction, or shifts in deep ocean upwelling.
The bottom line is that there is no evidence that anthropogenic CO2 “accumulates” in the atmosphere, any more than bacterial or bovine CO2 accumulates in the atmosphere. CO2 never accumulates in the atmosphere from any source. CO2 never accumulates in the atmosphere because it is part of a much larger flowing system. Houghton knows this, but would never admit it.

u.k.(us)
July 30, 2014 5:56 pm

Here’s my take:
Denica Bozhinova can nail you to the cross and be nice about it.
Beware.
(one of my bosses mentioned his partner could do the same, without the niceties).

Alan Robertson
July 30, 2014 6:10 pm

bw says:
July 30, 2014 at 5:40 pm
__________________
How does your analogy cope with the fact that CO2 levels have been steadily increasing? If CO2 never accumulates in the atmosphere from any source, then how have pre- industrial levels of atmospheric CO2 risen from 280 ppmv to 400 ppmv?

Nick Stokes
July 30, 2014 6:13 pm

The bottom line to all this is this plot, which shows over time the relation in mass terms between the cumulative CO2 we have emitted, and the mass in the atmosphere. Some people here say it is all coincidence.

Alan Robertson
July 30, 2014 6:21 pm

Nick Stokes says:
July 30, 2014 at 6:13 pm
The bottom line to all this is this plot, which shows over time the relation in mass terms between the cumulative CO2 we have emitted, and the mass in the atmosphere. Some people here say it is all coincidence.
_____________
That’s interesting, but do you have some attribution to the presented plot, other than SkS? The plot may be accurate, but those people don’t enjoy a high (or much of any level,) of credibility.

ferd berple
July 30, 2014 6:23 pm

Luckily the outflow pipes to the biosphere and ocean are in fact a bit bigger (or you could say flexible) and manage to take up a bit of the inflow from the anthropogenic flux. Still, the pool is getting filled up faster and faster.”
===============
I have problems with this model. the outflow pipe grows annually at about 1/2 the rate of human emissions. yet the outflow pipe only sees the growth in cumulative emissions (which has a much lower growth rate than human emissions). somehow from this the outflow pipe is able to isolate the increase in human emissions. this suggests the outflow pipe is a whole lot more than simply flexible. rather it is a dynamic system, aggressively responding to increased nutrient supply, and responding by aggressively increasing its population and mass.

Nick Stokes
July 30, 2014 6:33 pm

Alan Robertson says: July 30, 2014 at 6:21 pm
“That’s interesting, but do you have some attribution to the presented plot, other than SkS”

It’s the best plot I could find that puts both, with a comparable mass scale, on the same graph. Here is the standard plot of cumulative emissions (in Gton C, mult by 3.666 to get Gton CO2). The CO2 curve is in many places.
You can easily check the numbers. There is no fancy math involved.

Alan Robertson
July 30, 2014 6:39 pm

Nick Stokes says:
July 30, 2014 at 6:33 pm
________________
Thanks.

July 30, 2014 7:23 pm

richardscourtney says:
July 30, 2014 at 12:33 pm
Phil.:
I see that you again demonstrate your self delusion with your post at July 30, 2014 at 11:53 am.
I have NOT been “shown to be wrong” and I would be grateful if I were.

Are you still claiming that a 26% change is ‘minute’?
I am content to discuss matters with knowledgeable and honourable people who disagree with me such as Ferdinand.
There is no way I will lower myself to engage with you.

That would be a move up in class for you, unfortunately you can’t handle it so you keep spouting the same old mistakes just like here.
I have made that mistake before when I have always discovered the truth of the old maxim, “Never wrestle with a greasy pig: you can’t win and the pig likes it”.
You can’t win because you’re wrong!

Mervyn
July 30, 2014 7:25 pm

3% or 3.75% … it makes not much difference to its contribution to the greenhouse heat effect (GHE). Simple arithmetic demonstrates that, at best, this 3% is responsible for about 0.11 of 1% of the total GHE.
95% of the GHE is due to water in the atmosphere. 5% of the GHE is due to greenhouse trace gases, which CO2 represents 72% … i.e. CO2 represents 3.6% (5% x 72%) of the GHE.
IPCC AR4 asserted that 97% of CO2 entering the atmosphere each year is from natural sources while 3% is from human activity.
Therefore at best, the human contribution to the GHE is 0.11 of 1% (3.6% x 3%) of the total GHE.
If we double, triple or quadruple human CO2 emissions, it would still have no real effect on temperature.
The EPA is barking up the wrong tree with what it is trying to do at the beck and call of Obama!

July 30, 2014 8:36 pm

Denica Bozhinova says:
July 30, 2014 at 4:15 pm
>>>>>>>>>>>>>>>>>
Thanks for dropping in and providing valuable commentary. I hope that you keep coming back. This forum is frequented by a spectrum of participants whose science credentials range from world leaders in their respective fields to complete kooks. It doesn’t take long to figure out which ones are which. Discussing (arguing?) the science with the kooks is, alas, a fruitless task, though it must sometimes be undertaken if for no other reason than to set the record straight for those who are new to the forum. But for every loud mouthed kook there are hundreds who read, listen, and learn, though they may sometimes disagree with you, and as I am sure you are aware, when it comes to contentious issues, learning is a two way street.

Janice Moore
July 30, 2014 10:10 pm

Re: “Luckily the outflow pipes to the biosphere and ocean are in fact a bit bigger… .” Denica Bozhinova (4:15pm) quoted above by Ferd Berple (with excellent commentary) at 6:23pm:
While this dryly humorous understatement brings a chuckle to the informed, it may mislead some readers if not clarified.
(Times in brackets are from video of Dr. Murry Salby’s April, 2013, Hamburg lecture — English after Deutsche intro — posted below)
Native Sources of CO2 – 150 (96%) gigatons/yr — Human CO2 – 5 (4%) gtons/yr
(native = 2 orders of magnitude greater than human)
{37:01} Native Sinks Approximately* Balance Native Sources (net CO2) —
— *Approximately = even a small imbalance can overwhelm any human CO2.
– What controls atmospheric CO2 is net emission from ALL sources and sinks. {33:47}
– {39:40} High CO2 values (per SCIAMACHY satellites), i.e., big CO2 sources, are NOT in industrialized nor highly populated regions; they are in Amazon basin, tropical Africa, and SE Asia.
(Note: Since many native sources also involve Carbon 13, leaner than in the atmosphere, “ALL BETS ARE OFF.”) {37:34}
Dr. Murry Salby — Hamburg, Germany, April, 2013

July 30, 2014 10:41 pm

Denica Bozhinova says:
July 30, 2014 at 4:15 pm
I will continue following this discussion, in case there are any more questions.
>>>>>>>>>>>>>>>>>>>>>>.
1. A link to the original article would be appreciated.
2. The table appears to have been published in 2003, and is based on IPCC data from 2001. Is this correct?
3. If 2. above is correct, I’d think that is data that is nearly stale. Instrumentation has improved significantly since then, and another decade’s worth of data is causing us to rethink many other aspects of the earth system as a whole. Can you comment on that aspect?

Nick Stokes
July 30, 2014 10:52 pm

davidmhoffer says: July 30, 2014 at 10:41 pm
The paper is published online here. The table was introduced by one of the bloggers, not Dr Bozhinova.

July 30, 2014 11:23 pm

Nick Stokes says:
July 30, 2014 at 10:52 pm
davidmhoffer says: July 30, 2014 at 10:41 pm
The paper is published online here. The table was introduced by one of the bloggers, not Dr Bozhinova.
>>>>>>>>>>>>>>>>>>>>>>.
Thanks Nick. I read the paper and then re-read the article above. As you said, it was a blogger who claimed that the table supported the paper which is downright silly. Confused the day lights out of me before I clued in. Dr Bozhinova’s response (now in context) is quite correct. (No need to respond to my previous questions Dr Bozhinova, I gots it all figured out now).
An unfortunate bit of confusion instigated by bad journalism. I applaud Anth_ny for leaving it up, I fear we jump to conclusions in this forum too often, and this is a lesson learned. On the other hand, it has been some time since we were last treated to a serious dust up between Richard and Ferdinand, which I always find both educational and amusing, so there are some positive results as well.

July 31, 2014 12:07 am

Alan Robertson says:
July 30, 2014 at 6:21 pm
Here is the plot of emissions and CO2 increase, together with temperature since 1900:
http://www.ferdinand-engelbeen.be/klimaat/klim_img/temp_co2_acc_1900_2011.jpg
emissions inventory from DOE and others and CO2 increase from Mauna Loa.
The ratio between human emissions and increase in the atmosphere is remarkably constant:
http://www.ferdinand-engelbeen.be/klimaat/klim_img/acc_co2_1900_cur.jpg
probably because the human emissions increased slightly quadratic over time. That gives a slightly quadratic increase in the atmosphere and a slightly quadratic increase in sink rate.
That the increase in the atmosphere induces an increase in sink rate in a quite constant ratio shows that the whole carbon cycle behaves as a simple first order linear process.
Something people like Bart and DesertYote don’t see as they are overfocused on the short term variability caused by temperature variations, which has very little to do with the longer term increase of CO2.

July 31, 2014 12:13 am

Denica Bozhinova says:
July 30, 2014 at 4:15 pm
Thanks a lot for the clarification…
I had already reacted on HS ‘blog, but my comments disappeared together with the article.
As always, I am interested in new research that sheds light on different aspects of the carbon cycle, but as you have experienced now, a lot of people have difficulties to make a differentiation between (parts of) a cycle and the net result at the end of the full cycle…

Bart
July 31, 2014 12:19 am

Ferdinand Engelbeen says:
July 30, 2014 at 12:45 pm
“That means that the short term variability and the long term increase of the CO2 rate of change are completely disconnected and the first can’t be used as proof that the second also is caused by temperature.”
That is completely unphysical. They are completely accounted for by the temperature relationship, and you cannot “disconnect” those components of the temperature impetus without some physical mechanism, and that physical mechanism has to high pass “filter” the low frequency components of the temperature variation out and – this is the impossible part – leave no trace of phase distortion in doing so. If you had a deep understanding of feedback systems in general, you would know that your proposal is physically impossible.
“Thus while the short term variability of CO2 is largely caused by temperature variability, there is not the slightest reason to assume that the current 100+ ppmv CO2 increase is caused by temperature…”
Except that they match, for all practical purposes, perfectly. Which is overwhelming reason to believe that the current 100+ ppmv CO2 increase is caused by temperature dependent natural pumping action into the atmosphere.
You cannot explain why CO2 is currently increasing in the atmosphere at essentially constant rate, while emissions are accelerating. I can. You lose.
Ferdinand Engelbeen says:
July 30, 2014 at 12:52 pm
When will you get it in your head once and for all that this proves nothing? This is your silly “mass balance” argument.
Natural sink activity is a response to forcing from all sources. Therefore, you cannot look at natural sink activity and say that it would be the same if you were to remove the human inputs. That is a portion of that sink activity which is a response to human inputs. Take away the human inputs, and the sink activity goes down.
Hence, your “Y” variable is composed of two components, Y1 from natural forcing, and Y2 from anthropogenic forcing. You need to know X – Y1 to conclude nature is a net sink. But, you do not have the information available to solve for Y1.

Bart
July 31, 2014 12:22 am

Denica Bozhinova says:
July 30, 2014 at 4:15 pm
“This pipe does not have outflow to balance it, so it’s net contribution is in fact the entire inflow of it to the pool”
This is not how a feedback system works. Your argument has no merit. Sorry.
bw says:
July 30, 2014 at 5:40 pm
“The pipe analogy is flawed by the assumption that the inlet and outlet are fixed.”
Exactly. Your explanation describes how a feedback system works. Others, take heed.
Alan Robertson says:
July 30, 2014 at 6:10 pm
“If CO2 never accumulates in the atmosphere from any source, then how have pre- industrial levels of atmospheric CO2 risen from 280 ppmv to 400 ppmv?”
By a shift in the natural equilibrium level brought on by some natural event which effectively has created a temperature dependent pumping action into the atmosphere in the modern era.

Bart
July 31, 2014 12:23 am

Nick Stokes says:
July 30, 2014 at 6:13 pm
A superficial, low order polynomial match, with artful graphics to promote a predetermined conclusion. Emissions do not match the short term variations like temperature does. And, the spurious, low order polynomial match with emissions is now diverging.

July 31, 2014 12:29 am

bw says:
July 30, 2014 at 5:40 pm
There is a small increase in the reservoir volume, but the overflow reaches 103 liters per minute almost immediately.
That is the main error that you and Bart make; the increase in sink rate is not immediately.
The fact that there is a measured increase in the atmosphere already proves that the CO2 sinks can’t accommodate with an increase in inflows and only increase their output if the atmospheric pressure increases.
That isn’t 100% proof that humans are the cause, but to accommodate the 3-fold increase of human emissions over the past 50 years, the natural cycle should have increased a 3-fold too to give the increased pressure necessary to increase the sink rate in ratio with human emissions.
But there is not the slightest sign that the natural cycle increased a threefold: not in residence time (which slightly increased), not in 14C/12C ratio, not in 13C/12C ratio, oxygen use, seasonal amplitude,…

July 31, 2014 12:44 am

Bart says:
July 31, 2014 at 12:19 am
That is completely unphysical. They are completely accounted for by the temperature relationship, and you cannot “disconnect” those components of the temperature impetus without some physical mechanism, and that physical mechanism has to high pass “filter” the low frequency components of the temperature variation out and – this is the impossible part – leave no trace of phase distortion in doing so.
Bart, it is proven from the δ13C – CO2 rate of changes match that almost all of the short term variability is from (tropical) vegetation. It is proven from the oxygen balance that vegetation is an increasing net sink for CO2. Thus the short term variability and the long term trend have nothing to do with each other, they are from different processes.
You have no proof at all that the trend is temperature related. If the trend is not temperature related then there is no phase distortion of the short term variability.
In this case there are a lot of indications that the trend is mainly caused by human emissions, thus the observed CO2 rate of change is the sum of temperature caused variability and human caused increase in CO2 rate of change.

Nick Stokes
July 31, 2014 12:48 am

Bart says: July 31, 2014 at 12:23 am
“A superficial, low order polynomial match, with artful graphics to promote a predetermined conclusion.”

There’s no polynomial matching. It’s just ppmv CO2 from Law Dome (CDIAC Etheridge data), Mauna Loa (annual average) and CDIAC emissions data (Boden). 1 ppmv CO2 = 2.13 Gtons C. If you don’t like artful graphics, here is mine.
But yes, it is conclusive.

Bart
July 31, 2014 1:02 am

Ferdinand Engelbeen says:
July 31, 2014 at 12:44 am
” If the trend is not temperature related then there is no phase distortion of the short term variability.”
No. There is a trend in temperature. To remove it, and prevent it from causing a trend in the rate of change of CO2, you would have to filter it out by some exotic process, and that exotic process would have to leave no mark of phase distortion. There is another name for such an exotic process: an impossible process.
Nick Stokes says:
July 31, 2014 at 12:48 am
“There’s no polynomial matching.”
N’enculons pas des mouches. It is inherent in the display. You are looking at two series which have a superficial, low order polynomial type similarity. It is entirely spurious. And, it is diverging.

Nick Stokes
July 31, 2014 1:14 am

Bart says: July 31, 2014 at 1:02 am
“And, it is diverging.”

No, there’s no divergence. Here is the Scripps version of your plot. The match is excellent. It’s not a coincidence.

Bart
July 31, 2014 1:23 am

Nick Stokes says:
July 31, 2014 at 1:14 am
Yes, it is diverging. That is not a “version” of my plot. It is an integration of my plot. It obscures the fact that the emissions are rising super-linearly, while atmospheric concentration is rising only linearly, but you can still make it out if you look closely at the past decade plus, i.e., over the time interval in which global temperatures have stalled.
Come on, Nick. You’re not this stupid. You know perfectly well that all the information in the integral in contained in its derivative, modulo the integration constant. Look at my plot again. The divergence is stark here, when it is on a scale where you can make it out. Stop trying to obfuscate, and deal with what the data are telling us.

tonyb
Editor
July 31, 2014 1:35 am

Alan Robertson said;
‘Wow! That’s quite a response, Ms. Bozhinova. Welcome to WUWT. I hope that you will look favorably on our gracious host’s decision to leave this thread unredacted.”
I endorse that comment. It is good to see the author come over to clarify the content, although as she would have noted the problems were picked up very quickly and noted by our host.
Leaving the thread in place has generated some useful discussion. As someone else mentioned it has been a little while since we have been entertained so royally by Richard and Ferdinand.
I hope Ms. Bozhinova.will come over again or even consider submitting an article here?
tonyb

Nick Stokes
July 31, 2014 1:43 am

Bart says: July 31, 2014 at 1:23 am
“Look at my plot again. The divergence is stark here, when it is on a scale where you can make it out.”

The “divergence” is basically a scale factor. To match the plots, you have to rescale to take account, in effect, of the airborne fraction. Scripps chose 57% (by fitting). You have chosen a factor in which the slope of the blue emissions is greater than the green. It isn’t diverging; it’s not properly matched. This would be more obvious if you deseasonalized the ppmv.

richardscourtney
July 31, 2014 1:51 am

Denica Bozhinova:
I write to support all others who have greeted your arrival here. I draw especial attention to the posts to you from Alan Robertson and the two from davidmhoffer.
Richard

richardscourtney
July 31, 2014 1:53 am

Phil.:
If it makes you happy to think it, then you ‘won’. OK?
Now, be a dear and tidy up your room yourself because I have no intention of going near it.
Richard

July 31, 2014 2:54 am

Bart says:
July 31, 2014 at 12:23 am
Again distorting the match between emissions and increase in the atmosphere by using different units? Here the real plot with the same units:
http://www.ferdinand-engelbeen.be/klimaat/klim_img/dco2_em4.jpg
increase in the atmosphere as function of human emissions still is largely within natural variability…

July 31, 2014 3:20 am

Bart says:
July 31, 2014 at 1:02 am
Bart, the short term influence of temperature on CO2 is 4-5 ppmv/°C
The historical influence from decades to multi-millennia is 8 ppmv/°C
The entire temperature trend since 1959 is 0.6°C, good for maximum 5 ppmv CO2 increase. That is all. Hardly visible in the 80 ppmv increase over the same time frame.
Or if you want it in the derivative: no trend in the derivative and only a small offset of 0.1 ppmv/year above zero, hardly influencing the natural, temperature caused year by year variability of +/- 2 ppmv.
As your “match” between temperature and the trend of the CO2 derivative is entirely spurious, either you have to distort the amplitude of the variability, or you have no match between the slopes. The two processes have nothing to do with each other, but you combine them with the same factor.

July 31, 2014 3:55 am

Alan Robertson says:
July 30, 2014 at 11:42 am
Hello Mr. Cogar,
Yet, with your response, you didn’t say one single thing to contradict my statement that the planet’s biosphere is greening and biomass increasing.

————-
Alan R, there was no reason for me to contradict that part of your statement concerning “greening n’ increasing”.
I disagreed with the “indicates” part of this part of your statement, to wit:
…. which indicates that annual CO2 bio- uptake outpaces CO2 release from the biosphere.
——————-
Alan R, just because they have determined there has been an increase in biosphere “greening” due to the “warming” of the climate and the subsequent annual increase in atmospheric CO2 ….. does not prove, infer, suggest or indicate that ….. biomass absorption of CO2 outpaces biosphere emissions CO2 .
If the climate warms, …… then the “growing season” greening is extended in the northern latitudes, …. the microbial ingesting of dead biomass increases, …. permafrost melting increases, …. microbial ingesting of the thawed-out dead biomass increases ….. and the average temperature of the water in the ocean and large lakes increases, …… with all-the-above except for the “greening” emitting CO2 into the atmosphere.
Alan R, if you look at this Keeling Curve graph, http://i1019.photobucket.com/albums/af315/SamC_40/keelingcurve.gif
…. and specifically at that average 6 ppm bi-yearly cycling (sawtooth) of atmospheric CO2, that is, IMLO, ….. the seasonal “heartbeat” of the world’s ocean waters.

July 31, 2014 5:08 am

Samuel C Cogar says:
July 31, 2014 at 3:55 am
Samuel, we have been there before:
The decay of recent organics can’t outpace the uptake by plants over a longer period of time, simply because the decay would get out of fuel.
All decay, plant use as food or feed, burning of wood etc. only can emit what is already was sequestered in the months to decades before. Thus temporarily you can have a disequilibrium between the two, but over longer runs, that will go at the cost – or benefit – of total vegetation.
Before 1990, the biosphere was near neutral to a small emitter of CO2. After 1990 it became a net increasing sink for CO2, thus more uptake than decay.
and specifically at that average 6 ppm bi-yearly cycling (sawtooth) of atmospheric CO2, that is, IMLO, ….. the seasonal “heartbeat” of the world’s ocean waters.
No, it is the heartbeat of the NH forests: if it were the oceans, the δ13C and CO2 levels would go up and down together. If the biosphere is responsible, δ13C and CO2 levels will go up and down in opposite ways, which is the case here:
http://www.ferdinand-engelbeen.be/klimaat/klim_img/seasonal_CO2_d13C_MLO_BRW.jpg

July 31, 2014 5:09 am

Ferdinand Engelbeen says:
July 30, 2014 at 1:34 pm
I have no problems with the unknowns, because the only solution needed is -2, which is all what counts for the increase or decrease of CO2 in the atmosphere.
No matter if X = 150 and Y = 152 or X = 300 and Y = 302

—————–
Your employment of “fuzzy reverse-mathematics” ….. is highly unProfessional, to say the least.
================
Ferdinand Engelbeen says:
July 30, 2014 at 1:48 pm
I was talking about the year by year <I<variability of the human emissions. Human emissions indeed are increasing, but the year by year variability and the increase rate from one year to next year is maximum 0.2 ppmv.
—————-
Ferdinand, “weazelwording” rhetoric doesn’t impress me either.
The sole reason that you are referring to human emissions of CO2 as being a “variability” …… is that you don’t have a frigging clue as to what the actual quantity of those emissions are.
In fact, me thinks you used “reverse mathematics” to guesstimate your “max 0.2 ppmv” figure.

Denica Bozhinova
July 31, 2014 5:43 am

Thank you for the welcome and I apologize if I was a bit harsh in my previous reply. I also do not claim that the pool & pipe analogy is perfect model of the system – it was supposed to be an example of why not only the gross in/outflow are important but also the net contribution of each source.
Another thought, which I did not really see so far brought up in the current discussion – when dealing with idealized box models of the carbon cycle sometimes people forget that the different sources and sinks are actually located in different places over the globe. The ocean will emit and absorb CO2 that is located over the ocean – which means it will absorb mostly CO2 that is already there, or one that requires time to be transported through the atmosphere to those locations. The anthropogenic emissions are located mostly over land in industrialized or highly populated areas, while the big sinks in the biosphere are located in rural areas or in the tropics. It takes time for the anthropogenic CO2 to travel to the places of the biggest natural assimilation. By the time they get there, usually the recently added anthropogenic fraction is well mixed into the atmosphere and it is only a small addition to the recurring biospheric respiration/uptake happening there.

Bart
July 31, 2014 5:53 am

Nick Stokes says:
July 31, 2014 at 1:43 am
“To match the plots, you have to…”
Epicycles.
You are grasping at straws. Why go to such contortions when it is completely unnecessary? This fits, in both the short term and the long, without having to resort to handwaving.

July 31, 2014 5:53 am

Denica Bozhinova: “It takes time for the anthropogenic CO2 to travel to the places of the biggest natural assimilation. By the time they get there, usually the recently added anthropogenic fraction is well mixed into the atmosphere and it is only a small addition to the recurring biospheric respiration/uptake happening there.”
I’ve occasionally wondered whether the locally high concentrations unmeasured by the usual CO2 sensing does not also cause some locally high uptake of some sort that helps explain why half the estimated emissions seem to go unaccounted for. (No doubt this fancy has been thoroughly quashed elsewhere on this site, but I’ve either missed or forgotten it.)

Bart
July 31, 2014 5:57 am

Ferdinand Engelbeen says:
July 31, 2014 at 2:54 am
“Again distorting the match between emissions and increase in the atmosphere by using different units?”
I do not know why this confuses you so. The units has nothing to do with it. My fit is to the first half of the data, to see if it remains true, which it doesn’t. You fit the whole thing, so of course you get a superficial match. You are purposefully fooling yourself.
But, your plot still diverges, with different slopes toward the end of the record.
Ferdinand Engelbeen says:
July 31, 2014 at 3:20 am
“… the short term influence of temperature on CO2 is 4-5 ppmv/°C…”
No, it isn’t. It is very clear that the historical sensitivity in the modern era since 1958 is in units of ppmv/C/unit-of-time. It is an integral relationship. That is an empirical fact.
You are trying to force your model on the data, instead of the data on the model. That is a complete inversion of the scientific method.
“As your “match” between temperature and the trend of the CO2 derivative is entirely spurious, either you have to distort the amplitude of the variability, or you have no match between the slopes.”
It’s a plemty good fit, astoundingly good for the quality of the data, and the bulk measurements involved. You a trying to enforce a completely arbitrary standard.
“The two processes have nothing to do with each other, but you combine them with the same factor.”
Quite the contrary, the fact that you can match both components with the same scale factor is compelling evidence that a temperature dependent process is what is in the driver’s seat.

July 31, 2014 6:04 am

Samuel C Cogar says:
July 31, 2014 at 5:09 am
Samuel, I did do my best to explain why I think that human emissions are to blame for the recent increase of CO2 in the atmosphere. If you don’t like my explanations, please say where I am wrong, based on observations.
As far as I know, human emissions are quite well known, based on quantities sold by refineries, coal mines and gas exploration firms. If anything, they can be underestimated, not overestimated. Thus worst case, humans emit more than twice the observed increase in the atmosphere.
You may not like my math – which I learned over 55 years ago, but for the C balance it is completely unimportant what the different fluxes are doing during the year. What is important is what the result is at the end of the year: increase, decrease or even. That is what changes the CO2 content of the atmosphere. Not any individual in or out flux.
Thus the only point needed in the whole C balance is the -2 ppmv +/- 1 ppmv/year difference between human emissions and increase in the atmosphere.
is that you don’t have a frigging clue as to what the actual quantity of those emissions are
The year by year emissions inventory can be downloaded from:
http://cdiac.ornl.gov/trends/emis/tre_glob.html up to 2008
and
http://cdiac.ornl.gov/GCP/carbonbudget/2013/ for references to more recent years
If you look at the year by year variability, that is less than 0.2 ppmv.
The lack of variability of the human emissions is important, because some people think that human emissions are not responsible for the increase in the atmosphere as there is no detectable (smaller than 0.1 ppmv) human variability in the rate of change of CO2 in the atmosphere, only a relative huge (+/- 1 ppmv) natural variability.

July 31, 2014 6:20 am

Janice Moore says:
July 30, 2014 at 10:10 pm
While this dryly humorous understatement brings a chuckle to the informed, it may mislead some readers if not clarified.
– {39:40} High CO2 values (per SCIAMACHY satellites), i.e., big CO2 sources, are NOT in industrialized nor highly populated regions; they are in Amazon basin, tropical Africa, and SE Asia.

——————–
Clarification of the above would be nice, ….. but an explanation would be better, ….. as to why and/or how those satellites determined that some of the “warmest” places on the surface of the earth …… were also the biggest sources of CO2.
If the above said CO2 sources are the result of CO2 emissions from the decomposing dead biomass …. then should not the CO2 absorption by the live biomass be “equal to” the aforesaid emissions …. thus resulting in a “net 0 (zero)” CO2 increase in the upper atmosphere?

July 31, 2014 6:43 am

Bart says:
July 31, 2014 at 5:57 am
I do not know why this confuses you so.
Bart, it seems quite difficult to convince you that you fool yourself:
In your plot the emissions are in Mt/year of CO2. The rise of CO2 is plotted in ppmv/month. If you convert the Mt/year into ppmv/month (factor 1/2120/12) and plot them again, you have the real comparison as I have plotted with the same units: human emissions still about twice the increase in the atmosphere (here in ppmv/year with 12-month running mean for CO2 rate of change):
http://www.ferdinand-engelbeen.be/klimaat/klim_img/dco2_em4.jpg
Your plot gives a false impression of decreasing airborne fraction because you used different units.
No, it isn’t. It is very clear that the historical sensitivity in the modern era since 1958 is in units of ppmv/C/unit-of-time. It is an integral relationship. That is an empirical fact.
No, that is whole point of the discussion: there never is or was a sensitivity as ppmv/°C/unit of time. There always was a clear sensitivity of 4 to maximum 8 ppmv/°C independent of time or lag. The latter even over thousands of years between glacials and interglacials and back. Your integration is only based on the good match between T (again, in fact dT/dt) variability and dCO2/dt variability, while the slope of dCO2/dt has nothing to do with T. The variability of dCO2/dt is caused by dT/dt, with a pi/2 lag, not by T. If you integrate dT/dt that will give maximum 5 ppmv CO2 over the past period and the full variability of dCO2/dt:
http://www.ferdinand-engelbeen.be/klimaat/klim_img/temp_dco2_d13C_mlo.jpg
the fact that you can match both components with the same scale factor is compelling evidence that a temperature dependent process is what is in the driver’s seat.
The proven fact that slope and variability are from different processes confirms that the “match” is entirely spurious. If the slope changes you need to adjust the matching factor which also changes the amplitude of the variability, while amplitude and slope have nothing to do with each other.

Alan Robertson
July 31, 2014 6:44 am

Samuel C Cogar says:
July 31, 2014 at 3:55 am
“Alan R, just because they have determined there has been an increase in biosphere “greening” due to the “warming” of the climate and the subsequent annual increase in atmospheric CO2 ….. does not prove, infer, suggest or indicate that ….. biomass absorption of CO2 outpaces biosphere emissions CO2 .”
______________________
Topsoil.

July 31, 2014 7:53 am

Ferdinand Engelbeen says:
July 31, 2014 at 6:04 am
Samuel, I did do my best to explain why I think that human emissions are to blame for the recent increase of CO2 in the atmosphere.
—————
Ferdinand, I know you did your best., …. but oftentimes one’s best is not the “bestest” best.
And iffen that was not a “truism” …. then there would never be a need to obtain the services of a consultant.
================
If you don’t like my explanations, please say where I am wrong, based on observations.
—————-
Ferdinand, that is easy enough for me to do ….. just by “observing” your next comment, to wit:
==============
As far as I know, human emissions are quite well known, based on quantities sold by refineries, coal mines and gas exploration firms. If anything, they can be underestimated, not overestimated.
——————
Ferdinand, your above said “As far as I know” …. and …. “are quite well known” …. is/are equivalent to a “consensus of opinion(s)” ….. and therefore has no basis in supporting proof or evidence of actual, factual science.
And secondly, to first state that … “quantities sold are quite well known” …. and then assert that the aforesaid “quantities sold” ….. could very well be UNDERESTIMATED, … but surely not OVERESTIMATED, …… is asinine, silly and/or idiotic.
Well known estimations ….. is a dog that won’t hunt.
That is, unless you are playing “Sciency Horseshoes” …. where anything that is reasonably close or not too far way …. “counts” as an honest-to-goodness “fact of science”.
Ferdinand, in all of the above postings there are very few actual, factual “numerical” quantities being discussed. And if one is not employing actual, factual “numerical” quantities in their calculations ….. then they should not be claiming, inferring or asserting that the results of their calculations are factual evidence or proof of anything.
“Averages” are NOT actual “numerical” quantities of anything. They are abstract “numbers” that represent the mean or medium value of a specific number “set” or group of numbers and should only be used as “reference” information of or about a “past” event.

July 31, 2014 8:24 am

Samuel C Cogar says:
July 31, 2014 at 7:53 am
It is not because I am expressing my thoughts in a civil manner, that they are mere opinions…
There are inventories of fossil fuel use and its CO2 emissions. That is a fact.
They may be underestimated not overestimated. That is an opinion, based on the human nature to avoid taxes.
The inventories thus are the absolute minimum of the human emissions. That is a fact.
That minimum is larger than what is measured as increase in the atmosphere. That is a fact.
The difference between increase in the atmosphere and human emissions is what nature absorbs. That is a fact.
At minimum nature was a continuous and increasing sink for CO2 over the past 55 years. That is a fact.
Thus the net contribution of nature to the increase of CO2 in the atmosphere was?

July 31, 2014 8:42 am

Ferdinand Engelbeen says:
July 31, 2014 at 5:08 am
Samuel, we have been there before:
No, it is the heartbeat of the NH forests: if it were the oceans, the δ13C and CO2 levels would go up and down together. If the biosphere is responsible, δ13C and CO2 levels will go up and down in opposite ways, which is the case here:

—————–
“YES”, we have.
But you went “POOF”, like the Magic Dagon and did not respond to my post discrediting your unsupported “tripe n’ piffle” …. which I posted on January 14, 2014 at 10:01 am at this url link address, to wit:
http://wattsupwiththat.com/2014/01/09/now-its-the-fungi-carbon-footprint-that-isnt-in-climate-models/#comment-1535697
Ferdinand, “running n’ hiding” doesn’t prove you are correct.

July 31, 2014 9:25 am

Ferdinand Engelbeen says:
July 31, 2014 at 8:24 am
The inventories thus are the absolute minimum of the human emissions. That is a fact.
That minimum is larger than what is measured as increase in the atmosphere. That is a fact.

——————-
YUP, and the minimum that nature emits into the atmosphere is far greater than what fossil fuel burning emits into the atmosphere and thus far, far larger than what is measured as increase in the atmosphere. That is also a fact.
And ps, none of your stated facts in the above referenced post explains that “steady n’ consistent” occurring 55 years of an average 1 to 2 ppm increase in atmospheric CO2.
Will you be attributing it to the actions of the Flying Spaghetti Monster?
Here, Ferdinand, …. explain this, to wit:
Year and Month of Maximum yearly CO2 ppm data
year month CO2 ppm
1979 6 1979.458 339.20
1980 5 1980.375 341.47
1981 5 1981.375 343.01
1982 5 1982.375 344.67
1983 5 1983.375 345.96
1984 5 1984.375 347.55
1985 5 1985.375 348.92
1986 5 1986.375 350.53
1987 5 1987.375 352.14
1988 5 1988.375 354.18
1989 5 1989.375 355.89
1990 5 1990.375 357.29
1991 5 1991.375 359.09
1992 5 1992.375 359.55 Pinatubo
1993 5 1993.375 360.19
1994 5 1994.375 361.68
1995 5 1995.375 363.77
1996 5 1996.375 365.16
1997 5 1997.375 366.69
1998 5 1998.375 369.49 El Niño
1999 4 1999.292 370.96
2000 4 2000.292 371.82
2001 5 2001.375 373.82
2002 5 2002.375 375.65
2003 5 2003.375 378.50
2004 5 2004.375 380.63
2005 5 2005.375 382.47
2006 5 2006.375 384.98
2007 5 2007.375 386.58
2008 5 2008.375 388.50
2009 5 2009.375 390.19
2010 5 2010.375 393.04
2011 5 2011.375 394.21
2012 5 2012.375 396.78
2013 5 2013.375 399.76
You can include the 1958 thru 1978 data iffen you want …. but it will “track” likewise, “steady n’ consistently”.

July 31, 2014 9:33 am

Samuel C Cogar says:
July 31, 2014 at 8:42 am
But you went “POOF”, like the Magic Dagon and did not respond to my post discrediting your unsupported “tripe n’ piffle”
That is a discussion of January? Maybe I missed that.
It is quite simple: almost all CO2 processes in the biosphere are directly linked to oxygen: any uptake by plants releases oxygen. Almost all bacterial, fungal, insect, animal use of plants needs oxygen. Thus based on the oxygen use measured in the atmosphere and the oxygen use by fossil fuels, one can calculate how much net CO2 was captured or released by the whole biosphere. That has nothing to do with the isotopic composition of oxygen in water.
All CO2 processes in the biosphere prefer 12CO2 above 13CO2. Some kind of plants more than others, but anyway, if plants absorb CO2 they use relative more 12CO2 than is in the atmosphere, thus leaving relative more 13CO2 in the atmosphere. Conversely, plant decay will release low 13C CO2 as that was built in (as good as in fossil fuels).
On the other side, the 13C/12C ratio of the oceans is a lot higher than In the atmosphere. Even taking into account the faster release of 12CO2 from ocean waters, ocean releases still will increase the 13C/12C ratio of the atmosphere.
Thus in summary: more CO2 coming from the oceans will increase the 13C/12C ratio of the atmosphere. More CO2 coming from the biosphere (vegetation decay/consumption) will decrease the 13C/12C ratio of the atmosphere.
That makes it easy to know the (natural) cause of an increase or decrease of CO2 in the atmosphere.

July 31, 2014 9:43 am

Samuel C Cogar says:
July 31, 2014 at 9:25 am
Samuel, again, the total amounts of CO2 cycling through the atmosphere are completely irrelevant for the end result after a full cycle. What is relevant is how much of the full cycle remains in the atmosphere and that is negative over the past 55 years. That is not constant, but variable: starting around -0.5 ppmv in 1959 and increasing to currently -2 ppmv with a variability of +/- 1 ppmv around the increase in uptake:
http://www.ferdinand-engelbeen.be/klimaat/klim_img/dco2_em2.jpg

July 31, 2014 9:51 am

The corrected Hockey Schtick post is now converted from draft mode back to published mode at the same original link, including the original comments, and an added big mea culpa/apology/thanks from me for the kind and detailed efforts of the lead author Denika Bozhinova via email and elsewhere in the blogosphere to clarify my misunderstandings:
http://hockeyschtick.blogspot.com/2014/07/new-paper-finds-only-375-of-atmospheric.html
I apologize big time to all for the commotion and confusion that resulted from putting the post in draft mode for what I initially thought would be a short time while having a private email correspondence with the author, but that’s not the way things turned out, so that was the 1st and last time out of 3,500 posts I will ever put a previously published post temporarily back in draft mode. Lesson learned, my apologies, and on the bright side it has stimulated a lot of ongoing discussion of the contribution of man to background CO2 levels even though (soon to be Dr) Bozhinova’s paper does not address that issue.

Alan Robertson
July 31, 2014 10:13 am

Hockey Schtick says:
July 31, 2014 at 9:51 am
__________________
Thanks for the heads- up.

July 31, 2014 11:08 am

richardscourtney says:
July 31, 2014 at 1:53 am
Phil.:
If it makes you happy to think it, then you ‘won’. OK?
Now, be a dear and tidy up your room yourself because I have no intention of going near it.

That’s fine there’s no point arguing anything with you anyway since you’ll never admit your mistakes. Like here for example, anyone with basic math skills can see that 10^0.1 is ~1.26.
Just when you make your usual nonsense posts I’ll rebut them as always in case some reader might think you had a clue about what you’re talking about.

July 31, 2014 11:18 am

Hockey Schtick says:
July 31, 2014 at 9:51 am
Thanks for the clarification and restoration of the comments…
The discussions still goes on, but I like a good fight…

July 31, 2014 11:33 am

Ferdinand Engelbeen says:
July 31, 2014 at 11:18 am
Alan Robertson says:
July 31, 2014 at 10:13 am
Thanks for your kind remarks and ongoing gentlemanly discussions

richardscourtney
July 31, 2014 12:02 pm

Phil.:
re your post at July 31, 2014 at 11:08 am.
Yes, dear. Don’t worry your little head about it. Its only a bad dream. So go back to sleep and let the grown-ups do their things.
Richard

Alan Robertson
July 31, 2014 1:42 pm

Hockey Schtick says:
July 31, 2014 at 9:51 am
_______________________
We take action based on our best guess as to what the “correct” action might be. Except for the most mundane action, (if even then,) we rarely know beforehand what final result of our action might be and only until the act plays out (which can be a very long time,) can we discover if our original action was correct, or if we missed the mark, or if ever, consequence be known.
Without your decision to temporarily close your thread, in concert with our gracious host’s decision to leave this thread open, the lively discussion which took place in this thread may not have happened. As result of this series of events, many people have had the opportunity to increase their understanding and we are richer for the experience. Many thanks for your part in this small bit of the unfolding drama of mankind’s quest for knowledge and understanding.

July 31, 2014 2:24 pm

richardscourtney says:
July 31, 2014 at 12:02 pm
Phil.:
re your post at July 31, 2014 at 11:08 am.
Yes, dear. Don’t worry your little head about it. Its only a bad dream. So go back to sleep and let the grown-ups do their things.

I’ll remind you of site policy:
Respect is given to those with manners, those without manners that insult others or begin starting flame wars may find their posts deleted.

Latitude
July 31, 2014 3:32 pm

you can’t change pH without changing alkalinity…and CO2 moves some protons around but doesn’t change alkalinity
I’m so sick and tried of this ocean acidification pH crap…………

Denica Bozhinova
Reply to  Latitude
July 31, 2014 3:41 pm

This lecture notes in chemistry might help you understand this:
http://ion.chem.usu.edu/~sbialkow/Classes/3650/Carbonate/Carbonic%20Acid.html

Nick Stokes
July 31, 2014 3:50 pm

Latitude says: July 31, 2014 at 3:32 pm
“you can’t change pH without changing alkalinity…and CO2 moves some protons around but doesn’t change alkalinity”

Yes, it moves protons around and some end up on water. It’s a Lewis acid.
Total Alkalinity amounts to total nett charge on species involved in acid-base reactions (HCO3-, H+ etc but not Na+, Cl-). CO2 does not carry charge, and so does not change TA.

Latitude
July 31, 2014 5:39 pm

exactly…it’s called the Principle of Conservation of Alkalinity
every proton that leaves the acid….forms a new carbonate or bicarbonate that adds to the alkalinity
…net change…..zero
I’m sick and tired of ocean acidification

July 31, 2014 6:11 pm

Latitude says:
July 31, 2014 at 5:39 pm
exactly…it’s called the Principle of Conservation of Alkalinity

And Total Alkalinity (TA) is given by something like this:
TA ≡ 2[CO3-2] + [HCO3-] + [H2BO3-] + 2[HBO3-2] + 3[BO3-3]+ [OH-] + [organic/inorganic H+ acceptors] – [H+]
Note the -[H+] term. When CO2 is added the pH goes down (i.e. [H+] increases) so that the alkalinity stays constant. The Conservation of Alkalinity requires that the pH decreases when CO2 is added.

Nick Stokes
July 31, 2014 7:11 pm

There is an interactive gadget where you can try adding CO2 and see what changes. H*, HCO3- increase, CO3– decreases.

Nick Stokes
July 31, 2014 7:12 pm

Sorry, missed the link

Bart
July 31, 2014 10:16 pm

Ferdinand Engelbeen says:
July 31, 2014 at 6:43 am
“In your plot the emissions are in Mt/year of CO2…”
It absolutely does not matter, Ferdinand. All you have to do is cover the labels on the right hand axis, and Presto! same units. This is really basic math.
“Your plot gives a false impression of decreasing airborne fraction because you used different units.”
Nope. And, your rate of emissions is rising for the last decade, while the rate of change of atmospheric concentration is stagnant. You can always change the slope and offset of the emissions so that your line appears to fall within the variability. That proves nothing but your propensity to fool yourself. But, the slopes do not match, at the precise time that temperatures have stagnated.
And, that temperature stagnation falls right on top of the atmospheric CO2 stagnation. Open your eyes. The game is already over. You lost. The longer you remain in denial, the more painful it is going to be when the truth comes home to you.
“No, that is whole point of the discussion: there never is or was a sensitivity as ppmv/°C/unit of time.”
That is flatly contradicted by the evidence.
“If you integrate dT/dt that will…”
That will give you a time series whose variability is 90 degrees out of phase with the variability in the derivative of CO2. You can’t just slop phase around arbitrarily. Natural systems cannot produce a 90 degree phase lag across all frequencies without an integral relationship in the offing. It is math. It is unequivocal.
“The proven fact that slope and variability are from different processes confirms that the “match” is entirely spurious.”
There is no such proof. There is no such spuriousness. It is a fact: in the modern era, CO2 follows the integral of appropriately scaled and baselined mean temperature. It’s not even a close call, and you are wandering around blind. This is as good a match as anyone could hope to get, and it says precisely what it appears to say: atmospheric CO2 is being driven by a temperature dependent natural process, and human inputs have little effect.

Nick Stokes
July 31, 2014 10:35 pm

Bart says: July 31, 2014 at 10:16 pm
“It is a fact: in the modern era, CO2 follows the integral of appropriately scaled and baselined mean temperature.”

So there <a href="mine“>really is a temperature hockey stick? 🙂

August 1, 2014 12:14 am

Bart says:
July 31, 2014 at 10:16 pm
All you have to do is cover the labels on the right hand axis, and Presto! same units.
What you have done is not only using different units, but you also moved the trend of emissions with an offset. Its you who changed the slope (by using different units) and offset, I did plot both on the same scale without any manipulation:
http://www.ferdinand-engelbeen.be/klimaat/klim_img/dco2_em4.jpg
Which shows that there is hardly any change in “airborne fraction” if you follow the 53% line. The red line is the residual CO2 as function of the extra (total) CO2 pressure in the atmosphere and temperature changes. That is the real process giving the sink rate and thus the residual increase in the atmosphere, the 53% is just coincidence.
That is flatly contradicted by the evidence.
That is not evidence, that is (not even so good) curve fitting, where either the amplitude or the variability of the slopes match and only by coincidence both, as slope and variability are caused by totally independent processes.
That will give you a time series whose variability is 90 degrees out of phase with the variability in the derivative of CO2. You can’t just slop phase around arbitrarily. Natural systems cannot produce a 90 degree phase lag across all frequencies without an integral relationship in the offing.
Yes, it gives a 90 deg. out of phase for the simple reason that CO2 changes follow T changes with 90 deg. If you take the derivatives they both will shift back 90 deg., still the same lag. But it is the integration of dT/dt which gives you the temperature increase of 0.6°C accompanied by 5 ppmv CO2 increase. Not the 100+ ppmv. And the full variability of the CO2 rate of change, without problems of non-matching slopes or non-matching amplitudes.
There is not the slightest indication of a physical process in the past or present where CO2 will continue to be released by a sustained temperature difference without feedback from the whole CO2 cycle. That is not the way that an equilibrium process works…
There is no such proof. There is no such spuriousness.
Bart, the short time variability is caused by the influence of temperature on vegetation. That is a proven fact.
Since 1990, vegetation is an increasing net absorber of CO2 over the longer term. That is a proven fact. The slope of the CO2 rate of change from vegetation thus is either flat or negative.
Thus it is a proven fact that slope and variability of the CO2 rate of change are from different processes.
Of course, if you don’t accept any evidence that contradicts your theory, then there is no discussion possible…

richardscourtney
August 1, 2014 2:24 am

Phil.:
I take severe exception to your post at July 31, 2014 at 2:24 pm which says to me

I’ll remind you of site policy:
Respect is given to those with manners, those without manners that insult others or begin starting flame wars may find their posts deleted.

Site policy does NOT approve your pestering of me.
I have repeatedly told you to stop pestering me but you childishly persist.
So, I have adopted the policy of replying in appropriate manner to your childish behaviour.
Now, dear, pack up your toys and be good.
Richard

richardscourtney
August 1, 2014 2:34 am

Nick Stokes:
Many thanks for your excellent “widget” which you link July 31, 2014 at 7:12 pm.
It is useful, easy to use and fun to pl;ay with. I was not aware of it and I commend everyone to look at it.

It is a superb demonstration of the ‘ocean acidification’ issue.

However, this thread is about affects of anthropogenic CO2 on atmospheric CO2 concentration.
Richard

Nick Stokes
August 1, 2014 4:24 am

richardscourtney says: August 1, 2014 at 2:34 am
Thanks

August 1, 2014 5:27 am

richardscourtney says:
August 1, 2014 at 2:24 am
Phil.:
I take severe exception to your post at July 31, 2014 at 2:24 pm which says to me
I’ll remind you of site policy:
Respect is given to those with manners, those without manners that insult others or begin starting flame wars may find their posts deleted.
Site policy does NOT approve your pestering of me.
I have repeatedly told you to stop pestering me but you childishly persist.
So, I have adopted the policy of replying in appropriate manner to your childish behavior.

Tough, when you post nonsense you can be expect to have it corrected. The solution is in your own hands, don’t post nonsense. Claiming that a 26% change in [H+] is ‘minute’ is nonsense for example.

August 1, 2014 5:59 am

Ferdinand Engelbeen says:
July 31, 2014 at 9:33 am
Almost all bacterial, fungal, insect, animal use of plants needs oxygen. Thus based on the oxygen use measured in the atmosphere and the oxygen use by fossil fuels, one can calculate how much net CO2 was captured or released by the whole biosphere.
—————
OH GOOD GRIER, …. Ferdinand, you don’t have a clue as to what all the “sinks n’ sources n’ quantities” are for CO2 ….. and now you are inferring that you know EXACTLY what all the “sinks n’ sources n’ quantities” are for O2 ….. thus permitting you to accurately calculate/determine said “sinks n’ sources n’ quantities” for the CO2.
Do you really not know how to spell “circular reasoning”?
Ferdinand, do you know what these items are, to wit: …. magnetite (Fe3O4), hematite (Fe2O3), goethite (FeO(OH)), limonite (FeO(OH).n(H2O)), siderite (FeCO3), gibbsite Al(OH)3, boehmite AlO(OH) and diaspore AlO(OH), ….. and/or how many giga-tons of them are processed each and every year?
Or what happens to their “finished products” ….. when neglected or discarded?
================
All CO2 processes in the biosphere prefer 12CO2 above 13CO2. Some kind of plants more than others, but anyway, if plants absorb CO2 they use relative more 12CO2 than is in the atmosphere, thus leaving relative more 13CO2 in the atmosphere. Conversely, plant decay will release low 13C CO2 as that was built in (as good as in fossil fuels).
—————
And that is your “story”, …… and come hell or high water, …. you are sticking to it, …. RIGHT?
Well now, I can’t argue with a Jukebox that insists on playing the “same ole, same ole” tune.
HA, …. maybe I should find myself an old mimeograph machine and then publish a dozen or so papers and a couple books …. then I could be a highly recognized “expert” with one hellava a resume for “tootin” my own horn with

Nick Stokes
August 1, 2014 6:35 am

Samuel C Cogar says: August 1, 2014 at 5:59 am
“Ferdinand, do you know what these items are, to wit: …. magnetite (Fe3O4), hematite (Fe2O3), goethite (FeO(OH)), limonite (FeO(OH).n(H2O)), siderite (FeCO3), gibbsite Al(OH)3, boehmite AlO(OH) and diaspore AlO(OH), ….. and/or how many giga-tons of them are processed each and every year?”

So why all questions? Why can’t you provide some facts?
About 1.5 Gtons iron ore reduced per year, depending on what you believe about China. That contains about 0.5 Gton oxygen.
We burn about 9 Gt C. That consumes about 24 Gt oxygen. Iron ore is a small source in comparison. And bauxite much less.

August 1, 2014 6:50 am

Nick Stokes says:
July 31, 2014 at 7:11 pm
There is an interactive gadget where you can try adding CO2 and see what changes. H*, HCO3- increase, CO3– decreases.

Nice job Nick, there’re also some similar gadgets available on the web, CDIAC has a downloadable program too: http://coastal.er.usgs.gov/co2calc/CO2calcNet.html

richardscourtney
August 1, 2014 7:11 am

Phil.:
re your temper tantrum at August 1, 2014 at 5:27 am.
Please try to see what your rattle is instead of waving it. A change of 0.1 in pH of the ocean surface layer is trivial and it commonly happens every day. Reality is not “nonsense”.
Now, please try to be a dear, pick up your toys, and go back to your romper room.
Richard

August 1, 2014 8:40 am

richardscourtney says:
August 1, 2014 at 7:11 am
Phil.:
A change of 0.1 in pH of the ocean surface layer is trivial and it commonly happens every day.

The topic under discussion was global pH change, and such a change does not ‘take place every day’.
For example, a minute change to ocean surface layer pH of 0.1 would alter the equilibrium of CO2 between air and ocean to induce more change to atmospheric CO2 concentration than has been observed. Such a pH change could not be induced by alterations to CO2 concentrations and fluxes because of the carbonate buffer.
As explained to you above and in the site I referred you to such a pH change is exactly what you’d get from a 120ppm change in CO2, that’s how the carbonate buffer works! Perhaps you should try it on Nick’s calculator.
And such a global 0.1 pH change is far too small for the limited available data to indicate it.
results from one of many sites:
http://www.pmel.noaa.gov/co2/file/pH+Time+Series

August 1, 2014 9:02 am

Samuel C Cogar says:
August 1, 2014 at 5:59 am
Maybe for a change, you can read some scientific literature. There are people out there who measure things in the field like oxygen changes and 13C/12C changes in the atmosphere. See e.g.:
http://www.sciencemag.org/content/287/5462/2467.short
The full article can be read after free registration:
Recent time-series measurements of atmospheric O2 show that the land biosphere and world oceans annually sequestered 1.4 ± 0.8 and 2.0 ± 0.6 gigatons of carbon, respectively, between mid-1991 and mid-1997.
or more recent:
http://www.bowdoin.edu/~mbattle/papers_posters_and_talks/BenderGBC2005.pdf
From 1994–2002, We find the average CO2 uptake by the ocean and the land biosphere was 1.7 ± 0.5 and 1.0 ± 0.6 GtC/year respectively
BTW, cement manufacturing and ore processing are included in human emissions of CO2. At least I hope they don’t return to rust in too short time (1/4th of our house rests on steel girders)

richardscourtney
August 1, 2014 9:17 am

Phil.:
I write to ask a question.
Your behaviour induced me to think you are a petulant child, but your persistence suggests you are a bot. Which is it?
Richard

August 1, 2014 12:13 pm

richardscourtney says:
August 1, 2014 at 9:17 am
Phil.:
I write to ask a question.
Your behaviour induced me to think you are a petulant child, but your persistence suggests you are a bot. Which is it?

Neither, just an experienced scientist, researcher/teacher who doesn’t like seeing the science misrepresented by the likes of you and has the patience to counter it. You on the other hand sound like you have either absolutely no clue about the science or that you might be a paid shill for the coal industry (or both), which is it?

August 1, 2014 2:07 pm

richardscourtney says:
August 1, 2014 at 9:17 am
Phil.:
I write to ask a question.
Your behaviour induced me to think you are a petulant child, but your persistence suggests you are a bot. Which is it?

Neither, I’m an experienced scientist, researcher/teacher who doesn’t like posts such as yours which misrepresent the science and is patient enough to continue pointing out your errors in case someone might think you actually knew something about the subject.
One might ask the same question of you.

richardscourtney
August 1, 2014 2:48 pm

Phil.:
I congratulate you that after all these years in your post at August 1, 2014 at 2:07 pm you have at last made an honest statement.
You admit you are an internet troll who is stalking me.
Of course you also laughably claim to be “an experienced scientist, researcher/teacher”, but you have managed to admit one honest truth so I think we can forgive your claiming that obvious nonsense. And if those claims were true then you would have a life so you would not need to bolster your ego by stalking me.
Richard

August 1, 2014 4:12 pm

richardscourtney says:
August 1, 2014 at 2:48 pm
Phil.:
I congratulate you that after all these years in your post at August 1, 2014 at 2:07 pm you have at last made an honest statement.
You admit you are an internet troll who is stalking me.

Really? You still have the same reading comprehension issues I see.

richardscourtney
August 1, 2014 11:58 pm

Phil.:
I leave it to onlookers to discern the accuracy with which I have comprehended your posts.
Richard

August 2, 2014 4:55 am

Nick Stokes says:
August 1, 2014 at 6:35 am
So why all questions? Why can’t you provide some facts?
——————
Nick S, do you mean …. some pseudo-facts … like you provided in the following, to wit:
Nick Stokes says:
About 1.5 Gtons iron ore reduced per year, depending on what you believe about China. That contains about 0.5 Gton oxygen.
We burn about 9 Gt C. That consumes about 24 Gt oxygen.

—————–
Nick, don’t be trying to sucker me into playing your game of Sciency Horseshoes wherein “about” is close enough to count as a FACT of science.
I do not know all of the atmospheric emission/absorption facts about O2 and CO2, and neither do you or anyone else. The only facts that I am reasonably sure of is their atmospheric ppm quantities that are measured in the “pristine” air atop Mauna Loa, Hawaii and the Antarctica. And the fact that said CO2 ppm increases and decreases an average 6 ppm on a steady and consistent bi-yearly cycle, just like clock-work. And the only thing in the natural world that functions on such an EXACT bi-yearly cycle is the seasonal changes in/of the equinoxes. THE ONLY THING, …. so write it down and remember it.
Remember that ….. if the ONLY exact bi-yearly cycle in/of the natural world is the EXACTY occurring bi-yearly cycle in/of the equinoxes ….. then the aforesaid bi-yearly cycling of CO2 ppm has to be the result of said bi-yearly cycling of the equinoxes.
One can NOT add up, subtract, multiply or divide …. the highly variable 100+- randomly occurring “annual” natural processes ….. and then honestly and/or non-religiously claim their results are proof of a steady and consistent cycle that EXACTLY repeats itself each and every year.

August 2, 2014 7:42 am

Ferdinand Engelbeen says:
August 1, 2014 at 9:02 am
Maybe for a change, you can read some scientific literature. There are people out there who measure things in the field like oxygen changes and 13C/12C changes in the atmosphere.
—————
Ferdinand, … GETTA CLUE, … I do not have a problem with the people who make said measurements or the result totals that they derive from said measurements. Nor do I have a problem with any person that measures your height or weight.
But I do have a problem, A BIG PROBLEM, with those people who are making said measurements, like yourself, ….. who claim they know EXACTLY why you are as tall as you are, ….. why you weigh as much as you do ….. or why the quantities of atmospheric O2, CO2, H2O, 13C and/or 12C are constantly changing from hour-to-hour or year-to-year.
=================
Ferdinand quoting:
Recent time-series measurements of atmospheric O2 show that the land biosphere and world oceans annually sequestered 1.4 ± 0.8 and 2.0 ± 0.6 gigatons of carbon, respectively, between mid-1991 and mid-1997.
——————
Ferdinand, was that not both an asinine and idiotic “statement of fact” …… simply because no one knows how much non-carbon sequestering of O2 occurred during said “time frame”.
One should not be making factual claims about “reaction” results that occur in an “open” environment

August 2, 2014 9:15 am

Samuel C Cogar says:
August 2, 2014 at 7:42 am
Samuel, if they can measure CO2 changes over the seasons, they can measure residual CO2 after a full seasonal cycle. They can measure O2 and 13C/12C changes over the seasons and account for O2 from the oceans (solubility as they warm or cool).
Thus the change of O2, 13C/12C and total CO2 can be measured quite accurately.
The change of the same caused by human activities can be calculated with reasonable accuracy. With “reasonable” one means within -0.5 / + 1 GtC/year for CO2 and similar accuracy for the derivatives.
The measurements and the calculations together give you what the difference was over a full seasonal cycle: more CO2 uptake than CO2 release by the sum of all natural processes.
BTW, do you know of one non-human process, except for the biosphere, which consumes oxygen? As far as I know everything that could be oxidized is already oxidized on earth…

Reply to  Ferdinand Engelbeen
August 2, 2014 9:38 am

Cold rain, wild fires, rust, and all animal life, etc. etc . Quantify that.

Bart
August 2, 2014 10:18 am

Nick Stokes says:
July 31, 2014 at 10:35 pm
“So there really is a temperature hockey stick? :)”
No, because the temperature is the derivative.
Ferdinand Engelbeen says:
August 1, 2014 at 12:14 am
“What you have done is not only using different units, but you also moved the trend of emissions with an offset.”
No, you did that. I put the trend where it would match with the first half of the data, and then looked to see if it was continuing at that pace. It wasn’t.
You are cheating by changing the scale factor to continue getting a (not very good) match, which is diverging in slope anyway despite your effort to downplay the divergence.
“Its you who changed the slope (by using different units) and offset…”
This is… really dumb. I don’t know how to break the logjam in your mind.
“I did plot both on the same scale without any manipulation…”
Your plot is rife with manipulation, but you still can’t make the slopes the same for the last decade+.
“…where either the amplitude or the variability of the slopes match and only by coincidence…”
Two separate components which match right on top of each other with a single scale factor – that is one hell of a coincidence.
“Yes, it gives a 90 deg. out of phase for the simple reason that CO2 changes follow T changes with 90 deg. “
Which means that CO2 is following the integral of T. You cannot get around it.
The Bode Gain Phase Theorem is somewhat obscure, and a very clever and subtle bit of mathematics, so it is not surprising that you do not know of it or understand its implications. But, it says that, in a natural, non-minimum phase system, every lag of 90 degrees begets a -20 db/decade slope, i.e., a 90 deg phase lag indicates an integral relationship.
There is no way around it. You cannot just arbitrarily shift the phase without affecting the gain dynamics You cannot shift the phase for a 90 degree lag without having an integral relationship.
“There is not the slightest indication of a physical process in the past or present where CO2 will continue to be released by a sustained temperature difference without feedback from the whole CO2 cycle. “
Sure, there is. I suggested one such mechanism here.
“Bart, the short time variability is caused by the influence of temperature on vegetation. That is a proven fact.”
If you accept that, then you have to accept that the trend in temperature is driving the trend in the rate of change of CO2. You cannot just pick and choose arbitrarily which components have an effect, and which do not. It’s all, or nothing.

Bart
August 2, 2014 10:32 am

Samuel C Cogar says:
August 2, 2014 at 7:42 am
I feel your pain. Ferdinand revels in putting forward back-of-the-envelope figures, derived from his biases, which purport to precisely quantify his desired relationships. Usually, I just ignore it, because it diverts the discussion into examining the roots of the trees in his land-of-make-believe, and takes the focus off the forest in the real world.

Alan Robertson
August 2, 2014 2:20 pm

Ferdinand Engelbeen says:
August 2, 2014 at 9:15 am
“…if they can measure CO2 changes over the seasons, they can measure residual CO2 after a full seasonal cycle. They can measure O2 and 13C/12C changes over the seasons and account for O2 from the oceans (solubility as they warm or cool).
Thus the change of O2, 13C/12C and total CO2 can be measured quite accurately.
The change of the same caused by human activities can be calculated with reasonable accuracy. With “reasonable” one means within -0.5 / + 1 GtC/year for CO2 and similar accuracy for the derivatives.”
________________
Come on, Ferd E… quit trying to get anybody to fall for your trick of using data and science. Who do you think you’re talking to?
——————
“The measurements and the calculations together give you what the difference was over a full seasonal cycle: more CO2 uptake than CO2 release by the sum of all natural processes.”
_______________
Just because you’ve said it and put up all that math and those fancy schmancy graphs, that doesn’t prove anything! Just how do you propose to explain topsoil? No, wait…
——————
“BTW, do you know of one non-human process, except for the biosphere, which consumes oxygen? As far as I know everything that could be oxidized is already oxidized on earth…”
_________________
Again, come on, Ferd E- you know that’s likely to only be true for the past 2.4 Billion years, so why do you use that trick? What about before that, huh? Huh? Gotcha!
Religious zealots, sheesh. Don’t make me bring up stromatolites!
——————

FerdiEgb
August 2, 2014 2:59 pm

Bart says:
August 2, 2014 at 10:18 am
No, you did that. I put the trend where it would match with the first half of the data, and then looked to see if it was continuing at that pace. It wasn’t.
Bart, you can prove anything you want by manipulating a trend, that is what you have done by using different units and different offsets for two variables which in fact have the same units: either GtC/year (or month) or ppmv, but not GtC/year (or month) for one of them and ppmv for the other one.
If you plot them at the same scale (since when is plotting two variables on the same scale, starting from zero “cheating”?), there is hardly any change in airborne fraction, within the huge year by year variability.
But for your convenience, I have plotted the airborne fraction over the two halves of the Mauna Loa period:
http://www.ferdinand-engelbeen.be/klimaat/klim_img/airborne_1960_cur.jpg
In the first period, about 60% remained in the atmosphere, in the second period about 40%, or in fact the sinks were responsible for 40% and 60% of the removal in quantity. Big deal in the variability which is between 10% and 90% of the human emissions. If that is all what the temperature influence can do over 2.5 decade (if it is the temperature influence at all, total CO2 pressure is what pushes more CO2 in the oceans and vegetation)…
Two separate components which match right on top of each other with a single scale factor – that is one hell of a coincidence.
They don’t match: either the slope is too high or the amplitude is too low:
Here Wood for Trees with the slope fitted
and here with a better amplitude.
The Bode Gain Phase Theorem is somewhat obscure, and a very clever and subtle bit of mathematics, so it is not surprising that you do not know of it or understand its implications.
I have read that story, but I don’t see the relevance for the T-CO2 relationship: it is about a one-variable amplifier + feedback system (I did build one some 55 years ago…). In the case of T influence on CO2, it is about the influence of one variable on another one, with little feedback of the second variable on the first.
Moreover, the variability and the gain are from different processes and are simply additive. The attenuation of the variability (which is mainly in the tropical forests) is very rapid. See slide 11 and following of Pieter Tans at:
http://esrl.noaa.gov/gmd/co2conference/pdfs/tans.pdf
You cannot just arbitrarily shift the phase without affecting the gain dynamics
Which probably is true for a one-variable gain/feedback system, but that has hardly anything to do with a physical process where one variable has a small influence (4-5 ppmv/K) short term on another variable in one process (tropical vegetation) and a small influence (8 ppmv/k) long term on the same other variable in a complete different process (oceans, gain opposite to the first process). With hardly any feedback on the first variable…
Sure, there is. I suggested one such mechanism here.
Which is physically impossible without negative feedback from the carbon cycle:
http://www.ferdinand-engelbeen.be/klimaat/klim_img/upwelling_incr_temp.jpg
Except if the whole carbon cycle increased a 4-fold in lockstep with the 4-fold increase of human emissions, for which there is not the slightest indication.
If you accept that, then you have to accept that the trend in temperature is driving the trend in the rate of change of CO2. You cannot just pick and choose arbitrarily which components have an effect, and which do not. It’s all, or nothing.
I think that your mistake is that you see the whole carbon cycle system as one process, which it is certainly not:
1. The seasonal cycle is dominated by the NH extra-tropical forests:
T up:
CO2 down (5 ppmv/K)
13C/12C ratio up
http://www.ferdinand-engelbeen.be/klimaat/klim_img/seasonal_CO2_d13C_MLO_BRW.jpg
2. The short term variability is dominated by the tropical forests:
T up:
CO2 up (4-5 ppmv/K)
13C/12C ratio down
http://www.ferdinand-engelbeen.be/klimaat/klim_img/temp_dco2_d13C_mlo.jpg
3. The long term gain is dominated by the oceans:
T up:
CO2 up (8 ppmv/K overall gain) by the oceans (but CO2 down by vegetation)
13C/12C ratio hardly changed
(I did not make a plot of that, but the long term ice cores T-CO2 plots are well known)
In all cases besides the human influence on the CO2 and 13C/12C changes.
Conclusion:
It is a clear mistake to treat the short term variability and the gain as caused by one process. The short term variability and the long term gain are from quite different processes.
[Were you expecting the different user_id? .mod]

FerdiEgb
August 2, 2014 3:11 pm

Alan Robertson says:
August 2, 2014 at 2:20 pm
Just because you’ve said it and put up all that math and those fancy schmancy graphs, that doesn’t prove anything! Just how do you propose to explain topsoil? No, wait…
Sorry, but that are not my figures. I have given the sources. If you don’t believe them, discuss it further with the authors of the measurements.
Topsoil is just a part of the huge carbon cycle. No part of a cycle is of interest for the end result: the difference between calculated and measured CO2, O2 and 13C/12C. That is all what matters for any increase or decrease in the atmosphere.
Again, come on, Ferd E- you know that’s likely to only be true for the past 2.4 Billion years
Sorry, we are discussing the past 160 years in relationship to the past 800,000 years. What happened before is highly interesting, but not discussed.

Alan Robertson
August 2, 2014 3:29 pm

FerdiEgb says:
August 2, 2014 at 3:11 pm
_________________
Now, you see? I should have used my sarc tag, after all (I thought I was being so obvious.)

richardscourtney
August 2, 2014 3:31 pm

Alan Robertson:
re your post at August 2, 2014 at 2:20 pm.
Ferdinand is multilingual but you need to use a sarc tag if you write sarcasm because he is likely to assume you are being serious. That has happened with his reply to you at August 2, 2014 at 3:11 pm.
He and I strongly disagree about the carbon cycle and his mistaken use of the logically flawed ‘mass balance argument’, but he is honest, honourable and very knowledgeable. And he takes time and effort to share his knowledge with others so it is a pity when he is induced to waste time because of failure to use a sarc tag.
Richard

Alan Robertson
August 2, 2014 3:48 pm

richardscourtney says:
August 2, 2014 at 3:31 pm
_____________
You’re right on all points and i know you were composing as I posted, so you didn’t see my response. Unfortunately, I’d written a lot more in response to Ferdinand’s latest and while striking that part in quest of brevity, also took out my apology for causing the confusion, so:
Sorry, Mr. Englebeen, I didn’t mean to take up your time answering yet another contentious post, but instead, thought I’d lighten up the situation a little bit with sarcasm.
All Apologies.

Alan Robertson
August 2, 2014 3:50 pm

Correction in response to Richard: “You’re right on all points in regard to my post to F.E.”

Bart
August 2, 2014 9:30 pm

FerdiEgb says:
August 2, 2014 at 2:59 pm
I’m sorry, Ferdinand, but what you have written here is just nonsense. Atmospheric CO2 and emissions are diverging. The divergence is accelerating. But, atmospheric CO2 matches the temperature relationship. Those are the facts, and they are right before your eyes.

August 3, 2014 1:20 am

Alan Robertson says:
August 2, 2014 at 3:29 pm
No problem, at all. I was not sure if it was sarcastic or not, that is the problem if it isn’t your mother tongue, sometimes the fine nuances are lost… Especially in English which has a lot of nuances for the same situation but all slightly different. Which isn’t easy to translate in other languages as these often have not the same broad vocabulary.
English had the same origin as Dutch and other Germanic languages, but was heavily influenced by the (French) Normans which introduced a lot of new words, which makes that English has a much broader vocabulary than most other languages (Spanish also is much broader).

August 3, 2014 1:31 am

Bart says:
August 2, 2014 at 9:30 pm
Bart, the reduction of the rate of change compared to the emissions is of little interest: as long as there is a positive rate of change, it is human induced.
But I am interested in following points:
Can you explain to me in reasonable terms why the Bode Gain Phase Theorem which is about a one variable gain/feedback system would be applicable to a two variable system largely without feedback?
I fully agree that the short term CO2 variability is caused by temperature variability. But I don’t see how that can influence the longer term trend, as these are from different processes. Or do you think that all is caused by one and the same process?

August 3, 2014 10:20 am

Ferdinand Engelbeen says:
August 2, 2014 at 9:15 am
Samuel, if they can measure CO2 changes over the seasons, they can measure residual CO2 after a full seasonal cycle.
————–
Sure nuff, Ferdinand, ….and you can measure H2O level changes in a drilled H2O well over the seasons, ………. and you can measure residual H2O level after a full seasonal cycle …… but you still won’t have a frigging clue how much H2O is actually flowing through the “water table” wherein said H2O well is situated. The only thing that you can actually measure is the “recovery rate” of said H2O well for a specific time and date.
=============
Thus the change of O2, 13C/12C and total CO2 can be measured quite accurately.
The change of the same caused by human activities can be calculated with reasonable accuracy. With “reasonable” one means within -0.5 / + 1 GtC/year for CO2 and similar accuracy for the derivatives.

————
HA, there are 10,000+ homes and businesses in WV alone …. that burn coal and NG as their source of energy …… with like 99% of it never being weighed, never passing thru a meter and no sales taxes ever being paid on said.
I know of one case where an NG producer installed a “by-pass” line around a mainline distribution “meter” and thus, for “who knows” how many years, was sending a big portion of the same NG back thru the meter. Said “by-pass” was only discovered during a cold winter “NG shortage” when a smart technician, sitting at a computer console somewhere in Delaware, couldn’t find all the NG his company had been paying for via said “meter readings”. With diligence and perseverance he “tracked” it back to that meter with the “by-pass”.
And ps, Ferdinand, “quite accurately” and “reasonable accuracy” is/are oxymoronic when used in the same context.
Do you also blurt out a vocally loud ….. “Now Be Reasonable” …. after your CYA excuses are rejected by your spouse or your superiors?
Ferdinand, are you really so naïve and/or socially ignorant to actually believe that Russia, China, North Korea, India, Brazil, etc. are going to tell you how much fossil fuels (or per se “green” fuel) they produce and/or burn …. each and every year? HA, even if they actually knew …… they still wouldn’t tell you.
A country’s fuel production determines their “war readiness” status.
==============
BTW, do you know of one non-human process, except for the biosphere ……….
As far as I know
everything that could be oxidized is already oxidized on earth…

————–
And therein is the root of your problem, Ferdinand. But, …. “Ignorance can be fixed, …. stupidity is permanent”.

August 3, 2014 10:45 am

Bart says:
August 2, 2014 at 10:32 am
I feel your pain. Ferdinand revels in putting forward back-of-the-envelope figures,
——————
Actually, me thinks Ferdinand has far too many published papers, commentaries, etc., etc., to be “changing his mind” at this point in “the game”.
If one’s notoriety, fame, job status and/or vested interest was/is dependent upon their “past performance” …. it is not an easy thing for them to admit they erred in their past actions.
The same is true for those persons who adamantly refuse to acknowledge any part of the Aquatic Ape Theory (AAT).

Reply to  Samuel C Cogar
August 5, 2014 5:14 am

@Samuel C Cogar

Actually, me thinks Ferdinand has far too many published papers, commentaries, etc., etc., to be “changing his mind” at this point in “the game”.

Sadly, that is an all too common problem among “published” scientists. Once they get their name out there, there is a desire to protect that name, not the truth. And so they will resort to any means to validate their work, forsaking any conflicting data in their quest.
This is not a universal trait, but it is widespread.

Bart
August 3, 2014 10:57 am

Ferdinand Engelbeen says:
August 3, 2014 at 1:31 am
“Bart, the reduction of the rate of change compared to the emissions is of little interest: as long as there is a positive rate of change, it is human induced.”
It certainly makes it easier, to assume the answer before you look at the data, and then focus on the evidence which tends to support that answer. That is classic confirmation bias.
It does not, however, make the answer correct.
“Can you explain to me in reasonable terms why the Bode Gain Phase Theorem which is about a one variable gain/feedback system would be applicable to a two variable system largely without feedback?”
The theorem says that 90 deg phase lag = integration. You cannot shift the data in time via a natural process which would not affect the amplitude and, moreover, the change in amplitude has a specific frequency dependence, that of an integrator. It says that the model must be, at least for the period of observation 1958-present and its observable frequency range, dCO2/dt = k*T + constant. It says that the sensitivity is measured in ppmv/K/unit-of-time.
“Or do you think that all is caused by one and the same process?”
I think there is a dominant process involved, which is some form of temperature dependent pumping into the atmosphere.
Samuel C Cogar says:
August 3, 2014 at 10:45 am
Well, Ferdinand does have a lot invested in it, but not professionally. When the truth becomes known, he will be chagrined, but he will not suffer any real injury. Which is good, because he really is a very nice fellow.

August 3, 2014 12:00 pm

FerdiEgb says:
August 2, 2014 at 2:59 pm
In response to: Bart says: August 2, 2014 at 10:18 am:
I think that your mistake is that you see the whole carbon cycle system as one process, which it is certainly not:
1. The seasonal cycle is dominated by the NH extra-tropical forests:
T up: …… CO2 down (5 ppmv/K)
2. The short term variability is dominated by the tropical forests:
T up: …. CO2 up (4-5 ppmv/K)
3. The long term gain is dominated by the oceans:
T up: …. CO2 up (8 ppmv/K overall gain) by the oceans

—————–
WRONG on #1, …… really, really WRONG on #2 ….. and half-WRONG on #3.
Actually, both the average 6 ppm bi-yearly cycling of CO2 and the average 1-2 ppm long term or yearly gain is dominated by the ocean waters of the Southern Hemisphere.
The T in/of the tropical forest is fairly stable all year round.
The 6 ppm bi-yearly cycling of CO2 is the product of the seasonal change in T of the ocean water.
The average 1-2 ppm yearly increase of CO2 is the product of the long term increase (recovery) in average T of the ocean water. (recovering from the low T of the Little Ice Age)

Alan Robertson
August 3, 2014 1:01 pm

Samuel C Cogar says:
August 3, 2014 at 10:20 am
F.E.: “BTW, do you know of one non-human process, except for the biosphere[, which consumes oxygen?] ……….
As far as I know everything that could be oxidized is already oxidized on earth…”
————–
S.C.: And therein is the root of your problem, Ferdinand. But, …. “Ignorance can be fixed, …. stupidity is permanent”.
———————
I think that the tone of your response is inappropriate for a website devoted to the advancement of mankind’s knowledge and understanding, but leaving that aside, in this example, without supplying one iota of contradictory theory or evidence, you are also implying that F.E. is wrong. By such implication, you brand yourself as wholly ignorant of processes underway for ~2.4 Billion years. If you claim that your implication wasn’t such, then that denial moves you from the category of ignoramus, to just plain old bullying troll. There are many more examples of your churlish behavior in this thread.
It’s time for you to either get real. or get lost.

August 3, 2014 1:39 pm

Samuel C Cogar says:
August 3, 2014 at 12:00 pm
WRONG on #1, …… really, really WRONG on #2 ….. and half-WRONG on #3.
Samuel, the seasonal changes are dominated by the NH vegetation. That is based on the 13C/12C change: if that goes up when CO2 goes up, then the oceans are dominant. If it goes down when CO2 goes up, then vegetation is dominant. The seasonal graph shows the latter.
The same for #2
The opposite for #3, there the oceans are dominant.
Take it or leave it.

August 3, 2014 3:15 pm

Bart says:
August 3, 2014 at 10:57 am
It certainly makes it easier, to assume the answer before you look at the data
I did first look at the data: the increase in the atmosphere is less than the human contribution. As my wife knows (and I often forget) if that happens with our household budget, that means that our expenses are higher than our income if you add more to you bank account each month than it gains at the end of the month…
As long as the increase in the atmosphere is smaller than what humans emit, then humans are responsible for the increase. No matter if that is 1% or 99% of the human emissions.
Except for an enormous increase in natural CO2 circulation in lockstep with the 4-fold increase of human emissions, for which is not the slightest indication.
The theorem says that 90 deg. phase lag = integration.
The theorem is for a one-variable gain/feedback system. I don’t see any integration in the case of the two-variable T-CO2 system with a fixed gain and no appreciable feedback. You still haven’t explained that.
In my opinion, based on practical experience:
In first instance, if T goes up (as is the case for the oceans), then the CO2 flux out immediately goes up (and the flux down decreases), but the CO2 levels themselves lag the increase in T.
If T changes with a sinusoid, CO2 will follow wit 90 deg. That is all that happens. The amplitude may increase with longer frequencies, up to a maximum of 17 ppmv/°C, according to Henry’s Law (assuming constant deep upwelling and constant CO2 concentration in the upwelling).
If there is zero average temperature increase of a T sinusoid, there is zero average CO2 increase, but still a 90 deg. lag of CO2 after T.
The derivatives show the same sinusoids which are shifted 90 deg. back in time. As both the T slopes and dCO2/dt slopes are zero the factor needed to match the slopes is not definable.
If there is a stepwise increase in temperature, CO2 will follow with the same time constant as for the sinusoid, until 17 ppmv/°C is reached. Then it stops. Simply because there is a new equilibrium reached between input and output fluxes (caused by delta pCO2 oceans-atmosphere) and the CO2 pressure in the atmosphere. There is no continuous constant net CO2 influx from a stepwise T increase.
The step change will show up in the derivatives, but will give a short offset from zero for T and a stepwise, decreasing offset from zero for CO2. Again almost zero slopes, no definable factor.
If there is a continuous increase in T, CO2 will follow with the same time constant as for the sinusoid, thus a lag of the CO2 increase after T increase, but again with maximum 17 ppmv/°C T increase.
In the derivatives, that shows up as two sinusoids with a 90 deg. lag for dCO2/dt after dT/dt. Both with zero slope and an offset from zero. A slope in T, but no slope in dCO2/dt, that is a factor zero, thus zero amplitude, if the theorem is applicable. Which makes the theorem quite questionable in this case…

Bart
August 3, 2014 3:29 pm

Ferdinand Engelbeen says:
August 3, 2014 at 3:15 pm
“As my wife knows (and I often forget) if that happens with our household budget…”
I have tried to explain to you – and you seem have gotten it at times, but then you regress – this is a completely inappropriate analogy for an active feedback system.
“As long as the increase in the atmosphere is smaller than what humans emit, then humans are responsible for the increase.”
Totally, completely, absolutely wrong, wrong, wrong.
“That is all that happens.”
I am sorry, Ferdinand, but this is simply not how it works. You are not even close to being on a firm physical footing here.
As I say, the 90 deg phase lag = integration. And so, you must integrate the trend in temperature into CO2 concentration. And, when you do that, you have little to no room for human inputs to have a significant impact.
This is not at all remarkable. It is how feedback systems work. It is how this system works. There is no doubt about it at all. Keep watching. You will see my predictions coming true. Emissions will keep accelerating but, with continued stasis, or even decline, in temperatures, atmospheric concentration will rise at best linearly in time. The divergence will become more and more stark as time goes on. Watch and see what happens.

Alan Robertson
August 3, 2014 3:50 pm

Bart says:
August 3, 2014 at 3:29 pm
“Emissions will keep accelerating but, with continued stasis, or even decline, in temperatures, atmospheric concentration will rise at best linearly in time.”
________________
Isn’t that what we’ve been seeing, regardless of the temperature trend?
———————-
“The divergence will become more and more stark as time goes on.”
______________
Pardon me, Bart, but you’ve used the term “‘the divergence” more than once and I don’t understand the term’s reference. Would you kindly elaborate? I’ve guessed a couple of meanings, but if you defined it up- thread, sorry I missed it.

Bart
August 3, 2014 4:14 pm

Alan Robertson says:
August 3, 2014 at 3:50 pm
“Would you kindly elaborate?”
Sure. The rate of change of atmospheric CO2 tracks temperatures.
The rate of emissions, on the other hand, while appearing to have an affine similarity to the rate of change of CO2 over the early portion of the modern record since 1958, is now clearly diverging from the atmospheric CO2 rate of change.
Atmospheric CO2 is now rising at a more or less constant rate, in lockstep with the lull in temperatures of the past decade and a half or so, while emissions are accelerating. It is clear that the earlier similarity between emissions and atmospheric concentration was spurious. The only thing that even makes them appear similar, over what is now seen to have been a limited interval, is that fact that they both happened to be going up. That’s basically a coin toss – given that emissions were going up, the odds of atmospheric CO2 going up at the same time were just 50/50. That proves nothing.
But, they are no longer affinely similar. The spurious similarity is diverging. But, the temperature relationship still holds. That tells us that we are looking at a temperature dependent process driving the change. And, since emissions are not temperature dependent, they cannot be the main driver.

August 3, 2014 4:26 pm

Bart says:
August 3, 2014 at 3:29 pm
This is not at all remarkable. It is how feedback systems work. It is how this system works.
I think I do see the problem: I did think that you meant by “feedback” the feedback from the carbon cycle, but you mean the feedback from the whole system on temperature. As that is what the theorem implies.
But there is hardly any feedback from the carbon cycle / level on temperature. The (negative) feedback from the carbon cycle is on the increased CO2 levels, not on temperature.
I still don’t see any reason to imply the theorem rules on a two-variable lead-lag system with no appreciable feedback on the first variable.

Alan Robertson
August 3, 2014 5:03 pm

Bart says:
August 3, 2014 at 4:14 pm
_______________
Rate of change in atmospheric CO2 diverging from rate of emissions. Thanks.

Bart
August 3, 2014 7:05 pm

Ferdinand Engelbeen says:
August 3, 2014 at 4:26 pm
I am speaking of the relationship between temperature and atmospheric CO2. There is a 90 degree phase lag. That means that the model must be, at least for the period of observation 1958-present and its observable frequency range, dCO2/dt = k*T + constant. It means that the sensitivity is measured in ppmv/K/unit-of-time. It means you have to integrate the whole T, including the slope in T, to get CO2. When you do that, there is little to no room for human inputs to have a significant effect.

August 4, 2014 3:11 am

Bart says:
August 3, 2014 at 7:05 pm
Bart the Bode Gain Phase Theorem is for a gain/feedback system. The feedback is essential for the attenuation of the different frequencies and the minimum/maximum frequencies that can be reached without problems.
In the case of the T – CO2 relationship, there is a direct gain of CO2 from T, no matter the frequency and there is no (*) feedback. All what happens is that the amplitude of the CO2 variability is smaller for higher frequencies than for lower frequencies, a 90 deg. lag and a maximum of 17 ppmv/°C amplitude (or change if T increases or decreases).
As there is no feedback, the whole theorem is not applicable for the T- CO2 process.
(*) there is a small (positive!) feedback from CO2 on temperature (thus increasing T amplitude…). Taking the direct absorption rate for 2xCO2 into account, for 1°C temperature increase that gives a feedback of about +0.03°C.

Bart
August 4, 2014 8:33 am

Ferdinand Engelbeen says:
August 4, 2014 at 3:11 am
“All what happens is that the amplitude of the CO2 variability is smaller for higher frequencies than for lower frequencies, a 90 deg. lag …”
Exactly. I.e., it is an integral relationship. You are dancing around the issue, and apparently do not realize that you are stating an equivalence relationship. You are trying to argue that 2+2 is not equal to 4. Sorry, no. There is no getting around it. The sensitivity is in ppmv/K/unit-of-time.

August 4, 2014 9:07 am

Bart says:
August 4, 2014 at 8:33 am
The sensitivity is in ppmv/K/unit-of-time
Which varies with the seasons, the years, the decennia,… up to multi millennia. The ppmv/K is similar for seasons to multi-millennia, only slightly increasing over longer time frames.
But still: why would a theorem based on a gain/feedback system be applicable on a simple unidirectional gain system without feedback?

Bart
August 4, 2014 10:35 am

“Which varies with the…”
Maybe it does, and maybe it doesn’t. It’s been remarkably stable since 1958. Since that covers most of the era in which we are interested, it is enough.
“But still: why would a theorem based on a gain/feedback system be applicable on a simple unidirectional gain system without feedback?”
The result is widely applicable, and holds for any linear (or linearized) system with minimum phase (no right half plane zeros) rational transfer function, and natural systems generally fall into this category. It is the bedrock of control theory, governing how the open loop response must be shaped in the vicinity of the crossover frequency in order to achieve stability.

August 4, 2014 12:49 pm

Bart says:
August 4, 2014 at 10:35 am
It’s been remarkably stable since 1958. Since that covers most of the era in which we are interested, it is enough.
It is as (un)stable as the “divergence”:
first halve of the MLO period:
T +0.25 K; CO2 + 30 ppmv; increase rate: 120 ppmv/K/27.5 years
second halve of the MLO period:
T +0.22 K; CO2 + 50 ppmv: increase rate: 227 ppmv/K/27.5 years
Based on WfT Mauna Loa and HadCRUT4 SH mean data
And it is getting worse the longer the “pause” lasts…
And it was a big deal that the “airborne fraction” changed from 60% to 40% in the second halve of the MLO period?
I am looking for a cheap deal (or alternative) for Matlab to test a few things out before answering the second part. Anyone?

Bart
August 4, 2014 1:15 pm

Ferdinand Engelbeen says:
August 4, 2014 at 12:49 pm
Nonsense. It tracks perfectly, for all practical purposes. You are drawing a secant line on an essentially quadratic function, and calling it a derivative. No dice.
I think the language “R” people go on about is open source. Good luck proving Bode wrong. You might try tackling Einstein and Bohr, and exposing them as frauds, while you’re at it.

August 4, 2014 1:55 pm

Bart:
The sensitivity is in ppmv/K/unit-of-time
and
It’s been remarkably stable since 1958.
“Stable” in my opinion is the same sensitivity for the first and second period. I know of one quadratic function: human emissions, but I don’t think that is what you mean.
Thus we have a ppmv^2/K/unit-of-time function. It gets more interesting with the minute.
I don’t think that I am going to prove that Bode or Einstein or Bohr are wrong. But I am pretty sure that you are applying Bode where it isn’t appropriate and I want to try that out.

Bart
August 4, 2014 3:01 pm

Ferdinand Engelbeen says:
August 4, 2014 at 1:55 pm
dCO2/dt = k*(T – To)
T has had a more or less linear trend, so its integral is essentially quadratic, as total CO2 is essentially quadratic.
You are drawing a secant line on an essentially quadratic function, and calling it a derivative. That is invalid. If you match here (and, we do), then there is a match. The sensitivity factor k is, indeed, remarkably well represented by a very stable parameter value since 1958.
For the rest, have at it. Any frequency at which you have a 90 deg phase lag, you will find the gain rolling off at -20 dB/decade in a band enclosing that frequency. A -20 dB/decade roll-off is the signature of integration taking place over the frequency band. If you try to put in a feedback parameter to limit the integration, you will get observable phase distortion near the corner frequency, of which we have none evident in the CO2 record.

Alan Robertson
August 5, 2014 7:26 pm

philjourdan says:
August 5, 2014 at 5:14 am
________________
Good grief! I hope that your comments are in general and not specifically at F.E., in which case I’d have to say you couldn’t be more wrong.

Reply to  Alan Robertson
August 6, 2014 8:18 am

Robertson – Yes, in general. And yes, if they had been about F.E. I would be the first to agree with you. Thank you for allowing me to make a clarification.

August 6, 2014 6:33 am

Alan Robertson says:
August 5, 2014 at 7:26 pm
[in response to] philjourdan comment of: “Sadly, that is an all too common problem among “published” scientists. Once they get their name out there, there is a desire to protect that name, not the truth.
Good grief! I hope that your comments are in general and not specifically at F.E., in which case I’d have to say you couldn’t be more wrong.
——————–
Alan R, in that it appears to me that you seem to be quite supportive of the context/content of Ferdinand E’s commentary …. then maybe you would be so kind as to explain to me …. the ACTUAL REASON why any person who infers, suggests, talks, writes or claims that they are knowledgeable and/or learned in the Sciences would post the following comment on a Public Forum for everyone to read? To wit:
==================
Ferdinand Engelbeen said: August 2, 2014 at 9:15 am
BTW, do you know of one non-human process, except for the biosphere, which consumes oxygen? As far as I know everything that could be oxidized is already oxidized on earth…
——————–
bi•o•sphere noun: the regions of the surface, atmosphere, and hydrosphere of the earth (or analogous parts of other planets) occupied by living organisms.

August 6, 2014 8:05 am

Samuel C Cogar says:
August 6, 2014 at 6:33 am
Maybe my English was not clear enough (how is your Dutch?).
The only natural processes I know of which consume oxygen today are biological processes.
Plants produce oxygen, the rest of the biosphere consumes oxygen (except what is stored long term as coal, oil, gas).
There may be rare a-biological processes which consume oxygen (a-biological oil and gas comes to mind) but that is until now more theory than really proven.
If humans burn fossil fuel, one can calculate how much O2 is consumed and the balance of the O2 measurements is what the biosphere consumed or produced.
But I am always eager to learn. If you know of processes outside the biosphere which produce or consume considerable amounts of oxygen in current times, I am very interested.
BTW, my work in the literature until now is one letter to Nature (about chlorine, another hobby of me) and two articles in E&E: one as a reply to the findings of Tom Quirk (origin of the CO2 increase), the other about the (small) influence of human aerosols on temperature, overblown in climate models.

Reply to  Ferdinand Engelbeen
August 6, 2014 8:23 am

What about the temperature dependent solubility of oxygen in water? How significant is that? How does that change with time?

Alan Robertson
August 6, 2014 12:07 pm

Samuel C Cogar says:
August 6, 2014 at 6:33 am
F.E. says: “BTW, do you know of one non-human process, except for the biosphere, which consumes oxygen? As far as I know everything that could be oxidized is already oxidized on earth…”
_______________
S.C.-
Since you have spoken of this issue more than once without making comment about the processes involved, it would be more helpful if you would present an argument based on scientific principles and data, rather than repeating your gambit of using logical fallacies.
I expect to see tactics relying on ad hominem attacks on blogs within the climate fearosphere, but here at WUWT?

August 6, 2014 1:24 pm

fhhaynie says:
August 6, 2014 at 8:23 am
What about the temperature dependent solubility of oxygen in water? How significant is that? How does that change with time?
As the temperature variations of the oceans are largely restricted to the upper few hundred meters (the “mixed layer”), the outgassing of oxygen by warming oceans is rather modest. It is accounted for in the calculations of the oxygen balance, here for the period 1990-2000:
http://www.ferdinand-engelbeen.be/klimaat/klim_img/bolingraph.gif
Original at: IPCC TAR, Chapter 3, page 206, fig. 3.4 :
http://www.grida.no/climate/IPCC_tar/wg1/pdf/TAR-03.PDF

August 7, 2014 3:54 am

Ferdinand Engelbeen says:
August 6, 2014 at 8:05 am
If you know of processes outside the biosphere which produce or consume considerable amounts of oxygen in current times, I am very interested”.
———————
Ferdinand, to locate an O2 consuming process “outside the biosphere” one would have to go into outer-space or deep into the earth’s mantle, the latter being an impossibility to accomplish, thus your above statement is bogus from the get-go because neither locations have a direct affect on the earth’s atmospheric O2.
=================
The only natural processes I know of which consume oxygen today are biological processes.
—————-
Lightening and UV radiation consumes O2, ……. and to wit:
Oxygen, which is very reactive, is a component of hundreds of thousands of organic compounds and combines with most elements.
Oxygen enrichment of steel blast furnaces accounts for the greatest use of the gas. Large quantities are also used in making synthesis gas for ammonia and methanol, ethylene oxide, and for oxy-acetylene welding
”. http://www.radiochemistry.org/periodictable/elements/8.html
=============
If humans burn fossil fuel, one can calculate how much O2 is consumed and the balance of the O2 measurements is what the biosphere consumed or produced”.
————————
YUP, and if Reindeer and Wildebeest burn biomass fuel, one can calculate how much O2 is consumed and the balance of the O2 measurements is what the biosphere consumed or produced
==============
Plants produce oxygen, the rest of the biosphere consumes oxygen (except what is stored long term as coal, oil, gas)”.
—————–
You ignored a far, far greater sink for O2 than what coal, oil & gas is …. and which is constantly producing vast quantities of CO2 which is the source for your above said “O2 consumption”.
Read both and learn, to wit:
http://en.wikipedia.org/wiki/Limestone and http://en.wikipedia.org/wiki/Calcium_carbonate
===============
But I am always eager to learn”.
———————-
That’s a good attitude, Ferdinand, …. and best you begin with the use of Google to “read up on thingys” prior to posting what you think you know about them ….. because at present me thinks you, …. as the ole saying goes, ….. “know just enough to be dangerous”.

August 7, 2014 4:23 am

Alan Robertson says:
August 6, 2014 at 12:07 pm
S.C.-
Since you have spoken of this issue more than once without making comment about the processes involved, it would be more helpful if you would present an argument based on scientific principles and data, rather than repeating your gambit of using logical fallacies
”.
———–
Alan R, this is a science-based forum for adults, …. not elementary school children. If you are not familiar with or know the definitions of the words and/or verbiage that you are reading …. then use Google or a dictionary. Then after learning the definition of said “wording” …. then you resolve for yourself whether or not the author used it correctly in his/her commentary.
I can not do your thinking for you every time you read “strange sounding” commentary. But I just did said for the issue in question ….. for you and Ferdinand …..in my above posting of …. August 7, 2014 at 3:54 am

Alan Robertson
August 7, 2014 9:50 am

Samuel C Cogar says:
August 7, 2014 at 4:23 am
“…this is a science-based forum for adults, …. not elementary school children. “
_________________
With those words, you have condemned yourself.
——————-
If you are not familiar with or know the definitions of the words and/or verbiage that you are reading …. then use Google or a dictionary. Then after learning the definition of said “wording” …. then you resolve for yourself whether or not the author used it correctly in his/her commentary. “
_________________
The meanings of everything FE said are quite clear, to all but you. In your responses to FE, you attempted to hide your apparent ignorance by diverting the discussion away from topic, by way of personal attacks and other logical fallacies. Everyone taking part in this conversation is, or should be aware that English is not FE’s native language, but still, his words are quite clear and there is nothing untoward about his remarks. YOU are the only one here who doesn’t get what he is saying, or at least, pretends to misunderstand. Either way, you have put yourself in a very bad light.
For you to persist with your childish and mean personal attacks on FE’s English puts you in the same category as a garden variety bully who would make fun of a crippled child’s handicap. FE’s English is certainly no handicap. Everything he has said is clear, concise and far more grammatically correct than typical speech by the average native- English speaker. Nevertheless, you have used his words as pretense for personal attacks. What an @$$hole.
SC- Through several posts, you still have not addressed the scientific argument presented to you by FE (and reiterated by me,) but instead have employed several logical fallacies to detract readers from the fact that you don’t have the faintest clue what you are talking about. Now that you’ve turned your mean- spirited personal attacks against me (I gently warned you about that once, already,) you’ve put yourself squarely in my sights. Lock and load.
Earlier, you alluded to making statements in a public scientific forum for all the world to read. If only you had taken your own advice… In a way, it’s a pity that you seem too stupid to understand the extent to which you have exposed yourself, with your incoherent remarks. Not only is it quite obvious that you are a scientific know- nothing, but you have also shown the world that you are a mean spirited bully.
Since you are apparently unwilling, or incapable of understanding, or responding logically to any scientific questions posed to you, but instead divert the scientific discussion to your own sick purpose, why don’t you just go away, you sick, mean troll.
At one time, you would come to WUWT and make interesting comments, but you haven’t exhibited that capability in a long time. You’ve obviously slipped a cog, Coger. You’d be better off spending your time seeking help from a mental health professional.
I’m done, here. After several futile attempts to get you to straighten up your demented behavior and speak to the scientific issues presented, it’s become abundantly clear that you aren’t capable of taking that step. Any more efforts on my part would be wasted.
You have become someone who isn’t worth talking to.

August 8, 2014 10:53 am

Alan Robertson says:
August 7, 2014 at 9:50 am
The meanings of everything FE said are quite clear, to all but you”.
—————–
To all but me, …. HUH?
Alan R, here following are16 direct links to criticizing comments in responses to Ferdinand’s “tripe n’ piffle” ….. so maybe you can explain why you INTENTIONALLY averted your eyes and your mind to them and the remaining ones in this thread ….. and singled me out to be your “whippingboy” for venting your anger and dastardly dislike of anyone and everyone who “picks on” poor Ferdinand, …. to wit:
http://wattsupwiththat.com/2014/07/29/epa-document-supports-3-of-atmospheric-carbon-dioxide-is-attributable-to-human-sources/#comment-1697168
http://wattsupwiththat.com/2014/07/29/epa-document-supports-3-of-atmospheric-carbon-dioxide-is-attributable-to-human-sources/#comment-1697187
http://wattsupwiththat.com/2014/07/29/epa-document-supports-3-of-atmospheric-carbon-dioxide-is-attributable-to-human-sources/#comment-1697243
http://wattsupwiththat.com/2014/07/29/epa-document-supports-3-of-atmospheric-carbon-dioxide-is-attributable-to-human-sources/#comment-1697245
http://wattsupwiththat.com/2014/07/29/epa-document-supports-3-of-atmospheric-carbon-dioxide-is-attributable-to-human-sources/#comment-1697281
http://wattsupwiththat.com/2014/07/29/epa-document-supports-3-of-atmospheric-carbon-dioxide-is-attributable-to-human-sources/#comment-1697283
http://wattsupwiththat.com/2014/07/29/epa-document-supports-3-of-atmospheric-carbon-dioxide-is-attributable-to-human-sources/#comment-1697288
http://wattsupwiththat.com/2014/07/29/epa-document-supports-3-of-atmospheric-carbon-dioxide-is-attributable-to-human-sources/#comment-1697387
http://wattsupwiththat.com/2014/07/29/epa-document-supports-3-of-atmospheric-carbon-dioxide-is-attributable-to-human-sources/#comment-1697389
http://wattsupwiththat.com/2014/07/29/epa-document-supports-3-of-atmospheric-carbon-dioxide-is-attributable-to-human-sources/#comment-1697392
http://wattsupwiththat.com/2014/07/29/epa-document-supports-3-of-atmospheric-carbon-dioxide-is-attributable-to-human-sources/#comment-1697427
http://wattsupwiththat.com/2014/07/29/epa-document-supports-3-of-atmospheric-carbon-dioxide-is-attributable-to-human-sources/#comment-1697447
http://wattsupwiththat.com/2014/07/29/epa-document-supports-3-of-atmospheric-carbon-dioxide-is-attributable-to-human-sources/#comment-1697676
http://wattsupwiththat.com/2014/07/29/epa-document-supports-3-of-atmospheric-carbon-dioxide-is-attributable-to-human-sources/#comment-1697784
http://wattsupwiththat.com/2014/07/29/epa-document-supports-3-of-atmospheric-carbon-dioxide-is-attributable-to-human-sources/#comment-1697801
http://wattsupwiththat.com/2014/07/29/epa-document-supports-3-of-atmospheric-carbon-dioxide-is-attributable-to-human-sources/#comment-1697873
—————-
Everyone taking part in this conversation is, or should be aware that English is not FE’s native language,
————-
That is not “my” problem. GETTA clue, Alan R, the definitions of English words that are used in scientific discussions are known and used throughout all cultures simply because the English speaking countries have been dominate in/of scientific investigations and discoveries for the past 200+- years. Anyway, in science, the verbiage is usually ALWAYS self-defining. Thus the word “biosphere” simply means …. “the sphere encompassing the biology or biological of the subject in question”.
==============
SC- Through several posts, you still have not addressed the scientific argument presented to you by FE (and reiterated by me,) ……..”.
————————-
Alan R, I am only obligated to address the “part of” Ferdinand’s argument that is false, silly or asinine, …. not his entire or total argument.
If I negate one (1) part of his argument, it NEGATES all of his argument ….. and he should then restate his argument without said falsehood, error or mistake. The reason for restating his argument is to insure that it still “holds true” when said falsehood is removed from it as a “qualifying” entity.
One has to “trash” all of their associations, correlations, estimations, guesstimations, percentageations, obfuscations, etc. from their argument ….. before they have a chance in hell of proving it is a literal truth or fact.
==========
…. but instead have employed several logical fallacies to detract readers from …….
—————–
One who does not possess the early nurtured personality traits of “logical reasoning” and ”intelligent deduction” that are prerequisite to their learned knowledge and associated recall of said ….. should not be accusing anyone of positing “logical fallacies”.
==================
……… to detract readers from the fact that you don’t have the faintest clue what you are talking about”.
—————-
Only in your wildest of dreams, Alan R, could you support such a dastardly claim.
I have Degrees in both the Physical and Biological Sciences, a semi-photographic memory with exceptional “recall” abilities, 20 years experience in Logical Design/Engineering Design (cited proof of: http://www.freepatentsonline.com/3449735.pdf … to negate any of your slanderous remarks about the aforesaid) …. and years ago after the pee water had quit running down my leg outta my diaper I have acquired almost 70 years of real life experiences in, of and about the natural world around me, … so, … iffen you want to follow up on this claim of yours, …. to wit:
Now that you’ve turned your mean- spirited personal attacks against me (I gently warned you about that once, already,) you’ve put yourself squarely in my sights. Lock and load”.
You had better bring your BIG dog(s) along with you.
Cheers