This post provides an update on the progress of the early evolution of the 2014/15 El Niño with data through the beginning of July 2014. The post is similar in layout to the May and June updates. The post includes 3 gif animations and 13 illustrations so the post might take a few moments to load on your browser. Please click on the illustrations and animations to enlarge them.
Included are updates of the weekly sea surface temperature anomalies for the four most-often-used NINO regions. Also included are updates of the GODAS map-based animations of sea surface height anomalies, T300 anomalies (depth-averaged temperature anomalies to 300 meters), sea surface temperature anomalies, and the cross sections of temperature anomalies at depth along the equator. These animations start in January 2014 for the full progress of this year’s event. Also included are a couple of graphs of the BOM Southern-Oscillation Index (SOI) and the NOAA Equatorial SOI.
We compared the evolution of the 2014/15 El Niño to the 1982/83 and 1997/98 El Niños in a number of posts in this series, back when it was thought this El Niño was going to be a strong event. We don’t see those comparisons as often, but people may still expect to see the comparisons in my posts, so I’ve updated those graphs. And since we’ve been watching the downwelling (warm) Kelvin wave as it makes its way east along the equator in the Pacific, also included in this post are evolution comparisons using warm water volume anomalies and depth-averaged temperature anomalies from the NOAA TOA project website.
Then, as we did with the May and June updates, we’ll take a look at a number of Hovmoller diagrams comparing the progress so far this year to what happened in 1997. All will serve as a background for a general discussion of what we’re still waiting to happen if this El Niño is to continue to evolve.
NINO REGION TIME-SERIES GRAPHS
Figure 1 includes the weekly sea surface temperature anomalies of the 4 most-often-used NINO regions of the equatorial Pacific. From west to east they include:
- NINO4 (5S-5N, 160E-150W)
- NINO3.4 (5S-5N, 170W-120W)
- NINO3 (5S-5N, 150W-90W)
- NINO1+2 (10S-0, 90W-80W)
As of last week, the sea surface temperature anomalies in all four equatorial NINO regions remained elevated—a result of the warmer-than-normal subsurface waters (associated with the Kelvin wave) being drawn to the surface. Note how all but the NINO3 region sea surface temperatures appear to have peaked already. As we’ll see, that is not unusual.

Figure 1
EL NIÑO EVOLUTION COMPARISONS FOR NINO REGION SEA SURFACE TEMPERATURE ANOMALIES
Using weekly sea surface temperature anomalies for the four NINO regions, Figure 2 updates the comparisons of the evolutions of this El Niño with the 1982/83 and 1997/98 events. As you’ll recall, the NINO3.4 and NINO1+2 comparisons were originally provided in the post 2014/15 El Niño – Part 3 – Early Evolution – Comparison with 1982/83 & 1997/98 El Niño Events. This year, NINO3.4 region sea surface temperature anomalies, the primary ENSO index, are well behind the two earlier strong El Niños. The NINO4 region temperature anomalies are dropping. NINO3 region temperature anomalies have flattened in recent weeks. And in the NINO1+2 region, the temperature anomalies appear as though they may have started to decline from a peak a few weeks ago. The NINO1+2 data are an indicator of an East Pacific El Niño, which are stronger than Central Pacific El Niños.

Figure 2
ANIMATION UPDATES
In the first post in this series, we discussed a number of animations of maps and animations of equatorial cross sections available from the NOAA Global Ocean Data Assimilation System (GODAS) website. Each cell of the animation is a 5-day (pentadal) average. Those animations ran from January 3rd to March 29th. The following are updates, again starting in January 3rd. GODAS only maintains their animations for 3 months. I’ve stored the maps since the first of the year and will continue to add maps as time progresses. That way we can watch the El Niño unfold from the beginning and then try to keep track of the warm water when El Niño is over.
Animation 1 provides the sea surface height anomalies and the depth-averaged temperature anomalies for the top 300 meters (T300) side by side.

Animation 1
Animation 2 is a similar side-by-side comparison, but on the left are maps of sea surface temperature anomalies and on the right are the H300 maps. The sea surface temperature maps trail the others by a pentad or two, which is why they do not run through July 2. (My apologies for the shift in the color scaling for the range of +0.5 to +1.0 deg C in the sea surface temperature anomaly maps. That appears to be a quirk of my computer, not the GODAS website.)

Animation 2
Animation 3 is an update of the cross sections of temperature anomalies at depth along the equator.

Animation 3
EL NIÑO EVOLUTION COMPARISONS WITH TAO PROJECT SUBSURFACE DATA
The NOAA Tropical Atmosphere-Ocean (TAO) Project website includes data for two temperature-related datasets for the equatorial Pacific. See their Upper Ocean Heat Content and ENSO webpage for descriptions of the datasets. The two datasets are Warm Water Volume (above the 20 deg C isotherm) and the Depth-Averaged Temperatures for the top 300 meters (aka T300). Both are available for the:
- Western Equatorial Pacific (5S-5N, 120E-155W)
- Eastern Equatorial Pacific (5S-5N, 155W-80W)
- Equatorial Pacific (5S-5N, 120E-80W)
Keep in mind that the longitudes of 120E-80W stretch 160 deg, almost halfway around the globe. For a reminder of width of the equatorial Pacific, see the protractor-based illustration here.
In the following three graphs, we’re comparing data for the evolution of the 2014/15 El Niño so far (through the end of May 2014) with the data for the evolutions of the 1982/83 and 1997/98 El Niños. The Warm Water Volume data are the top graphs and the depth-averaged temperature data are the bottom graphs. As you’ll see, the curves of two datasets are similar.
Let’s start with the Western Equatorial Pacific (5S-5N, 120E-155W), Figure 3. The warm water volume and depth-averaged temperature data show the Western Equatorial Pacific had slightly less warm water or was slightly cooler this year than during the opening months of 1997. But 2014 had more warm water or was warmer than 1982.

Figure 3
In the second post in this series, we showed that the ocean heat content for the entire eastern tropical Pacific (24S-24N, 180-80W), for the depths of 0-700 meters, was cooler before the start of the current El Niño than it was in before the start of 1997 El Niño. (See the graph here.) The warm water volume and depth-averaged temperature data shown in Figure 4 for the eastern equatorial Pacific also show lower warm water volume and lower depth-averaged temperatures in 2014 than in 1997.

Figure 4
As a result, across the entire equatorial Pacific, Figure 5, warm water volume is lower and depth-averaged temperatures are less in 2014 than they were in 1997. Then again, they’re higher than they were in 1982.

Figure 5
Keep in mind, though, that both the 1982/83 and 1997/98 events were strong El Niños.
It will be interesting to see how far the NODC ocean heat content data for the tropical Pacific dropped as a result of this El Niño. We’ll have to wait for their April-June 2014 update, which should be available in a few months.
SOUTHERN OSCILLATION INDEX (SOI)
The Southern Oscillation Index is another widely used reference for the strength, frequency and duration of El Niño and La Niña events. We discussed the Southern Oscillation Index in Part 8 of this series. It is derived from the sea level pressures of Tahiti and Darwin, Australia. El Niño events are strong negative values and La Niñas are strong positive values, which is the reverse of what we see with sea surface temperatures. The June 2014 Southern Oscillation Index value is -1.5, which is still within ENSO-neutral conditions. The BOM threshold for El Niño conditions is an SOI value of -8.0, so there’s a long way to go. Figure 6 presents a time-series graph of the SOI data.

Figure 6
Figure 7 compares the evolution of the SOI values this year to those in 1982 and 1997, the development years of the strong 1982/83 and 1997/98 El Niños. The Southern Oscillation Index this year is lagging well behind the values in 1982 and 1997.

Figure 7
For those of you interested in keeping a closer eye on the BOM Southern Oscillation Index, see the BOM Recent (preliminary) Southern Oscillation Index (SOI) values webpage. For the past 6 days, the 30-day running-average of the SOI has been hovering in the -4.0 to -5.0 range, suggesting that the trade winds might be working their way toward El Niño conditions. Then again, the sea level pressures of Tahiti and Darwin, Australia are often impacted by off-equatorial weather events that do not always reflect what’s happening along the equator in the Pacific.
In Part 8 of this series, we also presented NOAA’s Equatorial Southern Oscillation Index. Where the original Southern Oscillation Index is based on sea level pressures in Tahiti and Darwin, Australia, the NOAA Equatorial Southern Oscillation Index, as its name suggests, is based on the sea level pressures of the eastern and western equatorial Pacific. The time-series graph through June 2014 is shown in Figure 8, and the evolution this year is compared to the 1982/83 and 1997/98 El Niños in Figure 9. The NOAA Equatorial Southern Oscillation Index was still positive in June, which is a further indication that the trade winds are not cooperating with the development of the El Niño this year.

Figure 8
# # #

Figure 9
COMPARISONS OF HOVMOLLER DIAGRAMS OF THIS YEAR (TO DATE) WITH 1997
Hovmoller diagrams are a great way to display data. If they’re new to you, there’s no reason to be intimidated by them. Let’s take a look at Figure 10. It presents the Hovmoller diagrams of thermocline depth anomalies (the depth of the isotherm at 20 deg C) with 2014 on the left and 1997 on the right. GODAS, unfortunately, furnishes the illustrations (not the data) in different dimensions for the two years. The vertical (y) axis in both is time with the Januarys for both years at the top and Decembers at the bottom. The horizontal (x) axis is longitude, so, moving from left to right, we’re going from west to east…with the Indian Ocean in the left-hand portion, the Pacific in the center and the Atlantic in the right-hand portion. We’re interested in the Pacific. The data are color-coded according to the scales below the Hovmollers.

Figure 10
Figure 10 is presenting the depth of the 20 deg C isotherm along a band from 2S to 2N. The positive anomalies, working their way eastward since the beginning of 2014, were caused by the downwelling Kelvin wave, which pushes down on the thermocline (the 20 deg C isotherm). You’ll note how the anomalies grew in strength as the Kelvin wave migrated east. That does not mean the Kelvin wave is getting stronger as it traveled east; that simply indicates that the thermocline is normally closer to the surface in the eastern equatorial Pacific than it is in the western portion. The 1997/98 El Niño was preceded by two downwelling Kelvin waves shown in the right-hand Hovmoller in Figure 10. The first one that began in 1996 wasn’t very strong, but the second one that began a few months later in 1997 was enough to start the 1997/98 El Niño.
Note how the thermocline continued to drop in the eastern equatorial Pacific as 1997 progressed. The 1997/98 El Niño was a freak. So much warm water flooded from the western tropical Pacific into the eastern portion that the normal warm water distribution below the surface of the equator reversed. That is, normally there is more warm water in the western portion than in the eastern portion of the equatorial Pacific so that the thermocline slopes upward from west to east, but at the peak of the 1997/98 El Niño, there was more warm water in the central and eastern portion than the west, with the slope of the thermocline growing downward from west to east. (See the cross section from ECMWF here.)
Figure 11 presents the 2014-to-date and 1997 Hovmollers for wind stress (not anomalies) along the equator. The simplest way to explain them is that they’re presenting the impacts of the strengths and directions of the trade winds on the surfaces of the equatorial oceans. In this presentation the effects of the east to west trade winds at various strengths are shown in blues, and the reversals of the trade winds into westerlies are shown in yellows, oranges and reds.
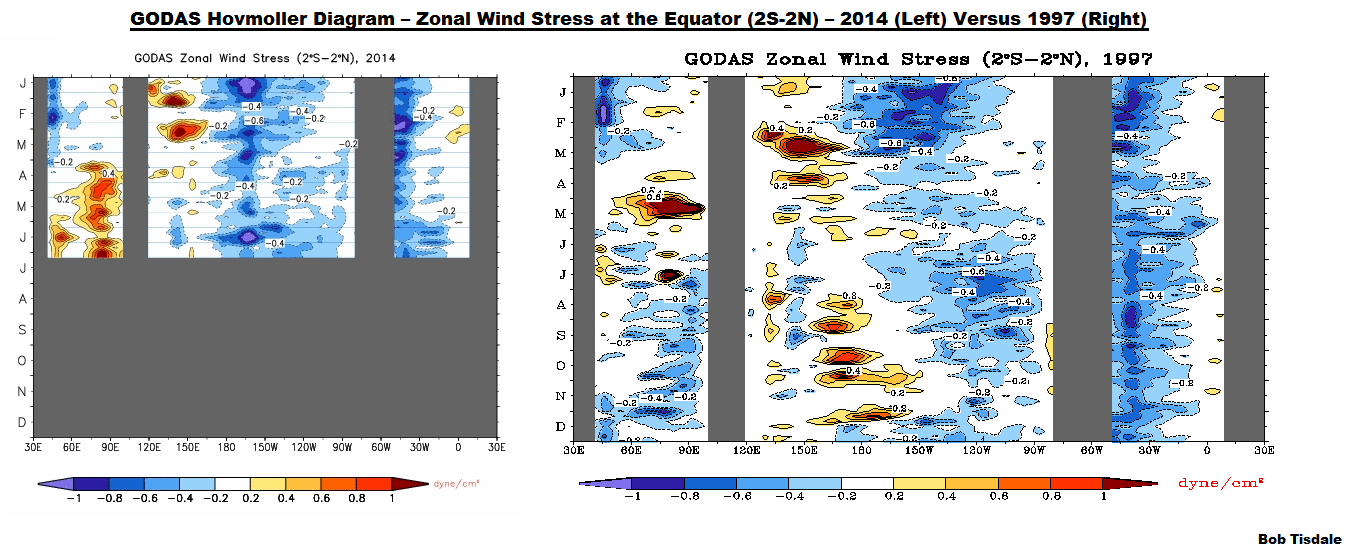
Figure 11
The two westerly wind bursts shown in red in the western equatorial Pacific in 2014 are associated with the downwelling Kelvin wave, and the westerly bursts early in 1997 are associated with the Kelvin waves that year. (See the post ENSO Basics: Westerly Wind Bursts Initiate an El Niño.) Note how in 1997, as the May progressed through September, the negative wind stresses decreased (associated with a weakening of the trade winds), with the neutral whites expanding eastward. Also note the repeated westerly wind bursts in the western equatorial Pacific from August through November. Those westerly wind bursts throughout 1997 continued to help push warm water from the western equatorial Pacific into the east, strengthening the 1997/98 El Niño.
Figure 12 presents the Hovmollers of wind stress anomalies…just a different perspective. Note how there were more positive wind stress anomalies in the western equatorial Pacific in 1997 than there have been so far this year.

Figure 12
And Figure 13 presents the Hovmollers of sea surface temperature anomalies. Unfortunately, the Hovmoller of sea surface temperature anomalies is delayed a few weeks…thus the purplish line. But as we’ve seen in the comparison graphs in Figure 2, the sea surface temperature anomalies of the NINO3.4 and NINO3 regions in 2014 are starting to fall behind those of 1997, and the sea surface temperature anomalies this year in the NINO1+2 region are less than they were at this time in 1997. As you’ll note in the Hovmoller for this year, it didn’t take long for the La Niña conditions in the eastern equatorial Pacific to disappear. Will the present El Niño conditions disappear as quickly?

Figure 13
THE EL NIÑO WILL DIE WITHOUT THE ATMOSPHERIC FEEDBACKS
The El Niño- and La Niña-related acronym ENSO stands for El Niño-Southern Oscillation. El Niño, to the left of the hyphen, represents the ocean portion, while Southern Oscillation, to the right of the hyphen, represents the atmospheric component. In other words, ENSO involves a coupling of ocean and atmospheric processes. For an El Niño to form, the ocean or atmospheric portions must both cooperate.
We saw a strong downwelling Kelvin wave this year, which gave ENSO researchers and global warming enthusiasts hope for a strong El Nino. See Figure 10. It wasn’t quite as strong as the 1997/98 El Niño but the Kelvin wave was strong enough to draw comparisons.
But, referring back to Figure 11, we’re definitely not seeing a comparative weakening of the trade winds this year, and there have been fewer westerly wind bursts than there were in 1997. The additional westerly wind bursts and the continued weakening of the trade winds are what drive additional warm water from the western tropical Pacific into the eastern equatorial Pacific, thus reinforcing the development of the El Niño. Those are the additional feedbacks that are absent so far this year.
We monitor the Southern Oscillation Index, which is a metric based on the difference in sea level pressures in the eastern and western tropical Pacific. Because the trade winds and the sea level pressure difference between those two points are interrelated, the Southern Oscillation Index, in turn, reflects the strength and direction of the trade winds. The dip of the BOM Southern Oscillation Index into negative values indicates the trade winds have weakened over the past few months, but the trade winds have not weakened to the values that are associated with strong El Niños.
The El Niño conditions in the sea surface temperatures of the equatorial Pacific (Figures 1 and 2) are the result of the additional subsurface warm water that had been carried east by the downwelling Kelvin wave. But as we can see in the animations, the supply of warmer-than-normal subsurface water is quickly being used up as it is drawn to the surface. If the trade winds don’t start to weaken and if we don’t see additional westerly wind bursts, the 2014 El Niño will die.
CLOSING NOTE
In the June 2014 sea surface temperature update, I showed that global sea surface temperatures were at record high levels this year. I also noted the reasons. So you can expect to see GISS, NOAA and UKMO proclaiming more record-high global surface temperatures in upcoming months.
EARLIER POSTS IN THIS SERIES
- The 2014/15 El Niño – Part 1 – The Initial Processes of the El Niño.
- The 2014/15 El Niño – Part 2 – The Alarmist Misinformation (BS) Begins
- The 2014/15 El Niño – Part 3 – Early Evolution – Comparison with 1982/83 & 1997/98 El Niño Events
- The 2014/15 El Niño – Part 4 – Early Evolution – Comparison with Other Satellite-Era El Niños
- The 2014/15 El Niño – Part 5 – The Relationship Between the PDO and ENSO
- The 2014/15 El Niño – Part 6 – What’s All The Hubbub About?…
- The 2014/15 El Niño – Part 7 – May 2014 Update and What Should Happen Next
- The 2014/15 El Niño – Part 8 – The Southern Oscillation Indices
- The 2014/15 El Niño – Part 9 – Kevin Trenberth is Looking Forward to Another “Big Jump”
- The 2014/15 El Niño – Part 10 – June 2014 Update – Still Waiting for the Feedbacks
- The 2014/15 El Niño – Part 11 – Is the El Niño Dying?
And for additional introductory discussions of El Niño processes see:
- An Illustrated Introduction to the Basic Processes that Drive El Niño and La Niña Events
- El Niño and La Niña Basics: Introduction to the Pacific Trade Winds
- La Niñas Do NOT Suck Heat from the Atmosphere
- ENSO Basics: Westerly Wind Bursts Initiate an El Niño
FURTHER READING
My ebook Who Turned on the Heat? goes into a tremendous amount of detail to explain El Niño and La Niña processes and the long-term aftereffects of strong El Niño events. Who Turned on the Heat? weighs in at a whopping 550+ pages, about 110,000+ words. It contains somewhere in the neighborhood of 380 color illustrations. In pdf form, it’s about 23MB. It includes links to more than a dozen animations, which allow the reader to view ENSO processes and the interactions between variables.
I’ve lowered the price of Who Turned on the Heat? from U.S.$8.00 to U.S.$5.00. A free preview in pdf format is here. The preview includes the Table of Contents, the Introduction, the first half of section 1 (which was provided complete in the post here), a discussion of the cover, and the Closing. Take a run through the Table of Contents. It is a very-detailed and well-illustrated book—using data from the real world, not models of a virtual world. Who Turned on the Heat? is only available in pdf format…and will only be available in that format. Click here to purchase a copy. Thanks. (I also am very happy to receive tips or donations.)
“We saw a strong downwelling Kelvin wave this year, which gave ENSO researchers and global warming enthusiasts hope for a strong El Nino.”
How deeply, deeply sick it is to yearn for signs that the world is going to fry, all so they don’t have to admit they were wrong. Ponder the narcissism… of you have the stomach for it.
Thanks Bob. Very informative as always.
” If the trade winds don’t start to weaken and if we don’t see additional westerly wind bursts, the 2014 El Niño will die.”… In an energy budget, where do you think that heat gets transferred to if it doesn’t come out in an el Nino? Or there just isn’t enough heat to produce an el Nino or a difference in ( as I was reading some comments) the layering, mixing or longer, shorter periods of cycles in the Pacific? We could just go with the Peruvian government, the little fishes are back.
A weak EL Nino at the best.
“If the trade winds don’t start to weaken and if we don’t see additional westerly wind bursts, the 2014 El Niño will die.”
Fingers are crossed; we need a good chance of substantial rain in California …and soon.
Thanks Bob, very informative.
Rough day for alarmists. El Nino looking weaker and more short-lived each week and Typhoon Neoguri has peaked and will weaken rapidly as it goes over colder-than-normal water south of Japan.
My understanding of the El Niño effect is that it is already present ocean heat that has pooled, leaves the ocean for the atmosphere, and soon after disappears into the dark places between the stars. That is a net energy loss in the Earth/Sun energy system. That is a good thing if you’re concerned about a warming climate. Is that what drives the alarmist euphoria or is it the brief “I told you so” pulse of warming over land as that sequestered heat starts its journey to the cosmos?
This is great news for those of us who love freedom. You can bet your ass that the Obama administration was hopping for a strong el nino to coincide with their carbon push.
What is the BOM projecting for the SOI index for the next few months?
We are now back to a stronger than normal trade wind condition (positive trade anomaly) across the entire equatorial Pacific (or were last night) and continued decline in equatorial Pacific surface temperatures. Not seeing any el nino at all, just to the warm limit lf La Nada. Fish are back off the coast of South America (anchovy mostly). This Nino a bust.
The ocean has released some of the heat it had stored. Correct? And if so….will this cause the rise in ocean levels to stop/decline? I read back several months ago that the sea level rise had slowed a bit….could this put an end to it?
That is all very well, but Isee no SLP anom alies in space which tell us more than anything else.
Great stuff!
Drat. While June did bring some rain to some regions of the parched Southwest US, the El Niño would have likely provided even greater rainfall. Maybe we’ll just get lucky and it will rain, anyway.
Thanks for another informative update, Bob.
I showed that global sea surface temperatures were at record high levels this year.
Since this is the case, would it really make a difference to global temperatures this year if an El Nino developed or not?
Not encouraging at all (for those of us in CA). Sodden thought – no significant El Nino events during the entire course of the current Negative PDO phase. Megadrought.
Its dead Jim.
Klaus Wolter at NOAA updated the MEI today saying:
“El Niño came and went during the summer of 2012, not unlike 1953. I do not believe that this year’s version will be quite as short-lived, not least because the PDO is strongly positive, while it was quite negative back in 2012. Compared to earlier this year, the odds for a strong event have dwindled, with a moderate event being the most likely outcome for now. “
http://www.esrl.noaa.gov/psd/enso/mei/
Is there anything that the IPCC has forecast accurately? No tropical hot spots, expanding Antartic sea ice, lots of Polar bears, cant navigate the Northwest Passage in summer, Great Lakes all at 100 year normal or better water levels, and the Statue of Liberty is still high and dry.Couldnt we better humanity more by taking all the carbon taxes and climate research and just giving it to everyone in Africa to obtain cleaner sources of drinking water?
“We saw a strong downwelling Kelvin wave this year, which gave ENSO researchers and global warming enthusiasts hope for a strong El Nino.”
I think this sums up the science of “global warming enthusiasts” very well – They look for any signs, even those they know for a fact have nothing to do with global warming, to make their argument.
Someone needs to make another Hitl-er movie about this.
@F. Ross says:July 8, 2014 at 8:41 am,
Think California 1930’s , A decade of drought, that’s what we are at the beginning of now. The long term lack of planning for Californians water needs with an expanding population in the past, are today’s problem!
Historically, scientists have classified the intensity of El Niño based on SST anomalies exceeding a pre-selected threshold in a certain region of the equatorial Pacific. The most commonly used region is the Niño 3.4 region, and the most commonly used threshold is a positive SST departure from normal greater than or equal to +0.5°C. Since this region encompasses the western half of the equatorial cold tongue region, it provides a good measure of important changes in SST and SST gradients that result in changes in the pattern of deep tropical convection and atmospheric circulation. The criteria, that is often used to classify El Niño episodes, is that five consecutive 3-month running mean SST anomalies exceed the threshold.
http://www.ncdc.noaa.gov/teleconnections/enso/indicators/sst.php
I don’t understand the various assertions I have read / heard on media. The planet is NOT experiencing an El Nino based upon the above. Is the planet in a state of ‘favorable’ for El Nino and is this the meaning stated on this post ? Could someone be specific and detailed in clearing my confusion ?
The alarmist rhetoric has been dialed up to 11 for much of this year. I suspect in anticipation of a record El Nino.
The TAO of Bob is strong. 🙂
rishrac says: “In an energy budget, where do you think that heat gets transferred to if it doesn’t come out in an el Nino?”
Western boundary currents carry the warm water from the tropics poleward.
rishrac says: “Or there just isn’t enough heat to produce an el Nino or a difference in ( as I was reading some comments) the layering, mixing or longer, shorter periods of cycles in the Pacific?”
There should be enough warm water in the Pacific Warm Pool to support an El Nino. But the trade winds are not relaxing and there have not been enough westerly winds bursts to help relocate that warm water into the eastern equatorial Pacific.
dp says: “Is that what drives the alarmist euphoria or is it the brief “I told you so” pulse of warming over land as that sequestered heat starts its journey to the cosmos?”
First, I enjoyed your brief summary of an El Nino, but it’s incomplete. An El Nino also causes more warm water than normal to be redistributed from the tropical Pacific to adjoining ocean basins. See the following post for an introductory discussion:
http://bobtisdale.wordpress.com/2014/05/13/answer-to-the-question-posed-at-climate-etc-by-what-mechanism-does-an-el-nino-contribute-to-global-warming/
Back to your question: An El Nino causes a temporary spike in global surface temperatures, not just land surface air temperatures. That’s what the alarmists were looking forward to. But an El Nino can also cause an upward shift in the sea surface temperatures for a good portion of the global oceans–a result of the redistribution of the additional warm water from the tropical Pacific. Alarmists attribute that warming to manmade greenhouse gases.
MattN says: “What is the BOM projecting for the SOI index for the next few months?”
I believe the BOM presents model predictions of sea surface temperatures for the NINO3.4 region. I don’t recall seeing SOI predictions. Hopefully, someone will chime in if I’ve overlooked them.
@Sun Spot says:
July 8, 2014 at 1:41 pm
Much truth in what you say. I’m almost old enough to remember that era.
Of course water distribution is also affected by little endangered fishies here and desert whachamacallits there. Sometimes with good cause; other times not so much.
Kenny says: “The ocean has released some of the heat it had stored. Correct? And if so….will this cause the rise in ocean levels to stop/decline? I read back several months ago that the sea level rise had slowed a bit….could this put an end to it?”
While an El Nino releases more heat than normal from the tropical Pacific, they also cause increases in ocean heat content elsewhere. Sea levels typically rise during an El Nino because precipitation increases over the oceans and decreases over land during an El Nino. The opposite holds true for a La Nina. See the comparison of detrended global sea level and the Multivariate ENSO Index at the University of Colorado sea level website here:
http://sealevel.colorado.edu/content/2014rel2-gmsl-and-multivariate-enso-index
Werner Brozek says: “Since this is the case, would it really make a difference to global temperatures this year if an El Nino developed or not?”
An El Nino would make it worse, wouldn’t it?
FergalR says: “Klaus Wolter at NOAA updated the MEI today saying….”
Thanks. That seems to be general expectation now.
Steve in Seattle says: “I don’t understand the various assertions I have read / heard on media. The planet is NOT experiencing an El Nino based upon the above.”
We presently have elevated sea surface temperature anomalies across the equatorial Pacific, what are referred to as El Nino conditions, but the El Nino conditions have not lasted long enough for the El Nino to be classified as an “official” El Nino.
Thanks to everyone who purchased a copy of my book “Who Turned on the Heat?” as a result of this post.
Cheers.
We (weatherbell.com) still hold a blend of 02-03,09-10. We look for a peak around 1.5 for the enso 3.4, but by that time ( winter) enso 1.2 will be much cooler, leading to the modoki enso event. The new ECMWF enso 3.4 forecast as of July 8th looks to support us. Their is a major difference though in the N American temp forecast, the colder ECMWF being much closer to us. I do not believe US models handle the feedback well enough to handle the warm enso events. Theand Jamstec did best on the 09-10 enso event and weather…. The JMA has been on a torrid streak since last winter.
Bob replied with:
This isn’t at odds with what I wrote – it does not represent new energy in the local Earth system An El Niño does not mysteriously suck gobs of new energy from the sun. It is simply a heave of energy that is already here. A temporary warming of the atmosphere is produced as the energy passes through it on its journey to infinite space. It is a net cooling process for the Earth which should please even the most jaundiced alarmist or optimistic skeptic. I think the confusion is the alarmists treat it like a global heating event which it clearly is not.
My comment regarding warming over land goes to the point that nobody cares if the temperature is 5º high at the mid-ocean, but let it get warm in Peoria and people, particularly alarmists, will notice.
@William Howard
“Couldnt we better humanity more by taking all the carbon taxes and climate research and just giving it to everyone in Africa to obtain cleaner sources of drinking water?”
That wouldn’t be nearly expensive enough to interest really big industry. Charging the poor for water is not nearly as profitable as selling air to governments.
Thanks Bob. Your explanation about this event, whether a bust or boom, is still very educational. It really should be required reading for every news reporter so they can at least get their facts straight.
“MattN says:
July 8, 2014 at 9:10 am
What is the BOM projecting for the SOI index for the next few months?”
The BOM is non committal on the SOI but state:
“Climate models surveyed by the Bureau continue to indicate that El Niño is likely to develop by spring 2014. The Bureau’s ENSO Tracker remains at El Niño ALERT, indicating at least a 70% chance of El Niño developing in 2014”.
http://www.bom.gov.au/climate/enso/
They are also predicting a drier than normal coming season for Central and Eastern Australia.
But one thing that I have noticed recently is that the winter in Eastern Australia is much more like I remember with cold southerlies blowing up from the Antarctic bringing lots of snow to the snowfields.
Those children and grandchildren who are lucky enough to get down to Thredbo this weekend are certainly going to know what snow is with the white stuff forecast for 6 out of the next 7 days and on Sunday the snow conditions will be excellent with a big high sitting over the Snowy Mountains and the weather gloriously perfect.
Eat your heart out Christine Milne.
‘The warm equatorial waters will be circulated through the normal circulations and not driven by trade winds and westerly’s. ‘
As I recall this means the shores of many regions will then have a rain increase near the shores but not enough to get further inland as an El Nino would cause. This will also create a warming near the oceans and may moderate the coming cool down of fall. However, the interior lands will be cooler as the enlarged polar low intrudes the mid latitudes of the Northern Hemisphere as there is little moisture to hold in heat.
I see a set up for heavy snows in the western US and a down right frigid interior.
(my four cords of wood is neatly stacked and drying. it appears like I am gonna need it)
The MEI index has increased to May/Jun about as much in 2014 as it did in 1982 and well under half as much as it did in 1997. I suspect the strength of the El Nino will all depend on what happens in the next week or so.
Won’t typhoon Neoguri give the Westerly winds a kick along in the Central Pacific? But what will it do to the Kelvin wave? Kill it or strengthen it?
This “El Nino” is in trouble. Cold water is now developing off the Coast of Peru. It appears that the current PDO regime will simply kill another out of season weak event.
Wow… If an El Nino event doesn’t occur this year, this will be devastating to farmers and residents in West/Mid-West America, who are still suffering from depleted reservoirs and drought.
Without an El Nino event, rainfall will most likely be less, which will exacerbate an already dismal situation.
Without an El Nino induced global temp spike, it’s likely global temp trends will continue to fall/run flat for the next 3 years, which will increase the global flat/falling trend to 21+ years… If this occurs, It should push CAGW projections outside the 95% confidence interval, which should be sufficient for this silly CAGW cult to be at least unofficially disconfirmed.
The CAGW grant whores will, of course, try to make the most of the US drought, but all the headlines of “NO GLOBAL WARMING TREND FOR 20+ YEARS!” will take their toll, and more and more people will realize they’ve been lied to for the past 30 years on this CAGW scam.
And so it goes……until liberty and reason are restored…
Bob’s book is like a college course on steroids (H/T to Trenberth) and so well worth the tuition I should audit the course again.
Thank you again for your excellent posts (Professor) Tisdale.
Great Bob!!! thank you for the free education. I bought two of your books, and feel smarter because the tiny purchases made. You’ve found the missing heat… via ENSO processes… which is inconvenient to the CO2 police.
SAMURAI says:
July 8, 2014 at 9:13 pm
Wow… If an El Nino event doesn’t occur this year, this will be devastating to farmers and residents in West/Mid-West America, who are still suffering from depleted reservoirs and drought.
Without an El Nino event, rainfall will most likely be less, which will exacerbate an already dismal situation.
===============================================
Actually Wyoming, Colorado, Nebraska, North/South Dakota’s, Utah, Idaho and most of the western states have done very well with this moderate El Nino. The ones really hurting are California, Nevada, Texas, and Arizona but given heat circulation near the shores, California should see an increase in the moisture soon. All depends on what the polar low decides to do the next 6-9 weeks and how fast it grows.
Closest match seems 1982-83 event but I can assure you that here in Victoria, Australia there is no comparison. Currently 8c and raining.
I remember the clear mild days and frosty nights of the 82-83 El Niño.
Lots of snow on our highlands, there was little if any snow on 82-83.
el Nino 1 – La Nada 7
Brent Walker says: “Won’t typhoon Neoguri give the Westerly winds a kick along in the Central Pacific?”
When Neoguri formed nearer to the equator, it was at tropical depression strength. It also headed northwest quite rapidly. I’m not sure if it was there long enough for it to have had much of an impact. We’ll have to check the wind stress Hovmollers next week to see whether it shows up.
Bill H says: “‘The warm equatorial waters will be circulated through the normal circulations and not driven by trade winds and westerly’s. ‘”
This appears to be a quote, but I can’t find this sentence anywhere else on this thread.
Nino 3.4 and 4.0 regions have cooled considerably in the last several days. Possibly below 0.0C. This would not be expected at all right now.
http://s27.postimg.org/4m38wyn2r/cdas_sflux_ssta_global_July_9_14.png
You can see why next season will be weak hurricanes.
http://weather.unisys.com/surface/sst_anom.gif
Bob Tisdale
Brent Walker says: “Won’t typhoon Neoguri give the Westerly winds a kick along in the Central Pacific?”
Turns east, then north. Exactly over Japan.
http://earth.nullschool.net/#2014/07/10/1500Z/wind/isobaric/700hPa/orthographic=-176.38,38.20,636
Thanks Bob! I have learn’t a lot from your posts and your “Who turned on the heat”.
Hey you Mr. Tisdale.
What have you done with my billions of A-bombs??
John Cook
Skeptical (of) Science.
The all important (not really!) ENSO meter is below 0.5C° today, 0.434261 to be excessively “precise”:
Opening http://nomad1.ncep.noaa.gov/cgi-bin/pdisp_sst.sh?ctlfile=oiv2.ctl&ptype=ts&var=ssta&level=1&op1=none&op2=none&day=14&month=jun&year=2014&fday=14&fmonth=jul&fyear=2014&lat0=-5&lat1=5&lon0=-170&lon1=-120&plotsize=800×600&title=&dir=
Found target /tmp/CTEST14053356025571.txt
Opening http://nomad1.ncep.noaa.gov//tmp/CTEST14053356025571.txt
Data file
data from 00Z14JUN2014 to 00Z14JUL2014
“———-”
0.575651
0.62002
0.673376
0.561384
0.434261
Length of data file 96, most recent value: 0.434261
file_last 0.561384
anomaly +04