This post updates the data for the three primary suppliers of global land+ocean surface temperature data—GISS through May 2014 and HADCRUT4 and NCDC through April 2014—and of the two suppliers of satellite-based global lower troposphere temperature data (RSS and UAH) through May 2014.
Initial Notes: To make this post as timely as possible, only GISS LOTI and the two lower troposphere temperature datasets are for the most current month. The NCDC and HADCRUT4 data lag one month.
This post contains graphs of running trends in global surface temperature anomalies for periods of 13+ and 17 years using GISS global (land+ocean) surface temperature data. They indicate that we have not seen a warming halt (based on 13 years+ trends) this long since the mid-1970s or a warming slowdown (based on 17-years trends) since about 1980. I used to rotate the data suppliers for this portion of the update, also using NCDC and HADCRUT. With the data from those two suppliers lagging by a month in the updates, I’ve standardized on GISS for this portion.
Much of the following text is boilerplate. It is intended for those new to the presentation of global surface temperature anomaly data.
Most of the update graphs in the following start in 1979. That’s a commonly used start year for global temperature products because many of the satellite-based temperature datasets start then.
We discussed why the three suppliers of surface temperature data use different base years for anomalies in the post Why Aren’t Global Surface Temperature Data Produced in Absolute Form?
GISS LAND OCEAN TEMPERATURE INDEX (LOTI)
Introduction: The GISS Land Ocean Temperature Index (LOTI) data is a product of the Goddard Institute for Space Studies. Starting with their January 2013 update, GISS LOTI uses NCDC ERSST.v3b sea surface temperature data. The impact of the recent change in sea surface temperature datasets is discussed here. GISS adjusts GHCN and other land surface temperature data via a number of methods and infills missing data using 1200km smoothing. Refer to the GISS description here. Unlike the UK Met Office and NCDC products, GISS masks sea surface temperature data at the poles where seasonal sea ice exists, and they extend land surface temperature data out over the oceans in those locations. Refer to the discussions here and here. GISS uses the base years of 1951-1980 as the reference period for anomalies. The data source is here.
Update: The May 2014 GISS global temperature anomaly is +0.76 deg C. It warmed slightly (an increase of about 0.03 deg C) since April 2014.

Figure 1 – GISS Land-Ocean Temperature Index
NCDC GLOBAL SURFACE TEMPERATURE ANOMALIES (LAGS ONE MONTH)
Introduction: The NOAA Global (Land and Ocean) Surface Temperature Anomaly dataset is a product of the National Climatic Data Center (NCDC). NCDC merges their Extended Reconstructed Sea Surface Temperature version 3b (ERSST.v3b) with the Global Historical Climatology Network-Monthly (GHCN-M) version 3.2.0 for land surface air temperatures. NOAA infills missing data for both land and sea surface temperature datasets using methods presented in Smith et al (2008). Keep in mind, when reading Smith et al (2008), that the NCDC removed the satellite-based sea surface temperature data because it changed the annual global temperature rankings. Since most of Smith et al (2008) was about the satellite-based data and the benefits of incorporating it into the reconstruction, one might consider that the NCDC temperature product is no longer supported by a peer-reviewed paper.
The NCDC data source is usually here. NCDC uses 1901 to 2000 for the base years for anomalies. (Note: the NCDC has been slow with updating the normal data source webpage, so I’ve been using the values available through their Global Surface Temperature Anomalies webpage. Click on the link to Anomalies and Index Data.)
Update (Lags One Month): The April 2014 NCDC global land plus sea surface temperature anomaly was +0.72 deg C. See Figure 2. It showed a rise (an increase of +0.05 deg C) since March 2014.

Figure 2 – NCDC Global (Land and Ocean) Surface Temperature Anomalies
UK MET OFFICE HADCRUT4 (LAGS ONE MONTH)
Introduction: The UK Met Office HADCRUT4 dataset merges CRUTEM4 land-surface air temperature dataset and the HadSST3 sea-surface temperature (SST) dataset. CRUTEM4 is the product of the combined efforts of the Met Office Hadley Centre and the Climatic Research Unit at the University of East Anglia. And HadSST3 is a product of the Hadley Centre. Unlike the GISS and NCDC products, missing data is not infilled in the HADCRUT4 product. That is, if a 5-deg latitude by 5-deg longitude grid does not have a temperature anomaly value in a given month, it is not included in the global average value of HADCRUT4. The HADCRUT4 dataset is described in the Morice et al (2012) paper here. The CRUTEM4 data is described in Jones et al (2012) here. And the HadSST3 data is presented in the 2-part Kennedy et al (2012) paper here and here. The UKMO uses the base years of 1961-1990 for anomalies. The data source is here.
Update (Lags One Month): The April 2013 HADCRUT4 global temperature anomaly is +0.64 deg C. See Figure 3. It increased (about +0.10 deg C) since March 2014.

Figure 3 – HADCRUT4
UAH Lower Troposphere Temperature (TLT) Anomaly Data
Special sensors (microwave sounding units) aboard satellites have orbited the Earth since the late 1970s, allowing scientists to calculate the temperatures of the atmosphere at various heights above sea level. The level nearest to the surface of the Earth is the lower troposphere. The lower troposphere temperature data include the altitudes of zero to about 12,500 meters, but are most heavily weighted to the altitudes of less than 3000 meters. See the left-hand cell of the illustration here. The lower troposphere temperature data are calculated from a series of satellites with overlapping operation periods, not from a single satellite. The monthly UAH lower troposphere temperature data is the product of the Earth System Science Center of the University of Alabama in Huntsville (UAH). UAH provides the data broken down into numerous subsets. See the webpage here. The UAH lower troposphere temperature data are supported by Christy et al. (2000) MSU Tropospheric Temperatures: Dataset Construction and Radiosonde Comparisons. Additionally, Dr. Roy Spencer of UAH presents at his blog the monthly UAH TLT data updates a few days before the release at the UAH website. Those posts are also cross posted at WattsUpWithThat. UAH uses the base years of 1981-2010 for anomalies. The UAH lower troposphere temperature data are for the latitudes of 85S to 85N, which represent more than 99% of the surface of the globe.
Update: The May 2014 UAH lower troposphere temperature anomaly is +0.33 deg C. It is rose sharply (an increase of about +0.14 deg C) since April 2014.

Figure 4 – UAH Lower Troposphere Temperature (TLT) Anomaly Data
RSS Lower Troposphere Temperature (TLT) Anomaly Data
Like the UAH lower troposphere temperature data, Remote Sensing Systems (RSS) calculates lower troposphere temperature anomalies from microwave sounding units aboard a series of NOAA satellites. RSS describes their data at the Upper Air Temperature webpage. The RSS data are supported by Mears and Wentz (2009) Construction of the Remote Sensing Systems V3.2 Atmospheric Temperature Records from the MSU and AMSU Microwave Sounders. RSS also presents their lower troposphere temperature data in various subsets. The land+ocean TLT data are here. Curiously, on that webpage, RSS lists the data as extending from 82.5S to 82.5N, while on their Upper Air Temperature webpage linked above, they state:
We do not provide monthly means poleward of 82.5 degrees (or south of 70S for TLT) due to difficulties in merging measurements in these regions.
Also see the RSS MSU & AMSU Time Series Trend Browse Tool. RSS uses the base years of 1979 to 1998 for anomalies.
Update: The May 2014 RSS lower troposphere temperature anomaly is +0.29 deg C. It rose (an increase of about +0.04 deg C) since April 2014.

Figure 5 – RSS Lower Troposphere Temperature (TLT) Anomaly Data
A Quick Note about the Difference between RSS and UAH TLT data
There is a noticeable difference between the RSS and UAH lower troposphere temperature anomaly data. Dr. Roy Spencer discussed this in his July 2011 blog post On the Divergence Between the UAH and RSS Global Temperature Records. In summary, John Christy and Roy Spencer believe the divergence is caused by the use of data from different satellites. UAH has used the NASA Aqua AMSU satellite in recent years, while as Dr. Spencer writes:
…RSS is still using the old NOAA-15 satellite which has a decaying orbit, to which they are then applying a diurnal cycle drift correction based upon a climate model, which does not quite match reality.
I updated the graphs in Roy Spencer’s post in On the Differences and Similarities between Global Surface Temperature and Lower Troposphere Temperature Anomaly Datasets.
While the two lower troposphere temperature datasets are different in recent years, UAH believes their data are correct, and, likewise, RSS believes their TLT data are correct. Does the UAH data have a warming bias in recent years or does the RSS data have cooling bias? Until the two suppliers can account for and agree on the differences, both are available for presentation.
In a more recent blog post, Roy Spencer has advised that the UAH lower troposphere Version 6 will be released soon and that it will reduce the difference between the UAH and RSS data.
13-YEAR+ (161-MONTH) RUNNING TRENDS
As noted in my post Open Letter to the Royal Meteorological Society Regarding Dr. Trenberth’s Article “Has Global Warming Stalled?”, Kevin Trenberth of NCAR presented 10-year period-averaged temperatures in his article for the Royal Meteorological Society. He was attempting to show that the recent halt in global warming since 2001 was not unusual. Kevin Trenberth conveniently overlooked the fact that, based on his selected start year of 2001, the halt at that time had lasted 12+ years, not 10.
The period from January 2001 to April 2014 is now 161-months long—more than 13 years. Refer to the following graph of running 161-month trends from January 1880 to April 2014, using the GISS LOTI global temperature anomaly product.
An explanation of what’s being presented in Figure 6: The last data point in the graph is the linear trend (in deg C per decade) from January 2001 to May 2014. It is basically zero (about 0.02 deg C/Decade). That, of course, indicates global surface temperatures have not warmed to any great extent during the most recent 160-month period. Working back in time, the data point immediately before the last one represents the linear trend for the 161-month period of December 2000 to April 2014, and the data point before it shows the trend in deg C per decade for November 2000 to March 2014, and so on.

Figure 6 – 161-Month Linear Trends
The highest recent rate of warming based on its linear trend occurred during the 160-month period that ended about 2004, but warming trends have dropped drastically since then. There was a similar drop in the 1940s, and as you’ll recall, global surface temperatures remained relatively flat from the mid-1940s to the mid-1970s. Also note that the mid-1970s was the last time there had been a 161-month period without global warming—before recently.
17-YEAR (204-Month) RUNNING TRENDS
In his RMS article, Kevin Trenberth also conveniently overlooked the fact that the discussions about the warming halt are now for a time period of about 16 years, not 10 years—ever since David Rose’s DailyMail article titled “Global warming stopped 16 years ago, reveals Met Office report quietly released… and here is the chart to prove it”. In my response to Trenberth’s article, I updated David Rose’s graph, noting that surface temperatures in April 2013 were basically the same as they were in June 1997. We’ll use June 1997 as the start month for the running 17-year trends. The period is now 204-months long. The following graph is similar to the one above, except that it’s presenting running trends for 204-month periods.

Figure 7 – 204-Month Linear Trends
The last time global surface temperatures warmed at this low a rate for a 204-month period was the late 1970s, or about 1980. Also note that the sharp decline is similar to the drop in the 1940s, and, again, as you’ll recall, global surface temperatures remained relatively flat from the mid-1940s to the mid-1970s.
The most widely used metric of global warming—global surface temperatures—indicates that the rate of global warming has slowed drastically and that the duration of the halt in global warming is unusual during a period when global surface temperatures are allegedly being warmed from the hypothetical impacts of manmade greenhouse gases.
A NOTE ABOUT THE RUNNING-TREND GRAPHS
There is very little difference in the end point trends of 13+ year and 16+ year running trends if HADCRUT4 or NCDC or GISS data are used. The major difference in the graphs is with the HADCRUT4 data and it can be seen in a graph of the 13+ year trends. I suspect this is caused by the updates to the HADSST3 data that have not been applied to the ERSST.v3b sea surface temperature data used by GISS and NCDC.
COMPARISONS
The GISS, HADCRUT4 and NCDC global surface temperature anomalies and the RSS and UAH lower troposphere temperature anomalies are compared in the next three time-series graphs. Figure 8 compares the five global temperature anomaly products starting in 1979. Again, due to the timing of this post, the HADCRUT4 and NCDC data lag the UAH, RSS and GISS products by a month. The graph also includes the linear trends. Because the three surface temperature datasets share common source data, (GISS and NCDC also use the same sea surface temperature data) it should come as no surprise that they are so similar. For those wanting a closer look at the more recent wiggles and trends, Figure 9 starts in 1998, which was the start year used by von Storch et al (2013) Can climate models explain the recent stagnation in global warming? They, of course found that the CMIP3 (IPCC AR4) and CMIP5 (IPCC AR5) models could NOT explain the recent halt in warming.
Figure 10 starts in 2001, which was the year Kevin Trenberth chose for the start of the warming halt in his RMS article Has Global Warming Stalled?
Because the suppliers all use different base years for calculating anomalies, I’ve referenced them to a common 30-year period: 1981 to 2010. Referring to their discussion under FAQ 9 here, according to NOAA:
This period is used in order to comply with a recommended World Meteorological Organization (WMO) Policy, which suggests using the latest decade for the 30-year average.

Figure 8 – Comparison Starting in 1979
###########
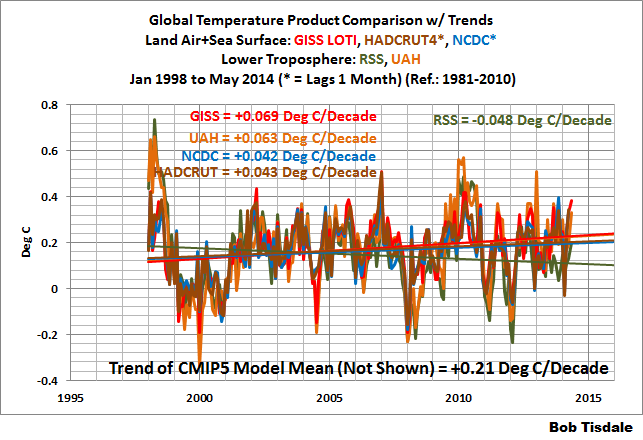
Figure 9 – Comparison Starting in 1998
###########

Figure 10 – Comparison Starting in 2001
AVERAGE
Figure 11 presents the average of the GISS, HADCRUT and NCDC land plus sea surface temperature anomaly products and the average of the RSS and UAH lower troposphere temperature data. Again because the HADCRUT4 and NCDC data lag one month in this update, the most current average only includes the GISS products.

Figure 11 – Average of Global Land+Sea Surface Temperature Anomaly Products
The flatness of the data since 2001 is very obvious, as is the fact that surface temperatures have rarely risen above those created by the 1997/98 El Niño in the surface temperature data. There is a very simple reason for this: the 1997/98 El Niño released enough sunlight-created warm water from beneath the surface of the tropical Pacific to permanently raise the temperature of about 66% of the surface of the global oceans by almost 0.2 deg C. Sea surface temperatures for that portion of the global oceans remained relatively flat until the El Niño of 2009/10, when the surface temperatures of the portion of the global oceans shifted slightly higher again. Prior to that, it was the 1986/87/88 El Niño that caused surface temperatures to shift upwards. If these naturally occurring upward shifts in surface temperatures are new to you, please see the illustrated essay “The Manmade Global Warming Challenge” (42mb) for an introduction.
MONTHLY SEA SURFACE TEMPERATURE UPDATE
The most recent sea surface temperature update can be found here. The satellite-enhanced sea surface temperature data (Reynolds OI.2) are presented in global, hemispheric and ocean-basin bases.
TABLE OF CONTENTS OF UPCOMING BOOK
I linked a copy to the post here of the Table of Contents for my upcoming book about global warming, climate change and skepticism. Please take a look to see if there are topics I’ve missed that you believe should be covered. I’ve already removed the introductory chapters for climate models from Section 1, and provided a separate section for those model discussions. Section 1 now only includes the chapters that introduce global warming and climate change topics. (Thanks, Gary.) Please also post any comments you have on that thread at my blog. Otherwise, I might miss them.
Thanks
Bob Tisdale
keep up the honorable work Bob. I look forward to your honest updates on global temp trends each month.
I am off now to look at the latest weekly NOAA ENSO update .
The temperature is looking more and more like a random walk than anything these days………
Still, just looking at the first graph for example, the overall shape is upward and warming from 1980 to now. Its hard to deny that.
Justanotherposter: agreed but random walks come in many different shapes and sizes. At the simplest level they have a drift term and a noise term. Over the last 17 years the drift term appears to be indistinguishable from zero so all that’s left is noise in the data signal. It’s the drift term we need to worry about, it’s flat because the systematic forcings are in balance whether they be natural or anthropogenic. Research for the last twenty years has focused on identifying the anthropogenic signal, there has been far less effort on discovering and assessing the natural drivers of climate change. As a result we don’t know whether a very strong GHG effect is being masked by a combination of natural factors or whether it simply isn’t there. That’s the problem climate science has got itself into, after the all the billions of dollars spent, we just don’t know.
TBear: Nobody is, so what’s your point?
Is the recent (small) rise in temperatures related to El Nino? Was there such a rise before previous El Ninos?
I don’t think anyone does deny that climate has warmed since 1980 (actually, since 1976, I think). The question is — are WE causing it. I don’t believe we are. >25% of all human CO2 emissions over the course of all of human history have been emitted since 1998 and the rate of human emissions is increasing. There has been no statistically significant change in temperature since 1998. The warming from 1912 to 1942 is nearly identical to the warming from 1975 to 2005. What we witnessed in the 20th century was, in my opinion, continued recovery from the Little Ice Age and we still have a ways to go in order to get back to what temperatures were before that event. I believe we might not get there, though, because if you look back over the past 2000 years or so, each warm period has been slightly cooler than the one before. We are already slowly sliding into the next glacial period and have been for the past 3,000 years or so.
Bob managed to get through that entire post without once mentioning that May 2014 was the warmest May in the GISS record. Well done.
DavidR (and Bob), the GISS data will be updated, China is missing according to a tweet by Gavin: https://twitter.com/ClimateOfGavin/status/479039470365605889
Espen says: June 18, 2014 at 3:06 am
Yes, it looks to me as if China’s May CLIMAT form has just April data. That would have brought the temperature down.
Nick: GISS hasn’t included wrong data, though, note that China is mostly grey on the 250km radius version of the May GISS map.
Espen says: June 18, 2014 at 3:47 am
Yes, the data probably didn’t make it into the GHCN adjusted file. So we can’t tell which way the temperature fix will go.
TBear, please enlighten us: Who is ‘denying’ it?
TBear – No, it warmed for a period of time and now the warming has stopped.
TBear says: June 18, 2014 at 12:35 am “… warming from 1980 to now. Its hard to deny that.”
No one is denying that or that it warmed since 1900 but that’s a straw man without mentioning CO2. Not only that but you are moving the goal posts further and further to suit your viewpoint. The original NASA goal post was 15 years and that was extended by Ben Santer (Livermore) to 17 years as a minimum required period needed to conclude an affect by CO2. But here you are stretching it to 34 years!
Okay.. Let’s use 35 years for a comparison period and we each get to pick two periods of modern data to compare warming rates. I’ll pick 1910 – 1945 and 1965 – 2000. Using HadCRUT 4 data, the earlier warming period, when there was about ~50 PPM less average CO2, was virtually the SAME as the latter one. As you will have to admit, the amount of CO2 had no apparent affect on warming at all.
http://woodfortrees.org/plot/hadcrut4gl/plot/hadcrut4gl/from:1910/to:1945/trend/plot/hadcrut4gl/from:1965/to:2000/trend
Try HadCRUT 3 data and the earlier warming was actually greater than the latter. http://woodfortrees.org/plot/hadcrut3vgl/plot/hadcrut3vgl/from:1910/to:1945/trend/plot/hadcrut3vgl/from:1965/to:2000/trend
Also true for the GISSTemp LOTTI data showing more warming in the earlier period.
So now I challenge you to pick two other 35 year periods to compare showing that the difference in CO2 concentration had some “dramatic” influence on the rate of warming. (Good luck, I couldn’t find any.)
Nice work Bob. One thing I noticed is how the satellite based temperature datasets (UAH & RSS) compared to GISS, NCDC, & HADCRUT4 datasets, seem to capture much larger undulations in global temperature likely due to ENSO variability, while the other datasets appear to be smoothed & particularly warmer (likely due to unnecessary adjustments) in the post 1998 era.
Figure 7 is perhaps the most telling. To the eye there a two similar patters, separated by 60 years. Temperatures rise slowly, then fall quickly, very much like the stock market.
Comparing the 1945 peak to the 2005 peak, GISS reports there has been 0.03 C warming over 60 years. 0.05C warming per century, at the time of the huge increase in human created CO2.
Comparing the high and low peaks, we do see that the variance is much higher. As much as 0.5C per century, from the low of 1950 to the peak of 2005.
It is this variance that explains “global warming”. It is not due to a change in average temperatures. Rather it is due to variability being mistaken for a trend in the average, likely because climate science concentrated on reporting averages rather than variability.
Due to the logarithmic contribution of CO2, and the near linear increase in the CO2 trend, this would argue strongly that based on the evidence, average warming to 2100 should be about 0.05C. However, there could be significantly larger spikes along the way, due to the variability in the signal. As a rule of thumb, spikes of 0.3C should be expected, but should not exceed 0.9C.
From Eric Webb on June 18, 2014 at 6:00 am:
The satellites are measuring air tempertures, even over the waters. The surface datasets are (in theory) measuring water temperatures at the surface, thus 70% of the measurements are of a natural dampener of temperature swings, thus the surface datasets using ocean data are naturally smoothed.
http://woodfortrees.org/plot/hadcrut4gl/from:1979/offset:0.5/plot/crutem4vgl/from:1979/offset:0.5/plot/hadsst3gl/from:1979/offset:0.5/plot/rss/from:1979/offset:-0.5/plot/rss-land/from:1979/offset:-0.5/
Note the offsets for clarity.
You can see with the Had-CRU products post-1998 how smoothed out the ocean temperatures are, the greater variability of land (air) temperatures, and the combined product is arguably about a 30:70 difference between them.
And with the RSS dataset, you can see greater variance over land than in the land+sea data.
Now why Had-CRU shows such a clear separation between land and sea after the 1997-98 Super El-Nino with the land running warmer, while earlier all three products averaged to the same amount and land just showed greater variability, is an interesting question.
Anyone have an answer for that?
Ah anomalies. The perfect way to hide the measured temperature. I always enjoy your posts Bob, and I understand, this is what you have to work with, but for me, anomalies don’t work anymore unless the “average temperature” is also included for each year. Because anomalies are obviously being used to hide the changes made to the data (“average temperature”) that is used to calculate the “anomaly”. The “average temperature” exists…somewhere. Why not publish it, along with the “anomaly”? Bah. This whole thing is a complete sham.
/rant
TBear says:
…the overall shape is upward and warming from 1980 to now. Its hard to deny that.
Occam’s Razor: global warming is due to the recovery of the planet from the Little Ice Age.
It’s hard to deny that, because it is the simplest explanation.
=======================
Dougmanxx,
If you would like to view a chart of global T along with CO2, see here.
What good is any reported measurement without the properly calculated margin of error being reported as well? In college my various science professors would have marked this article “F” for being incomplete. Do they no longer teach proper data reporting in science?
dbstealey says:
June 18, 2014 at 9:22 am
You did not post “Global T”, that chart is to an “anomaly”. Don’t get me wrong, it’s interesting, but misses my point. No where are the “average temperatures” that were used to calculate that chart mentioned. It’s perfectly useless and does not answer my question: “what was the average temperature used to calculate the anomalies?” A further question might be: “What was the ‘average temperature’ that was used in 2011? 2009? 2000? 1995? If they are different, why did they change? Is past weather variable? I didn’t realize the temperature change so much in the past!”
Patrick B said on June 18, 2014 at 9:36 am:
The datasets as reported by their creating organizations have already been corrected, adjusted, filtered, anomaly-ized, perhaps homogenized, and severe heavy-duty averaging has been applied to make them “global”.
Before condemning the author of the post, please explain how you and/or your college science professors would calculate those margins of error.
dbstealey states that
“Occam’s Razor: global warming is due to the recovery of the planet from the Little Ice Age.
It’s hard to deny that, because it is the simplest explanation.”
No its not – that just wishful thinking. You don’t define how long this recovery is supposed to last nor what the equilibrium temperature will be to define a full recovery. Its a ‘how long is a piece of string’ argument.
Because it is possible to put numbers on the various forcing mechanisms, then it is likely that a significant part of the recent warming is due to the increasing CO2 concentration in the atmosphere – that is the simplest explanation because it is the one that the science points to.
With the May numbers in, NASA GISS LOTI is running at +0.66C so far this year cf 1951-1980, which is close to record – and without a notable El Nino so far.
Now that lack of change is worse that first thought, is the pause long enough for a reasonable conclusion to be that CO2 stabilises the climate?
Out of curiosity I was interested in how well the RSS data matched up with the actual surface station data. So I compared the two for various individual stations around the world. I used the global gridded RSS data and station data from Environment Canada and GISS. I compared the value in the RSS grid cell that contained the station with the station data (adjusted to the RSS base normal period). Admittedly, a rather crude method, but good enough for a first run. I found that the two compared very well, which one would hope. However, the RSS data generally did not have the extreme values (highs and lows) that the station data showed. The RSS data was almost like a slightly smoothed version of the station data. This is not surprising since the RSS data is an integrated value of the lower troposphere. I can’t really say anything startling about my findings, but it was an interesting exercise.
It is figure 8 that is the most telling for me. You would have to be blind not to see the “longterm” upward trend looking at that. While I concede you can play with starting points to show minimal warming using 1998, in fig 8 you can clearly see why the super El Nino is used to try to deny warming. Take that out and it is up all the way. Or… leave it in and see what happens with the next El Nino. If that sets new records, then I see no argument left.
Simon says:
June 18, 2014 at 12:07 pm
????
So, before man-released CO2 was significant, the global average temperature rose, fell, and was steady.
AFTER man-released CO2 was present, global average CO2 decreased for 30 years (1945-1975),
increased for 21 years (1975 – 1996) has been steady for 17+ years (1996 – 2014).
What does your chosen date of 1998 have to do with anything? 1998 is not critical year, nor a critical temperature.
What long-term trend are you denying? That “When CO2 increases, the earth’s temperature cools or remains steady for more years than it warms up?”
James Abbott says:
June 18, 2014 at 10:31 am
You don’t define how long this recovery is supposed to last nor what the equilibrium temperature will be to define a full recovery.
——————————————————————————————————————————-
Can you define what the ‘equilibrium temperature’ of the last 11,000 years is?
Simon says:
June 18, 2014 at 12:07 pm
———————————————————
You are calling a 34 year long chart ‘long term’. What do you call a 1,000 year chart?
goldminor You miss the point – read the thread again – I was referring to dbstealey’s assertion that recent warming is simply a rebound from the Little Ice Age. if that is the case he should be able to identify at what temperature the recovery is complete and over what period the recovery lasts. Otherwise its a catch-all position.
And Simon is exactly right. The large El Nino of 1998 clearly affects the way the stats can be done and is a convenient start point if you seek to flatten the subsequent trend. But even so the current pause started in 2002, not 1998.
The main point is that when we get another large El Nino, as we will at some point, then all other things being equal, from the higher base we are now at we will likely see record warm – which cannot be massaged away.
goldminor, love the questions. To answer (in my smartalec way) the following questions:
1) What is the average temp? For the last 2 million years: Cold, real darn cold.
2) What is “long term”? As long as life has been on Earth is a significant way so 400 million years give or take a few dozen million.
3) Define how long this recover is supposed to last? Sure. We’re about done. Sometime between now and 2000 years we’ll be heading into another ice age. Dr Easterbrook has his “Good, Bad & Ugly” predictions for this negative spell of the sine wave known as PDO. Check him out.
4) Mike M: Those are very interesting graphs but I’m curious about why the 1945 to 1970 dropped so much quicker than our current spell? I doubt CO2 is the cause but if a causation can be shown I’m all ears. Until then Dr Easterbrook’s explanation of each PDO providing a higher level for the next one to start at seems likely. What causes that? Don’t know yet.
5) Bob. Great to see you posting regularly. Hope things are going well for you on all fronts. “Who turned on the heat” was the best 5 bucks I’ve spent in a long time. Highly recommend it.
Cheers
goldminor
You are calling a 34 year long chart ‘long term’. What do you call a 1,000 year chart?
—————————–
It’s as long as we have on the satellite data. But you can go back 100 years and it is still very much up with the odd pause.
Eric Webb says: “Nice work Bob. One thing I noticed is how the satellite based temperature datasets (UAH & RSS) compared to GISS, NCDC, & HADCRUT4 datasets, seem to capture much larger undulations in global temperature likely due to ENSO variability, while the other datasets appear to be smoothed & particularly warmer (likely due to unnecessary adjustments) in the post 1998 era.”
Eric, lower troposphere temperatures respond differently to ENSO than surface temperatures. During an El Nino, the lower troposphere warms in two ways: First, in response to the surface warming. Second, in response to the additional evaporation from the tropical Pacific. When all of the additional moisture condenses, it releases heat to the troposphere.
kadaka (KD Knoebel) says: “Now why Had-CRU shows such a clear separation between land and sea after the 1997-98 Super El-Nino with the land running warmer, while earlier all three products averaged to the same amount and land just showed greater variability, is an interesting question.”
I suggest you subtract the HADSST3 data from the CRUTEM4 data to see if there truly is a shift after the 1997/98 El Nino.
Regards
Dougmanxx says: “Ah anomalies. The perfect way to hide the measured temperature. I always enjoy your posts Bob, and I understand, this is what you have to work with, but for me, anomalies don’t work anymore unless the “average temperature” is also included for each year…….”
We discussed the reasons the data suppliers give for presenting their data as anomalies in the post here:
http://bobtisdale.wordpress.com/2014/01/25/why-arent-global-surface-temperature-data-produced-in-absolute-form/
Patrick B said on June 18, 2014 at 9:36 am:
What good is any reported measurement without the properly calculated margin of error being reported as well? In college my various science professors would have marked this article “F” for being incomplete. Do they no longer teach proper data reporting in science?
The datasets as reported by their creating organizations have already been corrected, adjusted, filtered, anomaly-ized, perhaps homogenized, and severe heavy-duty averaging has been applied to make them “global”.
Before condemning the author of the post, please explain how you and/or your college science professors would calculate those margins of error.
@kadaka (KD Knoebel)
I’m not a statistician, but if you are claiming to give me measurements of temperature, you better be ready to tell me how accurate that measurement is. If not, the measurement is worthless. From my limited knowledge, I’m fairly confident that even the satellite measurements will have a margin of error that will overwhelm the effects they claim to measure. I’ve never believed any of the systems have the ability to measure “world temperature” to within a degree much less hundredths of a degree.
Simon says:
June 18, 2014 at 1:13 pm
—————————————-
Good point, if you do not look further back then you will never see that the globe has gradually cooled in the real ‘long term’.
James Abbot said:
“The main point is that when we get another large El Nino, as we will at some point, then all other things being equal, from the higher base we are now at we will likely see record warm – which cannot be massaged away.”
i don’t get your point. It is as if you don’t know the position held by most of us on this board. We are not denying that it has warmed and has been warming for 170 years, we deny that CO2 had very much to do with it. If we get another El Nino that FINALLY breaks the 1998 global temperature record, then we will have warmed a very small amount since 1998 (until the La Nina follows and brings that average down)….but who cares? what does that prove? just that the earth has been warming for 170 years and is still warming. The only way to prove the CO2 connection is for the earth to begin rapidly warming and making up for the past 13-17 years of no warming.
Do you get that we are not questioning warming? We are questioning the causation. CO2 may play a small part, but it is clearly NOT as much as has been claimed.
James Abbott says:
June 18, 2014 at 1:07 pm
——————————————–
That is a similar line of thought to some recent comments made in the last few days. It goes like this “Why can’t the IPCC or related organizations forecast the end of the ‘pause’, and the resumption of the warming?”. The difference in the answer to either question would be that the sceptic would say “I do not know enough of the baseline parameters that created the warming pulse to ascertain its ending”. The IPCC would say “that doesn’t matter, as our models are only meant to show what will happen after all of us alive today have gone on to the afterlife”. Pretty hard to dispute their claims, isn’t it?
I like to think of the pause as a plateau. Once you are on top of a plateau, it is then all downhill from there on. I would say that we are now witnessing the end of the ‘recovery’ from the LIA. Although, the word recovery does not seem quite correct, unless the term is also going to be applied to all of the past Warm Periods. Even then what is being stated? If after every ‘Warm Period/recovery’ there is a further fallback in temps to a lower level, how can the Warm Periods be considered a recovery in the long term?
Are you sure that you believe in co2 induced warming, or do you really believe in El Nino induced warming? Look at Simon,s ridiculous statement on El Nino. He blithely presumes that if the 1998 Grand El Nino never occurred that global temperature would still be the same today. How can he presume that? Logically, I would think that if 1998 did not occur, then all years after that would have started from a different base of conditions thus leading to randomly different results in the following years, as compared to the actual history of the last 16 years. The El Nino and La Nina are integral parts of the overall climate system.
James Abbot said: “The main point is that when we get another large El Nino, as we will at some point, then all other things being equal, from the higher base we are now at we will likely see record warm – which cannot be massaged away.”
I think most people — Bob included — have acknowledged the likelihood that a significant El Nino would cause a temperature increase, and would probably lead to a new “record.” But this isn’t really about “records” — it’s about the rate at which the planet was “supposed” to warm (according to the models) given the amount of CO2 that’s been pumped into the air. We are so far below the models that even a “record-breaking” year won’t get us back into the range the models predicted — to say nothing of the fact that once the El Nino finally ebbs, we’ll likely enter another multi-year stretch of stagnant temperatures, moving us even further below the models’ ever-upward trend.
Very few people think the “pause” is, in and of itself, proof that global warming doesn’t exist. What the pause does prove is that the rate of warming is nowhere near the doomsday scenarios that were (and still are, daily) predicted — and may even be *gasp* beneficial!
MikeUK says: “Is the recent (small) rise in temperatures related to El Nino?”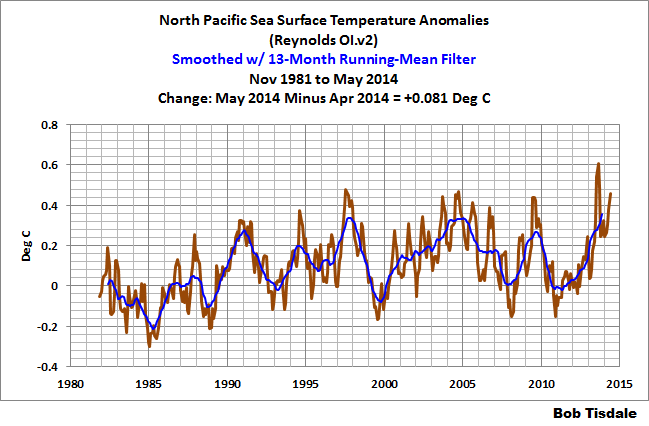
Are you discussing what appears to be a slight upward shift in the data (GISS for example) in mid-2013? If so, I would tend to blame it on the unusual warming event in the extratropical North Pacific. See the post here:
http://bobtisdale.wordpress.com/2013/08/06/about-the-unusual-warming-event-in-extratropical-north-pacific-sea-surface-temperature-anomalies/
It’s still impacting the sea surface temperatures of the North Pacific as seen in this graph from the most recent sea surface temperature update:
James Abbott says:
I was referring to dbstealey’s assertion that recent warming is simply a rebound from the Little Ice Age. if that is the case he should be able to identify at what temperature the recovery is complete and over what period the recovery lasts.
1) It is far more than an “assertion”. There is copious empirical evidence showing that the planet has been warming since the LIA.
2) It is the alarmist crowd that depends on assertions, because they lack any testable, measurable evidence showing that CO2 is the cause of global warming — that is merely Abbott’s belief.
3) Abbot throws out this nonsense: “…he should be able to identify at what temperature the recovery is complete and over what period the recovery lasts. No.
No one can predict the future of global warming with any clarity. What we can show is that there is no empirical evidence proving that CO2 has any effect on global T. Abbott believes there is, but he never produces any testable, measurable evidence.
I and others have consistently written that warming may resume, or it may not — or cooling could commence. The only thing we know for certain is that for many years now, global warming has stopped. That fact causes great consternation among alarmists, because it is yet another of their failed predictions.
In fact, none of their alarming CAGW predictions have come true. They have been 100.0% wrong. Therefore, they depend on assertions, and name calling, and appeals to authority, and confirmation bias [cherry-picking], and the belief that anything goes when ‘saving the planet’.
Whatever they’re doing, it isn’t science.
dbstealey
What we can show is that there is no empirical evidence proving that CO2 has any effect on global T.
———————————————————————————————-
I would suggest many even here would suggest this statement is false. There is loads of evidence the warming witnessed has been caused (at least in part) by increased MM CO2. I think pretty much all prominent skeptics who work in and around the field accept this fact including AW himself. It’s just they don’t agree the resulting damage will be catastrophic.
I would denying the contribution of CO2 to present day warming is so far outside the debate it does the skeptical argument no good at all.
So far, there seems to be no imminent signs of catastrophic warming or catastrophic cooling.
In any sense, the people who believe those things are coming all being wrong would be the best case scenario for civilization as a whole. That could mean many more years of ever increasing CO2, which in effect would further reduce drought and increase rainfall by way of increasing biosphere productivity.
So far, I haven’t seen any signs over here that the next Little Ice Age is upon us, but the drought easing rainfall has sure led to the strongest plant growth seen around here in years (perhaps a bit of that even being CO2 induced as it also increases the growth response from rainfall and the nitrates it washes into the soil). A steady rain pattern here for sure will mean the Summer biosphere growth going gangbusters this year.
From Bob Tisdale on June 18, 2014 at 1:36 pm:
But Mr. Tisdale, it is clearly evident on that graph, the land temperatures are averaging a step higher than the oceans.
I do not see the physical basis of subtracting ocean from land except to eyeball the differences. I’ll make it obvious. I’ll cut out the transition period, from 1997 up to 2000, and use it for linear trend endpoints, which is also why I’m trimming to 2014 as applicable for whole years.
http://woodfortrees.org/plot/hadcrut4gl/from:1979/to:2014/plot/hadcrut4gl/from:1979/to:1996/trend/plot/hadcrut4gl/from:2000/to:2014/trend/plot/crutem4vgl/from:1979/to:2014/plot/crutem4vgl/from:1979/to:1996/trend/plot/crutem4vgl/from:2000/to:2014/trend/plot/hadsst3gl/from:1979/to:2014/plot/hadsst3gl/from:1979/to:1996/trend/plot/hadsst3gl/from:2000/to:2014/trend
I threw the 1979-2014 data into a spreadsheet:
averages__hadcrut4gl_crutem4vgl_hadsst3gl_land-ocean1979-1996______0.137______0.225_____0.085______0.140
2000-2014______0.462______0.754_____0.344______0.411
As seen in the satellite era, the gap has grown much larger.
Extending back to 1900, the three products have arguably the same trend line, differences negligible. From:2000 to:2014 is radically different.
Which is very interesting. Both land and ocean have matched warming rates from:1900 to:1996. From:2000 to:2014 the ocean warming is tiny, 0.033°C/decade, likely not there at all statistically. The land warmed more than three times as fast, 0.098°C/decade, a degree a century.
Is “global warming” now land-only?
The warmists have been claiming dire consequences from global warming for many years now. I have noted that occasionally someone asks about catastrophic global cooling. My question would be who has forecast such an event? Overall, our level of advanced technology will not face the same hardship from cooling that people 2 hundred years ago had to endure. The main issue from cooling is that it will lead to changes in the growing season. The fact that there are now 7+ billion mouths to feed on this world makes the threat of cooling a real concern, which should be included into policy decisions around the world. The opposite can not be said about the warming which has helped farmers produce more than ever before.
I foresee a change to cooling as being underway. Only time will show if the thought is correct, or not. Many others who frequent WUWT feel similar in regards to a ‘probable cooling’ taking place now that should gather momentum as it continues. The rate of the cooling onset should be similar to the rate of the warming onset. There is a gradually inclining curve which swings up towards it,s peak at some point in time, and the reverse will happen in the decline. I always liked pointing to the CET record as a great example of how nature maintains a relative balance in it,s movements. Judging from the current data, the trend appears to be past the peak and already starting down since the mid 2000s, approximately. The solar minimum is always a cooler time. It is thought that the maximum is now over, and it will be interesting to see how the ssn count tapers off over the next 4 or 5 years.
Simon says:
I would suggest many even here would suggest this statement is false. There is loads of evidence the warming witnessed has been caused (at least in part) by increased MM CO2.
Then as I have been requesting for several years now, please post testable, measurable, empirical evidence showing conclusively the fraction of a degree of warming directly attributable to human emitted CO2. If you do so, you will be the first.
I have also stated repeatedly that I think CO2 has some effect on temperature, although at current concentrations that effect is simply too small to measure.
There is no scientific evidence that I am aware of showing a direct causal relationship, where ∆CO2 is the cause of ∆temperature. Again, if you have such evidence, please post it [keeping in mind that neither peer reviewed papers nor computer models constitute evidence. ‘Evidence’ is raw data and/or empirical, quantifiable obsevations].
That said, it is only my personal belief/conjecture that CO2 probably causes some minor warming. But there is no measurable cause-and-effect to support that conjecture. There is, however, a mountain of evidence showing that ∆T causes ∆CO2, and that causation is measurable, from years, to hundreds of millennia. I have yet to see the reverse. If you have such evidence, please post it.
Science is all about falsification. But there is nothing to falsify in the conjecture that “human emitted CO2 causes global warming”. That is not nit-picking. That is being scientifically rigorous; something clearly lacking in the alarmist crowd. Either post verifiable evidence, or that belief is merely a conjecture.
TBear says:
June 18, 2014 at 12:35 am
“Still, just looking at the first graph for example, the overall shape is upward and warming from 1980 to now. Its hard to deny that.”
What is your point?
The key indisputable fact is that, while CO2 % has steadily increased in the atmosphere for an extended period (circa 12 to 17 years); the temperature has not risen, as long claimed by the “team” to be caused by CO2. If fact the President, John Kerry and many others still claim, incredibly, that temperatures are still rising because of CO2 increase. Are they ignorant of the facts, living in a bubble where they are surprised by all the recent events, or are they trying to deceive us knowing that the MSM will cover up for them?
Any responsible person who understands correlations would acknowledge the fact that the claim linking increasing CO2 causes global warming is in serious question. Only a zealot or one blinded by preconceived concepts, regardless of the data, would ignore the fact that the claim that man causes global warming is broken.
You can argue all you want about selection of starting points, etc the link has been seriously broken. Admit it.
James Abbott, I think “recovery” from the LIA is an unfortunate phrase. That phrase implies that the LIA was abnormal and we have recovered from it. No state of climate is “normal.” It is always changing. I prefer the phrase: “emerging from the LIA.”
An Inquirer,
James Abbott also used the term “rebound”.
The fact is that the LIA was abnormally cold. It was a world wide event, and one of the coldest episodes of the entire 10,700 year Holocene. No one knows for sure what caused it.
Anyway, I see little difference between ’emerging’, ‘recovery’, and ‘rebound’ None are due to rising CO2, which is the unfounded claim of the alarmist crowd. The recovery has remained within clearly defined parameters, and global warming is certainly not accelerating. That by itself deconstructs the “carbon” scare/hoax.
I agree that no particular state of the climate is ‘normal’, unless they all are. The climate is natural, it is not man-made. What is observed are natural fluctuations within a rising global warming trend, and CO2 has nothing measurable to do with it.
dbstealey
Evidence = Troposphere warming…. Stratosphere cooling.
“the 1997/98 El Niño released enough sunlight-created warm water from beneath the surface of the tropical Pacific to permanently raise the temperature of about 66% of the surface of the global oceans by almost 0.2 deg C.”
—
I’m glad to know that the temperature increase from the 1997/98 El Niño is “permanent” and therefore the planet should never again experience another ice age.
Simon:
Your post at June 18, 2014 at 8:49 pm says in total
That is too terse.
Please explain
(a) why you think “Troposphere warming…. Stratosphere cooling” is “evidence” of anthropogenic (i.e. man-made) global warming (AGW),
(b) the recent (i.e. since 1950) histories if those parameters,
and
(c) what those histories indicate about the existence of AGW.
Richard
Simon,
For many years the alarmist prediction was that a tropospheric hot spot — the so-called ‘fingerprint of AGW’ — would appear. But when the evidence was assembled, there was no tropospheric hot spot. It didn’t exist.
So that ‘evidence’ is merely evidence of another failed prediction.
As for a cooling stratosphere, that was a later fallback position, predicted after the failure of the supposed tropospheric hot spot. But like the tropospheric hot spot, that prediction didn’t pan out either, because the stratosphere stopped cooling.
Thus, your putative ‘evidence’ is not evidence at all. The alarmist crowd’s CAGW predictions have failed. All of them.
kadaka (KD Knoebel) says: “But Mr. Tisdale, it is clearly evident on that graph, the land temperatures are averaging a step higher than the oceans.”
The upward shift in the CRUTEM4 data after the 1997/98 El Nino would be even more evident if you’d subtract the HADSST3 data from it. You’d also see that there was also a shift in the volatility, with SST and LST varying at different rates in response to the volcanos and strong ENSO events before 1997/98 than after. Data are right here in the KNMI Climate Explorer. It would take you 2 minutes:
http://climexp.knmi.nl/selectfield_obs.cgi?someone@somewhere
Then you could search the data for where the shift occurred. You’ll likely find it in the mid-to-high latitudes of the Northern Hemisphere (20N-60N).
Regards
Anyone fancy doing a pixel count on gray areas where nasa has no coverage according to this tweet ?
https://twitter.com/ClimateOfGavin/status/479039470365605889
Its a fairly significant proportion of land mass has almost no temperature.
Adam from Kansas says: “So far, there seems to be no imminent signs of catastrophic warming or catastrophic cooling.”
Thank you. Much ado about nothing, as they say.
jamesibbotson says: “Anyone fancy doing a pixel count on gray areas where nasa has no coverage according to this tweet ?”

It’s worse than that. The NOAA ERSST.v3b sea surface temperature data used by GISS has been infilled, so you’re missing the areas where there’s also no source data for the ocean surfaces. Here’s a map of the source ICOADS SST data for May 2014.
Cheers
Aerosols!
Mike M says:
Aerosols!
Or: Carbon soot!
That is all speculation. Conjecture, with no supporting measurements. Just like there are no supporting measurements quantifying the degree of global warming due to AGW.
Just prior to the Holocene global temperatures fluctuated by tens of whole degrees, within only a decade or two. But over the past century and a half, global T has been amazingly steady, fluctuating only ≈0.8ºC. That is nothing.
Keep that in mind when self-serving bureaucrats like Gavin Schmidt run in circles and arm-wave like Chicken Little over a few tenths of a degree fluctuation.
dbstealey
An expanded version of why there is ample evidence for the troposphere warming and the stratosphere cooling…. straight from the Royal Society and the US Academy of Sciences.
“In the early 1960s, results from mathematical/physical models of the climate system first showed that
human-induced increases in CO2 would be expected to lead to gradual warming of the lower atmosphere
(the troposphere) and cooling of higher levels of the atmosphere (the stratosphere). In contrast, increases in the Sun’s output would warm both the troposphere and the full vertical extent of the stratosphere. At that time, there was insufficient observational data to test this prediction, but temperature measurements from weather balloons and satellites have since confirmed these early forecasts. It is now known that the observed pattern of tropospheric warming and stratospheric cooling over the past 30 to 40 years is broadly consistent with computer model simulations that include increases in CO2
and decreases in stratospheric ozone, each caused by human activities. The observed pattern is not consistent with purely natural changes in the Sun’s energy output, volcanic activity, or natural climate variations such as El Niño and La Niña.”
But I come back to my point. The stance of denying the influence of CO2 on the warming climate is now redundant. The debate is now about how much warming and how much damage…. and what is to be done, if anything?
“the 1997/98 El Niño released enough sunlight-created warm water from beneath the surface of the tropical Pacific to permanently raise the temperature of about 66% of the surface of the global oceans by almost 0.2 deg C.”
==========
El Niño blocked the upwelling from the deep ocean in the Eastern Pacific that normally moderates temperatures in the Pacific and globally. It is lack of cooling from the deep that causes temperatures to rise with each El Niño. When El Niños are more frequent temperatures rise, when they are less frequent upwelling increases and we get cooling. It is the cold water from the deep oceans that leads to more or less energy at the surface, than can be explained by solar radiation alone.
Simon:
At June 19, 2014 at 11:09 am you assert
No! Standing up for truth is never “redundant”.
There is no “evidence” for an “influence of CO2 on the warming climate”; none, zilch, nada. Three decades of research conducted world-wide at a cost of over US$5 billion per year has failed to find any such evidence.
One could equal the veracity of your assertion by saying
The stance of denying the influence of the Easter Bunny on the warming climate is now redundant. The debate is now about how much warming and how much damage…. and what is to be done, if anything?
It seems I need to provide the following yet again.
The Null Hypothesis says it must be assumed a system has not experienced a change unless there is evidence of a change.
The Null Hypothesis is a fundamental scientific principle and forms the basis of all scientific understanding, investigation and interpretation. Indeed, it is the basic principle of experimental procedure where an input to a system is altered to discern a change: if the system is not observed to respond to the alteration then it has to be assumed the system did not respond to the alteration.
In the case of climate science there is a hypothesis that increased greenhouse gases (GHGs, notably CO2) in the air will increase global temperature. There are good reasons to suppose this hypothesis may be true, but the Null Hypothesis says it must be assumed the GHG changes have no effect unless and until increased GHGs are observed to increase global temperature. That is what the scientific method decrees. It does not matter how certain some people may be that the hypothesis is right because observation of reality (i.e. empiricism) trumps all opinions.
Please note that the Null Hypothesis is a hypothesis which exists to be refuted by empirical observation. It is a rejection of the scientific method to assert that one can “choose” any subjective Null Hypothesis one likes. There is only one Null Hypothesis: i.e. it has to be assumed a system has not changed unless it is observed that the system has changed.
However, deciding a method which would discern a change may require a detailed statistical specification.
In the case of global climate no unprecedented climate behaviours are observed so the Null Hypothesis decrees that the climate system has not changed.
Importantly, an effect may be real but not overcome the Null Hypothesis because it is too trivial for the effect to be observable. Human activities have some effect on global temperature for several reasons. An example of an anthropogenic effect on global temperature is the urban heat island (UHI). Cities are warmer than the land around them, so cities cause some warming. But the temperature rise from cities is too small to be detected when averaged over the entire surface of the planet, although this global warming from cities can be estimated by measuring the warming of all cities and their areas.
Clearly, the Null Hypothesis decrees that UHI is not affecting global temperature although there are good reasons to think UHI has some effect. Similarly, it is very probable that AGW from GHG emissions are too trivial to have observable effects.
The feedbacks in the climate system are negative and, therefore, any effect of increased CO2 will be probably too small to discern because natural climate variability is much, much larger. This concurs with the empirically determined values of low climate sensitivity.
Empirical – n.b. not model-derived – determinations indicate climate sensitivity is less than 1.0°C for a doubling of atmospheric CO2 equivalent. This is indicated by the studies of
Idso from surface measurements
http://www.warwickhughes.com/papers/Idso_CR_1998.pdf
and Lindzen & Choi from ERBE satellite data
http://www.drroyspencer.com/Lindzen-and-Choi-GRL-2009.pdf
and Gregory from balloon radiosonde data
http://www.friendsofscience.org/assets/documents/OLR&NGF_June2011.pdf
Indeed, because climate sensitivity is less than 1.0°C for a doubling of CO2 equivalent, it is physically impossible for the man-made global warming to be large enough to be detected (just as the global warming from UHI is too small to be detected). If something exists but is too small to be detected then it only has an abstract existence; it does not have a discernible existence that has effects (observation of the effects would be its detection).
To date there are no discernible effects of AGW. Hence, the Null Hypothesis decrees that AGW does not affect global climate to a discernible degree. That is the ONLY scientific conclusion possible at present.
And, of course, for the same reason the Null Hypothesis decrees that the Easter Bunny does not affect global climate to a discernible degree.
Richard
Richard. I think you need a little lie down or you are going to turn into butter.
Simon:
Your post at June 19, 2014 at 2:42 pm which says in total
It seems you are pointing out that my being an exemplar of the milk of human kindness has risk.
OK. Let me correct the risk by making a statement so simple and undeniable that even you may understand it.
Simon, every statement in each of your posts to this thread is unadulterated nonsense.
I hope that adjusts things to be as you want them to be.
Richard
Richard.
Simon, every statement in each of your posts to this thread is unadulterated nonsense.
Why thank you. Maybe the butter has been in the sun a bit long and gone sour? In a warming world that happens faster.
Simon
Simon says:
An expanded version of why there is ample evidence for the troposphere warming and the stratosphere cooling…. straight from the Royal Society and the US Academy of Sciences.
Another Appeal to Authority fallacy. Think for yourself instead of relying on corrupted societies. [See Section 2].
And:
But I come back to my point. The stance of denying the influence of CO2 on the warming climate is now redundant.
Nonsense. Your point, as usual, is simply an assertion — just like Phil’s. You both avoided my challenge upthread:
“…as I have been requesting for several years now, please post testable, measurable, empirical evidence, showing conclusively the fraction of a degree of warming directly attributable to human-emitted CO2. If you do so, you will be the first.”
Enough with your Belief-based assertions. They are nothing more than your opinion. Try using the Scientific Method for once, and post testable, measurable scientific evidence.
Next, pay attention to what Richard Courtney is trying to tell you about the climate Null Hypothesis, which has never been falsified. Your last comments to him makes it clear that you have run out of rational arguments.
Finally, you say:
The debate is now about how much warming and how much damage…. and what is to be done…
Complete nonsense, unless and until you can specifically quantify the degree of global warming that is attributable to anthropogenic CO2 using testable measurements. Your Precautionary Principle argument is another fallacy: you might get hit by a car when you cross the street, so either never cross the street, or we need to build a multi-billion dollar network of pedestrian bridges across the country on roads everywhere. Otherwise, there’s no telling how much damage and injuries might result. Same-same as: “What is to be done?” about [non-existent] AGW.
Nothing should be done, until we at least understand how the climate works. Science is all about predictions. Isn’t it? But not one CAGW prediction has ever happened. They have all been flat wrong. The miserable failure of GCMs to predict the current 17+ years of no global warming is egg on the faces of the Chicken Little contingent. Why should anyone listen to a crowd that has been 100% wrong?
Wake me when the first wild-eyed alarmist prediction comes true. Until then, nothing should be done — and the money already wasted on the “carbon” scare should be refunded to taxpayers.
dbstealey
Science is all about predictions. Isn’t it? But not one CAGW prediction has ever happened. They have all been flat wrong
————————-
Seems to me I gave you a prediction that came true with the troposphere and I supplied you with a reference from two reputable sources. Seems to me I have no chance convincing you if you don’t accept what I have offered. We could g on and on but it would be pointless you have not eyes that see.
Have a nice day.
Simon,
I posted empirical evidence showing that stratospheric cooling has stopped. Furthermore, that was only half of your [non]evidence. The other half was the predicted tropospheric hot spot. I also posted empirical evidence showing that prediction was also a failure.
The one who refuses to accept reality is you, my friend. Catastrophic AGW is your religion, therefore you reject real world proof that your predictions have all failed.
So run along now back to Pseudo-skeptical Pseudo-science, or realclimate, where you can be among other anti-science head nodders. They like baseless assertions at those thinly-trafficked blogs, so long as you toe the swivel-eyed Chicken Little line. But here, we like testable, measurable, verifiable science
dbstealey:
In your post at June 19, 2014 at 3:33 pm you say to Simon
Yes, you did.
I write to ensure onlookers recognise that Simon knows his so-called “evidence” indicates the opposite of his assertions. And we know he knows because he did not reply to my post addressed to him at June 19, 2014 at 1:00 am which said in total
I knew the answers to those requests, and you subsequently provided references which answered those requests.
If those answers had supported Simon’s assertions then he would have wanted to provide – or at least to support – those answers. He chose to ‘forget’ those answers and that can only be an indication that he knows those answers refute his assertions.
Richard
Simon, you fail to consider the caveats of general circulation models, caveats the authors admit to. Do you know what they are? And what they may have in terms of power to affect climate and weather pattern variations if we understood them more fully? Do you know that weather pattern variations are known by all climate scientists to not cancel out? Some intrinsic natural long term variations last 60 years or more and models are notoriously bad at replicating them without using fudge factors. In fact, whenever a model uses a fudge factor, it is because the mechanisms in terms of dynamics or calculations are not fully understood.
Pamela Gray
I’m not really interested in models. I am just making the point that to deny CO2’s hand in modern day warming is to stick your head in the sand. It is widely accepted by both sides of the argument now that CO2 is a greenhouse gas and as such it has a warming effect. Whether or not it is catastrophic is the only real discussion now. dbstealey assumes I think it will be catastrophic. He assumes wrong. What I am sure of, is that it is entirely possible it will be, but not guaranteed.
dbstealey
During our discussion you made the point that I visit the likes of Skeptical Science and other sites that look at the other side of the argument. Actually I am proud to say that I do, along with being a frequent visitor here. I think it important to get all angles when it comes to a complex debate like this. The fact you think sites like that are beneath contempt, I think says a lot about your fixed thinking.
Simon,
You are correct. I view blogs like Skeptical Science [SS] as beneath contempt. That blog in particular has censored several of my comments. I finally gave up trying. And I was very careful to not give them any cause to censor my comments, having read here about others being censored by SS. I had only posted graphs like this. But John Cook apparently does not want people like you or anyone else seeing evidence like that.
There is no “other side of the argument” at SS, because they do not allow any real debate. The truth is sifted from the narrative at WUWT through honest and open debate. But if debate is not permitted, then the blog is nothing but propaganda, hoping to lead readers by the nose. You would be wise to shun any blog that refuses to allow open and uncensored debate.
SS is unreliable, censoring, and worse, they delete portions of skeptics’ comments to make the comment mean something entirely different — and then they argue with their fabrication! Giving them any credence at all is dealing with the devil. It’s bad business.
Finally, Richard Courtney is right when he points out that you shy away from answering anything. We are both waiting for you to address our points. If you don’t, you are just running interference. I suspected that from your first comment yesterday.
What’s up with the idea that an El Nino permanently raises global temperature, but the La Ninas after 1998 (two of them double-dip) didn’t similarly ratchet global temperature downward? It seems to me that CO2 has a significant effect, merely less than claimed by warmists as opposed to zero or negligible.
dbstealey says:
There is no “other side of the argument” at SS, because they do not allow any real debate. The truth is sifted from the narrative at WUWT through honest and open debate. But if debate is not permitted, then the blog is nothing but propaganda, hoping to lead readers by the nose. You would be wise to shun any blog that refuses to allow open and uncensored debate.
——————————————————————————————————–
I agree there is a smugness about SS, but it also, (like here) has the odd good article. The site I find most informative, is Realclimate.
I am still finding a negative trend from 2002, rthis is for most of the important datasets:
http://www.woodfortrees.org/plot/hadcrut4gl/from:1987/to:2015/plot/hadcrut4gl/from:2002/to:2015/trend/plot/hadcrut3gl/from:1987/to:2015/plot/hadcrut3gl/from:2002/to:2015/trend/plot/rss/from:1987/to:2015/plot/rss/from:2002/to:2015/trend/plot/hadsst2gl/from:1987/to:2015/plot/hadsst2gl/from:2002/to:2015/trend/plot/hadcrut4gl/from:1987/to:2002/trend/plot/hadcrut3gl/from:1987/to:2002/trend/plot/hadsst2gl/from:1987/to:2002/trend/plot/rss/from:1987/to:2002/trend
I have three data sets of my own, now updated to 2014, namely for minima, maxima and means, which in fact I trust more than all the others.
An interesting fact that I observed now (after the update) from the drop in minimum temperatures is that it forms a perfect binomial curve, rsquare=1, when we set the speed of change in degrees C/annum out against time..
Amazing, isn’t it?
There is no AGW, whatsoever. There is no room for it in my curve.
Simon:
At June 20, 2014 at 12:35 am you say
Oh! So you are their remaining reader.
Have you told them who you are? Investigation of why you have an interest in their biased, distorted and untrue propaganda may help them to find more gullible fools capable of being deluded by their nonsense which most people saw through years ago.
Richard
From Simon on June 20, 2014 at 12:35 am:
Dang, been many years since I even peeked at it.
The newest article is June 1 with 364 comments, next is May 8 with 64 comments, May 2 was an open thread with 394, April 30 with 21 comments…
Thus I conclude you absorb information very slowly, can fully digest at most only a few articles a month, and prefer to do it in the solitude of a quiet and virtually deserted web site.
I know a person who got SSI with far less of a learning disability. Good news, if you’re a US citizen you likely qualify for free money and medical for life.
Phil.:
You provide a good attempt at disingenuous distraction with your post at June 19, 2014 at 8:37 pm.
However, despite disingenuous distraction being your most practiced form of trolling, your attempt is yet another of your failed misrepresentations.
You write to dbstealey saying
By whom and when the stratospheric cooling was first suggested 40 years previously does not alter the fact – stated by dbstealey – that it “was a later fallback position, predicted after the failure of the supposed tropospheric hot spot”.
So, dbstealey is right.
He knows he is right, you know he is right, and I know he is right.
If there were something else discovered in literature search then they may have adopted that alternative fallback position.
The important point which your disingenuous distraction attempts to smokescreen is that the stratospheric cooling has stopped so – if Manabe and Wetherald are correct – then there is no AGW happening.
Richard
kadaka,
Yes, even a few years ago RC was on the ropes. It’s worse off now. RC is Michael Mann’s flagship propaganda outlet. No wonder Mann’s squealing about skeptics has been ratcheting up. He is important to those 21 readers, but otherwise he is being marginalized.
======================
Richard Courtney,
I suspect Phil. is using more exclamation points than ever for the same general reason: the planet is busy debunking his CAGW nonsense, as Henry P’s WFT graph shows.
++++++++++++++++++++++
Simon,
Out of all the websites mentioned, only WUWT allows and encourages all points of view. If that fact doesn’t separate the propaganda blogs from the science site for you, nothing will.
richardscourtney says:
June 20, 2014 at 1:25 am
Phil.:
You provide a good attempt at disingenuous distraction with your post at June 19, 2014 at 8:37 pm.
However, despite disingenuous distraction being your most practiced form of trolling, your attempt is yet another of your failed misrepresentations.
Dickey the troll returns with more of his nonsense!
You write to dbstealey saying
You asserted:
As for a cooling stratosphere, that was a later fallback position, predicted after the failure of the supposed tropospheric hot spot.
As I pointed out that statement is untrue and I refuted it as follows: “the stratospheric cooling was predicted over 40 years ago by Manabe and Wetherald!”
By whom and when the stratospheric cooling was first suggested 40 years previously does not alter the fact – stated by dbstealey – that it “was a later fallback position, predicted after the failure of the supposed tropospheric hot spot”.
So, dbstealey is right.
Clearly he is wrong and so are you (no surprise there), according to him it was “predicted after the failure of the supposed tropospheric hot spot”, since as I pointed out the stratospheric cooling was first predicted in 1967 by M&W and was widely known since then, and the issue of the ‘tropospheric hot spot’ cropped up more than 20 years later.
He knows he is
rightwrong, you know he isrightwrong, and I know he isrightwrong.The important point which your disingenuous distraction attempts to smokescreen is that the stratospheric cooling has stopped so – if Manabe and Wetherald are correct – then there is no AGW happening.
Except of course that the referenced, up-to-date data which I referred to shows that the stratospheric cooling continues, unlike the unreferenced, unlabeled graph that he produced from about 8 years ago.
Phil. is weaning himself off exclamation points! Good!
But he claims others make ‘assertions’… and then he asserts:
Clearly he is wrong and so are you…
I would spend some time on the question of stratospheric cooling, except for the fact that it was a fallback argument after the ‘tropospheric hot spot’ prediction failed.
I liked the tropospheric debate, because it was a flat out prediction. Science is based on predictions. But if an hypothesis cannot accurately and consistently predict, then it is wrong.
The stratosphere argument was based on an already-occurring event. It was simply an extrapolation. And since both the troposphere and stratosphere arguments are made to support the CAGW argument as Simon argues above, then that argument fails.
The only thing that really matters is: where did the global warming go?!? With no global warming, all alarmist arguments become increasingly ridiculous.
Make an alarmist prediction of something that is not occurring now, but will soon happen. If it is correct, I will sit up straight and pay attention. Maybe even begin to change my mind. But so far, no alarmist predictions have come true. So why should we believe their premise?
@- Richard Courtney
“To date there are no discernible effects of AGW. Hence, the Null Hypothesis decrees that AGW does not affect global climate to a discernible degree. That is the ONLY scientific conclusion possible at present.”
After several thousand years of no discernible sea level rise the last century has seen around a foot with an accelerating rate of rise.
That has certainly be discernible!
http://sealevel.colorado.edu
That represents a massive amount of energy gained. Expanding water and melting it takes a lot of Joules.
Why the Earth is retaining all this extra energy may be open to dispute, but it is hardly ” not discernible” or showing no effect.
Phil.:
There is no need for me to answer your silly post at June 20, 2014 at 7:39 am because it has been completely rebutted by the post of dbstealey at June 20, 2014 at 8:23 am.
However, I write to acknowledge it and to thank you for the laughs it gave me.
You had claimed dbstealey was wrong when he pointed out that the fact that the stratospheric cooling tropospheric warming issue was a fallback when the tropospheric hotspot failed to occur. And you attempted – but failed – to make an issue of how long that issue had been in the literature prior to it being adopted as a fallback.
Your desperate attempt amounts to putting your fingers in your ears and shouting “I can’t hear you”.
That is funny; it is very, very funny.
Richard
izen:
I congratulate you on making the attempt you do in your post at June 20, 2014 at 8:45 am. But, of course, you fail.
In response to my having written this clear and undeniable truth
you have written
Firstly, your link does NOT report “several thousand years of no discernible sea level rise”. It reports
Of course those methods do not discern any sea level change over “several thousand years” prior to 1993 because they did not exist.
Importantly, your link shows NO recent acceleration in sea level change.
And your assertion that such change is a direct indication of global warming is refuted by the lack of change to sea level rise rate reported in your link. As you say, “Expanding water and melting it takes a lot of Joules” but there is no evidence of recent loss of land ice and there has been no global warming to expand water for at least the last 17 years while the rate of sea level rise did not change.
There is no “evidence” for an “influence of CO2 on the warming climate”; none, zilch, nada. Three decades of research conducted world-wide at a cost of over US$5 billion per year has failed to find any such evidence. Ben Santer tried to claim he had found some such evidence in the 1990s but it was soon discovered that his so-called “fingerprint” was an artifact of his only using some data from near the middle of a time series. You would be awarded at least one Nobel Prize if you had discovered such evidence.
Richard
@izen
As explained to you before, the proposed mechanism for AGW implies that more GHG would cause a delay in radiation being able to escape from earth, which then causes a delay in cooling, from earth to space, resulting in a warming effect.
It follows naturally, that if more carbon dioxide (CO2) or more water (H2O) or more other GHG’s were to be blamed for extra warming we should see minimum temperatures (minima) rising faster, pushing up the average temperature (means) on earth.
I personally took a sample of 54 weather stations, analysed all daily data, and determined the ratio of the speed in the increase of the maximum temperature (maxima), means and minima.
I find that if we take the speed of warming over the longest period (i.e. from 1973/1974) for which we have very reliable records, we find the results of the speed of warming, maxima : means: minima
0.034 : 0.012 : 0.004 in degrees C/annum.
That is ca. 8:3:1. So it was maxima pushing up minima and means and not the other way around. Anyone can duplicate this experiment and check this trend in their own backyard or at the weather station nearest to you.
Moreover, the increase and subsequent decrease in minima follows a perfect binomial curve
http://wattsupwiththat.com/2014/06/18/may-2014-global-surface-landocean-and-lower-troposphere-temperature-anomaly-update/#comment-1666003
From HenryP on June 20, 2014 at 1:01 am:
By specifying to:2015 your trends from:2002 are currently including part of a year thus are spoiled by the annual signal, and will change until 2014 ends. Use to:2014 for whole years and trends that won’t change.
You used HadCRUT3 Unadjusted along with HadCRUT4. Why Unadjusted? Why HadCRUT3 at all? With HadCRUT4 as the replacement product, it makes no sense to also use the old version.
Likewise you used HadSST2 rather than the newer HadSST3.
Using to:2014, HadSST3, leaving in HadCRUT3 but using the normally-used variance adjusted version:
http://www.woodfortrees.org/plot/hadcrut4gl/from:1987/to:2014/plot/hadcrut4gl/from:1987/to:2002/trend/plot/hadcrut4gl/from:2002/to:2014/trend/plot/hadsst3gl/from:1987/to:2014/plot/hadsst3gl/from:1987/to:2002/trend/plot/hadsst3gl/from:2002/to:2014/trend/plot/rss/from:1987/to:2014/plot/rss/from:1987/to:2002/trend/plot/rss/from:2002/to:2014/trend
Leaving out HadCRUT3 to use the newest versions:
http://www.woodfortrees.org/plot/hadcrut4gl/from:1987/to:2014/plot/hadcrut4gl/from:1987/to:2002/trend/plot/hadcrut4gl/from:2002/to:2014/trend/plot/hadsst3gl/from:1987/to:2014/plot/hadsst3gl/from:1987/to:2002/trend/plot/hadsst3gl/from:2002/to:2014/trend/plot/rss/from:1987/to:2014/plot/rss/from:1987/to:2002/trend/plot/rss/from:2002/to:2014/trend
Not as much cooling, global SSTs are dropping at only 0.2°C/century, likely not statistically significant. HadCRUT4 dropping 0.3°C/century. But RSS is dropping at 0.8°C/century, although RSS is running lower than UAH v5.6.
Whoops, my mistake, wrong URL. This was the improved version with HadCRUT3 variance adjusted:
http://www.woodfortrees.org/plot/hadcrut4gl/from:1987/to:2014/plot/hadcrut4gl/from:1987/to:2002/trend/plot/hadcrut4gl/from:2002/to:2014/trend/plot/hadcrut3vgl/from:1987/to:2014/plot/hadcrut3vgl/from:1987/to:2002/trend/plot/hadcrut3vgl/from:2002/to:2014/trend/plot/hadsst3gl/from:1987/to:2014/plot/hadsst3gl/from:1987/to:2002/trend/plot/hadsst3gl/from:2002/to:2014/trend/plot/rss/from:1987/to:2014/plot/rss/from:1987/to:2002/trend/plot/rss/from:2002/to:2014/trend
Izen,
You say that sea level rise is accelerating. Richard Courtney replied:
Importantly, your link shows NO recent acceleration in sea level change.
Your link shows only 2 graphs, this graph, and this graph.
There is no acceleration. Now the question becomes: are you willing to admit it? Or does your religion not allow for empirical observations?
Kadaka says
thus are spoiled by the annual signal, and will change until 2014 ends.
Henry says
what annual sign do you expect to see within one Schwabe solar cycle (11 yrs) or one whole Hale solar cycle (22 yrs)?
Clearly, I chose to depict the major data sets which most closely conform to my own results i.e my own data set,
which is showing 0.012K/year or 0.12K/decade warming since 1974 (until 20124) and -0,014K/year or -0.14K/decade cooling since 2000 (up until 2014)
If you have not yet figured out that earth is actually cooling down you are still plowing around in the dark, me thinks.
henry said
which is showing 0.012K/year or 0.12K/decade warming since 1974 (until 20124)
henry says
oops sorry
should be:
which is showing 0.012K/year or 0.12K/decade warming since 1974 (until 2014)
From HenryP on June 20, 2014 at 10:31 am:
I expect the annual signal caused as the globe shifts from the insolation yielding more diurnal transitory warming of land during NH summer to more warming of oceans that is retained longer during the NH winter when the SH is favored by the Sun.
http://woodfortrees.org/plot/rss/from:2002/to:2004.51/mean:3/plot/rss/from:2002/to:2004/trend/plot/rss/from:2002/to:2004.51/trend
Hopefully this short piece is enough for you to notice the warmer temps in NH winter, peaked around the whole year marks, and the cooler temps in NH summer, troughs around the half year marks.
And it also shows you how not using only full years will distort the trend with the annual signal, if you have not previously removed the annual signal.
Admissions of confirmation bias and cherry-picking noted.
dbstealey and richardscourtney
Thank you for your considered replies about my confessing to read a range of websites.
“untrue propaganda may help them to find more gullible fools capable of being deluded by their nonsense which most people saw through years ago.”
“Out of all the websites mentioned, only WUWT allows and encourages all points of view. If that fact doesn’t separate the propaganda blogs from the science site for you, nothing will.”
You both seem disturbed I would visit Realclimate, implying I am one of their deluded fools. I accept that is entirely possible… that I am a deluded fool…. after all that was my point, that I consider all options, which is why I read a range of sites. I’m wondering how you both (the denial tag team) go to ensure you are reading all the available information? I’m also now concerned for WUWT given this poor deluded fool visits here more than any other site on the net concerned with CC.
richardscourtney says:
June 20, 2014 at 8:50 am
Phil.:
There is no need for me to answer your silly post at June 20, 2014 at 7:39 am because it has been completely rebutted by the post of dbstealey at June 20, 2014 at 8:23 am.
That’s fine we have more than enough of your fact free trolling on here as it is. Clearly you don’t know what a rebuttal is, no surprise.
Simon:
You say to dbstealey and me
I cannot imagine what has given you the impression that your foolish behaviour “disturbs” me. Please be assured that nothing you do could “disturb” me but your silly behaviour certainly does amuse me.
Richard
Phil.
I write to say that I have read, noted and laughed at the desperate attempts to justify your errors with your posts at June 20, 2014 at 12:14 pm and June 20, 2014 at 12:17 pm.
And I am only providing this acknowledgement because those temper tantrums are directed at me.
Richard
Kadaka says
Admissions of confirmation bias and cherry-picking noted.
Henry says
Clearly, you don’t understand that most of the official data sets are, in fact, not properly balanced.
I took my sample of 54 weather stations:
27 NH
27 SH
balanced on latitude (only +18 degrees left on counting)
balanced 70/30 % @sea/on land
I am not bothered about longitude as long as I am looking only at the average change in temp. (K) per annum (includes annual insolation changes due to seasons)
Now tell me which of your data sets conforms to my specifications?
btw
@all
I am only interested to know from you if you agree with me that earth is cooling down
From HenryP on June 20, 2014 at 12:31 pm:
Oh please, except for the satellites none of them are “balanced”. The SST coverage is so sparse they’re hardly worth mentioning, but that’s what we have.
I used RSS, a satellite-based dataset, so that was as balanced as it gets. It shows the annual signal. I showed how using partial years contaminates trends with the annual signal. Done.
You deliberately selected datasets that most closely confirmed to your “balanced” dataset. Thus confirmation bias, you expected matching to your dataset. You ignored the most current versions of datasets and selected older ones that matched what you expected, even selected a lesser-used variation of a version for the better match, which is cherry-picking. Done.
Can you show the cooling using the most recent versions of the most common datasets, as anyone new to the conversation would stumble across?
@kadaka
apart from my own, I do not know of any data set that gives me this result for the change in minima:
last 40 years (from 1974) 0.004K/annum
last 34 years (from 1980) 0.007K/annum
last 24 years (from 1990) 0.004K/annum
last 14 years (from 2000) -0.009K/annum
there is no room for any AGW
whatsoever?
sorry, it is the prerogative of the investigator to trust his own results more than that of others.
done.
no further discussion possible
Simon says:
You both seem disturbed I would visit Realclimate…
Not at all. What bothers me is the rampant censorship at both blogs.
Next:
I’m wondering how you both (the denial tag team) go to ensure you are reading all the available information?
It would be stupid to read everything, no? Pretty soon you would get into creationist theory, astrology, etc. WUWT covers all the bases. Use the search box, you can find anything you need to know. The other blogs you mentioned censor so that you only get what they want you to read. They want you to be their parrot. Fortunately, neither one has much traffic.
++++++++++++++++++++
Phil. says:
So yes, you asserted, without any evidence…
Phil you dope, I posted a graph of the stratosphere. That is evidence. My evidence is better than yours, for one simple reason: CAGW is your religion, whereas I am willing to change my mind based on facts. Since there are no facts supporting CAGW, I remain a scientific skeptic.
Re: the missing tropospheric hot spot, the predicted “fingerprint of global warming”, it never appeared. That alarmist prediction has failed miserably, just like all the other alarmist predictions, and you rebutted nothing. Only your religious Belief convinces you otherwise.
Clearly you don’t know what a rebuttal is, no surprise.
Certainly you don’t know what a rebuttal is. You don’t even know what evidence is, even when it is spoon-fed to you.
You may now return to your state of constant psychological projection.
dbstealey
“Out of all the websites mentioned, only WUWT allows and encourages all points of view. If that fact doesn’t separate the propaganda blogs from the science site for you, nothing will.”
——————-
While it may be true that WUWT is more tolerant of a range of views in the comments section, you would be hard pushed to convince anyone that its articles promote anything but the skeptical view. And if you think otherwise, perhaps you would be kind enough to provide links that offer the pro AGW view. And, yes, I know, SS and RC are guilty of the same thing, but you have accused them of being propaganda sites. In fact I can’t really see any difference between WUWT, RC and SS in that regard. All three hold a view and promote that view.
From Simon on June 20, 2014 at 7:42 pm:
Gee, Ira Glickstein PhD did the whole “Visualizing the ‘Greenhouse Effect'” series, five parts, here’s the last one which has links to the others:
http://wattsupwiththat.com/2011/05/07/visualizing-the-greenhouse-effect-light-and-heat/
There was also a 4-part Ferdinand Engelbeen series, “Engelbeen on why he thinks the CO2 increase is man made”. Last one which has links to the others:
http://wattsupwiththat.com/2010/09/24/engelbeen-on-why-he-thinks-the-co2-increase-is-man-made-part-4/
So how CO2 produces its share of the greenhouse effect is covered, and how the CO2 increase is anthropogenic.
If you need something that more specifically endorses AGW, you can write it up pretty and polite, back it with good references using publicly-available data for confirmation by replication, and submit it. If it’s at the normal publication standards and you’re willing to throw your baby at the starving dingos and watch what happens, you have as good a shot at getting published here as anyone else who does the same.
kadaka
This quote is from the first page you referenced and supports my point perfectly, and that is this website only prints skeptical articles. Clearly this guy follows the thinking on this site and indeed for the most part mine.
“The main scientific question for me, is how much does the increase in human-caused CO2 and human-caused albedo reduction increase the mean temperature above what it would be with natural cycles and processes? My answer is “not much”, because perhaps 0.1ºC to 0.2ºC of the supposed 0.8ºC increase since 1880 is due to human activities. The rest is due to natural cycles and processes over which we humans have no control. The main public policy question for me, is how much should we (society) do about it? Again, my answer is “not much”, because the effect is small and a limited increase in temperatures and CO2 may turn out to have a net benefit.”
However I will concede the second article does not support there views of most readers here and so was a risk to print. I know from years of coming here that that is a rarity though. But… well done finding it, you clearly know this site well.
Simon:
Amusement at your cognitive dissonance is starting to be replaced by annoyance at its nuisance.
For example, at June 20, 2014 at 10:04 pm you start your post saying
You wrote this as part of your attempts to pretend WUWT is similar to the failed pro-AGW propagandist echo chamber web sites you are trying to promote. And your writing it is jaw-droppingly stupid because each of those web sites would censor any post which attempted to say anything other than their propaganda.
Simply, your own words are evidence that you are wrong. “This website” (i.e. WUWT) does NOT “only prints skeptical articles”. It is printing the silly articles from you.
Richard
richardscourtney
And then I said???
Simon:
re your silly post June 21, 2014 at 2:55 am.
You said nothing after your statements which I quoted and commented.
If you intended to say something then perhaps you can now correct your oversight.
However, in attempt to show I am trying to be helpful I add the following for you.
WUWT often provides and/or links to pro-AGW papers if only to refute them. Indeed, WUWT sometimes links directly to RC with the result that RC gets some visitors (it merits nobody wasting time by visiting it). One such example is here where a link to an RC item is provided in its first sentence which says
The peopaganda blogs you are trying to promote never link to articles on WUWT.
Simon, please try to think before posting. Your puerile maundering is disruptive.
Richard
@- Richard Courtney
“Firstly, your link does NOT report “several thousand years of no discernible sea level rise”.
Importantly, your link shows NO recent acceleration in sea level change.
And your assertion that such change is a direct indication of global warming is refuted by the lack of change to sea level rise rate reported in your link. As you say, “Expanding water and melting it takes a lot of Joules” but there is no evidence of recent loss of land ice and there has been no global warming to expand water for at least the last 17 years while the rate of sea level rise did not change.”
Thank you for checking the link I gave for sea level rise. You are correct it does not show the evidence for the assertions I made that the rate is accelerating and that previously there had been little change for several thousand years.
I am happy to provide links to the supporting evidence for those facts if you wish.
I hesitate to provide too many links, especially to PDF files of the original research as it seems to delay the acceptance of the post. Presumably because some sort of check is made that they are not bad links.
However. I will post a link to refute this assertion you made, –
@-“but there is no evidence of recent loss of land ice ”
http://www.wgms.ch/mbb/sum12.html
izen:
I am replying to your post addressed to me at June 21, 2014 at 5:16 am which is here.
Thankyou for agreeing that your link does NOT show what you claimed when you now write
However, I am saddened that you fail to admit that the link you provided shows you were wrong and – instead of admitting that YOUR link shows you were wrong – you claim you could provide some other link which would support your false claims although you don’t. And you say you don’t provide it because you “hesitate to provide too many links”; well, you provide none and that certainly cannot be “too many”.
Then you conclude by following that bollocks with this
It is clear from the context in which I made the statement that I was talking about TOTAL land ice. Your link discusses glaciers and its only mention of Antarctic ice is the Bahia del Diablo, Hurd and
Johnson glaciers which do not encompass much of the Antarctic ice; i.e. your link does not mention most of the ice on Earth.
Richard
PS I would be interested to know if you are having a competition with Phil. to see which of you can make the most ridiculous post on WUWT.
izen says
However. I will post a link to refute this assertion you made, –
@-”but there is no evidence of recent loss of land ice ”
http://www.wgms.ch/mbb/sum12.html
henry says
interesting that your link provides me with the information that Norway is (also) cooling down (everything seems positive).
My own results show that it has been cooling significantly in Alaska, at a rate of -0.55K per decade since 1998 (Average of ten weather stations).
http://oi40.tinypic.com/2ql5zq8.jpg
That is almost one whole degree C since 1998. And it seems NOBODY is telling the poor farmers there that it is not going to get any better. NASA also admits now that antarctic ice is increasing significantly.
http://wattsupwiththat.com/2013/10/22/nasa-announces-new-record-growth-of-antarctic-sea-ice-extent/#more-96133
So clearly, together with my previous comments, which you have ignored, we (on earth) are cooling down from the [top] latitudes down.
Looking at minimum temperatures,
http://wattsupwiththat.com/2014/06/18/may-2014-global-surface-landocean-and-lower-troposphere-temperature-anomaly-update/#comment-1666344
and setting the speed of warming/cooling out against time you get a perfect binomial (parabolic), rsquare equal to 1. That means there is no AGW, whatsoever. All warming (in the past) and all cooling (in the present) is natural. Someone Good made it so. Only a fool would say in his heart there is no God. The whole sun-earth system has been cleverly designed so that it cannot overheat.
Phil. says:
“I guess…”
Guessing is all you have, and your guesses have been 100% wrong. You also ‘guess’ that human activity is causing runaway global warming. But guesses do not take the place of evidence.
The planet itself shows you are wrong. Global warming stopped, and all your backing and filling does nothing to change that fact. You just keep digging, to the amusement of rational readers.
You label Richard Courtney — a published, peer reviewed author — as a “troll”. Mr Courtney is not afraid to put his name to his words like you are. Until and unless you identify yourself, you have as much credibility as Mickey Mouse. But not much more.
So really, who are you, “Phil.”? Are you here to amuse us with your impotent consternation over the fact that Planet Earth is making you wrong? If so, you’re succeeding.
=====================
Izen,
Aside from you being wrong as always, what is the big deal with sea level rise? The alarmist clique was flat wrong in all their predictions about accelerating SL. And your link says nothing about sea levels accelerating. The only takeaway I got from a cursory reading was that the planet is recovering from the LIA, nothing more. There is no evidence of any ‘human fingerprint’.
Further, what is your fixation with ice cover? The most reasonable explanation is that the planet is naturally recovering from the LIA. Anything more is a stretch.
++++++++++++++++++++++
Simon says:
you would be hard pushed to convince anyone that [WUWT] articles promote anything but the skeptical view. And if you think otherwise, perhaps you would be kind enough to provide links that offer the pro AGW view.
You still don’t get it. WUWT has a skeptical perspective because all honest scientists are skeptics. The alarmist position is that human activity will cause runaway global warming. Skeptics say: “Prove it.” Or at least post convincing evidence and/or observations showing what you claim. But so far, all you have are assertions that follow the CAGW narrative. That isn’t good enough her at the internet’s “Best Science & Technology” site.
There is no evidence whatever to support the catastrophic AGW belief. In fact, not only is there no runaway global warming, as was incessantly predicted by Algore and many others, but global warming has stopped.
Question: what will it take to convince you that the alarmist clique is wrong? Anything? Or has CAGW become a religious belief, which does not allow you to accept what the planet is clearly telling everyone else?
dbstealey
“Question: what will it take to convince you that the alarmist clique is wrong? Would anything convince you? Or has CAGW become your religious belief, which will not allow you to accept what the planet is clearly telling everyone else?”
—————————-
I could ask you the same question i.e why do you have this blind belief nothing is happening? I’ve explained I look for answers by reading a variety of material, you seem to feel justified staying on the skeptical sites. I say that gives me an advantage, you say it doesn’t. By the I am not a religious man and feel accusing me of being so i rather pointless. Re, what is the the planet telling us? I think it is clear we are still warming. The empirical data (which you seem to love) is telling us just that. Last month was the warmest (April) combined land and ocean on record according to NOAA. May is not our yet, but it is looking like being a high one too. The empirical data is also telling us we have net ice loss on this precious planet. That is a worry. Ice doesn’t usually me;e;t unless you heat it. So before you bang on about no empirical data, I would suggest you read it first.
richardscourtney
“The peopaganda blogs you are trying to promote never link to articles on WUWT.”
—————————————–
Richard, I think you will find SKS often provides links to WUWT. I read it so I know. Although it would be fair to say it is not to promote the ideas here, more to mock or refute them. To be honest I find that stuff all a bit tedious. As for Realclimate, in my experience the articles there are certainly worth reading. They tend to (but not always) steer away from sneering at other sites and focus the science. A good thing I think. While their traffic may be lower than WUWT they do get a good number of responses to articles. Thank you once again for taking the time to respond to my posts. Look forward to your reply as always.
dbstealey
More empirical data for you. It seems May is also the warmest on record.
http://www.bdtonline.com/latest/x1396895706/May-2014-was-the-hottest-may-in-recorded-history
That’s two in a row. See, I think anybody who reads both sides of the argument, would struggle to deny the upward trend. After all, warmest is warmest. You, on the other hand seem to find no difficultly ignoring the empirical evidence. And yet the funny thing is you keep telling us you never see any. Seems you almost have a faith that keeps you going. Wait, isn’t that a religious thing?
Simon:
In your post at June 21, 2014 at 1:40 pm you assert
No, Simon. Anybody who has learned elementary arithmetic knows that two data points do not provide a trend.
Only a biased true believer seeking anything to support an evidence-free belief would have made your assertion.
Richard
Simon says:
June 21, 2014 at 1:40 pm
dbstealey
More empirical data for you. It seems May is also the warmest on record.
This is the warmest May ever recorded by GISS. However on RSS it is sixth; on UAH, version 5.5 it is fourth; and on Hadsst3 it is second.
richardscourtney
No, Simon. Anybody who has learned elementary arithmetic knows that two data points do not provide a trend.
——————————–
Richard, so pleased you mentioned trend… Let’s look at the “long term” lower troposphere trend in figure 8. The one that started this conversation. The one that starts before 1998. Well what do you know…. it is up.
Now lets go to Roy Spencers front page graph. The indisputable satellite data….
http://www.drroyspencer.com/latest-global-temperatures/
There it is again… a long term upward trend. And as you are the one who seems to prefer longer term graphs, please don’t bother me with short term graphs that start at 1998. I’ve seen those. I am thinking they will not be used again when the developing El Nino breaks new records this year.
wbrozek
This is the warmest May ever recorded by GISS. However on RSS it is sixth; on UAH, version 5.5 it is fourth; and on Hadsst3 it is second.
———————
The ones you quote are land or ocean. That’s why NOAA’s any day now date will be interesting… it is both.
Simon says:
June 21, 2014 at 3:05 pm
But, these miniscule “trends” you speak of are no different from the long term coming out of the LIA, established long before CO2 putatively had any significant effect.
All the major temperature sets are affinely similar since the late 70’s. But, if you take the ones which extend farthest back, and take out that long term trend, they are all falling in relative terms.
This decline should not be happening, if CO2 were the driving force, given that it is higher than ever. SkS can fudge and prevaricate all they like, but AGW is a dead hypothesis walking. At some point, you have to stop seeing things through the lens of what you may want them to be, and recognize them for what they are.
Bart
“At some point, you have to stop seeing things through the lens of what you may want them to be, and recognize them for what they are.”
I would offer you the same advice as you look at Roy Spencers graph
http://www.drroyspencer.com/latest-global-temperatures/
Simon says:
…why do you have this blind belief nothing is happening?
1) It is not “blind”. I post numerous links to observations and raw data.
2) It is not a “belief”. Belief belongs to those who say that runaway global warming is happening. It isn’t.
3) Being a skeptic means that those putting forth a hypothesis such as CAGW means the alarmist crowd must prove it, because skeptics have nothing to prove.
Next:
By the I am not a religious man and feel accusing me of being so i rather pointless. Re, what is the the planet telling us? I think it is clear we are still warming.
There has been no global warming for 17 years. That is empirical evidence; or as you put it: “the indisputable satellite data”.
Also, note that GISS “adjusts” its so-called ‘data’ — and the GISS adjustments always show scarier warming than empirical observations. The preposterous thing is, you believe Gavin Schmidt! Maybe you can give us a credible explanation why he refuses to debate. You know, an explanation that doesn’t generate amusing comments.
Earth to Simon: global warming has stopped. How much more evidence do you need?
Next:
The empirical data is also telling us we have net ice loss on this precious planet.
Wrong again. Where do you get your misinformation?? Note the red line. It shows that global ice cover is higher than its 30-year average. Go argue with Cryosphere if you don’t like it. But making baseless assertions like “net ice loss” shows confirmation bias and cherry-picking.
Next simple Simon says:
There it is again… a long term upward trend. And as you are the one who seems to prefer longer term graphs, please don’t bother me with short term graphs that start at 1998.
Simon, you are unaware of a lot of things, so I’ll explain. Dr. Phil Jones, in the CRU emails, May 7, 2009 wrote:
‘Bottom line: the ‘no upward trend’ has to continue for a total of 15 years before we get worried.’
That comment was in response to the fact that global warming had stopped for two years. Jones thought he was on solid ground when he wrote that global warming would have to stop for 15 years, from 1997. Now it has been 17+ years, almost 18. So it was your heroes who designated 1997 as the benchmark year.
You call that “short term”. Fine, let’s look at the long term. Notice that the planet is warming from the LIA — with no recent acceleration? It takes a fool to argue that human emissions make a difference, after looking at the long-term temperature record.
My advice: quit digging. Take a few months and read the WUWT archives. Get up to speed; you aren’t right now. Because it’s clear you are parroting alarmist misinformation.
[And seeing your typing, you’d better calm down, or your head might explode from your cognitive dissonance.]
dbstealey
I see you have only mentioned sea ice. If you had read and understood what I said you would realise I meant net ice. We are talking volume….. mass balance of glaciers etc. I’ll keep it simple for you…. Empirical evidence tells us the sea level is rising. That water comes from somewhere? Have a guess?(yes I know some is through thermal expansion, more evidence of a warming world) I’ll tell you… melting Ice. Sea ice has little affect on sea level rise so it clearly is coming from somewhere. That’s right, the ice on the land. Now here is the (clincher) thing. The level is not going down, so if it is going up…. there must be more ice melting than freezing.
So where is it coming from. It seems Antarctica and Greenland are the major culprits, but glaciers in other parts of the world are also major contributors. I will provide an Empirical link for you.
http://en.wikipedia.org/wiki/Glacier_mass_balance#mediaviewer/File:Glacier_Mass_Balance.png
Please let me know if you don’t understand any of this.
dbstealey says:
June 21, 2014 at 4:16 pm
Forget it. He’s a religious believer. He didn’t even read what I wrote, and replied with something incoherent.
Bart
Im sorry but I addresses the only part of your post worth addressing and that was the irony of your last statement. The rest was pretty much wordy bunkum. No offence.
Simon says:
June 21, 2014 at 5:38 pm
None taken. Any more than I would take offense at what your run of the mill Hare Krishna thought of my statements. Life’s too short to worry about what every yahoo thinks about you.
Bart
That is all sorted then. Have a nice day.
Simon says:
I see you have only mentioned sea ice.
Reading comprehension, Simon me boi. You needs it. I’ve commented on sea ice, sea level rise, CO2, global warming, short term and long term trends, GISS, the tropospheric hot spot, stratospheric cooling, etc., etc. And that is just in this thread alone.
So now you have moved the goal posts to “net ice”, but I covered that too, in my ‘global ice’ link. If it were not for moving the goal posts, Simon, you would have even less of your already pathetic argument.
Yes, sea levels are rising, as they have naturally, since the end of the last great stadial. The simple fact that sea levels are not accelerating makes your Belief in manmade global warming ridiculous indeed.
You wrongly assert:
Now here is the (clincher) thing. The level is not going down, so if it is going up…. there must be more ice melting than freezing.
You certainly are amusing, Simon. I had you smoked out from your very first comment, when you pretended to be Mr. Middle-Of-The-Road. But I knew then that you were a religious True Believer. That’s why it was easy to smoke you out after your very first comment.
In your amusing “clincher thing” assertion [is ‘clincher thing’ a scientific term?] you say:
The [sea] level is not going down, so if it is going up…. there must be more ice melting than freezing.
Logic isn’t your strong suit. One possible factor is melting ice. But as I showed above, since global ice is above its 30-year average, we can discard that factor. And since Greenland ice is in a bowl, you need not worry your crazy Believer head that the ice is going to spill out and raise sea levels.
Finally, Antarctic ice is in the midst of a multiyear increase. Since the Antarctic contains 10X more ice than the Arctic, and since Antarctic ice is increasing, your Belief that sea level rise will accelerate due to melting ice is complete nonsense.
Once again, my question: where do you get your misinformation? And why do you take it as Gospel, while rejecting all the factual evidence posted here? Enviro-religion has a choke hold on you Simon, me boi. Your mind is closed tighter than a submarine hatch. I doubt you will ever have the scales fall from your eyes, and see the truth. Sad, really.
dbstealey
Ill keep it simple.
Sea ice in Antartica = increase
Sea ice in Arctic = decrease
Land ice Antartica = decrease
Glaciers worldwide = decrease
Total ice volume = decrease
Simon, you keep avoiding my question: where do you get your misinformation?
Here is Antarctica. It is a land continent. Note the cooling vs the warming areas. Further, the WAIS is warming because of volcanic activity, not due to CO2. You moved the goal posts to land because of a small part of the continent that is warming, versus the 90% that is cooling. That argument is one big FAIL.
Antarctic ice is expanding overall, as I linked in my last post. Are you that deluded that you reject everything that debunks your CAGW nonsense?
The Antarctic continues to gain ice. This has been going on for many years. And global ice is now above its long term average.
Face it, Simon, you lost the argument way upthread. You don’t have credible facts. Also, I would like to know why polar ice seems so important to you, that you have to lie about it? Polar ice is cyclical, and those cycles are natural. There is no measurable, testable evidence showing that human activity has anything to do with it. It has all happened before, and to a much greater degree. The Arctic was ice-free a few thousand years ago, during our present Holocene. Only a religious True Believer would assume that this time it must be the fault of humans:
That’s you, Simon. Exactly.
dbstealey
You will find all you need here.
http://www.bbc.com/news/science-environment-27465050
Seems the ice over most of the continent is melting at a faster pace than was expected.
Can I make one request from here on though. I’d like to think we can disagree without this chat descending to personal insults. If you really think I am deluded, then it is best we finish it now. Besides, I can’t see why you would waste your time talking to someone with a deluded mind? I for one appreciate your replies and I’d like to think as gentleman we can disagree politely.
Simon,
You are extremely frustrating. You cherry pick whatever you believe will support you, you have excessive confirmation bias, and you never answer questions. I guess we can’t expect anything more from a religious True Believer. Honest scientists try to answer questions. But your notions are pre-conceved. Your mind is made up, and you are looking for anything that confirms your belief.
Did you even read the article in your link? It says:
…six huge glaciers are currently undergoing a rapid retreat – all of them being eroded by the influx of warm ocean waters that scientists say are being drawn towards the continent by stronger winds whipped up by a changing climate. About 90% of the mass loss from the West Antarctic Ice Sheet is going from just these few ice streams.
So human activity has nothing to do with it. And of course, climate is always changing. Only Michael Mann and his followers deny that fact.
All the charts I linked to above were done to help you understand that Antarctica, with 90% of all polar ice, is gaining ice. Those measurements are more credible than the ESA’s ‘adjusted’ measurements. But even so, AGW has nothing to do with polar ice cover.
The only reason that polar ice is argued anyway is because of all the endless predictions made by the alarmist cult, every one of them has failed. But like a drowning man grasping a stick, you folks hold on to Arctic ice because it is your forlorn hope that it will disappear — validating the only prediction that has any hope of coming true.
But it very likely will fail just like all the other failed alarmist predictions, because it was always about Arctic ice. So ice is a big deal to you. Not to sceptics, though, because there is zero evidence that human-emitted CO2 has anything to do with cyclical polar ice cover — the basic belief in the “carbon” scare.
I have been responding to every move of the goal posts you make. It is tedious and frustrating. You obviously don’t have a background in the hard sciences. So, your turn now. Re-read my questions and answer them, please, if you can. Since ice is so important to you, you can start by explaining why the Arctic had less ice before industrial activity than now, in the context of the climate Null Hypothesis. That should keep you busy running back to SS for their version of reality.
@Simon
Those still pointing to melting arctic ice and NH glaciers, as “proof” that it is (still) warming, and not cooling, should remember that there is a long lag from energy-in and energy-out. Counting back 88 years i.e. 2013-88= we are in 1925.
Now look at some eye witness reports of the ice back then?
http://wattsupwiththat.com/2008/03/16/you-ask-i-provide-november-2nd-1922-arctic-ocean-getting-warm-seals-vanish-and-icebergs-melt/
Sounds familiar? Back then, in 1922, they had seen that the arctic ice melt was due to the warmer Gulf Stream waters. However, by 1950 all that same ‘lost” ice had frozen back. I therefore predict that all lost arctic ice will also come back, from 2020-2035 as also happened from 1935-1950. Antarctic ice is already increasing.
I already showed you that my own results for the drop in global minimum temperatures suggest a perfectly natural relationship between the speed of warming/cooling in K/annum when set against time. The curve is like someone throwing a ball: perfectly natural. If there were any AGW, more especially of the type caused by more CO2 or other GHG, we would see some chaos, exhibited by a correlation coefficient of less than 1, especially on minima. (1=100% correlation for the binomial curve)
http://wattsupwiththat.com/2014/06/18/may-2014-global-surface-landocean-and-lower-troposphere-temperature-anomaly-update/#comment-1666344
To those actively involved in trying to suppress the temperature results as they are available on-line from official sources, I say: Let fools stay fools if they want to be. Fiddling with the data they can, to save their jobs, but people still having to shove snow in late spring, will soon begin to doubt the data…Check the worry in my eyes when they censor me. Under normal circumstances I would have let things rest there and just be happy to know the truth for myself. Indeed, I let things lie a bit. However, chances are that humanity will fall in the pit of global cooling and later me blaming myself for not having done enough to try to safeguard food production for 7 billion people and counting.
It really was very cold in 1940′s….The Dust Bowl drought 1932-1939 was one of the worst environmental disasters of the Twentieth Century anywhere in the world. Three million people left their farms on the Great Plains during the drought and half a million migrated to other states, almost all to the West. http://www.ldeo.columbia.edu/res/div/ocp/drought/dust_storms.shtml
I find that as we are moving back, up, from the deep end of the 88 year sine wave, there will be standstill in the change of the speed of cooling, neither accelerating nor decelerating, on the bottom of the wave; therefore naturally, there will also be a lull in pressure difference at that > [40 latitude], where the Dust Bowl drought took place, meaning: less weather (read: rain). However, one would apparently note this from an earlier change in direction of wind, as was the case in Joseph’s time. According to my calculations, this will start around 2020 or 2021…..i.e. 1927=2016 (projected, by myself and the planets…)> add 5 years and we are in 2021.
Danger from global cooling is documented and provable. It looks we have only ca. 7 “fat” years left……
WHAT MUST WE DO?
We urgently need to develop and encourage more agriculture at lower latitudes, like in Africa and/or South America. This is where we can expect to find warmth and more rain during a global cooling period.
We need to warn the farmers living at the higher latitudes (>40) who already suffered poor crops due to the droughts that things are not going to get better there for the next few decades. It will only get worse as time goes by.
We also have to provide more protection against more precipitation at certain places of lower latitudes (FLOODS!), <[30] latitude, especially around the equator.
Simon:
Your silly post at June 21, 2014 at 3:05 pm again changes the subject in response to my having shown another of your fallacious assertions is plain wrong. And it ends saying to me
I said nothing about “longer term graphs”.
I will consider the effect of any El Nino if it occurs. Please report back with an apology for wasting space on this thread if an El Nino does not break new records this year.
Richard
richardscourtney
I will consider the effect of any El Nino if it occurs. Please report back with an apology for wasting space on this thread if an El Nino does not break new records this year.
—————————————–
Why do you feel the need to tell people they are silly and that they need to apologise for having a specific point of view? Frankly I find your comments rather condescending and see no possible reason for it. I know you and I disagree, but I am not a child to be scolded. Either show a little more respect or don’t waste your time on me. Make up your mind.
Simon:
Your silly post at June 22, 2014 at 12:20 pm yet again avoids the issues put to you, and it says this in total to me
I take your word that you are “not a child” but your behaviour in this thread has been very childish. You have repeatedly made untrue assertions which when called on them you have not withdrawn but – instead – you have changed the subject.
I respect people who debate a different point of view from my own. I learn from them.
You have clearly demonstrated that you do NOT have “a specific point of view”: you have an irrational belief. And you do not debate: you make asserts and you ignore all evidence which refutes your assertions.
My comments reflect my disdain for your anti-science belief and your irrational assertions. Disdain is not condescension. You need to improve your behaviour a lot before I can gain sufficient respect for my attitude to you to be merely condescending.
I have – and am – spending my time to expose the nature of true believers in AGW which you represent. I made up my mind to do that when you began by providing your duplicitous pretense that global warming has not stopped.
Richard
I note that Simon still refuses to answer questions. I can understand why: if he started down that road, he would run smack into cognitive dissonance, and his head might explode.
Last chance, Simon. I’ve answered your questions and concerns; it’s your turn now. I’ll ask once more. Try to answer this:
Since ice is so important to you, you can start by explaining why the Arctic had less ice before industrial activity than now, in the context of the climate Null Hypothesis.
Do your best. You might even convince me! Stranger things have happened, such as the inexplicable popularity of the Kardashians.
dbsteatley
It is true, it is possible the arctic was ice free about 8000 years ago, although recently moss was uncovered that had been buried under ice for probably 70,000 and maybe and many as 150,000.
But even if you are right (and we don’t know for sure on this one), it is the speed of decline that has those who study this stuff concerned. I would be grateful if you could tell me what caused the decline last time. Given we know what has caused it this time it would be interesting to compare.
You conveniently omitted the Null Hypothesis, which was the central point.
You like to quote Dr. Roy Sperncer, who wrote: “The Null Hypothesis has never been falsified.”
Have at it.
dbstealey says:
June 22, 2014 at 5:00 pm
You conveniently omitted the Null Hypothesis, which was the central point.
You like to quote Dr. Roy Sperncer, who wrote: “The Null Hypothesis has never been falsified.”
Have at it.
———————————————-
Please explain the NH and I would like to read any docs you have stating we have been ice free recently. Post a link and I will read.
Simon,
I see you’re asking questions again, instead of answering.
We are currently in the Holocene. The Arctic was likely ice free during the Holocene. The Arctic is not ice free now. Therefore, the Null Hypothesis applies. The Null Hypothesis is a corollary of the Scientific Method.
The Null Hypothesis of climate science is that climate is always changing in a log-log fractal manner due to normal chaotic-nonlinear oscillation. CAGW not only fails to nullify this Null Hypothesis – its believers fail to understand what a Null Hypothesis is.
The Null Hypothesis is the statistical hypothesis that states that there are no differences between observed and expected data. That is the definition, although you will probably have to give it some thought before you begin to understand what that means.
In order to falsify the Null Hypothesis, current climate parameters [temperature, extreme weather events, etc.] must exceed past parameters. That has not happened. The Null Hypothesis has never been falsified.
Kevin Trenberth is so confounded by the Null Hypothesis that he has demanded that it should be reversed, and therefore that skeptics should, in effect, have to prove a negative. That is how important the Null Hypothesis is in the climate debate.
The basic claim is that a rise in CO2 will cause runaway global warming. If that happened, the Null Hypothesis would be falsified. But that has not happened. In fact, global warming has stopped. Therefore, the CAGW conjecture fails. There is nothing either unusual, or unprecedented happening with the climate. Everything observed now has happened in the past, repeatedly, and to a greater degree.
The alarmist crowd does not like to discuss the Null Hypothesis, for the obvious reason that it deconstructs their “climate change” hoax. But if you want to discuss science, you must accept the Scientific Method and its corollary, the Null Hypothesis.
I read your link and it is clear that ice was reduced 6-7000 years ago. but as the article says…
“However, the scientists are very careful about drawing parallels with the present-day trend in the Arctic Ocean where the cover of sea ice seems to be decreasing.
“Changes that took place 6000-7000 years ago were controlled by other climatic forces than those which seem to dominate today,”
In other words today’s reduction is a different story to back then. And we all know what the scientists say is the problem now.
Re your null hypothesis…”The Null Hypothesis is the statistical hypothesis that states that there are no differences between observed and expected data.”
The decline in the arctic is worse at this point than the models forecast. I’m not sure where that leaves us in relation to NH. Worse off I would say.
Here is the overriding difference between you and I. I don’t believe on any level that AGW is a hoax made up by those greedy scientists of tax grabbing politicians. I have a friend who is a climate scientist and you would not meet a more sincere dedicated person. A hoax he is most definitely not. However clearly you don’t have the same faith in these people. I guess we will just have to agree to disagree.
richardscourtney says:
June 21, 2014 at 5:57 am
PS I would be interested to know if you are having a competition with Phil. to see which of you can make the most ridiculous post on WUWT.
No contest, you’re the champion in that competition.
richardscourtney says:
June 20, 2014 at 12:22 pm
Phil.
I write to say that I have read, noted and laughed at the desperate attempts to justify your errors with your posts at June 20, 2014 at 12:14 pm and June 20, 2014 at 12:17 pm.
As usual you fail to identify any of those ‘errors’, classic trolling.
And I am only providing this acknowledgement because those temper tantrums are directed at me.
Just amusement old boy, nothing more.
@Simon
face the facts Simon
if that is your name
(we know where you come from)
: the earth is cooling, as it has been cooling before,
http://wattsupwiththat.com/2009/12/09/hockey-stick-observed-in-noaa-ice-core-data/
Why don’t you show us some of your own results, if any,
that convinces that earth is warming and not cooling?
Pity your job depends on this carbon scare,
I will pray for you that you will be freed from the sin of lies.
HenryP
Is that a serious post? You know where I come from? You mean you are watching me? Tell you what I will do if you can guess the country I come from I will be utterly impressed. Seriously have a guess.
The earth is cooling…. well that’s all sorted then.
My job depends on the carbon scare? Really? Mmmm I don’t think so.
Please don’t pray for me… I’m not a religious man. Prefer to rely on facts.
@Simon
You complain that we do not take you seriously
Yet…., you have no results of your own…..none whatsoever?
Never looked at any temp. results or rainfall results?
That makes you look quite silly, really,
So this is how we know exactly where you come from.
You believe anything you read in the newspaper and on the news.
So, I say you are a clown living in a circus, somewhere in Disneyland.
Seriously, am I right or am I wrong?
Simon:
At June 22, 2014 at 6:53 pm you write to dbstealey
Oh dear! You get everything the wrong way round as usual.
I took the trouble to explain the Null Hypothesis for you earlier in this thread. The explanation was at June 19, 2014 at 2:14 pm and is here.
That explanation begins saying
Your comment to dbstealey which I have quoted says you failed to understand that. The facts are
1.
The models having “forecast” more ice decline in the arctic than is empirically observed is evidence that understandings used to construct the models are wrong.
And
2.
The Null Hypothesis decrees that greater Arctic ice loss in the past indicates no discernible change to the system which governs Arctic ice loss.
I suspect your failure to understand is because the Null Hypothesis is a scientific principle and you prefer your superstitious belief in AGW to science. However, your failure could be feigned and be an attempt to outdo Phil. in your competition to see which of the two of you can make the most ridiculous post on WUWT. If the latter then you have failed because your proclaimed inability to read an explanation is not as daft as Phil.’s recent attempt to redefine “sequestration”.
Richard
Troll posting as Phil.:
I see that at June 22, 2014 at 8:27 pm you adopt your common practice of attempting to justify your lies by adding another lie.
In response to my having written saying to you at June 20, 2014 at 12:22 pm
You have replied
No. I had identified your errors. I do not intend to list them all as one example will suffice.
At June 20, 2014 at 1:25 am I wrote
That one post alone provides corrections to three of your errors; i.e.
1.
Refutation of your attempt at disingenuous distraction.
2.
Refutation of your stupid assertion that information previously existing in literature demonstrates that the information was not used as a “fallback”.
3.
Statement that your so-called evidence shows the opposite of what you (and Simon) claimed.
I dislike the competition between you and Simon to determine which of you two trolls can make the silliest post on WUWT.
Richard
HenryP says:
June 23, 2014 at 1:48 am
@Simon
You complain that we do not take you seriously
Yet…., you have no results of your own…..none whatsoever?
Never looked at any temp. results or rainfall results?
That makes you look quite silly, really,
So this is how we know exactly where you come from.
You believe anything you read in the newspaper and on the news.
So, I say you are a clown living in a circus, somewhere in Disneyland.
Seriously, am I right or am I wrong?
————————————————————————
Um….. I’m not sure.
I never said I wasn’t taken seriously.
Why would I have results… I’m not a scientist.
So you are saying you know what I am thinking. Fair enough. You will be disappointed then.
I believe what the scientists say for the main part, particularly those who make sense to me.
You got your guess wrong… I don’t live in Disneyland, although I have been there.
Sadly you are wrong on almost everything here…. but as a consolation I can say you spelt Disneyland right.
Simon,
I have to agree, at this point you are trolling. You never respond to points raised or questions asked. You never discuss anything of relevance. Your tactic is to set up strawman arguments, and move the goal posts, and appeal to corrupt authorities, and always redirect your comments away from issues that would resolve anything.
Either get serious, or go away.
You can start by responding to Richard Courtney’s comment regarding the Null Hypothesis, which deconstructs the ridiculous CAGW conjecture. Either counter his point, or you lose the debate.
dbstealey
I will not respond to Richardscourtney. You however seem to at least have some interest and respect for what is being said. I am confused you think I am not responding to requests for info. I thought we had a good conversation about ice. You asked questions and I responded. I asked you for info and you gave me a polite considered answer. Where is the problem?
That is just an excuse to avoid debate.
The silly “ice” discussion has been put to bed. There is nothing either unusual or unprecedented happening with polar ice. It is a non-issue.
Quit avoiding the question: Explain how the Null Hypothesis can support the runaway global warming conjecture. If it cannot, then the CAGW conjecture fails. It is as simple as that.
richardscourtney says:
Simon:
Your silly post at June 22, 2014 at 12:20 pm asked me to explain why my far too polite posts to you do not display the degree of respect you mistakenly think you deserve.
I replied to that at June 22, 2014 at 12:46 pm by quoting it in full and by answering each item it mentioned. My reply is here.
Clearly, if you did not want the answer then you should not have asked the question.
I had thought you asked the question because of ignorance, but it is now obvious that I was wrong about that. Your subsequent post at June 23, 2014 at 3:23 am says
Clearly, you asked the question with duplicitous intent to pretend a reason for avoiding answering matters of substance.
Richard
Simon says
I’m not a scientist.
Henry says
hallo???
So what are you doing on a scientific site? no wonder we figured out that you are a clown.
Note that your friend, the other clown, named El Nino, is dying on you.
http://wattsupwiththat.com/2014/06/23/the-201415-el-nino-part-11-is-the-el-nino-dying/
henry@all
friends,
let us just ignore what “simon says” further (here at WUWT)
Clearly, he has no papers, and he is trying to get a work permit to stay here,
(coming from Disneyland)
Let him rather stay with the SS or the RC;
he is in good company there (with all those other clowns there).
richardscourtney says:
June 23, 2014 at 2:15 am
Troll posting as Phil.:
I see that at June 22, 2014 at 8:27 pm you adopt your common practice of attempting to justify your lies by adding another lie.
The troll returns with more lies, if it were the first time one might think it was just a misunderstanding but it’s clear it’s just prevarication.
You write to dbstealey saying
“You asserted:
As for a cooling stratosphere, that was a later fallback position, predicted after the failure of the supposed tropospheric hot spot.
As I pointed out that statement is untrue and I refuted it as follows: “the stratospheric cooling was predicted over 40 years ago by Manabe and Wetherald!””
By whom and when the stratospheric cooling was first suggested 40 years previously does not alter the fact – stated by dbstealey – that it “was a later fallback position, predicted after the failure of the supposed tropospheric hot spot”.
As I pointed out the prediction referred to was made at least 20 years before any mention of the ‘supposed tropospheric hot spot’ so clearly Stealey is wrong.
You and he recognize that which is why you both keep trying to change the subject.
The important point which your disingenuous distraction attempts to smokescreen is that the stratospheric cooling has stopped so – if Manabe and Wetherald are correct – then there is no AGW happening.
Except of course that the data I presented which you and Stealey choose to ignore shows that stratospheric cooling continues.
That one post alone provides corrections to three of your errors; i.e.
1.
Refutation of your attempt at disingenuous distraction.
No attempt at distraction just correcting the facts, no refutation was made by you.
2.
Refutation of your stupid assertion that information previously existing in literature demonstrates that the information was not used as a “fallback”.
I made no such assertion. The proof that Stealey’s claim of “predicted after the failure of the supposed tropospheric hot spot”.” was false still stands, your attempts at obfuscation notwithstanding.
3.
Statement that your so-called evidence shows the opposite of what you (and Simon) claimed.
My actual attributed evidence shows exactly what I claim, Stealey’s unattributed, out of date graph, with no legend or description is worthless.
Here’s the data again, of course you and Stealey will continue to ignore it, as you always do.
http://data.remss.com/msu/graphics/C13/plots/RSS_TS_channel_C13_Global_Land_And_Sea_v03_3.png
http://images.remss.com/msu/msu_time_series.html
The hypothesis to be tested is that the stratospheric cooling continues, the Null hypothesis is therefore that the trend in stratospheric temperature is greater than or equal to 0.
Feel free to show that the Null hypothesis is true to the appropriate significance or shut up about it.
Phil.
You lied. I quoted, cited and refuted some of your lies at June 23, 2014 at 2:15 am here.
In your typical fashion, the truth has rolled off you like water from a duck’s back, and you reply with more lies at June 23, 2014 at 5:57 am.
I point out for onlookers that each time you were shown to be wrong was a refutation of an untrue assertion you made. And each of your claims that your assertions were not refuted is a lie. It may be that you are telling falsehoods to yourself as part of a delusion, but the falsehoods are deliberate and, thus, they are all lies.
Your trolling has fulfilled its usefulness as demonstration for onlookers of the stupidity of the arguments from warmunists. So, you having fulfilled what little usefulness you could provide, I ask you to now go away because – at this point – your trolling has become merely an irritation (similar to midges at a barbecue).
Richard
richardscourtney says:
June 23, 2014 at 6:36 am
Phil.
You lied. I quoted, cited and refuted some of your lies at June 23, 2014 at 2:15 am here.
In your typical fashion, the truth has rolled off you like water from a duck’s back, and you reply with more lies at June 23, 2014 at 5:57 am.
I point out for onlookers that each time you were shown to be wrong was a refutation of an untrue assertion you made. And each of your claims that your assertions were not refuted is a lie.
As the onlookers will see you still have not addressed the statement I made, preferring to pretend that I said something else. My refutation is that Stealey claimed that the prediction of stratospheric cooling followed the issue of the ‘tropospheric hot spot’ whereas it did not and I proved that to be the case. You and Stealey prefer to run away from that.
I ask you to now go away because – at this point – your trolling has become merely an irritation. Of course it irritates you because you’re unable to counter it so you do what you always do namely: try to turn the thread into a food fight with your endless prevarications.
I’ll continue to post on the facts of the case, as I’ve shown stratospheric cooling continues, if you or anyone else wishes to properly test that hypothesis, feel free, the data is available.
HenryP says:
June 22, 2014 at 3:09 am
@Simon
Those still pointing to melting arctic ice and NH glaciers, as “proof” that it is (still) warming, and not cooling, should remember that there is a long lag from energy-in and energy-out. Counting back 88 years i.e. 2013-88= we are in 1925.
Now look at some eye witness reports of the ice back then?
http://wattsupwiththat.com/2008/03/16/you-ask-i-provide-november-2nd-1922-arctic-ocean-getting-warm-seals-vanish-and-icebergs-melt/
Sounds familiar? Back then, in 1922, they had seen that the arctic ice melt was due to the warmer Gulf Stream waters.
Very selective data however, why not take a look at what was happening in the rest of the Arctic.
For example the expedition sent to claim Wrangel Island for Britain, which failed in part because the island was inaccessible because of sea ice for the whole year of 1922.
See for example: http://en.wikipedia.org/wiki/Ada_Blackjack
See, this is the type of stuff that makes the “science” of (C)AGW such a hard sell.
With global warming, there will be stratospheric cooling.
The obverse is with global cooling, there will be stratospheric warming.
So when the glaciation returns and the planetary surface turns into a snowball, with much less heat to be radiated to space due to the albedo change preventing absorption of shortwave radiation, the stratosphere will get blazing hot. Why? Where is the energy for it?
Why is it if the planet is cooling, the atmosphere can’t be cooling as well?
Phil.:
Please stop with your ridiculous lies.
At June 23, 2014 at 7:32 am you write
No!
As usual, you try to defend one of your lies by providing another lie.
At June 19, 2014 at 1:28 am dbstealey wrote saying in full
Clearly, when he wrote
it was the “fallback position” which he said was “predicted after the failure of the supposed tropospheric hot spot”.
You have repeatedly tried to say he was wrong about the “fallback position” because the tropospheric cooling was known prior to failure of the hot spot to occur. Indeed, you have repeated that misrepresentation in your post I am answering and have quoted.
There can be no possibility of excuse for that misrepresentation – it is another of your lies – because dbstealey clarified the matter at June 20, 2014 at 8:23 am when he wrote
I addressed what you wrote and I have now addressed your misrepresentation of what dbstealey wrote. In both cases I have demonstrated that your points are deliberate falsehoods.
And you make a risible suggestion when you assert that I and/or dbstealey would “run away” from a troll who hides behind the coward’s shield of anonymity to present lies.
Richard
richardscourtney says:
June 23, 2014 at 8:13 am
Clearly, when he wrote
As for a cooling stratosphere, that was a later fallback position, predicted after the failure of the supposed tropospheric hot spot
it was the “fallback position” which he said was “predicted after the failure of the supposed tropospheric hot spot”.
If that’s what he’s trying to say then he should learn to write correct English and you as an editor should know better.
You have repeatedly tried to say he was wrong about the “fallback position” because the
troposphericstratospheric cooling was known prior to failure of the hot spot to occur. Indeed, you have repeated that misrepresentation in your post I am answering and have quoted.Not a misrepresentation, what he said was untrue.
There can be no possibility of excuse for that misrepresentation – it is another of your lies – because dbstealey clarified the matter at June 20, 2014 at 8:23 am when he wrote
“The stratosphere argument was based on an already-occurring event. It was simply an extrapolation. And since both the troposphere and stratosphere arguments are made to support the CAGW argument as Simon argues above, then that argument fails.”
Which is not true, clearly he has not read M&W, as they applied a radiative-convective model to the atmosphere, it was not an extrapolation.
If you want to rebut the stratospheric cooling point then take the data I’ve shown you and show that the null hypothesis of temperature trend greater than or equal to 0, holds to the appropriate significance level.
Troll posting as Phil.:
re your post at June 23, 2014 at 9:27 am.
Obfuscate as much as you like.
dbstealey said what he intended, he clarified the matter when pressed on it, and he was right.
You now claim you misread what he wrote because it was not clear.
That is twaddle! If it were unclear prior to his clarification it certainly was not after his clarification.
You have run out of excuses.
Your best option is to retire hurt, and your proper action is to apologise. However, on the basis of your past behaviour I suspect you will do neither but, instead, you are likely to try to press a related issue while pretending that was what you intended from the start.
Indeed, your post provides evidence for my prediction of your pressing a related issue. What M&W modeled 40 years earlier is not relevant to the true and undeniable fact that the stratospheric cooling was – as dbstealey said – an extrapolation of what was happening WHEN that cooling was adopted as a “fallback position” in response to the failure of the tropospheric hotspot prediction.
Richard
phil. says
http://wattsupwiththat.com/2014/06/18/may-2014-global-surface-landocean-and-lower-troposphere-temperature-anomaly-update/#comment-1667465
henry says
You quote wikipedia but I have had some bad experiences there (do you really want me to elaborate?), so I won’t go there.
I think you and I have crossed swords before and generally speaking, I think you fall in the same category as simon: no results of your own. You are a teacher with no hands-on experience. You only rely on your books. That is to say, if you are the same Phil. from my past experiences.
Regarding the subject on hand i.e. whether we (on earth) are cooling from the top latitudes down, I did an independent investigation, taking a random sample of 10 weather stations in Alaska, analyzing all results (for means) from 1998 until 2014.
Here you can see the results
http://oi40.tinypic.com/2ql5zq8.jpg
My finding was that of the 10 stations chosen, 9 stations showed a downward trend. Only one station showed an upward trend. However, that station seems to have an anomalous value for 2000.
Never mind that, even if I accept that value as correct, I find an average downward trend for Alaska (10 stations) of -0.55K/decade.
That means that temperatures in Alaska have gone down by almost 1 whole degree C since 1998 and nobody noticed? How is that possible?
As to the Barrow result: it could be, like I said, because of the lag from the warming period 1950-1995
http://blogs.24.com/henryp/2012/10/02/best-sine-wave-fit-for-the-drop-in-global-maximum-temperatures/
that caused a warmer Gulf stream, seeing that Barrow lies on some water way.
Note that simon’s results also suggest a cooling in Norway, at the higher latitudes, as observed by increasing glaciers.
Antarctic ice is already increasing.
http://wattsupwiththat.com/2013/10/22/nasa-announces-new-record-growth-of-antarctic-sea-ice-extent/#more-96133
richardscourtney says:
June 23, 2014 at 9:51 am
Troll posting as Phil.:
re your post at June 23, 2014 at 9:27 am.
Obfuscate as much as you like.
dbstealey said what he intended, he clarified the matter when pressed on it, and he was right.
You now claim you misread what he wrote because it was not clear.
No I claim you misread it.
That is twaddle! If it were unclear prior to his clarification it certainly was not after his clarification.
All he clarified was that he was wrong and that his clarification clearly indicates that he thought that the ‘stratospheric cooling’ argument was a later extrapolation. That is not true M&W ran a radiation-convection model to come up with their result as stated it was a prediction not an extrapolation, which has been borne out by subsequent data.
You have run out of excuses.
Your best option is to retire hurt, and your proper action is to apologise. However, on the basis of your past behaviour I suspect you will do neither but, instead, you are likely to try to press a related issue while pretending that was what you intended from the start.
I’m certainly not going to apologize for being correct!
Indeed, your post provides evidence for my prediction of your pressing a related issue. What M&W modeled 40 years earlier is not relevant to the true and undeniable fact that the stratospheric cooling was – as dbstealey said – an extrapolation of what was happening WHEN that cooling was adopted as a “fallback position” in response to the failure of the tropospheric hotspot prediction.
Not true, I suggest you read M&W to correct your mistakes, in particular the comments on Fig 16.
http://go.owu.edu/~chjackso/Climate/papers/Manabe_Wetherald_1967_Thermal%20equilibrium%20of%20the%20atmosphere%20with%20a%20given%20distribution%20of%20relative%20humidity.pdf
Phil.:
In my post at June 23, 2014 at 9:51 am I wrote:
You have replied with your post at June 23, 2014 at 10:54 am which concludes saying
Not true!? That is precisely what I predicted you would do!
Q.E.D.
Phil., you really are a very predictable and pathetic little troll.
Richard
HenryP says:
June 23, 2014 at 10:03 am
phil. says
http://wattsupwiththat.com/2014/06/18/may-2014-global-surface-landocean-and-lower-troposphere-temperature-anomaly-update/#comment-1667465
henry says
You quote wikipedia but I have had some bad experiences there (do you really want me to elaborate?), so I won’t go there.
Fine, there are other sources:
http://www.sitnews.net/JuneAllen/AdaBlackjack/020204_heroine.html
I think you and I have crossed swords before and generally speaking, I think you fall in the same category as simon: no results of your own. You are a teacher with no hands-on experience. You only rely on your books. That is to say, if you are the same Phil. from my past experiences.
Well you’re incorrect.
richardscourtney says:
June 23, 2014 at 11:03 am
Phil.:
In my post at June 23, 2014 at 9:51 am I wrote:
Indeed, your post provides evidence for my prediction of your pressing a related issue. What M&W modeled 40 years earlier is not relevant to the true and undeniable fact that the stratospheric cooling was – as dbstealey said – an extrapolation of what was happening WHEN that cooling was adopted as a “fallback position” in response to the failure of the tropospheric hotspot prediction.
You have replied with your post at June 23, 2014 at 10:54 am which concludes saying
“Not true, I suggest you read M&W to correct your mistakes, in particular the comments on Fig 16.”
Not true!?
That’s right, “the stratospheric cooling was not an extrapolation of what was happening WHEN that cooling was adopted as a “fallback position” in response to the failure of the tropospheric hotspot prediction”. It was a prediction made as the result of studies made earlier using radiative-convective models of the atmosphere.
[ snip – we aren’t going to play these games unless of course Phil. wants to put his name out there too. I’ve directed both people to stop the comment fighting, if they don’t I’ll end it for them – Anthony]
I see NOAA has confirmed May to be the Warmest (for May)combined land and sea temp ever recorded. That’s two in a row. Just saying.
Phil. says
http://www.sitnews.net/JuneAllen/AdaBlackjack/020204_heroine.html
Henry says
That story merely confirms what I already know./
It was cooling in Alaska from 1904-1923 exactly as it is cooling there now from 1995-2014 (atmospheric).
It is just with the ice that there is a lag [for this cooling becoming obvious] due to the earth storing energy in its oceans during the warming period, resulting in a warmer Gulf stream.
I explained this. Please read the whole newspaper report from Nov. 1922.
What is your point?
HenryP says:
June 23, 2014 at 11:49 am
Phil. says
http://www.sitnews.net/JuneAllen/AdaBlackjack/020204_heroine.html
Henry says
That story merely confirms what I already know./
It was cooling in Alaska from 1904-1923 exactly as it is cooling there now from 1995-2014 (atmospheric).
It is just with the ice that there is a lag [for this cooling becoming obvious] due to the earth storing energy in its oceans during the warming period, resulting in a warmer Gulf stream.
I explained this. Please read the whole newspaper report from Nov. 1922.
What is your point?
That it’s sloppy to refer to the Arctic when you only refer to part of it, melting in 1922 on the Atlantic side was not accompanied by melting on the Pacific side.
“Very selective data however, why not take a look at what was happening in the rest of the Arctic.”
Phil.:
re your post at June 23, 2014 at 11:32 am.
I see that for thge second time in this thread you have returned to using your usual troll tactic of disingenuous distraction.
I pointed out that you had done precisely what I predicted.
You were wrong, and trying to smokescreen it with what M&W wrote four decades before the matter under discussion is what I predicted you would do.
I have no intention of thickening your smokescreen by discussing the irrelevance of what M&W wrote.
You wrongly claimed dbstealy made an error when he rightly said the stratospheric cooling was a fallback position adopted when the predicted tropospheric hotspot failed to occur. He was right, you were wrong, and you cannot disguise that he was right and you were wrong with your attempts to deflect discussion onto a paper published four decades earlier.
Richard
@Phil.
so, same island that you quoted (on the pacific side) must be freezing up right now
Barrow might be somewhat lucky [now] to get some of the Gulf stream coming through
Why don’t you look at some maps showing the stream circulation? [if you are so interested]
All of this does not change the fact that there is no AGW.
You being a teacher, might be able to figure out why these results [of mine] for the drop in [global] minimum temperatures
last 40 years (from 1974) 0.004K/annum
last 34 years (from 1980) 0.007K/annum
last 24 years (from 1990) 0.004K/annum
last 14 years (from 2000) -0.009K/annum
show that there is no room for any AGW
whatsoever?
Otherwise, take it to one of your colleagues and let me know why I would think [from these results] there is no man made global warming.
HenryP
Re your reply to phil. Please tell me why you think having two record months (NOAA April and May) for land and ocean means there is not at least a chance we are warming. You seem happy to quote over and over again there is no AGW… How do you explain these record setting months?
Simon:
At June 23, 2014 at 1:22 pm you assert and ask
Firstly, they are only “record setting months” according to doctored time series.
As wbrozek explained to you in a post you have studiously ignored at June 21, 2014 at 2:47 pm
I add that GISS is an outlier because it has been altered to extreme degree; see this.
Two high months in dubious outlier data indicate nothing and require no explanation.
Richard
FYI
[I believe] only if you anyone of you can somehow figure out what this graph
http://ice-period.com/wp-content/uploads/2013/03/sun2013.png
will look like in the next 46 years, will you be able to correctly predict the weather and the cooling and warming patterns.
FYI
we have a very cold June here in the SH (Pretoria, RSA, -30 degrees )
My solar panels froze up and broke down.
I hope the insurance is going to pay for it…
Simon,
After responding and answering questions, it is still your turn to answer one. You have been ignoring and avoiding my question. I asked you:
Explain how the Null Hypothesis can support the runaway global warming conjecture. If it cannot, then the CAGW conjecture fails. It is as simple as that.
The ball is still in your court. Explain, please.
dbstealey
To be honest I think there are far more interesting things to discuss than the NH. Like what will happen with or with out this possible El Ninio? You seem to be holding out for an answer on this one, but it is not an area of interest of knowledge for me, and if nothing else I know my limitations. So…. I will respectfully decline on this one through fear of fallingeven further(if that is possible ) in your level of respect. Hey but on a positive note, the weather here in my little end of the world is much warmer than usual, which despite the possibility of AGW is always good in the winter.
richardscourtney says:
June 23, 2014 at 12:23 pm
Phil.:
re your post at June 23, 2014 at 11:32 am.
I see that for thge second time in this thread you have returned to using your usual troll tactic of disingenuous distraction.
I pointed out that you had done precisely what I predicted.
You were wrong, and trying to smokescreen it with what M&W wrote four decades before the matter under discussion is what I predicted you would do.
Since that is what I have said all along that’s not much of a prediction. Stratospheric cooling due to increased CO2 was predicted by the seminal work of Manabe et al in the 60’s and has been well known ever since. It was not some later extrapolation as asserted by Stealey.
I have no intention of thickening your smokescreen by discussing the irrelevance of what M&W wrote.
Of course not, a troll like you wouldn’t deign to actually discuss the matter in hand.
You wrongly claimed dbstealy made an error when he rightly said the stratospheric cooling was a fallback position adopted when the predicted tropospheric hotspot failed to occur. He was right, you were wrong, and you cannot disguise that he was right and you were wrong with your attempts to deflect discussion onto a paper published four decades earlier.
He was wrong in all his statements on the subject, he however didn’t say what you wrote above, why have you switched from quoting what he actually said to inaccurate paraphrasing? What he actually said was: “As for a cooling stratosphere, that was a later fallback position, predicted after the failure of the supposed tropospheric hot spot
Simon,
I answered your questions, and I explained thing s for your benefit. In return, I have only asked you to explain one thing:
Explain how the Null Hypothesis can support the runaway global warming conjecture. If it cannot, then the CAGW conjecture fails. It is as simple as that.
Your response:
“…I think there are far more interesting things to discuss than the NH. Like what will happen with or with out this possible El Ninio?” [I left out the “To be honest” part, since it doesn’t apply].
Whether you find “El Ninio” to be more interesting is not the point. The point is that I have answered your questions, and explained the Null Hypothesis per your own request. RC did so, too.
Now either explain how the Null Hypothesis can support the cAGW conjecture, or you lose the debate. Trying to avoid answering does not let you off the hook.
We all know the reason you are ducking the issue: it is because you have no credible answer. The Null Hypothesis shows conclusively that your catastrophic AGW nonsense is a false alarm.
You keeep wanting to be treated with respect here, but you show no respect when it is your turn to put up or shut up. You can try to move the goal posts again, but I’m here to hold your feet to the fire. The Null Hypothesis makes your belief incredible. That’s the only reason you tuck tail and run, rather than discussing it. The ball is still in your court.
dbstealey
You keeep wanting to be treated with respect here, but you show no respect when it is your turn to put up or shut up. You can try to move the goal posts again, but I’m here to hold your feet to the fire. The Null Hypothesis makes your belief incredible. That’s the only reason you tuck tail and run, rather than discussing it. The ball is still in your court.
——————————-
Actually I don’t think confessing this is not something I know a lot about is ducking anything. AGW has so many facets to it, one cannot possibly know or be competent in them all. You clearly are a legend on the NH thing and for that I absolutely salute and congratulate you. It will just be a fairly boring discussion coz I have nothing to contribute.
I guess you will be running around the room arms raised now, telling anyone who will listen, that the war is over, and that you have once again triumphed over evil. And in this tiny fraction of the ever expanding debate that is AGW you have. I shake your hand (if you will allow it), tip my cap and roll over asking you to scratch my stomach……. Meanwhile the planet warms and we pump ever more of the greenhouse gas that is CO2 into the atmosphere, compounding the warming. NH or no NH……
Simon says:
Actually I don’t think confessing this is not something I know a lot about is ducking anything. AGW has so many facets to it, one cannot possibly know or be competent in them all.
Well then, let’s get you up to speed on the Null. I am willing to teach. Otherwise, you are asserting an opinion based on ignorance, no? You need to think for yourself, instead of letting others think for you.
Meanwhile the planet warms and we pump ever more of the greenhouse gas that is CO2 into the atmosphere, compounding the warming.
You do understand, do you not, that the real world falsifies that religious True Belief? As we add more harmless, beneficial CO2 to the biosphere, global temperatures are declining.
Freedom is Slavery
Ignorance is Strength
CO2 causes Global Warming…
Are you ready for your Null Hypothesis lesson? Or do you prefer a state of ignorance? The choice is yours alone.
Phil.:
At June 23, 2014 at 7:47 pm you have the temerity to write saying to me
As an example of deliberate psychological projection that cannot be excelled.
You are trying to switch the discussion from the subject at hand (i.e. that warmunists used stratospheric cooling as a fallback position when the tropospheric hotspot failed to occur) and onto an irrelevant issue (i.e. contents of a paper from four decades earlier) which you raised.
I am refusing to bite that ‘red herring’.
And as a method to wave your red herring you are misrepresenting what dbstealey said. There can be no doubt that your misrepresentation is deliberate and egregious because you are exploiting an ambiguity in his statement which he later clarified. I dealt with that in my post to you at June 23, 2014 at 8:13 am but – as you always do – you ignore reality and iterate a lie of your own construction.
To save onlookers need to find the clarification, I repeat that matter by repeating it from my post at June 23, 2014 at 8:13 am.
dbstealey had written
it was the “fallback position” which he said was “predicted after the failure of the supposed tropospheric hot spot”.
You have repeatedly tried to say he was wrong about the “fallback position” because the tropospheric cooling was known prior to failure of the hot spot to occur. You are trying to claim that dbstealey was talking about stratospheric cooling prior to its having occurred so his prediction was a claim that it would occur. Indeed, you have yet again repeated that falsehood in your post I am answering.
There can be no possibility of excuse for that misrepresentation – it is another of your lies – because dbstealey clarified the matter at June 20, 2014 at 8:23 am when he wrote
Clearly, he was talking about the “fallback position” (which predicted continued stratospheric cooling) being based on events happening then. He was NOT talking about the paper by M&W from decades before nor contents any other paper which he had not mentioned.
Impartial onlookers will acknowledge that this is the third time your misrepresentation has been spelled out to you in this thread, and they will assess your behaviour for themselves.
Richard
Please tell me why you think we are cooling? Is it a reference to the Woodfortrees graph?…. If it is, I up you (as in cards) with with figure 8. Next card please….. This is fun.
dbstealey
Sorry that last one was for you.
—————————————
Please tell me why you think we are cooling? Is it a reference to the Woodfortrees graph?…. If it is, I up you (as in cards) with with figure 8. Next card please….. This is fun.
Simon:
re your most recent two posts.
The graph of the recent past shows global cooling while atmospheric CO2 is rising.
If you are incapable of reading a graph then perhaps you should consider going away and learning how to assess information before further embarrassing yourself?
Richard
Simon:
You provide yet another ridiculous excuse to evade a direct question in your post at June 23, 2014 at 4:03 pm where you write to dbstealey saying
Please answer the issue put to you by both dbstealey and myself. As he has replied to you
And I add that your excuse is not only ridiculous, it is also blatantly untrue.
If you really thought “El Ninio” (sic) is “far more interesting” then you would be discussing it in the active thread devoted to that subject. It is here and is titled The 2014-15 El Nino – part 11 – Is-the El Nino dying?. But you are proclaiming your ignorance here and not there.
Please address the point put to you.
Richard
dbstealey
On consideration I am thinking the purpose of your graph was to show the relationship between CO2 and temp increase, or the lack of it. While you would think the two should hold hands if AGW were to be correct, the truth is that is far to simplistic. It is an easy trap to fall into and many do, but you wont find a climate scientist alive on the planet who wold agree with that view. There are too many variables that affect the temp short term. El Ninio being one. 1998 was an extraordinary one and the impact of that we all know. Volcanic eruptions and La Nina for example cool the climate. SKS did an excellent graphic that smoothed out these variables and what was left was an easy to see incline.
I will concede though that the rate of warming has slowed in the atmosphere/on land, but if the scientists are to be believed and most of the warming has gone into the oceans, then the air will soon reflect that energy in our temp readings.
The other thing to appreciate as this graph shows
http://en.wikipedia.org/wiki/Global_warming#mediaviewer/File:Global_Temperature_Anomaly.svg
is that there have been other longer periods of no minimal atmospheric warming (early 40’s to mid 70’s), in fact a decline even, but as you will see the temp bounced back to steeply curve up again.
So to conclude, the recent slowdown proves very little in the big scheme of things and the fact CO2 has continued to rise, means we (it is highly likely) will have warming ahead of us. The only real questions as I have said is how much higher and how much damage?
Hope that helps.
Simon
Simon:
I see you continue to reject science and to proclaim superstitious belief with your daft post at June 24, 2014 at 1:02 am.
The natural rise from the Little Ice Age (LIA) was not continuous: it included periods of no discernible rise. The present period of no discernible change in global temperature (at 95% confidence) will end. Then, either the global temperature will continue to rise towards the temperature of the Medieval Warm Period (MWP) or fall towards the temperature of the LIA.
But the present period of no global temperature change is important in terms of assessing the climate models. The US National Oceanic and Atmospheric Atmospheric Administration (NOAA) reported in 2008
The present nearly 18-year period of no discernible change in global temperature (at 95% confidence) shows the climate models are wrong. And those models emulate the understandings of climate which produce the projections of AGW.
Any data can be tortured to show anything, and you are plain wrong when you write
That is gob-smackingly gullible. There has been no significant volcanic cooling recently and aerosols have an unquantifiable effect. SkS removed cooling which they imagined and said, “See we have shown warming”. That is pure fantasy and only the extremely gullible could fall for it when the cessation to global warming proves beyond any possibility of reasonable doubt that understandings of climate as emulated by climate models are wrong.
“Scientists” do not claim – as you assert – that “most of the warming has gone into the oceans”. Indeed, that assertion is why we know the cessation of global warming is so important. The heat-gone-in-the-oceans is the “committed warming” predicted in the IPCC AR4 which has not happened and is conveniently ‘forgotten’ in the AR5.
The explanation for this is in IPCC AR4 (2007) Chapter 10.7 which can be read at
http://www.ipcc.ch/publications_and_data/ar4/wg1/en/ch10s10-7.html
It says there
In other words, it was expected that global temperature would rise at an average rate of “0.2°C per decade” over the first two decades of this century with half of this rise being due to atmospheric GHG emissions which were already in the system.
This assertion of “committed warming” should have had large uncertainty because the Report was published in 2007 and there was then no indication of any global temperature rise over the previous 7 years. There has still not been any rise and we are now way past the half-way mark of the “first two decades of the 21st century”.
So, if this “committed warming” is to occur such as to provide a rise of 0.2°C per decade by 2020 then global temperature would need to rise over the next 7 years by about 0.4°C. And this assumes the “average” rise over the two decades is the difference between the temperatures at 2000 and 2020. If the average rise of each of the two decades is assumed to be the “average” (i.e. linear trend) over those two decades then global temperature now needs to rise before 2020 by more than it rose over the entire twentieth century. It only rose ~0.8°C over the entire twentieth century.
Simply, the “committed warming” has disappeared (perhaps it has eloped with Trenberth’s ‘missing heat’?).
This disappearance of the “committed warming” is – of itself – sufficient to falsify the AGW hypothesis as emulated by climate models. If we reach 2020 without any detection of the “committed warming” then it will be 100% certain that all projections of global warming are complete bunkum.
Richard
richard says
This disappearance of the “committed warming” is – of itself – sufficient to falsify the AGW hypothesis as emulated by climate models. If we reach 2020 without any detection of the “committed warming” then it will be 100% certain that all projections of global warming are complete bunkum.
henry@richard
there is no need to wait until 2020
The proposed mechanism implies that more GHG would cause a delay in radiation being able to escape from earth, which then causes a delay in cooling, from earth to space, resulting in a warming effect.
It follows naturally, that if more carbon dioxide (CO2) or more water (H2O) or more other GHG’s were to be blamed for extra warming we should see minimum temperatures (minima) rising faster, pushing up the average temperature (means) on earth.
I subsequently took a sample of 54 weather stations, 27 from each HS, balanced by latitude and 70%/30% @sea/inland and analysed all daily data. Longitude does not matter as long as you look at the average change from the average per annum.
Note the results I obtained for minima:
last 40 years (from 1974) 0.004K/annum
last 34 years (from 1980) 0.007K/annum
last 24 years (from 1990) 0.004K/annum
last 14 years (from 2000) -0.009K/annum
Setting the speed of warming/cooling out against time you get acceleration, or in this case deceleration. It (the results for minima) then forms a perfect curve, a binomial, like somebody throwing a ball. The relevant quadratic equation equation gives 100% correlation.
If you think I played around “to somehow get” these figures I can you show the tables where these results come from. So my point is, that if there were any AGW, we should see at least some noise/chaos exhibited by a correlation coefficient of [somewhat] less than 1. The binomial for the above results gives me a correlation coefficient of exactly 1.0000.
That means there is only natural warming followed by natural cooling.
There is no “pause”.
It either globally warming or globally cooling.
[of course the amounts of global warming/cooling is so small that my wife still laughs at me arguing about it. It is less than the difference in the temps. within the rooms of house. Nevertheless, I do think that these small changes do affect the weather, somewhat.]
HenryP:
As you know, there is much you say that I do not agree, so it gives me great pleasure to agree something in your post at June 24, 2014 at 5:15 am.
I wrote
You say as comment on that
Yes, I agree.
But I point out that there would be no possibility of argument that the projections of AGW are complete bunkum if we reach 2020 without any detection of the “committed warming”.
Richard
@richard
I don’t think you got that [message], actually.
Stats and maths are probably not your strong point.
HenryP:
Your offensive message at June 24, 2014 at 8:54 am says in total
Say what!?
Where the Dickens does that come from, and why?
Perhaps it is a hangover from the past where I chastised you for your not knowing (and certainly not understanding) what is (and what is not) a “random sample”?
Richard
Richard says
http://wattsupwiththat.com/2014/06/18/may-2014-global-surface-landocean-and-lower-troposphere-temperature-anomaly-update/#comment-1668403
Henry says
right,
that must be the reason why you do not “get” it
let us just say that [I know] that my data sets are more properly balanced than most other sets.
It also includes the relevant information about maxima and minima which [most] other data sets do not have.
Simon says:
There are too many variables that affect the temp short term. El Ninio being one.
I wonder if you know how foolish you sound?
Once again: if you would like to learn about the climate Null Hypothesis as you said earlier, say the word and I will teach you. Because whatever you’re getting from SS, it is clearly misinformation.
I’ve answered your questions, yet you continue trolling here. Instead, let’s discuss the Null Hypothesis. Because as you certainly know by now, that unfalsified hypothesis absolutely debunks the CAGW nonsense that has colonized your mind. Your avoidance of discussing the Null Hypothesis indicates fear on your part. You need to man-up and get over that.
Finally, your baseless assertion that…
…the recent slowdown proves very little in the big scheme of things and the fact CO2 has continued to rise, means we (it is highly likely) will have warming ahead of us. The only real questions as I have said is how much higher and how much damage?
…has no basis in reality. It is a swivel-eyed statement worthy of Chicken Little. There has been no global damage observed due to the rise in CO2. None at all. Global warming has stopped. And as I constantly beat you over the head with it, this chart shows conclusively that T is in decline, even as CO2 continues its steady rise.
Finally, your constant cherry-picking of time scales is tedious, and misrepresents the situation. This chart uses data collated by Phil Jones. It goes back to 1880, and it shows conclusively that the same step changes that happened before CO2 began to rise happened later — thus, CO2 does not have the claimed effect.
You are obviously trolling, and your simple minded arguments are easy to debunk. I don’t respoind to set you straight, that is not possible. I write to make sure others are not taken in by your self-professed ignorance.
Run along now back to SS. You beed some new talking points, because the ones you are using are worn out and busted.
@dbstealey
H0 = there is no man made climate change
H1= there is man made climate change
Looking at my results for minima, as explained before, here I agree with you on H0
next
H0 = there is no climate change
H1 = there is some climate change
looking at my results for means
last 40 years (from 1974) 0.012K/annum
last 34 years (from 1980) 0.011K/annum
last 24 years (from 1990) 0.008K/annum
last 14 years (from 2000) -0.014K/annum
I’d be interested what hypothesis do you chose?
HenryP says:
June 24, 2014 at 5:15 am
I subsequently took a sample of 54 weather stations, 27 from each HS, balanced by latitude and 70%/30% @sea/inland and analysed all daily data. Longitude does not matter as long as you look at the average change from the average per annum.
Note the results I obtained for minima:
last 40 years (from 1974) 0.004K/annum
last 34 years (from 1980) 0.007K/annum
last 24 years (from 1990) 0.004K/annum
last 14 years (from 2000) -0.009K/annum
Setting the speed of warming/cooling out against time you get acceleration, or in this case deceleration. It (the results for minima) then forms a perfect curve, a binomial, like somebody throwing a ball. The relevant quadratic equation equation gives 100% correlation.
Do you mean a binomial or did you actually use a quadratic? With 4 data points such a goodness of fit is to be expected.
Troll posting as Phil.:
I see that at June 24, 2014 at 12:17 pm you acknowledge your misrepresentation of the “fallback” issue has failed because you attempt to again move the goal posts. Now you try to argue about the ‘hotspot’ instead of stratospheric cooling.
The IPCC AR4 said the tropospheric hot spot was an effect of warming by GHGs.
You say it is an effect of warming from any cause.
THE HOTSPOT HAS NOT HAPPENED.
If the IPCC AR4 is right that means there has been no global warming from GHGs.
And
If you are right that means there has been no global warming from any cause.
In either case your retreat from your fallacious misrepresentation of the ‘fallback issue’ asserts that there is no AGW.
Richard
phil. says
http://wattsupwiththat.com/2014/06/18/may-2014-global-surface-landocean-and-lower-troposphere-temperature-anomaly-update/#comment-1668561
Henry says
I am puzzled that I would have to explain here high school stuff about throwing a ball and what curve it goes. Obviously it is parabolic and excell shows you the equation and the correlation if you punch in the data points. 4 points is all I need, as long as I do not go outside (to predict)
……………
I get 1.000 on minima, meaning there is no man made global warming.
I get 0.98 for means
http://wattsupwiththat.com/2014/06/18/may-2014-global-surface-landocean-and-lower-troposphere-temperature-anomaly-update/#comment-1668497
I get 0.99 for maxima
All of that cannot be coincidental. It is due to natural process.
Henry P,
There is no measurable AGW. That isn’t a hypothesis, that is reality.
Simon says:
June 24, 2014 at 1:02 am
“I will concede though that the rate of warming has slowed in the atmosphere/on land, but if the scientists are to be believed and most of the warming has gone into the oceans, then the air will soon reflect that energy in our temp readings.”
The air will never “reflect that energy in our temp readings”. By the 2nd Law of Thermodynamics, the oceans cannot heat the atmosphere beyond their temperature differential. So, in the worst possible case, that energy can only go into the atmosphere to the point where the atmospheric temperature rise is the same as the ocean temperature rise. After that, they can only release the energy to maintain that atmospheric temperature level at the same rate as the atmosphere loses it to space.
The heat capacity of the oceans is vast, and the increase in temperature of the oceans, even in the highly unlikely event of the immaculate convection of CO2 induced heat to the depths according to the narrative, is utterly negligible. Hundredths of a degree. We are not worried about a hundredths of a degree rise in atmospheric temperatures. You should not be worried about a hundredths of a degree rise in atmospheric temperatures.
dbstealey
There is no measurable AGW. That isn’t a hypothesis, that is reality.
———————————
Ha ha. Well someone better tell these people
http://opr.ca.gov/s_listoforganizations.php
Simon:
re your post at June 24, 2014 at 10:12 pm.
There is no need to tell those organisations that there is no measurable AGW because they know.
Anybody who wants to know how the Executives of those organisations were deliberately usurped can obtain the shocking information – which names names – in this paper by Lindzen; it is is a shocking and entertaining read
http://www.globalresearch.ca/climate-science-is-it-currently-designed-to-answer-questions/16330
Richard
@db stealey
Both of us already agree on AGW, ie. that there is none. I think you did get what I was asking about.
@Bart, db stealey
I’d be interested to hear from you whether you agree with me that the climate is changing,
naturally, i.e. we are cooling
http://www.woodfortrees.org/plot/hadcrut4gl/from:1987/to:2015/plot/hadcrut4gl/from:2002/to:2015/trend/plot/hadcrut3gl/from:1987/to:2015/plot/hadcrut3gl/from:2002/to:2015/trend/plot/rss/from:1987/to:2015/plot/rss/from:2002/to:2015/trend/plot/hadsst2gl/from:1987/to:2015/plot/hadsst2gl/from:2002/to:2015/trend/plot/hadcrut4gl/from:1987/to:2002/trend/plot/hadcrut3gl/from:1987/to:2002/trend/plot/hadsst2gl/from:1987/to:2002/trend/plot/rss/from:1987/to:2002/trend
Note that my results show current speed of cooling at -0.014K/annum (since 2000)
Sorry, I see now that I had missed an update on my means table.
We are currently cooling at a rate of -0.015K/annum, average since 2000.
That is not worrying anyone?
richardscourtney says:
June 24, 2014 at 1:11 pm
Troll posting as Phil.:
I see that at June 24, 2014 at 12:17 pm you acknowledge your misrepresentation of the “fallback” issue has failed because you attempt to again move the goal posts. Now you try to argue about the ‘hotspot’ instead of stratospheric cooling.
I’m undecided on whether you don’t read the posts you respond to or you’re just a liar.
As I clearly stated, instead of replying to your misrepresentations of Stealey’s original statements I returned to the original and made the same rebuttals as I had previously. In addition I responded to his first point about the ‘hotspot’ itself.
The IPCC AR4 said the tropospheric hot spot was an effect of warming by GHGs.
You say it is an effect of warming from any cause.
No the science says that it can be caused by any source of warming, due to the increased water vapor present as a result of the warming. I quoted Dr Roy Spencer, a frequent contributor here, who made that point in a posting here but could have referred to many others.
THE HOTSPOT HAS NOT HAPPENED.
If the IPCC AR4 is right that means there has been no global warming from GHGs.
And
If you are right that means there has been no global warming from any cause.
In either case your retreat from your fallacious misrepresentation of the ‘fallback issue’ asserts that there is no AGW.
There is no ‘retreat’ since I haven’t changed my position, either read the post or stop lying about it.
Troll posting as Phil.:
Your problem is that I do read the falsehoods and the stupidities you write, and I refute them.
You have moved the goal posts to the tropospheric hotspot from your original and wrong point about stratospheric cooling. Everybody can see that “retreat”, and your bluster does not – and cannot – hide it.
The amusing point is that your new assertion refutes your claims of AGW!
As I said
Richard
Friends:
There may be some who have been misled by the troll posting as “Phil.”.
The nature of the tropospheric hotspot is described in Chapter 9 of the IPCC AR4 WG1 Report and can be seen here
https://www.ipcc-wg1.unibe.ch/publications/wg1-ar4/ar4-wg1-chapter9.pdf
Figure 9.1 is on page 675 of that document.
The Figure is titled
The hotspot is the big, red blob which only exists in (c) wellmixed greenhouse gases, and in (f) the sum of all forcings (which includes the effect of wellmixed greenhouse gases).
It represents a rate of warming at altitude in the tropics which is 2x to 3x the rate of warming at the surface. And it occurs because the model assumes the water vapour feedback (WVF) increases the warming effect of other greenhouse gases.
Richard
Simon,
Richard beat me to it, I was going to post that Lindzen link.
Your constant appeals to authority are tedious. Appeal to Authority is a fallacy that only works with people who do not think, like you.
Those ‘authorities’ are corrupted, as Prof. Lindzen makes clear. Read in particular Section 2.
The only credible climate Authority at this point is Planet Earth, which is flatly contradicting every ‘authority’ you posted — they are all wrong.
You never answer questions, cementing your role as a troll. But you could try to answer just one simple question:
Who should we believe? Your ‘authorities’?
Or Planet Earth?
Because they cannot both be right.
Either start having a discussion without constantly moving the goal posts, or setting up strawmen, or refusing to respond to questions, or your comments will be consigned to the bit bucket for multiple site rule infractions.
Finally, there are no measurements of AGW. Instead of saying, ‘haha’, post a testable, verifiable measurement showing AGW. Do not bother with anything showing general global warming, we already know natural global warming is happening.
That is a challenge to you. Like all other challenges, you know you will fail, so you will change the subject, or ignore it, or exhibit some other troll behavior. See the paragraph above, and don’t complain when it happens.
HenryP says:
June 24, 2014 at 1:12 pm
phil. says
http://wattsupwiththat.com/2014/06/18/may-2014-global-surface-landocean-and-lower-troposphere-temperature-anomaly-update/#comment-1668561
Henry says
I am puzzled that I would have to explain here high school stuff about throwing a ball and what curve it goes. Obviously it is parabolic and excell shows you the equation and the correlation if you punch in the data points. 4 points is all I need, as long as I do not go outside (to predict)
I asked for clarification because you also referred to it as a binomial, which in general quadratic isn’t.
Using such a small number of points guarantees a strong correlation, it doesn’t really tell you much.
A quadratic has three parameters and so needs three points to define it. in your case you appear to be using overlapping data, how are you dealing with that?
richardscourtney 4:34am: “And (hotspot) occurs because the model assumes the water vapour feedback…”
Thru inspection of model results compared to observations of top post anomaly, the GC models have not proven reliable forecasters of Tmean anomaly so far on out of sample data. That GCMs show a “hotspot” – does not invalidate the 1st principle physics of IR active gas in an atmosphere & only confirm the system modeling is suspect. The “hotspot” is a symptom of attempts modeling huge complex chaotic system not basic IR active gas science long established by replicable lab test & reasoned analysis.
******
dbstealey 5:02am: “Appeal to Authority is a fallacy..”
When the appeal is properly made to a generally accepted authority it is not a fallacy. Proof is in teaching methods work out fairly well using generally accepted text books properly chosen based on test & original cites. If the appeal results in simple assertion or is circular, then the appeal can be fallacious.
“The only credible climate Authority at this point is Planet Earth…Who should we believe?…That is a challenge.”
To answer your challenge, believe those that can run a control experiment of a real & duplicate Planet Earth system without humans adding IR active gas in order to determine if AGW exists by measurable anomaly in the two system’s global surface Tmean.
Absent that, I predict blogging will drift into and out of proper appeal to authority & attacks on the basic IR active gas science for shock and/or entertainment value. At least until reduced CIs become more informative on system surface Tmean response to single parameter perturbation.
richardscourtney says:
June 25, 2014 at 4:34 am
Friends:
There may be some who have been misled by the troll posting as “richardscourtney”.
“The nature of the tropospheric hotspot is described in Chapter 9 of the IPCC AR4 WG1 Report and can be seen here
https://www.ipcc-wg1.unibe.ch/publications/wg1-ar4/ar4-wg1-chapter9.pdf
Figure 9.1 is on page 675 of that document.
The Figure is titled
Zonal mean atmospheric temperature change from 1890 to 1999 (°C per century) as simulated by the PCM model from
(a) solar forcing,
(b) volcanoes,
(c) wellmixed greenhouse gases,
(d) tropospheric and stratospheric ozone changes,
(e) direct sulphate aerosol forcing
and
(f) the sum of all forcings.
Plot is from 1,000 hPa to 10 hPa (shown on left scale) and from 0 km to 30 km (shown on right). See Appendix 9.C for additional information. Based on Santer et al. (2003a).
The hotspot is the big, red blob which only exists in (c) wellmixed greenhouse gases, and in (f) the sum of all forcings (which includes the effect of wellmixed greenhouse gases).
It represents a rate of warming at altitude in the tropics which is 2x to 3x the rate of warming at the surface. And it occurs because the model assumes the water vapour feedback (WVF) increases the warming effect of other greenhouse gases.”
Since my earlier post from June 24, 2014 at 12:17 pm has apparently been deleted I’ll refer you to Spencer’s post again. (Mods perhaps you could restore it or if not delete Courtney’s misrepresentation of it? richardscourtney says: June 24, 2014 at 1:11 pm)
Talking specifically about that figure Spencer says:
“But all the figure demonstrates is that the warming influence of GHGs is stronger than that from a couple of other known external forcing mechanisms, specifically a very small increase in the sun’s output, and a change in ozone. It says absolutely nothing about the possibility that warming might have been simply part of a natural, internal fluctuation (cycle, if you wish) in the climate system.”
“But the hotspot is not a unique signature of manmade greenhouse gases. It simply reflects anomalous heating of the troposphere — no matter what its source. Anomalous heating gets spread throughout the depth of the troposphere by convection, and greater temperature rise in the upper troposphere than in the lower troposphere is because of latent heat release (rainfall formation) there.”
“The heating in the upper troposphere is not from water vapor at that level, but rising from below condensing and releasing latent heat. It is BECAUSE the specific humidity is limited at 200 mb that water ascending to the level must be precipitated out. Also, remember the heat capacity of air at 200 mb is only 20% of that at 1000 mb (less air to heat), which helps amplify a temperature rise.”
http://wattsupwiththat.com/2009/10/11/spotting-the-agw-fingerprint/
Troll posting as Phil.:
I am writing to draw attention to your incredibly funny post at June 25, 2014 at 6:18 am. It is Pythonesque.
It quotes my quotation of what the IPCC AR4 says and repeats your silly assertion concerning your retreat argument about the hotspot.
I again point out that you have switched to the hotspot because you failed in your attempts to misrepresent about stratospheric cooling being a “fallback”. And, importantly, your retreat position refutes your claims of AGW!
As I said
The IPCC AR4 said the tropospheric hot spot was an effect of warming by GHGs.
You say it is an effect of warming from any cause and cite Spencer in support of that.
THE HOTSPOT HAS NOT HAPPENED.
If the IPCC AR4 is right that means there has been no global warming from GHGs.
And
If you are right that means there has been no global warming from any cause.
In either case your retreat from your fallacious misrepresentation of the ‘fallback issue’ asserts that there is no AGW.
I agree that there is no discernible AGW.
Richard
richardscourtney says:
June 25, 2014 at 8:26 am
Troll posting as Phil.:
I am writing to draw attention to your incredibly funny post at June 25, 2014 at 6:18 am. It is Pythonesque.
I’m glad it amuses you.
It quotes my quotation of what the IPCC AR4 says and repeats your silly assertion concerning your retreat argument about the hotspot.
No it does not, it links to Roy Spencer’s WUWT post concerning the ‘hotspot’, are you saying Roy’s post is silly? Or like before you didn’t really read it and failed to notice that it was his? The only reason I repeated it is that the earlier post which referred to it was deleted, more of Stealey’s chicanery no doubt.
I again point out that you have switched to the hotspot because you failed in your attempts to misrepresent about stratospheric cooling being a “fallback”. And, importantly, your retreat position refutes your claims of AGW!
No, I’ve proved the point about Stealey’s errors, I see no point in continuing to debate them with a troll such as yourself.
As I said
The IPCC AR4 said the tropospheric hot spot was an effect of warming by GHGs.
You say it is an effect of warming from any cause and cite Spencer in support of that.
THE HOTSPOT HAS NOT HAPPENED.
If the IPCC AR4 is right that means there has been no global warming from GHGs.
And
If you are right that means there has been no global warming from any cause.
In either case your retreat from your fallacious misrepresentation of the ‘fallback issue’ asserts that there is no AGW.
Firstly, there is no ‘retreat’, secondly if you understood Spencer’s argument you would realize that it doesn’t mean that at all.
Phil. says
I asked for clarification because you also referred to it as a binomial, which in general quadratic isn’t.
Using such a small number of points guarantees a strong correlation, it doesn’t really tell you much.
A quadratic has three parameters and so needs three points to define it. in your case you appear to be using overlapping data, how are you dealing with that?
Henry says
Even for a linear function, like in photometry, you need at least 3 points. If there is a bend, like in AAS (e.g. for tin) you need at least 4 points.
That is my point. You only need 4 measuring points to see what the function looks like, and to define it mathematically.
In Excell they give you the option of a polynomial fit of various orders. I used the 2nd order here. Generally speaking (I am not sure in USA?) a polynomial of the second order, i.e a quadratic function, is also referred to as a bi-nomial. Perhaps you learned something else?
The overlap is irrelevant. I measured the average speed of warming over 4 periods of time, i.e. the average change in K/annum from the average of that whole period. Once you have those 4 points (from the linear regressions of all the results in each of those 54 stations) you can set that [average of 54 stations] out against time to observe acceleration/deceleration (K/yr square)
It is really quite simple.
Troll posting as Phil.:
I see that in your post at June 25, 2014 at 9:28 am you again attempt your favourite trolling tactic of disingenuous distraction. How many times have you done it this thread now; four, isn’t it?
You pretend that I am disputing with Spencer. No! I am laughing at you.
You made an assertion which – if accepted – demonstrates there has been no global warming from any cause. You chose who and what to cite in support of your assertion.
The reason you made the assertion was as a smokescreen for you having been shown to be wrong about use of stratospheric warming as a warmunist “fallback” position.
Now you try to start an argument about what you assert Spencer wrote and try to use the argument as a smokescreen for your assertion being shown to indicate there has been no discernible global warming from any cause.
So, I see no reason to argue about what you claim Spencer said. I repeat what I said as conclusion in my post you purport to be answering,
I agree that there is no discernible AGW.
Richard
Trick:
re your post at June 25, 2014 at 5:52 am.
The climate models all fail as devices to predict future climate. Live with it.
Richard
richardscourtney 10:11am: “..climate models all fail Live with it.”
Agreed for GCMs in bulk & I am interested to watch for continuous improvement in those GCMs out of sample. More basic Callendar 1938 surface Tmean anomaly predictions have stood the test of time to reasonable approx. CI out of sample to top post instrumental data measured over centuries, rounded.
Trick says:
If the appeal results in simple assertion or is circular, then the appeal can be fallacious.
Thank you for that. Simple assertions are the basis for those groups’ position. All it takes are a few activists on the Board — just one or two is sufficient — and the entire organization can be turned to a particular narrative. That is what has happened, as documented by Prof. Lindzen.
To date there is no testable, merasurable scientific evidence quantifying the putative fraction of a degree of temperature change due to human CO2 emissions. Thus, the position of those groups is nothing more than a baseless assertion. Therefore, it is a fallacy to appeal to their ‘authority’, particularly since those ‘authorities’ are contradicted by the only real Authority: Planet Earth.
HenryP says:
June 25, 2014 at 9:51 am
Even for a linear function, like in photometry, you need at least 3 points. If there is a bend, like in AAS (e.g. for tin) you need at least 4 points.
That is my point. You only need 4 measuring points to see what the function looks like, and to define it mathematically.
But if you use the minimum the goodness of fit is meaningless.
In Excell they give you the option of a polynomial fit of various orders. I used the 2nd order here. Generally speaking (I am not sure in USA?) a polynomial of the second order, i.e a quadratic function, is also referred to as a bi-nomial. Perhaps you learned something else?
A binomial is the sum of two monomials, therefore only two terms, a quadratic has three, that’s why I asked.
The overlap is irrelevant. I measured the average speed of warming over 4 periods of time, i.e. the average change in K/annum from the average of that whole period. Once you have those 4 points (from the linear regressions of all the results in each of those 54 stations) you can set that [average of 54 stations] out against time to observe acceleration/deceleration (K/yr square)
It is really quite simple.
A strange way to do it, why not do it per decade with no overlap?
[snip. Site Policy: Internet phantoms who have… no name… get no respect here. If you think your opinion or idea is important, elevate your status by being open and honest. People that use their real name get more respect than phantoms with handles. The idea of the blog is to learn and discuss. Constantly changing the subject, and a refusal to discuss subjects that are raised but then may lead to an uncomfortable conclusion for one party are not acceptable behavior. Discussion requires an honest give and take, no mater where it leads. ~mod.]
Simon:
Yet again you ignore what you are told.
At June 25, 2014 at 11:54 am you claim I think you are merely “silly” and “deluded”.
No! I made it very clear and in very plain language that I consider you with disdain.
My contempt is much, much more than would be the case if I thought you were merely “silly” and “deluded”.
You are clearly a troll pretending complete stupidity as a method to publish misleading nonsense on the world’s most successful science blog. You may be obtaining remuneration for doing this or merely doing it from malign intent. Either way, interacting with you has similar emotion to removing something unpleasant from the instep of a shoe.
I hope you have now grasped what I really think of you.
Richard
Troll posting as Phil.:
I have read your post at June 25, 2014 at 12:28 pm.
As I understand it,
1.
You do not dispute that your argument about the hotspot asserts there has been no global warming from any cause.
2.
You want to argue about what you claim Spencer said because that will smokescreen the fact of your argument about the hotspot asserting there has been no global warming from any cause.
3.
You have abandoned your original – and very silly – assertion that stratospheric cooling was not used as a “fallback” when the hotspot failed to occur.
Do you agree that is a fair and accurate summary?
Richard
@Phil.
with linear regression, the more points you have (i.e. the actual average yearly temperatures measured at the station), the higher the accuracy. For the shortest period (from 2000) the number of measuring points is actually barely enough.
Nevertheless, the last point [for minima] is still accurate – must be-
last 40 years (from 1974) 0.004K/annum
last 34 years (from 1980) 0.007K/annum
last 24 years (from 1990) 0.004K/annum
last 14 years (from 2000) -0.009K/annum
as together it gives me a perfect parabolic function with correlation coefficient:1.000
So, there is no room for any AGW [for minima]
Unless the AGW follows a perfect parabolic curve the same as the natural one?
I think we are all agreed here that there is no discernible AGW
[except simon but he has no results of his own so his word does not count – I told you all that you are wasting your time with him.]
richardscourtney says:
June 25, 2014 at 12:36 pm
Troll posting as Phil.:
I have read your post at June 25, 2014 at 12:28 pm.
As I understand it,
Which clearly you don’t.
1.
You do not dispute that your argument about the hotspot asserts there has been no global warming from any cause.
2.
You want to argue about what you claim Spencer said because that will smokescreen the fact of your argument about the hotspot asserting there has been no global warming from any cause.
3.
You have abandoned your original – and very silly – assertion that stratospheric cooling was not used as a “fallback” when the hotspot failed to occur.
Do you agree that is a fair and accurate summary?
No, it’s wrong in all particulars, nice try at trying to distort the post though.
Akin to asking the question: “When did you start beating your wife?”
HenryP says:
June 25, 2014 at 3:42 am
“I’d be interested to hear from you whether you agree with me that the climate is changing, naturally, i.e. we are cooling”
Of course, we are. It’s just a repeat of the pattern in the 1930-1950 range.
Trick says:
June 25, 2014 at 5:52 am
“When the appeal is properly made to a generally accepted authority it is not a fallacy.”
No, it is always a fallacy to claim the truth or falsity of a statement depends on the person making it. You can attach a likelihood of truth or falsity based on the source, but you cannot make a definitive determination.
Simon says:
June 25, 2014 at 11:54 am
“…who to believe….the entire authoritative scientific community and the planet itself…”
When you get to define who is authoritative and who is not, and cherry pick the evidence you use, you can prove to yourself quite nearly anything you want to prove.
However, you appear to know little of the history of science. It has not generally, or even usually on the frontiers, been the case that the majority of widely acknowledged experts on a particular issue has been right. In fact, the entire history of science is replete with dead ends pursued and dogma adhered to until a shift in understanding revealed the conventional wisdom to have been erroneous.
Moderator
Thank you for your reply..
Internet phantoms who have… no name… get no respect here. If you think your opinion or idea is important, elevate your status by being open and honest. People that use their real name get more respect than phantoms with handles. The idea of the blog is to learn and discuss. Constantly changing the subject, and a refusal to discuss subjects that are raised but then may lead to an uncomfortable conclusion for one party are not acceptable behavior. Discussion requires an honest give and take, no mater where it leads.
——————————————————————————-
My name is indeed Simon. I can’t think why given people here have the weirdest handles (as they do on most blogs), you would think I would be making a name like Simon up. But for the record it is indeed my name.
I don’t believe I have done anything but state facts without getting personal. Something others here who don’t agree with me have found difficult to do. All I have really done is state a position that I maintain is not that far from Mr Watts himself and that is there has been warming, there very well could be more and at this stage it is unsure how much damage it will do?
Thank you again for the reply.
Troll posting as Phil.:
I attempted to cut through the bluster and ad homs. in your post at June 25, 2014 at 12:28 pm and – in my post at June 25, 2014 at 12:36 pm – to state the only three pieces of real information I could discern in your post. I said those were what I understood your post to have said and I asked you
At June 25, 2014 at 1:16 pm you have replied saying I had not understood and responding to my summary by saying in total
Clearly, I did not ask a “have you stopped beating your wife” question and I would be interested to know in what way you think I “distorted your post” other than my failure to mention its ignorant and childish insults. Importantly, I fail to understand how my post was “wrong in all particulars” and I would welcome information as to what you did intend if not the “particulars” I stated.
These are the “particulars” which summarised my understanding of what you wrote, and I would welcome your corrections of them if they are not what you intended to say.
Richard
Bart 1:22pm: “..it is always a fallacy to claim the truth or falsity of a statement depends on the person making it.”
OT and agreed in the case you mention since your circular appeal example is improperly produced. When the appeal is properly made to a generally accepted authority it is not a fallacy.
******
OT Q: “When did you start beating your wife?”
Successful counter that attempt at entrapment with simple A: I have never beaten my wife.
Well, unless you previously admitted to such under oath and IF you want to admit having a wife.
Usually followed up with: “You dodged my question.” Stop that with a redirected Q back: How could I have beaten a wife I never had?
Q’s: Is blog commenting entertaining? & How are you?
A: It’s complicated.
Simon says:
June 25, 2014 at 2:06 pm
You may have missed a key, and put in a non-existent e-mail account. I think I’ve lost some that way.
Bart
However, you appear to know little of the history of science. It has not generally, or even usually on the frontiers, been the case that the majority of widely acknowledged experts on a particular issue has been right. In fact, the entire history of science is replete with dead ends pursued and dogma adhered to until a shift in understanding revealed the conventional wisdom to have been erroneous.
————————————
While you are of course right that history is full of people/scientists who have got things wrong, it is a dangerous road to assume that means it is a likelihood that all things scientists assert or agree on will most likely be wrong. Science (in the last 100 years anyway) has got a whole lot more right than it has wrong, I’d rather put my faith in mainstream science than not. It’s why I immunize my kids (and myself), fluoridate my water and exercise every day.
Simon says:
June 25, 2014 at 6:49 pm
“It’s why I immunize my kids (and myself), fluoridate my water and exercise every day.”
And, no doubt, avoid tobacco products. But, these are all influences which can be studied in controlled experiements over short timeframes, and cause and effect thereby validated. When you are on the frontiers where such closed loop experimentation is impossible, “expert” opinion is really nothing more than a semi-informed guess.
Look, Simon, in the last century, scientists have been wrong about eugenics, about continental drift, about the steady state theory of the universe, and about the bacterial origins of stomach ulcers, to name a few of the most glaring errors made by consensus science. And, the establishment scientists are wrong about global warming. You can’t get around the 18 year-and-counting halt in global temperatures. If CO2 were actually so powerful a climate modulator as they have proposed, and it has increased an additional 30% above its pre-industrial concentration during the interval of the stagnant temperatures, then there is a blatant contradiction.
I would direct you again to my first comment in this thread. Read it this time for comprehension. Look at the plots. And, realize that there is nothing going on today which shows any deviation from the long established pattern. And, that long established pattern A) has nothing to do with us, and B) is one of modest, natural warming, meriting no particular concern.
Bart
Much of what you say is true…. I’m just not sure about the “natural trend thing.” I think it unwise to assume the temp will follow a straight line with CO2. and that if it doesn’t, it somehow proves it is all over rover for the proof it (CO2)has an influence on our climate. It is an interesting time we live in and I can’t wait to see what the next few years have in store. I actually think there is every chance the temp will not rise any more, simply because as we know this is a hugely complex thing and maybe science has it wrong. If that is the case, then that is great news. As Prof Richard Alley once said… if this were a movie I would push fast forward and race to the end to see what happens.
[snip]
bart says
http://www.woodfortrees.org/plot/hadcrut4gl/from:1900/to:2015/plot/hadcrut4gl/from:2002/to:2015/trend/plot/hadcrut3gl/from:1987/to:2015/plot/hadcrut3gl/from:2002/to:2015/trend/plot/rss/from:1987/to:2015/plot/rss/from:2002/to:2015/trend/plot/hadsst2gl/from:1987/to:2015/plot/hadsst2gl/from:2002/to:2015/trend/plot/hadcrut4gl/from:1987/to:2002/trend/plot/hadcrut3gl/from:1987/to:2002/trend/plot/hadsst2gl/from:1987/to:2002/trend/plot/rss/from:1987/to:2002/trend
Henry says @Bart
interesting link and graph.
btw could you just show me how you got that written as a nice short link?
{I forgot or else the way as it was shown to me last time does not work here anymore}
First of all, the graph from 1900 shows a general upward trend which I think is mostly due to improved equipment as time goes by, e.g. before 1950 thermometers were not even re-calibrated at regular intervals. Since the seventies we started with thermo-couples and automatic recording equipment which must have caused a big jump in accuracy as well. I find something similar happened with the SSN data as well.
Interesting also, that you have identified where we are more or less on the timescale of the Gleissberg cycle.
According to my calculations and the positions of the planets we are now around 1925/1926.
I reckon you are the cleverest of us all here, so I want to challenge you a bit by giving me a prediction as to where we are headed with this graph for the next 46 years or so:
http://ice-period.com/wp-content/uploads/2013/03/sun2013.png
Note the bi-nomials (quadratics) you can draw from the top to bottom (hyperbolic, + field strength) and from the bottom to the top (parabolic, – field strength). Seemingly [to me] it must come to a dead end stop around 2015 or 2016?
Simon says:
June 25, 2014 at 7:34 pm
Fair enough. Sorry for my cross words earlier. I’m sick to my teeth of the whole thing, and certain that it is piffle, and sometimes lose patience.
HenryP says:
June 25, 2014 at 10:39 pm
You embed the links like this (using less than and greater than signs instead of parentheses)
(a href=”linkname”)words you want to appear(/a)
“…giving me a prediction as to where we are headed with this graph for the next 46 years or so…”
My bet is that the future will look something like this.
Bart
My bet is that the future will look something like this.
————————-
Looks reasonable. As good a bet as any.
Troll posting as Phil.:
Thankyou for attempting to answer my request at June 25, 2014 at 2:10 pm for you to explain what you thought I had misunderstood in your post at June 25, 2014 at 12:28 pm.
Your attempt is at June 25, 2014 at 9:30 pm and is very strange. It makes me wonder if you suffer from dyslexia or some similar malady: if so, then perhaps you would say that to permit your illogical behaviour to be considered with charity.
You say to me
As everybody can see, I repeatedly tried that but you repeatedly selected from the quotations, avoided answering my points, changed subject, and ‘moved goalposts’. Eventually, I tried to cut through that ‘Gordion Knot’ of your accumulated falsehoods and to summarise what I understood you to have said. Now you complain because I tried to summarise the issues: that complaint could be your dyslexia or your duplicity but it is hard to imagine any other understanding of it.
I turn from those general points to the three specifics which I stated were what I understood you to have said.
I wrote
You have replied
No! That is a summary of your refusal to address the effect of the issue which you raised and I repeatedly put back to you. And you DID write “your argument”.
At e.g. June 25, 2014 at 3:55 am you claimed of the tropospheric hot spot
And you wrote that in response to my REPEATEDLY writing to you
I really am beginning to think that your many falsehoods are a result of your mental condition. You asserted the hotspot “can be caused by any source of warming”, you repeatedly refused to answer my point that if your assertion is true then there has been no global warming from any cause, and when I summarise that as “You do not dispute that your argument about the hotspot asserts there has been no global warming from any cause” you reply that it is something you “did not write”.
Troll, can you understand the problems your assertions cause me? I answer what you write and you reply, “This is your ‘summary’ of something I didn’t write!” Discussion is not possible when you provide such non sequiter.
My second summation of my understanding of your words said
Your reply says in total
I made no “insinuation”: I made a blunt statement.
You raised the issue of Spencer which I refused to address because it is not relevant. Of importance is that if your assertion is true then the absence of the hotspot combines with your assertion to indicate that there has been no global warming. Who has or has not supported your assertion alters that not one jot.
No ‘mind reading’ is involved. If you did not raise the irrelevance as a smokescreen then why did you raise it? And why did you not dispute my understanding of it being a smokescreen when I raised that in a previous post?
You raise an additional red-herring presumably as additional smokescreen. The hot-spot is missing: it has not been detected. People can “discuss” that as much as they like, but the rate of warming at altitude is not observed to be 2x to 3x the rate of warming at the surface in the tropics; i.e. the hot spot is missing.
The fact that the hot spot was determined to be missing is why the “fallback” mentioned by dbstealey was adopted.
Your dispute of my third point is surreal.
I wrote
And you have replied
Say what!? Have you completely abandoned your senses?
This entire dispute was your ridiculous assertion that dbstealey was wrong when he wrote at June 19, 2014 at 1:28 am saying in total
The entire debate between me and you has been about that. But you now reply to my saying to me,
“You have abandoned your original – and very silly – assertion that stratospheric cooling was not used as a “fallback” when the hotspot failed to occur.”
And you assert that you “did not make that claim” which was”fabrication” by me.
Importantly, I joined debate of that with you at June 20, 2014 at 1:25 am where I wrote
The fact that dbstealey was right is not affected in any way by your pretending (to yourself?) that you having stated an irrelevance ‘proves’ something.
In summation, it is clear that your post I am answering demonstrates that my attempted summary of your assertions was completely correct.
Richard
@bart
thanks, I hope this works:
trend from 1987
I am with you on your graph where you show cooling until 2040. The rest: I don’t think so.
I am convinced that temperature [and the warming of the past] is [was] driven exclusively by the sun. In this respect the graph of the sun’s magnetic field that I quoted to you is relevant on what way it is going to go. Namely, my results on the speed of warming over the longest period (i.e. from 1973/1974) for which we have very reliable records, show maxima : means: minima
0.034 : 0.012 : 0.004 in degrees C/annum.
That is ca. 8:3:1. So it was maxima pushing up minima and means and not the other way around.. Anyone can duplicate this experiment and check this trend in their own backyard or at the weather station nearest to you. AGW theory assumes increasing minima pushing up means. I already showed from my results for minima that there is no AGW, as there is no room for it in my equation.
Global cooling has now set in [from 1995, when looking at energy-in] and it will continue until 2038
There might be some [cooling] lag as well. That means when looking at the longer period, the planet will not start warming again until 2050.
I believe the general upward trend from 1900-1970 was largely due to improved sample size and better measuring and recording equipment. If true, that simply means that by 2050 temperatures will be back to where we were in 1950. The [apparent] 90-100 year weather cycle is called a Gleissberg cycle.
HenryP says:
June 26, 2014 at 5:46 am
Well, maybe. All I’m sure of is it isn’t being driven by anthropogenic release of latent CO2, and there is no indication of anything catastrophic waiting in the wings. I’m a lot more worried about real threats to humanity, like antibiotic resistant microbes, or nuclear proliferation, or asteroid strikes. It strikes me that CO2-phobia (carbdiphobia might be a good neologism) may be a coping mechanism, a way of transferring the terror we ought to feel about actual threats to something we know, in the backs of our minds, isn’t really a threat at all.
In any case, I think we have too little data, and too little investigation of it while unserious scientists pursue the monomania known as AGW, to say for sure what is going to happen in the future. Given that lack, I think the most likely event will be for established patterns to continue into at least the near term, hence my projection.
@bart
yes, looking back the climate scientists are to blame for a lot of the false alarm causing a lot of loss of money. It is such a great pity. The CO2 nonsense is incomprehensible in view of the facts. If you are interested you can read some of my musings here:
http://blogs.24.com/henryp/2011/08/11/the-greenhouse-effect-and-the-principle-of-re-radiation-11-aug-2011/
As to the CFC’s red herring, I was actually caught up with it, working [in industry] to try and get rid of them. In hindsight, I find it was also nonsense.
After my investigations’ results, I figured that there must be a small window at the top of the atmosphere (TOA) that gets opened and closed a bit, every so often. Chemists know that a lot of incoming radiation is deflected to space by the ozone and the peroxides and nitrogenous oxides lying at the TOA. [Trenberth knew this, but he only evaluated ozone, he never checked the other chemicals]. These chemicals are manufactured from the extreme UV coming from the sun. Luckily we do have measurements on ozone, from stations in both hemispheres. I looked at these results. Incredibly, I found that ozone started going down around 1951 and started going up again in 1995, both on the NH and the SH. Percentage wise the increase in ozone in the SH since 1995 is much more spectacular.
I had now already found three exact confirmations for the dates of the turning points of my A-C wave for energy-in. The mechanism? We know that there is not much variation in the total solar irradiation (TSI) measured at the TOA. However, there is some variation within TSI, mainly to do with the UV (C). It appears (to me) that as the solar polar fields are weakening, more energetic particles are able to escape from the sun to form more ozone, peroxides and nitrogenous oxides at the TOA.
http://ice-period.com/wp-content/uploads/2013/03/sun2013.png
In turn, these substances deflect more sunlight to space when there is more of it. So, ironically, when the sun is brighter, earth will get cooler. This is a defense system that earth has in place to protect us from harmful UV (C). The atmosphere protects us from harmful radiation coming from the sun.
Most likely there is some gravitational- and/or electromagnetic force that gets switched every 44 year, affecting the sun’s output. How? You tell me.
Phil. says:
June 25, 2014 at 9:30 pm
[snip]
Mods: Why?
richardscourtney says:
June 26, 2014 at 2:11 am
Troll posting as Phil.:
Thankyou for attempting to answer my request at June 25, 2014 at 2:10 pm for you to explain what you thought I had misunderstood in your post at June 25, 2014 at 12:28 pm.
Your attempt is at June 25, 2014 at 9:30 pm
No it isn’t, it’s been erased!