Even on business as usual, there will be <1° Kelvin warming this century
By Christopher Monckton of Brenchley
Curiouser and curiouser. As one delves into the leaden, multi-thousand-page text of the IPCC’s 2013 Fifth Assessment Report, which reads like a conversation between modelers about the merits of their models rather than a serious climate assessment, it is evident that they have lost the thread of the calculation. There are some revealing inconsistencies. Let us expose a few of them.
The IPCC has slashed its central near-term prediction of global warming from 0.28 K/decade in 1990 via 0.23 K/decade in the first draft of IPCC (2013) to 0.17 K/decade in the published draft. Therefore, the biggest surprise to honest climate researchers reading the report is why the long-term or equilibrium climate sensitivity has not been slashed as well.
In 1990, the IPCC said equilibrium climate sensitivity would be 3 [1.5, 4.5] K. In 2007, its estimates were 3.3 [2.0, 4.5] K. In 2013 it reverted to the 1990 interval [1.5, 4.5] K per CO2 doubling. However, in a curt, one-line footnote, it abandoned any attempt to provide a central estimate of climate sensitivity – the key quantity in the entire debate about the climate. The footnote says models cannot agree.
Frankly, I was suspicious about what that footnote might be hiding. So, since my feet are not yet fit to walk on, I have spent a quiet weekend doing some research. The results were spectacular.
Climate sensitivity is the product of three quantities:
Ø The CO2 radiative forcing, generally thought to be in the region of 5.35 times the logarithm of the proportionate concentration change – thus, 3.71 Watts per square meter;
Ø The Planck or instantaneous or zero-feedback sensitivity parameter, which is usually taken as 0.31 Kelvin per Watt per square meter; and
Ø The system gain or overall feedback multiplier, which allows for the effect of temperature feedbacks. The system gain is 1 where there are no feedbacks or they sum to zero.
In the 2007 Fourth Assessment Report, the implicit system gain was 2.81. The direct warming from a CO2 doubling is 3.71 times 0.31, or rather less than 1.2 K. Multiply this zero-feedback warming by the system gain and the harmless 1.2 K direct CO2-driven warming becomes a more thrilling (but still probably harmless) 3.3 K.
That was then. However, on rootling through chapter 9, which is yet another meaningless expatiation on how well the useless models are working, there lies buried an interesting graph that quietly revises the feedback sum sharply downward.
In 2007, the feedback sum implicit in the IPCC’s central estimate of climate sensitivity was 2.06 Watts per square meter per Kelvin, close enough to the implicit sum f = 1.91 W m–2 K–1 (water vapor +1.8, lapse rate –0.84, surface albedo +0.26, cloud +0.69) given in Soden & Held (2006), and shown as a blue dot in the “TOTAL” column in the IPCC’s 2013 feedback graph (fig. 1):

Figure 1. Estimates of the principal positive (above the line) and negative (below it) temperature feedbacks. The total feedback sum, which excludes the Planck “feedback”, has been cut from 2 to 1.5 Watts per square meter per Kelvin since 2007.
Note in passing that the IPCC wrongly characterizes the Planck or zero-feedback climate-sensitivity parameter as itself being a feedback, when it is in truth part of the reference-frame within which the climate lives and moves and has its being. It is thus better and more clearly expressed as 0.31 Kelvin of warming per Watt per square meter of direct forcing than as a negative “feedback” of –3.2 Watts per square meter per Kelvin.
At least the IPCC has had the sense not to attempt to add the Planck “feedback” to the real feedbacks in the graph, which shows the 2013 central estimate of each feedback in red flanked by multi-colored outliers and, alongside it, the 2007 central estimate shown in blue.
Look at the TOTAL column on the right. The IPCC’s old feedback sum was 1.91 Watts per square meter per Kelvin (in practice, the value used in the CMIP3 model ensemble was 2.06). In 2013, however, the value of the feedback sum fell to 1.5 Watts per square meter per Kelvin.
That fall in value has a disproportionately large effect on final climate sensitivity. For the equation by which individual feedbacks are mutually amplified to give the system gain G is as follows:
![]()
![]() (1)
(1)
where g, the closed-loop gain, is the product of the Planck sensitivity parameter λ0 = 0.31 Kelvin per Watt per square meter and the feedback sum f = 1.5 Watts per square meter per Kelvin. The unitless overall system gain G was thus 2.81 in 2007 but is just 1.88 now.
And just look what effect that reduction in the temperature feedbacks has on final climate sensitivity. With f = 2.06 and consequently G = 2.81, as in 2007, equilibrium sensitivity after all feedbacks have acted was then thought to be 3.26 K. Now, however, it is just 2.2 K. As reality begins to dawn even in the halls of Marxist academe, the reduction of one-quarter in the feedback sum has dropped equilibrium climate sensitivity by fully one-third.
Now we can discern why that curious footnote dismissed the notion of determining a central estimate of climate sensitivity. For the new central estimate, if they had dared to admit it, would have been just 2.2 K per CO2 doubling. No ifs, no buts. All the other values that are used to determine climate sensitivity remain unaltered, so there is no wriggle-room for the usual suspects.
One should point out in passing that equation (1), the Bode equation, is of general application to dynamical systems in which, if there is no physical constraint on the loop gain exceeding unity, the system response will become one of attenuation or reversal rather than amplification at loop-gain values g > 1. The climate, however, is obviously not that kind of dynamical system. The loop gain can exceed unity, but there is no physical reality corresponding to the requirement in the equation that feedbacks that had been amplifying the system response would suddenly diminish it as soon as the loop gain exceeded 1. The Bode equation, then, is the wrong equation. For this and other reasons, temperature feedbacks in the climate system are very likely to sum to net-zero.
The cut the IPCC has now made in the feedback sum is attributable chiefly to Roy Spencer’s dazzling paper of 2011 showing the cloud feedback to be negative, not strongly positive as the IPCC had previously imagined.
But, as they say on the shopping channels, “There’s More!!!” The IPCC, to try to keep the funds flowing, has invented what it calls “Representative Concentration Pathway 8.5” as its business-as-usual case.
On that pathway (one is not allowed to call it a “scenario”, apparently), the prediction is that CO2 concentration will rise from 400 to 936 ppmv; that including projected increases in CH4 and N2O concentration one can make that 1313 ppmv CO2 equivalent; and that the resultant anthropogenic forcing of 7.3 Watts per square meter, combined with an implicit transient climate-sensitivity parameter of 0.5 Kelvin per Watt per square meter, will warm the world 3.7 K by 2100 (at a mean rate equivalent to 0.44 K per decade, or more than twice as fast on average as the maximum supra-decadal rate of 0.2 K/decade in the instrumental record to date) and a swingeing 8 K by 2300 (fig. 2). Can They not see the howling implausibility of these absurdly fanciful predictions?
Let us examine the IPCC’s “funding-as-usual” case in a little more detail.

Figure 2. Projected global warming to 2300 on four “pathways”. The business-as-usual “pathway” is shown in red. Source: IPCC (2013), fig. 12.5.
First, the CO2 forcing. From 400 ppmv today to 936 ppmv in 2100 is frankly implausible even if the world, as it should, abandons all CO2 targets altogether. There has been very little growth in the annual rate of CO2 increase: it is little more than 2 ppmv a year at present. Even if we supposed this would rise linearly to 4 ppmv a year by 2100, there would be only 655 ppmv CO2 in the air by then. So let us generously call it 700 ppmv. That gives us our CO2 radiative forcing by the IPCC’s own method: it is 5.35 ln(700/400) = 3 Watts per square meter.
We also need to allow for the non-CO2 greenhouse gases. For a decade, the IPCC has been trying to pretend that CO2 accounts for as small a fraction of total anthropogenic warming as 70%. However, it admits in its 2013 report that the true current fraction is 83%. One reason for this large discrepancy is that once Gazputin had repaired the methane pipeline from Siberia to Europe the rate of increase in methane concentration slowed dramatically in around the year 2000 (fig. 3). So we shall use 83%, rather than 70%, as the CO2 fraction.

Figure 3. Observed methane concentration (black) compared with projections from the first four IPCC Assessment Reports. This graph, which appeared in the pre-final draft, was removed from the final draft lest it give ammunition to skeptics (as Germany and Hungary put it). Its removal, of course, gave ammunition to skeptics.
Now we can put together a business-as-usual warming case that is a realistic reflection of the IPCC’s own methods and data but without the naughty bits. The business-as-usual warming to be expected by 2100 is as follows:
3.0 Watts per square meter CO2 forcing
x 6/5 (the reciprocal of 83%) to allow for non-CO2 anthropogenic forcings
x 0.31 Kelvin per Watt per square meter for the Planck parameter
x 1.88 for the system gain on the basis of the new, lower feedback sum.
The answer is not 8 K. It is just 2.1 K. That is all.
Even this is too high to be realistic. Here is my best estimate. There will be 600 ppmv CO2 in the air by 2100, giving a CO2 forcing of 2.2 Watts per square meter. CO2 will represent 90% of all anthropogenic influences. The feedback sum will be zero. So:
2.2 Watts per square meter CO2 forcing from now to 2100
x 10/9 to allow for non-CO2 anthropogenic forcings
x 0.31 for the Planck sensitivity parameter
x 1 for the system gain.
That gives my best estimate of expected anthropogenic global warming from now to 2100: three-quarters of a Celsius degree. The end of the world may be at hand, but if it is it won’t have anything much to do with our paltry influence on the climate.
Your mission, gentle reader, should you choose to accept it, is to let me know in comments your own best estimate of global warming by 2100 compared with the present. The Lord Monckton Foundation will archive your predictions. Our descendants 85 years hence will be able to amuse themselves comparing them with what happened in the real world.
Comparing the rate of temperature increase in the early 20th century with the rate of the late 20th century, one finds little difference. But there was a large difference in man’s CO2 emissions.
Therefore I predict zero degrees of warming from man’s CO2.
As to the final temperature, I predict cooling per solar conditions. The amount of cooling being unknown, since it is dependent on what the sun does.
I’ve got a really good feeling that it’s going to be way cooler by 2100.
Doesn’t really matter though – I won’t be around (but nor will any of the shysters either)
Or, maybe it will be a bit warmer – oh well – I’m sure there are going to be a whole lot of other scares around by then 🙂
Cheers,
Ignoring the sun, you did say AGW effect by 2100.
Water vapour and associated cloud changes give negative feedback, as in the tropics (which is why they don’t get hotter than the deserts).
Best estimate about ?0.3-0.6? (0.4 best guess) C by 2100 from AGW alone, but offset by what the sun ends up doing. I’d the sun goes quiet it might even be cooler than now.
ppmv. IPCC clearly states their ppm is molar. Then there is GtC, carbon, CtCO2, (3.67 times C), GtCO2eq, (all of the GHGs in equivalent CO2 forcing) and Pt (peta tons, E15 or Gt Giga tons, E9). How ’bout tossing all this confusing unit & constituent nonsense overboard. CO2 is the only real topic so CO2 is the only constituent of Forget ppm, use GTonnes for atmosphere, CO2 amount, anthropogenic production, CO2 added, subtracted, etc.
Keep in mind also how the UK MET office quietly revised their own real forecasts of climate downward at the beginning of 2013:
http://tallbloke.wordpress.com/2013/01/05/major-change-in-uk-met-office-global-warming-forecast/
Despite your skillful skewering of the IPCC they are still being quoted by every believer as gospel. Locally a council is still promoting a .9 metre sea level rise and by doing so preventing land owners from building in areas subject to such a rise. Current data supports a sea level rise of less than 200 mm by 2100. The facts don’t matter to the faithful.
And Anthony; your incompetent President still wants to ban CO2 in power stations. Obviously his advisers are as dumb as their boss.
Since man-made CO2 has nothing at all to do with changes in the climate or else so little as to be undetectable, I can only go by the ups and downs over the last 20,000 years and guess that the climate will continue to be about the same as now. I predict perhaps 1 degree cooler than 2014. However, since the government agencies are fudging the books via “adjustments” to keep their religion going, the climate may be be one degree cooler in reality while at the same time the government data sets may be reporting that the climate is hotter than it has ever been on planet earth.
“All the leaders of groups tend to be frauds. If they were not, it would be impossible for them to retain the allegiance of their dupes…” ~ H. L. Mencken
Addendum: Obviously his advisers are as dumb and duplicitous as their boss.
Lord Monckton falls into the same trap as the IPCC, by completely ignoring The Scientific Method. It is perfectly legitimate to discuss hypothetical numbers, just so long as no-one takes any notice of them, unless and until they have been confirmed by actually measuring them. Since we cannot do controlled experiments on the earth’s atmosphere, it is impractical, currently, to actually measure climate sensitivity, however defined. So none of the numbers manipulated by your Lordship have any meaning in physics. They are all just meaningless guesses. “All sound and fury, signifying nothing” Shakespeare.
When we look at what little measured data we have, we observe that no-one has measured a CO2 signal in any modern temperature /time graph. This gives a strong indication that the actual climate sensitivity for CO2 added to the atmosphere from recent levels is indistinguishable from zero.
The temperature forecasting record of the IPCC
I’m not sure if there is anything new in this post. I compare the temperature forecasts from the FAR, TAR, AR4 and AR5 with the HadCRUT4 temperature record. The best and most honest IPCC forecast is the FAR from 1990 and this shows clearly that the “Low” forecast is that which lies closest to reality. Thereafter, the IPCC approach has been to obfuscate and fudge data to try and create the image of pending climatic melt down.
“…by 2100”
I’m more concerned about the occasional asteroid.
I am not sure if this was taken into consideration but as oceans cool (-PDO, -AMO) their absorption of CO2 will increase further reducing sensitivity.
(A) Based on the lack of any enhanced global warming signal in either the oldest thermometer records as a proxy for the global average nor in the global average itself, I predict a boring continuation of the same trend:
http://s6.postimg.org/uv8srv94h/id_AOo_E.gif
http://s16.postimg.org/54921k0at/image.jpg
The oceans considered as a classic liquid expansion thermometer also show strict defiance of fossil fuel emissions in a way that falsifies claims of a sudden switch to deep ocean heating, so no later anthropogenic heat is being stored for later release after all:
http://postimg.org/image/uszt3eei5/
(B) However, a caveat is necessary since after many such warming spikes found in the main Greenland ice core going back thousands of years, the current spike may collapse at any time in a fundamentally unpredictable manner likely due to the chaotic fluidid dynamic nature of ocean currents and associated thermodynamic release versus uptake of heat:
http://s6.postimg.org/zatdndwq9/image.jpg
(C) Since peer review in contemporary climate “science” is now proven to be fully corrupt, no result can be trusted, not even basic background plots that all studies rely upon such as the global average temperature. The proof appeared in the latest 2013 “super hockey stick” and this peer review corruption alone makes all support of an enhanced instead of moderated greenhouse effect moot:
http://s6.postimg.org/jb6qe15rl/Marcott_2013_Eye_Candy.jpg
This year another paper appeared to support Spencer’s negative feedback measurement:
“Tiny warming of residual anthropogenic CO2” which measured warming and actual greenhouse radiative changes with satellites to estimate a 2100 additional warming of 0.1 °C.
http://www.worldscientific.com/doi/abs/10.1142/S0217979214500957
According to real scientists such as geophysicists, the Earth is cooling, albeit slowly. If we are talking about the so called surface temperatures, it will still be impossible to arrive at any useful figure.
My estimate of global warming is minus three to three freckles – which is an arbitrary Warmist measure, so that whatever happens, I will be proven to be correct. Do not make the mistake of confusing the climatological freckle with ordinary or common freckle, or the climatological surface with the actual surface.
Live well and prosper,
Mike Flynn.
Over here I always feel cooler when a cloud passes in front of the sun. Perhaps it’s different elsewhere. How are clouds supposed to cause warming? Does the night effect of clouds swamp the daylight effect?
Jim Cripwell says:
“…no-one has measured a CO2 signal in any modern temperature /time graph.”
Not true. You can find it on this site here
http://wattsupwiththat.com/2008/12/17/the-co2-temperature-link/
There is more in a PDF here
http://icecap.us/images/uploads/CO2,Temperaturesandiceages-f.pdf
I draw your attention to Page 4:
How come a CO2 level of 253 ppm in the B-situation does not lead to rise in temperatures? Even from very low levels? When 253 ppm in the A situation manages to raise temperatures very fast even from amuch higher level?
One thing is for sure: “Other factors than CO2 easily overrules any forcing from CO2. Only this way can the B-situations with high CO2 lead to falling temperatures.”
This is essential, because, the whole idea of placing CO2 in a central role for driving temperatures was: “We cannot explain the big changes in temperature with anything else than CO2”.
But simple fact is: “No matter what rules temperature, CO2 is easily overruled by other effects, and this CO2-argument falls.”
So we are left with graphs showing that CO2 follows temperatures, and no arguments that CO2 even so could be the main driver of temperatures.
I have no clue what the climate will be in 2100. The calculations based on CO2 should have the rider “ceteris paribus” (all other things being equal). Perhaps by then we will have the sophistication to actually be able to accurately tell what the CO2 contribution is. At this point though, the best we can achieve is little more than a lucky guess because, of course, all other things won’t be equal.
The science is settled, has been for 3 and 1/2 years now, but not by any climate scientist (nor lukewarm sceptic, still clinging to consensus theories, that change a real, stable atmosphere into one balanced on the razor edge of made-up “forcings”):
CO2 Climate Sensitivity Vs. Reality
M, this is Q….
I do it this way,
There has been an all cause warming for the radiative gasses of 10 degrees, from blackbody theoretical of the 33 degrees total. CO2 absorption band is 85 % opaque. So that gives an average warming rate of 10/85 = 0.117 degrees per percent energy absorbed by CO2. Doubling CO2 would retain half the remaining 15 % of energy in the absorption band leading to a warming of 7.5 x 0.117 or 0.81 degrees for the next doubling. I don’t agree that the thickening in the tails of the CO2 stopband will be significant where the mass of the atmosphere is not being added to by CO2, since we are merely replacing O2 by CO2 and H2O, the burning of hydrocarbons in theory subtracts from the mass of the atmosphere, and makes it thinner and colder as some O2 is converted to H2O
My estimate is 0.81 degrees at the absolute outside maximum, with no more than 1.7 degrees before energy saturation (the stop band being opaque) will prevent further warming. CO2 won’t follow the log law at a such large values of energy extraction, it will reach a limit, has to because the atmosphere is NOT being expanded, just substituted.
I predict the CO2 levels to stabilize within several years and drop sometime thereafter, timing dependent upon two major factors : electric car market penetration and nuclear plant construction.
Jim Cripwell asserted: “Since we cannot do controlled experiments on the earth’s atmosphere, it is impractical, currently, to actually measure climate sensitivity, however defined. So none of the numbers manipulated by your Lordship have any meaning in physics.”
But we *have* run a very simple single variable experiment on earth’s atmosphere, and theory works just fine in science so far, which is what science is about above and beyond pure empiricism and rules of thumb. When you release Christopher from his trap, where are you suggesting he escapes to if not the usual Science 101 world of physical theory coupled to measurements on the ground?
About .2-.4C warmer.
The only problem I have with this sort of reasoning is that it presumes a linearization of a highly nonlinear process. It’s a mistake when “warmist” climate scientists do it. It is a mistake when “denier” climate scientists do it. One cannot reduce the climate to block diagrams of linearly projected average energy gain or loss, because climate variation is not linear in the atmospheric concentration of GHGs. If it were, the climate would have been nearly flat before 1950, and even though Michael Mann tried hard to make it so, a sober reconsideration of all of the data has fortunately restored the (more likely to be correct, although with large error bars) previous picture of a climate with large, named climate variations over even the last 3000 years, let alone over geological time. The Earth’s atmospheric chemistry did not change significantly over that stretch, yet the climate did.
To put it bluntly, we do not know the likely trajectory of the “feedbacks”. We do not know (and it is frankly doubtful) that the feedbacks are a linear multiplier of the forcing. We do not know how to assess the effect of random or uncontrollable events — variations in vulcanism, the Gulf Oil disaster, breaks in methane pipelines, forest fires. We cannot even predict the consequences of the gradual conversion from coal to methane based energy and the increasing use of “fracking” to access methane. We do not know what will happen to the climate as solar cycle 24 starts to end its comparatively paltry peak activity over the next six to twelve months and begins a slow decent to solar minimum, although if one examines the neutron count graphs on the WUWT solar activity page, it seems likely that it will be attended by a substantial neutron activity peak, quite likely the highest such peak in the record, and a low TOA insolation, quite likely the lowest mean insolation on the record. We do not know how to deal with highly nonlinear phenomena such as ENSO — we cannot predict ENSO, we are barely starting to understand its effect on the climate, and ENSO is a drop in the ocean of the ill-understood effect of the global ocean on the climate. If Tisdale and (even) mainstream climate scientists like Trenberth are asserting that ENSO is a solar charge/discharge cycle in the visible part of the spectrum (where CO_2 is literally irrelevant), and if all of the major warming events of the latter half of the 20th century (and possible before) are attendant on ENSO, if soot and other albedo-destroying pollution is (as it appears to be) the major factor in Arctic ice melt, simply cleaning up smokestacks without altering CO_2 emissions at all could a) improve quality of life in places like China and India where particulate emissions are currently out of control; b) put a sudden stop to the summer melt problem in the Arctic, which may well owe more to Chinese soot than to carbon dioxide.
I know that block diagrams are fun and easy to build. Energy comes in, some goes through, some goes up, some goes back down, it bounces around like a pinball in a pinball machine before draining to space, and, as is the case with a pinball table, it is a capital mistake to presume that just because you’ve watched one or two balls bounce through in a certain way that this means all future balls will do the same thing, or that if you get two balls in play at the same time you will get twice as many points. Pinball, and the climate, are chaotic dynamical systems. They just don’t work like that. Not even nonlinear climate models work to predict the climate. So why should we expect linearized block diagram flow diagrams to do better?
By 2100 it could be warmer than it is at the present. It could be colder. That’s the thing about the future — full of possibilities, it is. And we simply do not understand the climate system well enough to assert more than a “blue-sky” prediction of that future — literally.
To put it bluntly, does anybody here think that they can solve two coupled sets of Navier-Stokes equations on a spinning, tipped, globe in an eccentric orbit around a variable star against a background of varying atmospheric chemistry and unpredictable volcanic events in their heads?
I didn’t think so.
We can’t do this at the currently attainable scale with anything vaguely approaching predictive accuracy using the world’s largest computer clusters, and probably will not be able to do so. Possibly ever. If one has to go down to the Kolmogorov scale to get predictive results, never — even Moore’s Law won’t do it, not with the practical limitations of physics. If one has to go down to (say) a horizontal kilometer scale, we might make it by 2050, might not, and there is still the problem of what to do about volcanoes and other random perturbations. And in the meantime, there is still considerable doubt about the physics that goes into those models, especially given that it is input as a kind of “mean field approximation” coarse-grain averaged over their 100+ kilometer square cells.
rgb
Jim Cripwell says:
June 9, 2014 at 4:02 am
Lord Monckton falls into the same trap as the IPCC,
I believe you could add that he deliberately falls into this trap. That is, assuming IPCC’s methods and its empirical results, one gets a very modest number for sensitivity. The method is hypothetical, and Monckton doesn’t have to endorse IPCC’s science to point out this conclusion.
Here is my prediction: By 2100 the temperature will be the same in the tropics, perfectly controlled by thunderstorms, clouds and hurricanes.
The desert parts in 10-40 region will be warmer, about 0.8K.
The temperate regions will be 2.0K warmer in the winter, the same in the summer.
The polar regions will be 6K warmer in the winter (more snow) and .2K colder in the summer (it takes a lot of heat to melt all that snow).
Overall effect: A more pleasant globe, about 0.3K warmer overall, concentrated in areas that wants it (Minnesotans for global warming) with weaker winter storms and fewer hurricanes.
In addition it can feed another 2 billion people, not to mention more plants and animals thanks to the increase in CO2.
On the other hand, if totalitarian governments get their way, we can change the climate as successfully as was done to the Lake Aral region.
My estimate was given back in 2010 in a thread on this site:
http://wattsupwiththat.com/2010/10/25/sensitivity-training-determining-the-correct-climate-sensitivity/#comment-516753
My result was 0.121 ºC/(W/m^2) which on the basis of a CO2 doubling is
0.121 * 3.7 = 0.45 ºC
This is a “no feedbacks” estimate. As Lord Moncton intimates, feedbacks from an atmosphere constrained by the laws of thermodynamics would necessarily be negative.
Google is 100% committed to AGW https://www.google.com.au/search?hl=en&gl=au&tbm=nws&authuser=0&q=global+warming&oq=global+warming&gs_l=news-cc.3..43j43i53.6564.9920.0.10381.14.3.0.11.11.0.440.798.0j1j1j0j1.3.0…0.0…1ac.1.VOgF2Q_jxo8
There are NO skeptic stories anymore! LOL
I’m betting on +1°C assuming we don’t get another Maunder Minimum. Should we get into another multidecadal period without sunspots, the resulting temperature will be lower. I sympathise with Willis’ strong skepticism regarding the effect of sunspots on temperature, but the LIA and MM are there looking at me and I cannot look at their eyes and say, “you both just happened to occur at the same time”…
As a science illiterate, I wonder how a prolonged solar maximum (beyond and above current cycle records) can be in any way accurately predicted. Nature is full of surprises.
In earlier posts on
http://climatesense-norpag.blogspot.com
at 4/02/13 and 1/22/13
I have combined the PDO, Millennial cycle and neutron trends to estimate the timing and extent of the coming cooling in both the Northern Hemisphere and Globally.
Here are the conclusions of those posts.
1/22/13 (NH)
1) The millennial peak is sharp – perhaps 18 years +/-. We have now had 16 years since 1997 with no net warming – and so might expect a sharp drop in a year or two – 2014/16 -with a net cooling by 2035 of about 0.35.Within that time frame however there could well be some exceptional years with NH temperatures +/- 0.25 degrees colder than that.
2) The cooling gradient might be fairly steep down to the Oort minimum equivalent which would occur about 2100. (about 1100 on Fig 5) ( Fig 3 here) with a total cooling in 2100 from the present estimated at about 1.2 +/-
3) From 2100 on through the Wolf and Sporer minima equivalents with intervening highs to the Maunder Minimum equivalent which could occur from about 2600 – 2700 a further net cooling of about 0.7 degrees could occur for a total drop of 1.9 +/- degrees
4)The time frame for the significant cooling in 2014 – 16 is strengthened by recent developments already seen in solar activity. With a time lag of about 12 years between the solar driver proxy and climate we should see the effects of the sharp drop in the Ap Index which took place in 2004/5 in 2016-17.
4/02/13 ( Global)
1 Significant temperature drop at about 2016-17
2 Possible unusual cold snap 2021-22
3 Built in cooling trend until at least 2024
4 Temperature Hadsst3 moving average anomaly 2035 – 0.15
5 Temperature Hadsst3 moving average anomaly 2100 – 0.5
6 General Conclusion – by 2100 all the 20th century temperature rise will have been reversed,
7 By 2650 earth could possibly be back to the depths of the little ice age.
8 The effect of increasing CO2 emissions will be minor but beneficial – they may slightly ameliorate the forecast cooling and help maintain crop yields .
9 Warning !! There are some signs in the Livingston and Penn Solar data that a sudden drop to the Maunder Minimum Little Ice Age temperatures could be imminent – with a much more rapid and economically disruptive cooling than that forecast above which may turn out to be a best case scenario.
How confident should one be in these above predictions? The pattern method doesn’t lend itself easily to statistical measures. However statistical calculations only provide an apparent rigor for the uninitiated and in relation to the IPCC climate models are entirely misleading because they make no allowance for the structural uncertainties in the model set up.This is where scientific judgment comes in – some people are better at pattern recognition and meaningful correlation than others. A past record of successful forecasting such as indicated above is a useful but not infallible measure. In this case I am reasonably sure – say 65/35 for about 20 years ahead. Beyond that certainty drops rapidly. I am sure, however, that it will prove closer to reality than anything put out by the IPCC, Met Office or the NASA group. In any case this is a Bayesian type forecast- in that it can easily be amended on an ongoing basis as the Temperature and Solar data accumulate. If there is not a 0.15 – 0.20. drop in Global SSTs by 2018 -20 I would need to re-evaluate.
I agree with Cripwell above. The earths atmosphere and all its interacting components (plus solar) are not even close to a University laboratory gas experiments and can not be simulated by models or expected Arrhenius etc outcomes: if there is so much C02, we can expect so and so. Complete nonsense in the real world.. For all we know we could be heading for an ice age or boiling temps in 20 years or 10000, or 1000000 years
“Figure 3. Observed methane concentration (black) compared with projections from the first four IPCC Assessment Reports. This graph, which appeared in the pre-final draft, was removed from the final draft lest it give ammunition to skeptics (as Germany and Hungary put it). Its removal, of course, gave ammunition to skeptics.”
haha, the IPCC and supporters in a nutshell.
my guess is that we will cool due to historical evidence that low sunspot activity leads to negative temperature anomalies. 85 years, maybe not, but lets say 0.5k cooler than now. i guess my dart is just as good as the ipcc weighted v2013 is. mann, if they had a dart board on their wall, not a single dart would be in it, they would be all around the same point in the floor below it!
i would also guess that co2 levels will level off with the natural release of co2 from warming being underestimated and the human component being overestimated. reasoning- every indicator/model has been biased strongly towards human influence over the past 20 years or so.
Whatever the temperature will be , I don’t know. However, what I do know is that it will have absolutely nothing to do with CO2 change.I am not foolish enough to be taken in by a coincident slope angle of CO2 increase and temperature increase over 25 years ago.
James Strom is right and Mr Cripwell wrong. In these posts, I often apply the IPCC’s own methodology and data to determine whether its own conclusions are consistent with them. In the present case, as so often, there is no justification for those conclusions. The large warming they predict for this century on their “funding-as-usual” scenario will not occur.
A fortiori, the IPCC’s conclusions cannot be justified if the IPCC makes the mistake – as it does – of assuming that over the 21st century anthropogenic warming will be a merely linear response to the radiative forcing. Professor Brown is quite right to make a point similar to this: but in making that point he criticizes not me but the IPCC itself. I am drawing conclusions from premises with which the IPCC is in no position to disagree, for they are its own premises. If it finds the conclusions contradictory to its own, then it has some explaining to do. This method of argument is known as Socratic elenchus.
Rarely, Professor Brown errs. I fear he may have done so here. For the feedback sum may be attained either by linear or by non-linear processes (see e.g. a remarkably clear and detailed pedagogical paper by Dick Lindzen’s pupil Gerard Roe in 1999). So there is nothing inherent in the IPCC’s treatment of feedbacks that precludes non-linearity in the system response of which the feedbacks are at once an effect and a cause.
Of course, if there are no temperature feedbacks or if they are close to or below zero, the system response to our influence will be near-linear in any event, save where natural phenomena such as volcanoes supervene.
Mr Cripwell says it is impractical to measure climate sensitivity at present. True, but it is imprudent of him to go one to say that “none of the numbers manipulated” by me “have any meaning in physics”. Actually, the CO2 radiative forcing is thought to be in the right ball-park (though I privately suspect it is on the high side); the Planck parameter’s value is directly calculable by reference to a sufficient run of temperature data for the mid-troposphere, and I have thus calculated it, broadly confirming the value used in the models; the feedback-amplification equation, an established result in physics, is as I have stated it; and the reduction in the IPCC’s estimate of the feedback sum is also as I have stated it.
Mr Mearns says he is not sure if there is anything new in this post. What is new about it is that various data buried in the IPCC’s latest report and – as far as I can discover – not yet discussed anywhere show quite clearly that we shall certainly not get much more than 2 K warming this century, and that we shall probably see considerably less than that. The central estimate of climate sensitivity that the IPCC should have published ought to have been 2.2 K, using its own methodology.
Dr Burns asks how clouds cause warming. They do so at night in the winter, by retaining warmth that would otherwise radiate out to space. However, as the IPCC would have admitted from the outset if it had not been hell-bent on achieving a physically-absurd but profitable result, the major effect of clouds is of course to shield the surface from the Sun’s radiation, so that their net effect is of cooling. And that is why the naturally-occurring reduction in global cloud cover from 1983-2001 caused 2.9 Watts per square meter of radiative forcing, compared with just 2.3 Watts per square meter for the entire anthropogenic forcing since 1750.
“Commiebob” is right to say that any climate forecast should carry the rider “all other things being equal”. Natural variability is more than sufficient to explain all changes in global temperature, so it is more than sufficient to prevent any warming effect from CO2 for quite long periods – such as the last two decades of no-warming, which the models failed to predict.
“Q” and I agree that there will perhaps be less than 1 K global warming this century. However, he is not quite right in suggesting there is a point beyond which adding more CO2 to the atmosphere will make no difference. In theory,. All additional CO2 ought to cause some warming.
Mr Mosby thinks electric autos will reduce CO2 emissions. In themselves, they won’t. Most of the electricity has to come from conventional power stations, and electric cars use 30%more energy per mile than ordinary autos because of the weight of the batteries. They are the costliest and least effective method of making global warming go away that I have yet run through my simple climate-mitigation model.
“Aaron” says he thinks the world would be 2-4 K warmer than the present by 2100. On what evidence? The IPCC’s prediction is approximately that; but its 1990 prediction of the near-term warming rate, issued with what it described as “substantial confidence”, has proven to be a twofold exaggeration. On the IPCC’s track record, then, one should divide its projections by 2, giving 1-2 K warming occur this century – which was, broadly speaking, the conclusion of the head posting.
Anthropogenic warming will not rise above the long term natural variation proxies calculated since before the Medieval Warm Period.
“let me know in comments your own best estimate of global warming by 2100 compared with the present.”
Ok, swammy says in 2100 the GAST will be [drum roll] the same as current +/- 0.5 °C.
Chuck L says: “I am not sure if this was taken into consideration but as oceans cool (-PDO, -AMO) their absorption of CO2 will increase further reducing sensitivity.”
The PDO is not an indicator of ocean temperatures (warming or cooling) of the Pacific. The PDO simply represents the spatial pattern of the sea surface temperature anomalies of the extratropical North Pacific. See the post:
http://bobtisdale.wordpress.com/2014/04/20/the-201415-el-nino-part-5-the-relationship-between-the-pdo-and-enso/
Also, the PDO is positive, not negative, and I suspect it will go higher this month:
http://jisao.washington.edu/pdo/PDO.latest
Regards
Countryfile UK (BBC BS) about 9 months back – John Craven suddenly came upon “scientists/researchers” discovering CO2 emissions (circa 330ppm) in a wood somewhere in England. With there instruments they said it came from the surrounding ground…and OMG we don’t know why?
That was the last to be seen of that, no follow up. Delete button – panic!
That looked to be over ground 1mtr squared in a wood. That might suggest a lot more leeching out of the non volatile landmass. I am not sure how that works really, but clearly the land is a source for various reasons. Anybody know of reliable research? Something like this must mask anything AGW…ever?
Chuck L, PS: The sea surface temperatures of the North Pacific also took a mighty upward swing in May: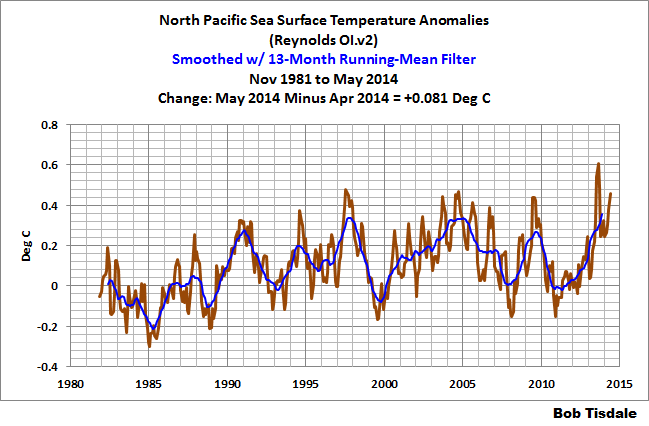

Which impacted the Pacific as a whole:
Those graphs are from the sea surface temperature update posted this morning:
http://bobtisdale.wordpress.com/2014/06/09/may-2014-sea-surface-temperature-sst-anomaly-update/
Cheers
All the climate skeptics should move to one country , take over its government and then ignore all international laws
Ex-expat Colin says:
June 9, 2014 at 7:03 am
9 months ago and 330 ppm? Currently it is around 400 ppm. So I guess the wood was absorbing CO2. As plants usually do when they are growing. Why the surprise?
Ex-expat Colin says:
June 9, 2014 at 7:03 am
I read a study sometime ago about CO2 levels over crop fields. I really can’t remember all the details but I seem to recall that the level of CO2 dropped down to 275 ppm at some time during the day. Plants seem to really ‘suck’ the co2 out of the atmosphere when they want to
Bob, correct me if I am wrong. I am going to attempt a PDO description that is rather plain.
The North Pacific Ocean temperature (if one can actually measure it apart from the rest of the Pacific Ocean), can remain the same temperature (no overall warming or cooling), or not, but the spatial pattern titled the PDO (where large pools of water set up) of the main warm and cool pool will switch places back and forth from time to time. The PDO is not therefore, a temperature measurement.
During a positive phase, the west Pacific (up by Northeast Asia countries) is the location of the cool pool and part of the eastern ocean (by Western US and Canadian territory) is the location of the warm pool; during a negative phase, the opposite pattern sets up. It shifts phases on at least inter-decadal time scales but with such a short historical data string combined with longer term tree ring proxies, I have a difficult time believing or not how long each phase lasts.
What makes us along the West coast feel colder when the PDO is negative is when that cool pool is along our coast and the warm pool is clear across the Pacific.
si on se réfère aux données historiques à notre portée, on peut raisonnablement espérer 2/3 ° de réchauffement comme à l’époque romaine.
Je me vois bien en toge, taquinant quelques jeunes esclaves….
Par contre cela pourrait tout aussi bien être -2°, auquel cas, je prépare déjà mon bateau pour m’échouer sur une côte tropicale.
le CO2?
c’est quoi tous vos calculs à la noix?
Spencer posait une bonne question: les IR peuvent-ils chauffer l’océan?
Ils ne savent même pas comment cela se passe sur les 4/5 du globe?
farceurs va
joletaxi says:
June 9, 2014 at 7:34 am
I would like to see myself in the same position. Who cares what the temperature is and the causes
How much warming by 2100? Some of the assumptions that must be made to come up with a prediction are little more than guesses. For example, sometime in the next 85 years, mankind might be getting the vast majority of our energy from nuclear fusion reactors, “clean” nuclear fission or some other way not yet guessed. I tend to believe that a new energy source will be developed and therefore I don’t think the CO2 growth rate Lord Monckton estimated will be hit (much less the estimate of the IPCC). I think CO2 levels could be between 500 and 600 ppm. I’ll guess 550. The forcing based on the calculation give by Lord Monckton would be reduced from 0.75 degree C to slightly less than 0.7 degree C. I think we are coming to a period when the world will have some natural cooling that will end in 30 or 40 years (another assumption) followed by warming. The net effect – by 2100, perhaps 0.3 degree C increase in temperature from the current temperature.
“Tanya Aardman says: June 9, 2014 at 7:08 am All the climate skeptics should move to one country , take over its government and then ignore all international laws”
Think about Ban Ki-moon, who must reside in a country toying with UN Kyoto agreement. Even North Korea has ratified it. And not only, the satellite images show an earth hour 24/7/365 over there as a bonus. How about sending Ban Ki-moon there instead? It should feel more like home to a devoted alarmist, keen on a myriad of precautionary measures. US approach could then become the new international standard.
Much as I generally love xkcd, this just in:
IPCC Claim’s 4.5 C by 2100
The tragic thing about this is that it is arrant nonsense.
Not even the IPCC, in their wildest drug-induced nightmares, is still calling for 4.5C of warming by 2100 when the planet is in neutral and has been for the entire 21st century, when the only statistically significant warming of the last 75 years occurred in a single fifteen year stretch from the 1982/1983 ENSO to the 1997/1998 ENSO. Note that means that statistically significant warming has occurred in a single span of time consisting of roughly 1/5 of the entire “post-industrial CO_2” record, the period over which it went from 300 ppm to 400 ppm in round numbers, It is isolated on the left by mostly flat, a bit of warming and a bit of cooling, from 1940 to 1983 (with some violent bobbles around the ENSO event a few years to either side) and from 1998 to the present on the right (with some violent bobbles around the ENSO event a few years to either side). AR5 actually contains a box that tries to explain the latter — too bad that they didn’t think to try to explain the former, or why its models completely erase (on average) the other major temperature variations in the 20th century, especially from 1900 to 1940.
But will he author of XKCD publish a retraction when it is pointed out, repeatedly (as is now happening on the blog devoted to today’s comic) that the actual warming expected by the IPCC is currently around 2 C and falling as the “hiatus” continues and the central estimate of climate sensitivity continues to diminish? Will he in fact stick with his parenthetical assertion that 2C is “probably no big deal”? Will he acknowledge that even the central 2 C assertion is currently in pretty serious doubt as Trenberth is currently stating that the oceans ate my global warming and can continue to do so for centuries without significantly (or possibly even measurably) affecting the temperature of the oceans?
The only person who is still smoking this crack is James Hansen, who finally became enough of an embarrassment that he was quietly ushered out from the bully pulpit where he had spent decades asserting personal opinion as fact (and filling in a central, basically free, square on my logical fallacy bingo sheet in the process) — 5+ C warming, 5 meter sea level rise (stated in an equally public forum, with equally nonexistent objective or even theoretical support).
What will it take to call somebody on something like this, stated in a public forum? One single, maximally extreme scenario, one in which human CO_2 actually plays the MINOR role, has been modelled to produce this much warming as a median result, and and not even the IPCC assigns it any “confidence” — not that their assertions of confidence have the slightest weight from any actual theory of statistical analysis, as the statistical average of a large stack of non-independent models that are unchecked against the phenomena they are trying to predict (and that largely fail such a check if it is performed) is a completely meaningless quantity.
I clearly missed my Nobel Prize in physics. I should have just written 36 distinct numerical solutions to the Hartree approximation of the many electron atom (well, really only seven distinct solutions, but then I could have taken the seven and changed a few lines of code around to keep them “the same” but maybe compute the answer to higher precision to flesh it out to 36 because 7 is too few to convince anybody of statistical significance). Then I could have averaged their result and asserted that because it was computed by 36 physics based models it must be a truly excellent predictor of the actual correlated, antisymmetric quantum electronic structure that the Hartree models, sadly, completely omit. And if 36 wasn’t enough, I could have added even more! I could have boosted that ol’ confidence factor WAY up. I could have computed that (wrong) answer to FIVE significant digits with enough “independent” computations.
I just don’t get it. No physicist would stand still for this in quantum theory because the assertion is absurd. No physicist would stand still for it in (e.g.) designing nuclear explosives or computational fluid dynamics being used to engineer supersonic jets where a company would go broke if you got the wrong answer — just ask a bunch of people (in only a handful of groups, getting six or seven models per group) to write CFD or nuclear hydrodynamic models and average whatever they come up with as if it is bound to be correct if enough models contribute. No computer scientist or mathematician studying the general problem of turbulence would stand still for it when implementing a solution to a nonlinear, chaotic problem being solved at an integration scale known to be five or six orders of magnitude too large.
Only in climate science can somebody who writes comics cherry pick what is literally the worst case scenario in all of AR5, present it as if it is “the” central estimate in which they are willing to claim some ill-founded confidence, state in parentheses that their actual central estimate is likely not to be catastrophic, and present it to create purely political alarm that happens to coincide with a presidential assertion of impending doom and measures that will cost us a few hundred billion dollars, our prosperity, and tens to hundreds of millions of lives in the poorest countries in the world to implement and which still will make no measurable difference in the warming projected by the models by 2100.
The only thing that might make a difference is building mountains of nuclear power plants (or discovering new physics and/or technology, but one cannot predict either one). Even Hansen, who in his younger days would join nuclear plant picket lines, has come to acknowledge this. Where is the call from the president to build nuclear power plants to replace the coal plants on an urgent international basis?
rgb
“Predicting is hard, especially about the future.” Yogi Berra.
“funding-as-usual” Hahahahahahahaha! Totally nails it! 😀
Lord Monkton, my comment about not being sure about anything new was directed at my own post on IPPC forecasting record 😉 My own view is that the upper bound for climate sensitivity is in the region 1.5˚K (since we now use the absolute scale) and the research focus of the last 20 years should have been on determining how much of late 20th century warming was natural instead of pretending that none of it was.
“The only problem I have with this sort of reasoning is that it presumes a linearization of a highly nonlinear process. It’s a mistake when “warmist” climate scientists do it. It is a mistake when “denier” climate scientists do it. One cannot reduce the climate to block diagrams of linearly projected average energy gain or loss, because climate variation is not linear in the atmospheric concentration of GHGs. ”
Of course one CAN.
one can reduce the climate to block diagrams. just do it.
this comment reminds me of the engineers who would argue with me that one could not reduce
future wars to block diagrams of linearly projected average troup gains and losses.
The response was simple. Of COURSE one CAN. look at the white board. I just Did it.
The question is.. HOW USEFUL is that reduction of the system? and is there a better reduction?
Now in projecting futures wars, future battles, we have precious little historical data to work on.
And the physics are mostly by analogy. Here is an simple example
http://en.wikipedia.org/wiki/Lanchester's_laws
In any case when faced with an intractalbe problem we have these choices
A) through up your hands and say.. its too hard
B) Make assumptions and draw conclusions based on the information you have.
Any way, when the policy deciders ( say in country X ) would come to my teame (circa 1985)and ask
What forces do we need to defend our country in 2000?
That discussion would start with a list of assumptions.
1. I assume China will still be the threat. I have no lab experiments that confirm this
2. I assume that China will continue to improve its technology. Here is the technology
growth curve I use. It assumes they advance at the same rate as the US.
3. I assume they build a new plane. Here is the performance of that plane. Its not
built yet. It will look something like this.
4. I assume they will build this many planes and base them here here and over here.
5. I assume the US will still be your ally. I assume our forces will be here, here and here
and I assume we will already be engaged in a war with russia. This means we will
not be able to respond for the following number of days.
Lots of assumptions. Lots of things you cant do.
The problem is then reduced to How long can you last before we show up under the given scenario?
Then comes the question of how I figure out how long they can last.
Here are the approaches i used
A) “rules of thumb” Here are some rules of thumb..
B) simple modeling. We reduce the problem to some block diagrams,
C) complex war gaming. We ran some war gaming excercises. this is what we found.
D) warfare simulation. We simulated both sides. We looked at optimal strategies
E) technology improvements. We made a bunch of guesses about technology. here
are our guesses.
Of course during the course of these discussions somebody would always say
“You cant do that!” You cant assume that. you cant prove that!
Well, of course one can do all the things we did. we just did them.
of course one can assume the things we assumed. we just assumed them.
And of course we could prove it. All proof depends upon assumption.
These guys were silenced by the following question: Ok, you tell me the right assumptions,
you tell me the better methods, you do the work,
Planning for future wars against the soviets took the same course of action.
Assumption upon assumption and models all the way down. Simple, complex,
rules of thumb.
The question was what’s the best course of action. Saying “I dont know” is not an option.
Saying “Im the critic” didnt work.
Saying “the chinese might not be a threat” is not an option.
Saying “the soviets will disintigrate was never a consideration” The job was to work from what
we knew, using the tools at hand, making the assumptions we needed to make, to provide the
Best informed Opinion we could.
Climate science is not too different. Its different in degree, not in kind.
is that science “good enough” to decide policy? Good question. Here is the deal.
If you dont have a better approach. If all you do is criticize, in the end you will lose the
debate. Obama has a pen and a phone. you dont.
The point I was making is that the decomposition that they are attempting to make is impossible to extract from the nonlinear models they are solving. It’s the same separability problem that keeps them from being able to make any claim for the natural vs anthropogenic fractions of their results, or from the correct way to balance aerosol or CO_2-linked contributions, or from being able to prove (or even provide positive evidence) that they are treating clouds and water vapor correctly.
One day I’ll have to post a graph or two of actual chaotic processes so that people can understand the problem. A teensy change in anything in a numerical solution can kick the system from a trajectory around one attractor to a completely distinct trajectory around a completely distinct attractor, with completely distinct “average” properties and completely distinct feedbacks. In a problem with a few well separated attractors, one cannot even compute an “average feedback” that has any meaning whatsover — each fixed point has distinct local dynamics. And this is still for simple problems, problems that do indeed have only a few stable attractors, toy problems.
In the case of climate, it is like saying that the dynamical feedbacks that are important during a glacial era are the same as those that are important during an interglacial, or (since climate probably has a fractal decomposition/distribution of these attractors, in an absurdly high dimensional space) that the feedback of the LIA are the same as those of the Dalton minimum are the same as those of the first half of the 20th century are the same as those of the stretch from 1983 to 1998 are the same as those today. The phrase “the same as” has no meaning whatsoever in this sort of context — they aren’t the same as, period, and we don’t even know how to break them down and compare them in terms of the grossest of features because for nearly all of that record we have no useful measurements. Our proxy-derived knowledge of the LIA is next to useless in the present — we literally have no idea why it occurred, and so we cannot assign any reasonable probability to it recurring in the next decade or over the next century. We don’t know why it warmed rapidly (comparatively speaking) from 1983 to 1998. We don’t know why it stopped warming from (somewhere in there) to the present. That’s the entire point of Box 9.2 of AR5. We don’t know. They openly acknowledge not knowing, although they don’t openly acknowledge that the correct explanation is as likely not to be in their list of possibilities as as on it, since there is no data to support ANY known possibility and NO GCM predicts a lack of warming (while paradoxially, ALL GCMs predict a lack of warming — if you tweak the butterfly’s wings a bit).
So all I was trying to do is point out that you (following the IPCC in the SPM, but not necessarily everywhere in AR5) are doing the moral equivalent of trying to claim that Schrodinger’s Cat is 50% dead after a certain amount of time in the box. No, it’s not. It’s either 100% dead or 100% alive — we just don’t know which not because the cat is or isn’t dead, but because we cannot measure the subtle changes in the Universe’s state that correspond to the instant the cat dies — or doesn’t — outside of the box, which is not adiabatically disconnected from the rest of the Universe. If you reason on this basis, you (and the IPCC) are all too likely to utter absurdities.
That’s again the rub. If the IPCC openly presented the full set of Perturbed Parameter Ensemble results from each model contributing to CMIP5 (as they did, for a few models, in the earlier draft and which might still be tucked away in the final draft — I haven’t looked) people would be shocked to see that with exactly the same initial conditions, well within our uncertainty even models that predict a fair bit of warming on average, predict actual extended cooling for a rather large fraction of runs.
The PPE average is not what the model is predicting. What it is doing is predicting the probability distribution of possible futures, but only one of these futures will be realized, just as the cat is either alive or dead, not an average of the two. Or more likely still, none of these futures, because the models are absurdly oversimplified and don’t even get the coarse grain averaged physics right for the hydrodynamics problem for the short term, let alone the medium term. The models don’t even generate solutions that satisfy e.g. mass conservation laws — they have to constantly be projected back to restore it. And what will you bet that the distribution of outcomes depends on how and when the projection is done, in a chaotic nonlinear PDE solution?
You will very likely never see the model results presented in this way, in part because one could then see how often they produce results that are as cool as the Earth has actually been, how accurately their pattern of fluctuations (which is directly sensitive to the feedbacks we are discussing via the Fluctuation-Dissipation Theorem) corresponds to the observed pattern of global temperature fluctuations on similar time scales, and so on. And if we saw that, we would simply conclude, one at a time, that the models were failing, for nearly all of the models contributing to the meaningless average.
rgb
I humbly stand corrected. Pointlessly corrected, but corrected.
Or perhaps not so pointlessly. Utility depends on purpose. If your purpose is to predict the future, this reduction is pointless because (as I just pointed out) the cat isn’t half dead, it is all dead or all alive, half the time, and only one future is actually realized and the only way to see if your theory is correct is to compare its predictions to reality. Ay, mate, that’s indeed the rub.
If your purpose is to generate maximum alarm and divert the creative energies of an entire civilization to some personally desired end, the reduction is very useful indeed. It was a popular technique back in the 1930’s, for example — create unverifiable generalizations also known as “big lies”, present them as fact, and generate support for what might well otherwise by an untenably immoral position.
If I asked you how ACCURATE the reduction above or presented in AR5’s SPM is, you would — if you were honest — have to respond with “as far as we can tell, not very accurate” in precisely the places the IPCC is asserting “high confidence”, or “medium confidence”. Their assertions of “confidence” are literally indefensible. If you think otherwise, I would cheerfully debate you on this issue — textbooks on statistics at twenty paces, may the best argument win.
rgb
Professor Brown is, of course, right that the climate is unpredictable because it is a complex, non-linear, chaotic object (IPCC, 2001, para. 14.2.2.2; Lorenz, 1963; Lighthill, 1998; Giorgi; 2005). However, the game I play is to use the IPCC’s admittedly dopey methods, and to say to them that if it is by these methods that they determine climate sensitivity it follows that the central estimate of climate sensitivity to which they should adhere is 2.2 K per CO2 doubling.
One can tell them till one is blue in the face that the models are useless because the climate object is chaotic, but they will respond by sneering that they can predict the summer will be warmer than the winter (that dumb response was once given to me by the head of research at the University of East Anglia).
But if instead one says, “Right, you say the CO2 forcing is thus and thus, and the Planck parameter is so and so, and you allow for feedbacks and consequent non-linearities in the system response by saying that at present the feedback sum is this and that. Fair enough: in that event your conclusion should be that this century’s funding-as-usual warming should be more like 2 K than 8 K” – which was the conclusion of the head posting.
In truth, no prediction will be reliable, but I’d be prepared to bet quite a large sum, for the sake of my heirs, that this century’s global warming will indeed be closer to 2 K than to 8 K, even if there be no more nonsense about curbing “carbon emissions”.
Here is the sensitivity estimate taken from the paper:
Schneider S. & Rasool S., “Atmospheric Carbon Dioxide and Aerosols – Effects of Large Increases on Global Climate”, Science, vol.173, 9 July 1971, p.138-141
We report here on the first results of a calculation in which separate estimates were made of the effects on global temperature of large increases in the amount of CO2 and dust in the atmosphere. It is found that even an increase by a factor of 8 in the amount of CO2, which is highly unlikely in the next several thousand years, will produce an increase in the surface temperature of less than 2 deg. K.
Lord Monckton, have you considered taking the services of a personal protection specialist? The way you’re dismantling the AGW scare The Team may be plotting a number on you. Next time you venture out, best check under your car…. 😉
Monckton and RGB You are both saying that the IPCC models are useless for forecasting . Surely it is time to quit talking about models at all and make predictions using another approach For forecasts of the possible coming cooling based on the 60 and 1000 year quasi- periodicities in the temperature data and using the neutron count and 10Be as the most useful proxy for solar activity see
http://climatesense-norpag.blogspot.com/2013/10/commonsense-climate-science-and.html
Monckton of Brenchley asks that WUWT readers submit their best estimate of global warming by 2100 compared with the present.
Eighty-five years from now, his foundation will review those estimates to see who was right and who was wrong about what actually transpired in Global Mean Temperature by the end of the century.
An approach you might find useful in making your estimate would be to use:
Beta Blocker’s CET Pattern Picker:
Here’s how it works:
1: Using the top half of the Beta Blocker form, study the pattern of trends in Central England Temperature (CET) between 1659 and 2007.
2: Using CET trends as proxies for GMT trends, make your best guess as to where you think GMT will go between 2007 and 2100.
3: Linearize your predicted series of rising/falling trend patterns into a single 2007-2100 trend line.
4: Using the bottom half of the Beta Blocker form, summarize the reasoning behind your guess.
5: Add additional pages containing more detailed reasoning and analysis, as little or as much as you see necessary.
6: Give your completed form and your supplementary documentation to your friends for peer review.
7: If your friends like your prediction, submit your analysis to your favorite climate science journal.
8: If your friends don’t like your prediction:
— Challenge them to write their own peer-reviewed climate science paper.
— Hand them a blank copy of the Beta Blocker CET Pattern Picker form.
Just follow these eight easy steps and you too can become a peer reviewed climate scientist right here in the Year 2014!
But, we must ask a question …. Will you be seen by future generations as not being a certified peer-reviewed climate scientist if your prediction turns out to be wrong? (On the other hand, will you be seen by future generations as not being a certified peer-reviewed climate scientist if your prediction turns out to be right?)
No matter, just fill out the form and take the chance. What do you have to lose?
Though I must admit at the outset that I am a natural pessimist, I predict the Earth will cool by 0.99999 degree C (approx.) by 2100. Now that’s a real scary story!
A prediction for 2100 is useless because you can not check it in a reasonable time span. Real science has to be checked as soon as possble. Otherwise you have no progress.
A model by any other name still smells so — sweet — only this isn’t even a model. What is a “quasi”-periodicity, and how can one predict that it will be, um, periodic into the future? Numerology is numerology. At least the GCMs are trying to solve the actual physics problem, even if the problem is probably unsolvable with current (or any reasonably projected future) computational capacity for the human species.
rgb
Pamela Gray says:
June 9, 2014 at 7:30 am
On which side of the Pacific the warm water is concentrated has IMO a large effect on climate. For starters, it helps determine how much Arctic sea ice there will be.
I agree with “rgbatduke”, Jim Cripwell, and harrydhuffman (@harrydhuffman)
Thanks for that…………….
I’ve already predicted the period 2007-36 to be statistically significantly cooler than 1977 to 2006 by small fractions of a degree, based upon the observation that to 1947-76 was cooler than 1917-46, & that 1887 to 1916 was cooler than the following thirty years, while 1857-86 had been warmer.
So IMO odds are that 2037-66 should be warmer than the prior three decade period & 2067-96. If the Modern Warm Period hasn’t peaked yet, then it’s possible that early in the 2097 to 2126 period, ie c. AD 2100, the earth might be a bit warmer than in 1998, the peak of the past warm phase. Add in maybe a fraction of a degree C from more CO2, & I’ll venture a guess of a degree warmer in 2100 than now, although present T has been overadjusted. I hope by 2100 the data will be improved, with less adjustment.
Milo, I agree. The location of the warm and cool pools of water in the North Pacific Ocean not only affect ocean biomes and coastal climate on both sides of the Pacific, the effect extends clear into the Rockies and beyond, forcing land-based and river-based plants and animals to also respond to this multi-decadal spatial swing. The Jet Stream brings weather that does something entirely different depending on where those pools are located. As for Arctic Ice, I would imagine that as well, though don’t know if changes in Arctic Ice come before or after a PDO shift is in place.
rgbatduke says:
June 9, 2014 at 8:39 am
Much as I generally love xkcd, this just in:
IPCC Claim’s 4.5 C by 2100
http://xkcd.com/1379/
____________________________
I think the answer to the question, “how did the IPCC arrive at the estimate of 4.5C per doubling of CO2”, is really quite simple.
I’d speculate that they took a figure at the upper end of estimates of climate sensitivity, 1.5C/doubling of CO2 and added error bars of 100%, moving the upper limit to 3C/2xCO2 and used the new 3C figure as baseline, placing the upper error bar at 4.5C. This not only gave them a scary figure to feed to the gullible, but also gave them a (slight) measure of deniability if climate sensitivity turns out to be at the upper end of actual estimates of 1.5C/doubling.
To also extend my poor attempt at clarifying this PDO issue, I agree with Bob that the PDO is an after-affect of ENSO processes (which it must be, given how it is calculated). However, the PDO shift can then be the source of weather pattern variation shifts brought to land riding on the Jet Stream as it adjusts to the change in pool location.
After 27 days trekking across Greenland’s vast ice sheet, members of the Seven Continents Exploration Club (KE7B) have completed their journey and returned home.
When they arrived at Kuala Lumpur International Airport in Malaysia, friends and family members were waiting to welcome them back.
Team leader Yanizam Mohamad Supiah described the extreme cold, which plummeted to as low as -35C at times, as being among the toughest challenges they had to face. He thanked God that they managed to complete the journey earlier than the 35 days they had expected it to take.
http://www.icenews.is/2014/06/09/greenland-expedition-team-returns-home/
The most repeated point Monckton makes above is that, basically, the entire climate science field and virtually all credible science organizations in the world are ethically corrupted by “funding”. Does that not sound like a convenient way to always dismiss climate science without having to deal with a lot of compelling evidence from over 10,000 active, publishing climate scientists?
Where is the extraordinary evidence to support the extraordinary claim of massive, international scientific corruption? Claimed by a person who has a degree in journalism and, to my knowledge, has never published a scientific paper in a top tier, peer-reviewed scientific journal. Has anyone asked for a list of all of HIS funding sources?
Does anyone question the credibility of such a claim from such a source coupled with such limited evidence? Is such a claim really that likely considering the breadth of such a suggested corruption?
As an engineer who has worked with real scientists, I have found competency to be the most valued characteristic of peers and a deep respect for facts, truth, logic. Corruption on the scale suggested by Monckton would utterly decimate virtually ALL science since the various disciplines rely on cross pollination of research to support and verify everything they do. It would affect disciplines from meteorology to biology to archaeology to chemistry………
Do you guys realize how incredible Monckton’s claim of science corruption is?
Robertvd says:
June 9, 2014 at 11:23 am
http://www.icenews.is/2014/06/09/greenland-expedition-team-returns-home/
_________________________
THANKS!
Random walk.
Sasha says:
June 9, 2014 at 4:31 am
Jim Cripwell says:
“…no-one has measured a CO2 signal in any modern temperature /time graph.”
Key word for you Sasha “measured”
Steve Mosher asserts: “If all you do is criticize, in the end you will lose the debate. Obama has a pen and a phone. you dont.”
…demonstrating the triumphantalism of a classic egomaniacal sociopath who jumps on board a profitable trend without any concern for his own future downfall in disgrace. His use of the very word “debate” is actually a term for a culture war, not what the dictionary defines it as:
“A formal contest of argumentation in which two opposing teams defend and attack a given proposition.”
His background in French philosophy has gotten the better of him, as he deconstructs our lives for us, all the while our “mere criticism“ has over the last few years converted Canada, Australia, much of Britain and fully half of the US political machines over to serious and outspoken climate model skepticism, not to mention Russia and China and the decline and fall of all climate treaties.
Obama’s pen promises to create an even bigger backlash that will likely topple the entire left wing agenda for a generation or two, much more so than a soft landing would have created, for it exposes economy killing activism supported by junk science fraud that has become so obvious to insiders that the division now is merely between thoughtful critics and outright scammers.
His own Berkeley project US data plot shows over 1000% greater recent warming than Jim Hansen’s plot all the while everybody can feel that it’s just not very hot out compared to the Dust Bowl era. But we can’t criticize it effectively unless we build our own black box? How about we just plot the oldest records to see if they falsify the hockey stick shape and post these plots far and wide on the Internet? Yup, we did that. And it helped us *win* the climate war so terribly effectively that Obama is now forced to go it alone, for after all he already had both houses of congress as large majorities and no carbon tax resulted. But now we are to cower from his mere pen as he is exposed more and more as a sorry and unprepared hack, and the most brazen liar of all time?
Nothing random about it. It directly addresses a key point of Monkton’s article and comments.
I am not a troll who is trying to create trouble. I am asking an honest question.
To put it bluntly, does anybody here think that they can solve two coupled sets of Navier-Stokes equations on a spinning, tipped, globe in an eccentric orbit around a variable star against a background of varying atmospheric chemistry and unpredictable volcanic events in their heads?
If you give Richards Betts at the UK Met off a super, super, hyper- billion billion processor computer he will solve it for you. Alledgedly. :))
Robert, Love your posts. If I was young again and starting out on my now defunct physics adventure, I would fly to Duke to be taught by you.
Pamela Gray says:
June 9, 2014 at 11:12 am
As prevailing winds are from the west, PDO phase does naturally affect continental climate when the warm water is on the eastern side of the Pacific.
Arctic sea ice melts when there is warm water in the Bering Sea, which IMO occurs when the warm pool is in EastPac, including off the coast of southern Alaska. That’s what happened during the 1910s-40s & 1980s to 2010s.
Dr Norman Page says:
June 9, 2014 at 10:31 am
Monckton and RGB You are both saying that the IPCC models are useless for forecasting . Surely it is time to quit talking about models at all
*
Exactly. It is time to stop predicting and start adapting through real risk management. That would automatically demand cheaper, reliable energy.
Professor Brown asks what quasi-periodicities are. Quasi-periodicities are somewhat irregular near-periodicities that may arise in both ordered and chaotic dynamical systems (and that may be difficult to tell apart, especially where the system is weakly chaotic). Mathematically, they are often studied by reference to winding numbers such as the golden mean, which is useful because among the irrationals on the interval [0, 1] it is maximally distant from any rational fraction, or the silver mean sqrt(2) – 1. For quite a good discussion, see Glazier and Libchaber, 1988.
May I suggest to my noble Lord that he learns how to use the SI units properly? I am sure that he will agree that when he reads a piece of English prose in which the words ‘they’ ‘there’ and ‘they’re’ are confused that he suspects that the writer is uneducated in the use of English. Scientists think the same about the misuse of scientific units.
I
t detracts from the message.
It’s a fascinating that chaos seems always presumed to be the end of the line for analysis. Suppose chaos brings us into a regime where steady-state properties of a system become independent of its past. Do exact differentials, entropy and thermodynamics come to mind? BotE calculation: 3.7*(70/240)=1.1K. 70K is the tropospheric differential and 240 W/m2 tropospheric dissipation, i.e. the work required to keep the system from relapsing into isothermal equilibrium. A better approximation follows from differentiation of the Carnot Equation which describes the thermal dissipation of a thermodynamic system operating between two isothermal boundaries given its free energy input flux. Two terms appear, one depending on the temperature dependence of the flux, the other on changes of boundary temperatures. The former leads to CAGW. The latter caps the catastrophe at 1.4K.
“Twenty-first-century theoretical physics is coming out of the chaos revolution. It will
be about complexity and its principal tool will be the computer. Its final expression remains
to be found. Thermodynamics, as a vital part of theoretical physics, will partake in the
transformation.” – Michel Baranger
RGB You do not have to solve the physics problems to predict the future. Hence the Babylonians and others were able to predict eclipses without knowing Keplers laws,. See Figs 3,4,5,6,at
http://climatesense-norpag.blogspot.com/2013/10/commonsense-climate-science-and.html
On fig4 there is a peak at 10000? ,9000, 8000,7000 5000? 2000 1000 and at the present. Resonances and beat frequencies come and go in this sort of natural time series. Looking at Fig 4 and 3 together it is very reasonable to suggest that the trends from 1000 – 2000 in Fig 3 will more or less repeat from 2000 – 3000. and that the recent temperature peak was a peak on both the 1000 year quasi periodicity and the 60 year quasi periodicity seen in Figs 5 and 6
I call them quasi-periodicities for obvious reasons- the phases of the different climate driver processes will never exactly repeat in the real world so the temperature peaks will drift over time
I submit that for the present time the key uncertainty is the exact timing of the 1000 year quasi periodic peak. The neutron count would suggest that we are probably just past the peak. – see Fig 9.
Pamela Gray says: “Bob, correct me if I am wrong.”
I have no need to correct you.
Monckton of Brenchley says:
June 9, 2014 at 10:01 am
“In truth, no prediction will be reliable, but I’d be prepared to bet quite a large sum, for the sake of my heirs, that this century’s global warming will indeed be closer to 2 K than to 8 K, even if there be no more nonsense about curbing ‘carbon emissions’”.
I’ll interpret that to encompass cooling as -1 K is closer to 2 K than it is to 8 K.
At least the title of this post has some value. Sorry, my Lordship, but the rest [is] just an exercise in futility.
Feedback…the subject
We use it in engineering (Osc/Amps/Engines to name a few). Most of that is fast feedback – part seconds and within a limited boundary.
The planet we live in is self regulating,in that it supports life as we know it. It is slow in terms of performance. Latency and can overshoot (not that this planet regards over/undershoot)
Evidence from geology shows us past severe changes which have nothing man made related. That would be the ice ages. Ice ages mean that feedback from this planets systems (ocean/land) has not controlled what we might think is within range. Thats our comfort zone..not this planets performance zone.
The case is that if you cannot describe this planets behaviour completely either now or historically, no amount of modelling by any computer will.
I suspect we will slowly freeze to death? Temp change for next 100 yrs….zero!
I predict only -1 C of global cooling by 2100, thanks to a human contribution of +2C. That’s right, the solar lull will TRY to initiate “the big one,” but humanity will wise up in time to dot the great white north with coal-burning soot-production plants, enough to forestall, barely, the descent into the next glacial period. (Does that make me an optimist?)
The contribution of human CO2 emissions will be approximately +0.25C.
One note on the king’s English. To use the conspiratorial “we” Lord Monckton could have written: “Let us examine a few of [AR5’s revealing inconsistencies],” because we can all examine together. But I don’t think the conspiratorial “we” (or “us”) works with the sentence Chris actually wrote: “Let us expose a few of them,” because only he is doing the exposing (and a very nice job of it).
That leaves the royal “we,” which I don’t think was intended, the co-author “we” (no co-authors), or the parasitical “we,” (me and my parasites). Personally I am a fan of the conspiratorial “we,” but it requires careful attention, not to inadvertently flop into one of the other categories.
Let me “fix” the above for you.
As a real engineer who has actually worked with real systems and operations that actually do affect lives and property, I have found competency, honesty, and morality to be the most valued characteristic of peers and a deep respect for facts, truth, logic. Corruption on the scale suggested by Monckton has actually decimated virtually ALL science since the various disciplines rely on cross pollination of research to support and verify everything they do.
As a real engineer who has actually worked with real climate “scientists” and their political-propaganda-bureaucratic self-funding systems and operations that actually do affect lives and property around the world, I have found competency, honesty, and morality to be the least valued characteristic of these people and their peers in academia-political-power; and have found none even a shallow regard for facts, truth, logic.
Do you personally realize how credible Monckton’s claim of science corruption is?
Do you personally realize how un-credible the complete lack of evidence in your so-called “scientific” claims supporting their CAGW claims of “science” are?
I predict zero net warming as a product of A) solar induced cooling and B) warming induced by increased human activity to make up for the poverty-inducing policies and tax changes from the ongoing science and policy scam. I’m more concerned about meteor strikes as evidenced from the geologic record and organized non-planning for on-site nuclear waste.
Dr Norman Page says:
June 9, 2014 at 12:11 pm (replying to)
And thus the most important question about such apparent cycles:
Assuming the past four 66-68 year short-period cycles (of unknown drivers) continue for a while,
and
Assuming the past 900-1000 long-period cycles (also of unknown drivers) continue for the next 240 years
Only one question need be asked to determine the global average temperature anomalies in 2100:
Is today’s Modern Warming Peak of 2000-2010 the actual local maximum of the 900 year long-term cycle since the MWP?
Or is the 2000-2010 peak only a local rise-and-pause period (like the 1945 rise) towards the actual Modern Warming Peak coming 2060, then dropping towards a subsequent Future Ice Age in 2400?
I confidently predict that, in the year 2100, Earth will either be a little warmer, or a little cooler than it is now, but will be just fine. I also predict that by 2100, people won’t remember the original justification for the ever increasing carbon tax they pay.
CO2 be buggered, there is not one known change of climate in the last 600 million years that has been driven by CO2. To the contrary there are several changes where CO2 is going up while temperature is falling and vice versa and there are several major climate changes that happened while CO2 remained unchanged. Where there are parallels, CO2 always lags temperature by 11 months to 200+ years. The interglacial temperature change is matched by a 100ppm change in CO2 due to solubility of CO2 in water, however, if one puts that on a scale relative to the entire CO2 range (say 0 to 8000 ppm) then that solubility effect pails to nothing. It is only the scale used in the likes of Gore’s comparison (and Vostok data) that makes the two look comparable.
If we wish to gaze into the future a far more reliable method is to look at history. There is no guarantee of course that history will repeat itself (but it has to be a hell of a lot better than stuffing around with CO2 sensitivities.
Now looking at Dahl-Jensen et al Greenland Ice Sheet reconstructions we can see that there is a roughly 1000 year periodicity between the Minoan, Roman, Medieval and Modern warm periods.
The main drop in temperatures occurs in the first 200 years after the peak with drops of 2, 1.6, & 1.6°C. There is also in the Greenland data an intermediate warm peak at 1600 years ago that appears not to be global and that had a 300 year drop of 1.8°C.
If we apply that to the present and assume;
1 the pattern will repeat (well at least the 200 year drop to the next “Not So Little Ice Age”)
2. that the pending solar minimum (repeat of Maunder or Dalton) heralds the end of the current warm period.
3 the global drop appears to be 72% of the Greenland drop
Then we arrive at a guesstimate global anomaly of -1.15°C by the year ~2200 and half that by 2100
The same pattern would suggest that the next warm period would be in about 1000 year time and would be -0.4°C compared to today.
While the peaks from the said warm periods follow a very linear trend, ice core data show the drop off back into the ice age is rapid for the first 20,000 years and then gradually descends through the next 80,000 years reaching bottom just before the start of the next interglacial.
The idea that climate is literally a chaotic dynamical system seems far-fetched to me. After all, there seems to be some limit to climate fluctuations over very long timescales. Chaotic attractor, maybe. This would fit in with properties of weak solutions to Navier-Stokes (for whatever they may be worth).
My prediction: All but elitists will live in dark, cold hovels, These wretches (formerly known collectively as “The West”) will be growing food in their yards and alleyways, scraping a minimal diet. Life expectancy is 40 years.
The temperature will be the same as today’s. The elitists will attribute this to the fact that the majority live in dark, cold hovels.
They will continually congratulate themselves, up there in the palace on the hill.
Monckton of Brenchley says:
“Professor Brown is, of course, right that the climate is unpredictable because it is a complex, non-linear, chaotic object..”
Lend me your eyes and ears for a day and I could show you the planetary ordering of solar activity behind, a) the highly irregular 150-250yr cold stadial like periods through the last 6.5kyrs such as the LIA and Dark Ages, b) exactly which solar cycles are effected through each solar grand minimum, and the timing of every cycle maximum, c) short term ordering of solar activity from inter-annual down to weekly scales that is directly effecting atmospheric circulation patterns and mid latitude land temperature deviations at these scales.
This solar minimum is relatively short, and will be recovering from SC26 onwards. But with the worst of the short term cold effects for the N. hemisphere temperate zone coming very soon, from late 2015 through to 2024. For the long term, my findings show that we are heading back into a LIA sequence through the next 200yrs, with deep and protracted solar grand minimums starting from the 2090’s, and around 2200 AD.
Given that this century will have just over one solar grand minimum occurring in it, I would think it should end cooler than it started.
Am I missing something? I thought the scientific method worked like this; You propose a hypothesis (co2 drives temperatures) then you collect data to see if it matches the hypothesis. Only then, if the data matches the hypothesis, do you call it a theory. Once it is a theory, other scientists run tests to see if it holds up. We have people spending energy to disprove a hypothesis that hasn’t even been affirmed by the data.
Based on everything I have read my best guess would be…………….-0.03 by 2100. I will give 10 to 1 odds we do not get more than 1 degree Celsius longer term warming by 2100!
The pseudonymous “Mike B” would like me to use SI units correctly, but fails to provide a single instance in which the units were incorrect. If he is complaining about the degree symbol that appears alongside the word “Kelvin” in the strapline, when it is self-evident that in the three dozen subsequent references to Kelvin there is no degree symbol, then he should have been able to conclude that this single instance was a misprint that arose in the process of formatting the page for the posting. Don’t pick nits.
While I have no little sympathy for “Quondam” in his desire to constrain chaotic dynamical systems and render them predictable to a sufficient precision, unfortunately matters are not yet that simple. The difficulty to be overcome is a fundamental one. In a chaotic object, even the smallest perturbation in the initial value of any relevant variable can cause a radical bifurcation in the evolution of the object, rendering prediction unattainable except in the presence of highly precise initial data that will never be available in the climate system.
Mr Ard describes the head posting as an exercise in futility but does not say why. That is mere yah-boo.
Mr Rawls says I had used the conspiratorial “we”. No, I had used the royal “we” 🙂
Mr Leman does not like the glancing implication in the head posting that the small faction that drives the climate scare does so for wealth and influence. However, he appears unable to challenge any of the mathematical discussion. He also whines that I have not published anything peer-reviewed. I now have several papers to my credit, two of them in one of the longest-standing and most prestigious journals in the world, where publication is by invitation only, and a further major paper has just been accepted for publication in a respected journal. I have no idea whether Mr Leman has ever published anything in the reviewed journals about the climate. Nor do I care: for the strength of what one says on a scientific argument is derived not from reputation nor from a publication record but from the intrinsic merit of the argument itself – and Mr Leman, but not addressing the argument at all, does himself no favors and me no damage. Has Al Gore ever published anything on the climate in a reviewed journal?
Besides, as Mr Cook has rightly pointed out, there is indeed widespread evidence of corruption in climate science. Read the Climategate emails; look at the numerous official attempts to cover up that corruption; see the IPCC’s refusal to correct its errors when its reviewers request it to do so; look at the media’s reluctance to inform their readers of any fact about the climate that might suggest the climate scare is misconceived. Mr Leman is guilty of the ultimate intellectual sin: the unthinking adoption of an unevidenced, aprioristic, preconceived position and an unwillingness or inability to provide any argument whatsoever for it.
[snip – off topic, derogatory -mod]
Mr Ard is indeed “missing something”: for he sees no purpose in demonstrating the falsity of a hypothesis that is not yet proven. However, nearly all hypotheses in the physical sciences are not susceptible of demonstration. The “global warming is going to be dangerous unless we shut down the capitalist West” hypothesis, though neither demonstrable nor at all likely to be true, is nevertheless the political credo of the Left, and is now one of their most sacred shibboleths. The Left are notoriously unsusceptible to reason. Accordingly, it is necessary for us here to demonstrate, over and over again, the increasingly glaring scientific defects in the scientific case for what is at root not a scientific but a political theory. Since this particular – and particularly poisonous – political theory is rooted in scientific error, this is one political theory that, in the end, will not survive: for it is already evident even to the promoters of the climate scare that they must begin to modify their absurd claims, as the head posting demonstrates.
Thank you, sir. May I have another?
Sensitivity is not hard to determine if you ignore all the multitudinous side issues brought out above. First, we must determine what temperature change, if any, takes place when atmospheric carbon dioxide increases. Theory tells us there must be a monotonic increase of temperature with increase of carbon dioxide in air. If you ignore its seasonal wiggle the Keeling curve shows an extremely smooth, upward curving history of atmospheric carbon dioxide. If we extend the Keeling curve back from 1958 by using ice core measurements we can go back as far as we have temperature records. It turns out that there is no place on the corresponding global warming curve where the two have run parallel for the last two centuries. This in itself should have raised someone’s suspicions about the role of carbon dioxide in global warming. Unfortunately all those great experts pulling salaries to study global warming have an idée fixe that greenhouse warming exists, don’t bother me with observations. That is not how science is done, that is pseudo-science. Coming back to observations, it is not a secret that there has been no warming at all for the last 17 years. We are fortunate in being able to use this as a natural experiment. From the Keeling curve we observe that atmospheric carbon dioxide has continued to increase during this time and perhaps even accelerated a bit. The greenhouse theory that these salary-men apply is the Arrhenius theory according to which this increase of carbon dioxide should produce a noticeable temperature rise. But it does not. If your theory predicts warming and nothing happens for 17 years it is time to get rid of that theory. It belongs in the dust bin of history. The only theory that accurately explains what happens here is the Miskolczi greenhouse theory (MGT). It differs from the Arrhenius theory in being able to handle the general case where several greenhouse gases simultaneously absorb in the IR, something Arrhenius cannot do. In such a case the gases present establish a joint optimal absorption window they control. In the earth atmosphere the gases that must be accounted for are carbon dioxide and water vapor. Their joint optimal absorption window has an IR optical thickness of 1.87, determined by Miskolczi from first principles. If carbon dioxide is now added to the atmosphere it will start to absorb, just as Arrhenius says. But this will increase the optical thickness. And as soon as this happens, water vapor will start to diminish, rain out, and the original optical thickness is restored. This explains why global temperature today is not increasing despite continual addition of carbon dioxide to the atmosphere. Also, this is not the first time it has happened. Using NOAA radiosonde database Miskolczi observed that IR absorption by the atmosphere stayed the same for 61 years while at the same time atmospheric carbon dioxide increased by 21.6 percent. This is the exact equivalent of what is happening today with the warming pause. It is clear from all this that, thanks to MGT, if you should even double the amount of carbon dioxide in the air the optical thickness will still be the same, there will be no additional absorption, and sensitivity will be zero. What this means for anthropogenic global warming or AGW will be left as an exercise for the student.
Mr Arrak’s comment on the Miskolczi findings is interesting, but it is not yet clear that infra-red absorption by the atmosphere has remained the same for several decades. Satellite measurements do show some attenuation in outgoing radiation, particularly at the CO2 absortion wavelengths. I don’t think we’ll be able to stand up his theory unless most of the outgoing-IR datasets confirm the absence of any change in outgoing long-wave radiation.
Rod Leman forcefully inquires: “Where is the extraordinary evidence to support the extraordinary claim of massive, international scientific corruption?”
Did you not see it or are you ignoring it, Rod? Here it is again, a so far unretracted paper that just months ago, not as ancient pre-Climategate history, but the very latest and widely celebrated alarm raising hockey stick in the very top journal Science, and the damn thing has no blade in any of the actual input data plotted directly from the paper’s own data archive:
http://s6.postimg.org/jb6qe15rl/Marcott_2013_Eye_Candy.jpg
This is but the latest of a long pattern. Alarmists act as if these scam studies are real. It’s a fraud, a money-fueled lame conspiracy of complacent gravy train rent seeking.
Another fraud was on the cover of Nature, an equally prominent scientific journal, that smeared hot red Antarctic Peninsula warming over the whole continent, in mathematically illegal fashion. Did any climate “scientist” catch this in peer review?
I’m sorry to sound so forceful, since you are new to the topic, and when you say: “As an engineer who has worked with real scientists, I have found competency to be the most valued characteristic of peers and a deep respect for facts, truth, logic.”, then I hope you have enough open minded respect for our best engineer of all, Burt Rutan, who is an outspoken “Show me the data!”
skeptic:
http://youtu.be/oxFm1TXshZY
The thing is, with agenda-laden funding, a great conspiracy isn’t needed, just complacency as self-interest takes over especially for third rate scientists who want tens of millions in new funding as long as they shut up about the mere couple of dozen hockey stick team insiders who are politically connected. They merely need study the effects of perfectly natural warming without there actually being “tens of thousands” of scientists producing the core deception that recent warming is outside of natural variation via hockey stick denial of the vast majority of proxy studies that exist that form bowls instead of hockey stick handles.
Monckton of Brenchley says:
June 9, 2014 at 3:56 pm
Mr Arrak’s comment on the Miskolczi findings is interesting, but it is not yet clear that infra-red absorption by the atmosphere has remained the same for several decades. Satellite measurements do show some attenuation in outgoing radiation, particularly at the CO2 absortion wavelengths. I don’t think we’ll be able to stand up his theory unless most of the outgoing-IR datasets confirm the absence of any change in outgoing long-wave radiation.
_________________________
In that single paragraph, you proved that you apply an honest metric to climate discussions.
I shall advance here on the significance of CO2 in all these calculations, and whilst it is undeniable that CO2 should cause some warming, it is not clear that the atmospheric concentration of CO2 is responsible for the 70-odd to 80-odd percent implied by these calculations (whomsoever it was who did them).
I would suggest that it is indeed the case that the World’s average temperature (whatever that is supposed to mean), is not a result of rising CO2 concentrations at all, but instead the reverse is true. When the World’s oceans heat up, then dissolved CO2 effervesces into the atmosphere and so the CO2 level increases mostly as a result of that process. Again when the World’s oceans cool down again, then more CO2 will be able to be dissolved, and concentrations in the atmosphere will reduce as a result. Therefore I do not accept the premiss that CO2 will either double or be very much larger than it it today by the year 2100.
All this glib talk of Global average temperatures, and World CO2 averages and so on is actually largely meaningless. Temperatures and indeed CO2 vary significantly at any single spot on this Earth, on a Monthly, Weekly, Daily, or even Hourly basis, at least an order of magnitude larger than these predicted variations discussed here. It’s the Sun & Biosphere that does that in synergy.
CO2 significant effect on temperatures is a dead horse. Please to stop the flogging of it.
If there is any positive feedback in the earth-sea-air climate system, they we should expect that some place in the last 4 billion years the positive feedbacks should have had a runaway excursion, i.e. the earth should have turned into Venus. There is no evidence of such an excursion and therefore the feedbacks are ≤ 0.
I think Mosher and Rod Lehman have framed part of the problem with Climate Modelling exactly. To Rod, there does not have to be ANY corruption at all. All you need is for a large group of scientists to agree to a set of principles such as the exact mandate the IPCC has set for itself. It does not ask “if” climate change is human induced, it has already decided that the goal is to deal with man caused climate change. I can buy into that (deforestation, agriculture, land use, urban heat islands), but I have trouble with CO2 as a driver. Of course I am just an old engineer.
From Mosh: “That discussion would start with a list of assumptions.” Well, we all know the joke about assumptions. And like Mr. Lehman, I am an engineer and I can tell you sometimes it is more than assumptions, it is INSTRUCTIONS. I would hate to say how many times over 40 years I had to go read my code of ethics with respect to my duty to my client versus my duty to the public and my fellow engineers when I was given parameters for a project that I knew could be done by going outside the parameters. But my client (frequently government) wanted limited parameters for their own reasons.
It doesn’t take much for a whole group of people to have to live within artificially imposed design constraints that costs project a ton of money more than it should because the people with the money have a goal that is not necessarily visible to the designer/scientist/researcher. You are required to work within the parameters/assumptions given. You owe a duty of care to inform, but having done that, you soldier on or quit. I have fired clients, and I have worked at things I didn’t like but could accept.
Using Mr. Mosher’s example, I recall reading that in computerized Nato War games, Nato generals were a lot more likely to look at the Nuclear option when they were losing a ground war in Europe than any of the strategists thought. This was something that we were taught in University 50 years ago, to watch for preconditioning. Might have been in my “Philosophy of Science”, class, I don’t recall. (I looked for a reference but didn’t find one) When President Kennedy was assassinated and an announcement was made over the school PA system, many of us thought the announcement was going to be that ICBM’s were in the air as we had been conditioned for that announcement with our “duck and cover” training (useless as it would have been).
Assumptions and preconditioning can be deadly:
http://www.theatlantic.com/international/archive/2013/05/the-ussr-and-us-came-closer-to-nuclear-war-than-we-thought/276290/
The IPCC says the models can’t agree so shows no central estimate for climate sensitivity, yet their feedback calculations as shown in figure 1 look exactly the same methodology as before and show a central estimate…..hoist by their own petard?
Stephen Mosher: If you dont have a better approach.
Do you think that Christopher Monckton has demonstrated a better approach than the IPCC? Actually, he has the same approach, but different results.
What do you do when you can show that the best available theory is not accurate enough to be the foundation of policy? Pretend that it is?
I, for one, would make sure that Sen James Inhof and his staff and the staffs of the House members were aware of Christopher Monckton’s writing, so that when Obama proposes climate control legislation to the Congress that legislation can be blocked. That way Obama’s pen can be curtailed.
Succinct, clear, and interesting summary of the IPCC shenanigans and the fundamental issues. Thank-you. I hope you make a speedy recovery.
Best wishes,
William
The observational data supports the assertion that the planet resists forcing changes (Lindzen and Choi’s paper for example and Spencer’s paper on clouds) and something inhibits the greenhouse forcing mechanism (this explains why the tropical troposphere has not warmed) for regions higher in the atmosphere (the lower regions of the atmosphere are saturated due to the overlap of the H2O absorption and CO2, higher in the atmosphere there is less water vapour so the CO2 should theoretically cause the most amount of warming in higher regions of the troposphere, that is not observed.)
http://www-eaps.mit.edu/faculty/lindzen/236-Lindzen-Choi-2011.pdf
On the Observational Determination of Climate Sensitivity and Its Implications
Richard S. Lindzen1 and Yong-Sang Choi2
http://icecap.us/images/uploads/DOUGLASPAPER.pdf
A comparison of tropical temperature trends with model predictions
We examine tropospheric temperature trends of 67 runs from 22 ‘Climate of the 20th Century’ model simulations and try to reconcile them with the best available updated observations (in the tropics during the satellite era). Model results and observed temperature trends are in disagreement in most of the tropical troposphere, being separated by more than twice the uncertainty of the model mean. In layers near 5 km, the modelled trend is 100 to 300% higher than observed, and, above 8 km, modelled and observed trends have opposite signs. These conclusions contrast strongly with those of recent publications based on essentially the same data.
Based on increased sea ice in the Antarctic (all months of the years) and a recovery of the Arctic sea ice it appears the high latitude regions have started to cool which is a reversal of the warming trend in the last 70 years. The reversal of the warming in the last 70 years is not surprising as there are cycles of warming and cooling (high latitude regions both hemispheres, same regions that warmed the most in the last 70 years) in the paleo record that correlate with solar magnetic cycle changes.
Eliza says:
June 9, 2014 at 5:41 am
Google
+++++++++++++++++++++++++++++++++++++++++++++++++++++++++++++++++++++++
Google split their stock into Class A and C shares to maintain control. Their stock prices have slid ever since. I sold for both financial and “ethical” reasons. I only use their search engine to double check searches. When you get too deep in the mud, sometimes you loose your way for a while. What ever happened to US anti-trust legislation anyway?
Uh-oh – running on my gen set as lightning knocked the power out and I don’t have my Wi-Fi on the gen set with my water pumps and refrigeration. Dang UPS’s are beeping all over the house. This comment won’t be going for who knows how long and likely irrelevant by then (if not now😏)
Off to feed les animaux in the light. Maybe the power will be back in a few hours. Might have to throw a log on the fire tonight if I don’t get enough solar gain before dark. The joy of rural living.😊
[Congratulations on your successful! backup power supplies. .mod]
My estimate for year 2100 = 2.75 x 0.27 x 0.73 = 0.54 C
Details below
CO2 = 641 ppm (At current growth rate of 0.0054% / year for 86 years)
CO2 = 712 (641 times 10/9 to allow for non-CO2 anthropogenic forcings)
Forcing = 2.75 W/m^2 (4.77 log(712 / 400); Hitran 2008 shows 4.77 is closer than 5.35)
Planck parameter = 0.27 (based on Hitran 2008 and other calculations)
Combined Feedback factor = – 0.369 C / C (see below for details)
Feedback (system) gain = 1 / (1 + 0.369) = 0.73
Temperature increase (ignoring heat storage delay)
2.75 x 0.27 x 0.73 = 0.54 C
Feedback Details in C / C, the correct way to define
Water vapor: + 0.29 (Paper in progress. Based on Hitran 2008 with 5.3% / C water vapor increase and increased water vapor solar absorption. IPCC is 1.8 x 0.31 = +0.56).
Clouds: 0 (IPCC’s 0.69 x 0.31 or +0.21 is a fudged. Probably negative, but don’t know how to estimate)
Lapse Rate: – 0.74 (Based on 6% / C evaporation increase. See my paper http://wattsupwiththat.com/2014/04/15/major-errors-apparent-in-climate-model-evaporation-estimates/
Albedo: +0.26 x 0.31 = +0.081 (use IPCC value)
Total feedbacks = 0.29 + 0 – 0.74 + 0.081 = – 0.369
Feedback (system) gain = 1 / (1 – (– 0.369)) = – 0.73
OK, I’ll bite:
CO2 peaks at 540 ppm Max about 2070 AD with a lot of uranium gone and peak coal coming
Peak coal coming in about 2070. Peak uranium will be past by then. Thorium will be worked out. Remember it is all about demographics. The population will be back down to 6 billion by 2101 (the turn of the next century). Thereafter CO2 will slowly drop. After the 2015-2030 cooling, the global temperature will be about 0.7 C higher than in 2001. Sea level will be up 180mm.
@Crispin in Waterloo
But won’t all of the above you mentioned be largely irrelevant when we have all got out “Higgs Field” personal generators by then, and able to extract power from “thin air” like Tesla did, back in the day ?
It is just as likely as any of the scenarios mentioned so far.
Stephen Richards says:
June 9, 2014 at 11:34 am
Key word for you Sasha “measured”
****
Measuring the CO2 signal is not straightforward.
Atmospheric carbon dioxide levels for the last 500 million years
http://www.pnas.org/content/99/7/4167.full.pdf
The last 500 million years of the strontium-isotope record are shown to correlate significantly with the concurrent record of isotopic fractionation between inorganic and organic carbon after
the effects of recycled sediment are removed from the strontium signal. The correlation is shown to result from the common dependence of both signals on weathering and magmatic processes.
Because the long-term evolution of carbon dioxide levels depends similarly on weathering and magmatism, the relative fluctuations of CO2 levels are inferred from the shared fluctuations of the isotopic records. The resulting CO2 signal exhibits no systematic correspondence with the geologic record of climatic variations at tectonic time scales.
The CO2 signal derived from this analysis represents fluctuations at time scales greater than
about 10 million years (My). Comparison with the geologic record of climatic variations (18) reveals no obvious correspondence.
See also page 3 section: Estimation of the CO2 Signal
****
On this site:
A Brief History of Atmospheric Carbon Dioxide Record-Breaking
http://wattsupwiththat.com/2012/12/07/a-brief-history-of-atmospheric-carbon-dioxide-record-breaking/
More on CO2 signal measurement…
Direct Observation of the Oceanic CO2 Increase Revisited
Peter Brewer, Catherine Goyet, Gernot Friederich
1997. NAS 0027-8424/97/948308-6$2.00/o
http://www.pnas.org
http://www.nap.edu/openbook.php?record_id=6238&page=36
Here is another PDF (16 pages) of detailed CO2 signal measurements:
Characteristics of the atmospheric CO2 signal as observed over the conterminous United States during INTEX-NA
JOURNAL OF GEOPHYSICAL RESEARCH, VOL. 113, D07301, doi:10.1029/2007JD008899, 2008
http://nldr.library.ucar.edu/repository/assets/osgc/OSGC-000-000-003-124.pdf
…and another PDF (10 pages)
The non-steady state oceanic CO2 signal: its importance, magnitude and a novel way to detect it
B. I. McNeil and R. J. Matear
http://www.biogeosciences.net/10/2219/2013/bg-10-2219-2013.pdf
Even on business as usual, there will be <1° Kelvin warming this century
Kelvin isn't ° as its absolute tempreature.
one prediction it is possible to make is that peak uranium, will be some time in the 3rd millenium.
Lord Monckton, you require a correction:
Your mention of “CO2” here should be “CH4”, I believe, unless you’re equating non-CO2 gases to CO2.. Maybe I missed something?
Keep up the great work.
Mr Koenders has indeed “missed something”: in the passage he quotes, I am discussing CO2-driven forcing as a fraction of total anthropogenic forcing. If methane concentration does not grow as fast as predicted (as it is not growing), the non-CO2 fraction diminishes and the CO2 fraction correspondingly increases. It is now 83% of total anthropogenic forcing, though the IPCC’s estimate, based on wildly exaggerated predictions of increases in methane concentration, had been 70% in the Fourth Assessment Report.
I can report that 29 commenters made identifiable projections of global warming. The mean projection was for warming of one-eighth of a Celsius degree. I suspect that this value will prove to be considerably closer to the mark than the 3.7 K business-as-usual anthropogenic warming predicted by the IPCC. Time to apply for some funding for the WUWT suck-it-and-see model.
And no summary observation (or criticism) from you for those of use brave enough to predict either cooler temperatures or an official “we don’t know” ?? 8<)
Lord Monckton;
No one deserves the Royal “we” more then you. Too bad science has become a religion and a tool of control. 100 years ago you would be universally recognized as a great mind.
bad timing
The truth is becoming more and more irrelevant the scientific method died with the advent of the computer, The great tool has created a bunch of real Tools.
“thingadonta says:
June 9, 2014 at 3:40 am
….
Water vapour and associated cloud changes give negative feedback, as in the tropics (which is why they don’t get hotter than the deserts). ”
Actually, Florida is somewhat warmer than similar latitudes in the Sahara Desert. Florida’s daytime temperatures are a lot less hot than the Sahara, but their nights are a lot less cold- the AVERAGE for Florida is somewhat higher.
Mr Cook wonders why I don’t criticize those who come up with different predictions from mine. Well, there are so many uncertainties that it wouldn’t be fair to expect everyone to take the same view. But just about everybody’s prediction was in the range -1 to +1 Celsius for 21st-century global warming. All these outcomes are plausible, but +3.7 Celsius by 2100, or 8 C by 2300 (the IPCC’s estimates) are implausible.
Mr Bolder is very kind, but in a dark age those who persevere in insisting on the truth are seldom regarded as attractive. However, the ever-widening gap between prediction and reality cannot indefinitely be ignored. Perhaps in as little as 20 or 30 years people will look back and wonder what all the fuss was about.
From a simple model of an oscillating rate of warming plus C x time for the extra rate of warming due to anthropogenic carbon dioxide. Human use of fossil fuel is going up exponentially but the effect of CO2 on temperature is supposed to be logarithmic so I chose a linear function of time.
We get this plot
http://s5.postimg.org/fco4rwz8n/prediction.jpg
when fitted to the rate data.
http://s5.postimg.org/voy6hndk7/rate_model.jpg
It predicts that in 50 years time another hiatus will occur at 0.4-0.5 degrees warmer than now that lasts until 2100. This hiatus will last another 10-15 years.
Please give the prize to my cozy grandchildren.
Sir Christopher. At the bottom of your piece you say:
“That gives my best estimate of expected anthropogenic global warming from now to 2100: three-quarters of a Celsius degree.”
Quite clear. Except: temperature of what, estimated by whom? What about attribution (who says what made the temp rise/fall)?
http://www.ipcc.ch/publications_and_data/ar4/wg1/en/ch9s9-2-4.html
Care to clarify?
“Village Idiot” asks me to clarify my projection that Man will cause about 0.75 K global warming between now and 2100. The calculations are set out quite clearly in the head posting. They are of course subject to enormous uncertainty, but I should be prepared to bet quite a large sum that 21st-century business-as-usual warming will be closer to my estimate than to the business-as-usual 3.7 K projected by the IPCC. The differences between the IPCC’s estimate and mine are clearly set out in the head posting.
The passage in the IPCC’s fourth assessment report mentioned by “Village Idiot” is outdated. Among the many factors the IPCC has revised is its estimate of aerosol-driven negative forcing. It has greatly reduced what was always something of a fudge-factor intended to allow the modelers to make a case for high climate sensitivity. However, as the head posting again carefully explains, the implicit new central estimate of climate sensitivity in IPCC (2013) is about 2.2 K, not the 3.3 K in the previous report.
So we’re talking surface temperature or troposphere temps?
We are not talking of either surface temperatures or any particular tropospheric temperatures. We are talking of changes in surface temperatures. Read the definition of climate sensitivity in any IPCC report.
Monckton of Brenchley says:
June 10, 2014 at 11:43 am
Mr Koenders has indeed “missed something”: in the passage he quotes, I am discussing CO2-driven forcing as a fraction of total anthropogenic forcing. If methane concentration does not grow as fast as predicted (as it is not growing),
Really?
http://www.mfe.govt.nz/environmental-reporting/atmosphere/greenhouse-gases/images/ch4-baring.jpg
Methane is as much of a false alarm as ocean “acidification”.
The failed [as usual] predictions were that there would be a giant methane burp from calthrates outgassing due to accelerating global warming.
To date, exactly NO catastrophic AGW predictions have happened. Why should anyone believe the alarmist clique, when everything they predict truns out to be wrong?
Me, I prefer to not listen to those swivel-eyed preachers of doom and gloom. They are always wrong.
Monckton of Brenchley says: June 10, 2014 at 5:38 pm
>Mr Cook wonders why I don’t criticize those who come up with different
> predictions from mine. Well, there are so many uncertainties that it wouldn’t
>be fair to expect everyone to take the same view.
It wouldn’t be WISE for everyone to take the same view. I am something of
a lukewarmer on the issue of warming — of course it’s warming some — but
am wholly and vehemently skeptical of claims that “business as usual” must
be suspended in order to deal with the supposed problem.
Business as usual, as described by Mosher above, is the authorities,
decision makers, and responsible parties for various and competing
organizations to make, severally and separately, assumptions about
current trends, and make plans based on the assumptions. But there is
no reasonable reason to assume everybody must make the SAME
assumptions.
We see this all over. Assume the _Old Farmers Almanac_ recommends
the best time to plant is the dark of the moon. Whatever basis and assumptions
go into this recommendation, some will plant accordingly, some earlier, and
some later. Some will be wrong. But if EVERYBODY plants at the same time,
it’s a recipe for famine whenever ANY of the _OFA_ hidden assumptions,
algorithims and models turns out to be wrong.
Suppose we say NO CHILD LEFT BEHIND means all children must learn to
read from a phonics first or phonics only program. There is good evidence to
support phonics as a teaching method. But if EVERY school is REQUIRED to
use the same sorts of textbooks in the same sequence, the children who
for example have hearing impairments affecting their ability to process
phonemes will, by design of the program, fall behind. Same now, over a decade
later, with Common Core. Assuming, as the US federal department of education
does, that ALL children MUST learn the same things in the same sequence is
a recipe for failing those on a different (not necessarily earlier or later or better
or worse, just different) trend line. Yet billions of dollars are committed to programs,
decades after decades, that routinely fail to deliver to deciles and quintiles of
the demographics supposedly served.
Don’t even START with me about Stalin or Mao deciding on the best way to
industrialize…
“Phil.” is wrong, as usual. Methane concentration is indeed not rising as predicted, as the graph in the head posting amply demonstrates. As Mr Stealey has rightly pointed out, methane is yet another foolish scare. The IPCC admits that non-CO2 forcings are not 30% of anthropogenic forcings, as originally predicted, but just 17%, chiefly because methane concentration has not risen anything like as fast as predicted.
Chris. So when surface temperatures have risen, say, 1.5 degrees by the end of the century compared to June 2014 (compared to some running average), would you (theoretically 😉 ) conceed that you had underestimated climate sensitivity or say that you were correct and that the extra warmth came from something other than anthropogenic ghg emissions and their feedbacks?
Bare with me please – I am going somewhere with this, and possibly have a suggestion that you may find engaging 🙂
In answer to “Village Idiot”, even if one uses the IPCC’s own methods and data there is simply no excuse for its contention that on business as usual we might see – as a central estimate, albeit flanked by enormous error-bars – anything like as much as 3.7 K of global warming by 2100. My central estimate is 0.75 K, coincidentally about the same as the (largely natural) warming of the 20th century. But my estimate too too is flanked by large error bars. So, as I have said earlier in this thread, one can say with near-certainty that the 21st-century business-as-usual anthropogenic warming will be closer to 0.75 than to 3.7 K, but beyond that one would be falling into the same trap as the IPCC itself – trying to make predictions that lack a sufficient scientific underpinning of available precision.
The crowd-sourced estimate here, from some 29 participants, is that 21st-century warming will fall on the interval 0.12 [-1, 1] K. That interval of course encompasses my own estimate, which may indeed be on the high side. However, nowhere on that interval is there disaster for mankind.
Monckton of Brenchley:
At June 12, 2014 at 12:43 am you say
And my estimate is similar but I cheated by ‘stealing’ it.
I like empirical results, and empirical – n.b. not model-derived – determinations indicate climate sensitivity is less than 1.0°C for a doubling of atmospheric CO2 equivalent. This is indicated by the studies of
Idso from surface measurements
http://www.warwickhughes.com/papers/Idso_CR_1998.pdf
and Lindzen & Choi from ERBE satellite data
http://www.drroyspencer.com/Lindzen-and-Choi-GRL-2009.pdf
and Gregory from balloon radiosonde data
http://www.friendsofscience.org/assets/documents/OLR&NGF_June2011.pdf
I strongly commend everybody to read the Idso paper: although it is ‘technical’ it is a good and interesting read which reports eight different ‘natural experiments’.
Richard
My idea.
You say yourself that your monthly RSS pause mallard is destined for a watery quietus; temps will rise (a bit/eventually).
What about a new monthly thingy? For example, something like plotting IPCC ‘pathway/s’ (probably best for emitted CO2 equivalents rather than business as usual?), running average of the three surface temperature estimates, WUTW crowd-sourced estimate, your best shot. That sort of idea. Should be able to see some sort of development in the next 15-20 years, and the chance either for you to crow, or others to watch you squirm 😉
If you feel inclined, post a notice on the Village notice board. The Villagers – and hopefully some unbelieving Outsiders – can come with their suggestions on how to set it up, just to make sure there’s transparency and no monkey business.
Village Idiot:
re your post at June 12, 2014 at 1:14 am.
My idea.
If you want to ‘do your own thing’ then do it so others can admire it or laugh at it. Until then please stop disrupting WUWT threads with assertions based on nothing such as
Richard
In answer to “Village Idiot”, I have made it plain since I first wrote publicly about global warming in 2006 that some warming is to be expected (though probably not very much). It follows that the long pause shown so clearly in the RSS satellite record is going to come to an end. The theory is clear enough: all other things being equal, adding greenhouse gases to the atmosphere will be likely to cause warming. The question is whether the amount of warming caused is likely to have serious consequences, to which the answer is No.
The significance of the pause is that it is so startling a departure from what was predicted; that it has occurred at a time when CO2 concentration has been rising strongly; and that it contributes to the overall picture of slow warming at half the near-term rate predicted by the IPCC a quarter of a century ago.
Richard Courtney is, as always, right: if you want to compile your own temperature index and get it peer-reviewed by your “village”, then stop whining about my entirely straightforward monthly temperature analyses – which are of course a standing embarrassment to those who are trying to pretend we face a “climate crisis” that is simply not present in the record – and get on and do it.
Should I take that as a ‘No’? Of course, I can understand your reticence. Better get on it! 🙂
“Village Idiot” should know by now that I do not do science by consensus, so there would be no evidential value in presenting a mere head-count as though it were science. I am already producing everything else it asks for every month. As for my own prediction, the basis for it is clearly explained in the head posting. I have deliberately simplified the math to make the argument as widely accessible as possible. And I have consciously favored the climate-extremist case by having done the calculations for the IPCC’s case on an equilibrium basis rather than on the transient-sensitivity basis, which would approximately halve the quantum of warming to be expected.
If the “Idiot” wants the calculations or graphs done on some different basis, I am happy to hear its proposals for paying me to carry out the necessary work. Otherwise, as I have suggested, it should do the work itself. However, displaying clear graphs every month is not easy. It requires updating of half a dozen temperature datasets every month, as well as displaying the data in a manner that everyone can understand, while still maintaining academic rigor. The program I wrote to draw the graphs has some 400 lines of code. The graphs are now widely circulated in samizdat form every month, for the Marxstream media are not interested in the interesting fact that there has been no global warming recently notwithstanding the quite rapid increase in CO2 concentration.
Gradually, the world is finding out that the models were and are wrong. Faced with the evidence that the models have never yet succeeded in predicting global temperature correctly, but have consistently run very hot, the “Idiot” should be reconsidering its support for the pseudo-science based on the output of those models, which have been thoroughly discredited by events.
Monckton of Brenchley says: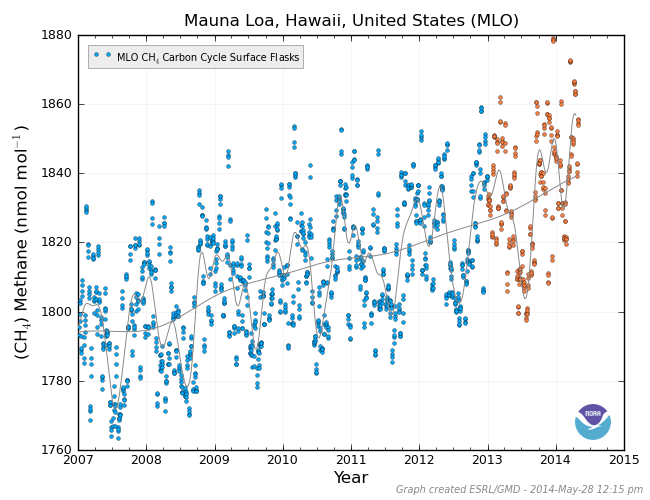 ?w=600&h=461
June 11, 2014 at 6:49 pm
“Phil.” is
wrongcorrect, as usual.As shown in the graph I linked to CH4 continues to rise after the brief hiatus between 2000 and 2005, the graph posted in the head posting conveniently stops in 2011, whereas up-to-date data shows continuing growth.
Methane concentration is indeed not rising as predicted, as the graph in the head posting amply demonstrates. As Mr Stealey has rightly pointed out, methane is yet another foolish scare. The IPCC admits that non-CO2 forcings are not 30% of anthropogenic forcings, as originally predicted, but just 17%, chiefly because methane concentration has not risen anything like as fast as predicted.
As the data in your own post indicates it is ‘rising as fast at predicted’ in AR4, with a lag caused by the 5 year hiatus. Based on the Mauna Loa data (above) it has now made up for that lag and is within the envelope of the AR4 projection.