Guest post by David Middleton
The hyping of Lovejoy, 2014 (L14) has been almost as unprecedented as his conclusions are unsupported…

Lovejoy piles on with the sort of trash talk normally associated with activist bloggers, rather than professional scientific publications…
“This study will be a blow to any remaining climate-change deniers,” Lovejoy says. “Their two most convincing arguments – that the warming is natural in origin, and that the computer models are wrong – are either directly contradicted by this analysis, or simply do not apply to it.”
Lovejoy’s “analysis” addresses neither the natural variability of the Late Holocene climate, nor the abject failure of the computer models. That said, Lovejoy does deserve credit for trying an empirical approach, independent of models and at least paying lip service to natural variability. However, L14 is seriously flawed in at least three ways:
- Nothing in Earth Science is 99% certain.
- A fundamental misunderstanding of Holocene climate variability.
- A totally unscientific and [demonstrably] wrong assessment of equilibrium climate sensitivity.
99%? Give me a break!
While I have no doubt that the Earth’s average surface temperature is a bit higher now than it was in the 1800’s, this cannot be asserted at 95%, much less 99% confidence.

Quasi-periodic fluctuations aren’t necessarily stochastic processes
Climate change is cyclical. If it wasn’t cyclical, sequence stratigraphy wouldn’t exist. So, anyone who insists that climate cycles aren’t true oscillations, please pretend that I am using the phrase, “quasi-periodic fluctuations” rather than cycles or oscillations. L14 totally fails to evaluate modern warming within the context of natural variability, largely due to the assumption that it must be stochastic in order to be natural…

Lovejoy’s assumption is that all of the secular-ish warming in the instrumental record is anthropogenic.

L14 totally fails to evaluate the instrumental era warming within the context of natural climate variability. What was the climate doing before 1880? Just about the same thing it has been doing since 1880…

Pretty well all of the [spectrally] consistent (non-hockey stick) reconstructions yield the same conclusion…

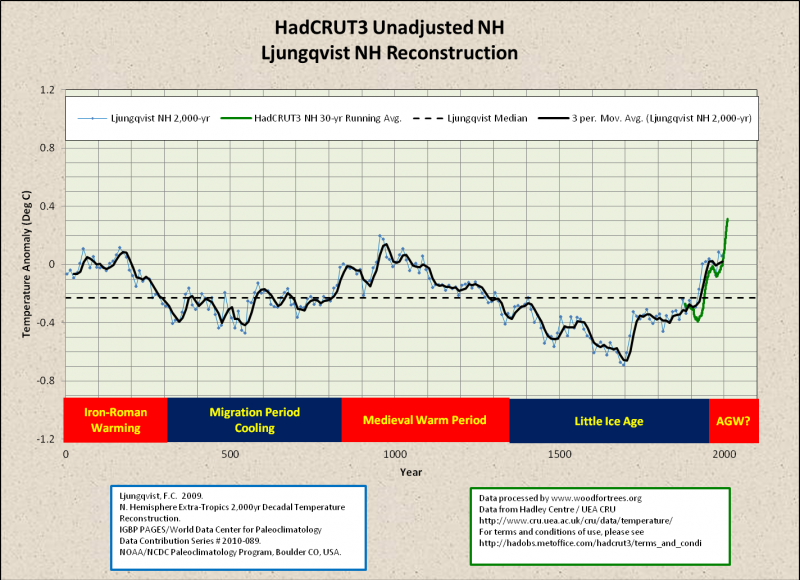
If we take Moberg and Ljungqvist back to the year zero, we can clearly see another characteristic of the Late Holocene climate: A millennial scale cycle with a period of ~1,000 years and amplitude of ~0.5 °C.

 Figures 7 & 8. Both Moberg and Ljungqvist clearly demonstrate the millennial scale climate cycle.
These cycles even have names…
These cycles have been long recognized by Quaternary geologists…

Fourier analysis of the GISP2 ice core clearly demonstrates that the millennial scale climate cycle is the dominant signal in the Holocene (Davis & Bohling, 2001). It is pervasive throughout the Holocene (Bond et al., 1997).

The industrial era climate has not changed in any manner inconsistent with the well-established natural millennial scale cycle. Assuming that the ice core CO2 is reliable, the modern rise in CO2 has had little, if any effect on climate…

While the climate may have warmed by 0.2 to 0.4 °C more than what might be expected to occur in a 100% natural warming phase of the millennial cycle, all of the apparent excess warming may very well be due to resolution differences between the instrumental and proxy data…

According to Ljungqvist…
The amplitude of the reconstructed temperature variability on centennial time-scales exceeds 0.6°C. This reconstruction is the first to show a distinct Roman Warm Period c. AD 1-300, reaching up to the 1961-1990 mean temperature level, followed by the Dark Age Cold Period c. AD 300-800. The Medieval Warm Period is seen c. AD 800–1300 and the Little Ice Age is clearly visible c. AD 1300-1900, followed by a rapid temperature increase in the twentieth century. The highest average temperatures in the reconstruction are encountered in the mid to late tenth century and the lowest in the late seventeenth century. Decadal mean temperatures seem to have reached or exceeded the 1961-1990 mean temperature level during substantial parts of the Roman Warm Period and the Medieval Warm Period. The temperature of the last two decades, however, is possibly higher than during any previous time in the past two millennia, although this is only seen in the instrumental temperature data and not in the multi-proxy reconstruction itself.
[…]
The proxy reconstruction itself does not show such an unprecedented warming but we must consider that only a few records used in the reconstruction extend into the 1990s. Nevertheless, a very cautious interpretation of the level of warmth since AD 1990 compared to that of the peak warming during the Roman Warm Period and the Medieval Warm Period is strongly suggested.
[…]
The amplitude of the temperature variability on multi-decadal to centennial time-scales reconstructed here should presumably be considered to be the minimum of the true variability on those time-scales.
Ljungqvist is recommending caution in comparing the modern instrumental record to the older proxy reconstructions because the proxy data are of much lower resolution. The proxy data are showing the “minimum of the true variability on those time-scales.” The instrumental data are depicting something closer to actual variability. Even then, the instrumental record doesn’t exceed the margin of error for the proxy data during the peak of the Medieval Warm Period. With a great deal of confidence, perhaps even 67%, it can be concluded that at least half, perhaps all, of the modern warming is the result of quasi-periodic natural climate fluctuations (AKA cycles).
Lovejoy’s 99% conclusion is consistent with climate sensitivities demonstrated to be overwhelmingly wrong
I won’t bother with Lovejoy’s references to Arrhenius, Lord Monckton has already dealt very nicely with that fallacy (as did Angstrom about 5 minutes after Arrhenius discovered AGW). I’ll just get right to his supposedly empirical estimate of equilibrium climate sensitivity…

Our good friend, James Hansen, ruled out 4.5 K back in 1988..

~3.0 K hasn’t worked out so well either…

All of the recent observation-derived climate sensitivity estimates put the total warming due to a doubling of atmospheric CO2 between 0.5 and 2.0 °C.
- Spencer & Braswell,2010, 2011 and Lindzen & Choi, 2009, 2011 came up with a likely ECS in the range of 0.5 to 0.6 °C.
- Asten, 2012 found ECS to be 1.1 ± 0.4 °C based on δ18O and δ11B records from fossil forams and the Eocene-Oligocene transition in marine sediment cores from DSDP site 744.
- Researchers at CICERO and the Norwegian Computing Center announced that when they incorporated the temperature and CO2 data from 2000-2010 into their instrumental record-based ECS estimate, they obtain a most likely value of 1.9 °C.
- Lewis, 2013 found a most likely ECS of 1.6 K using a Bayesian analysis and incorporating recent data.
- Masters, 2013 found a most likely ECS of 1.98 K from ocean heat content and sea surface temperature data.
- Aldrin et al, 2012 and Forster & Gregory, 2006 also found the ECS to most likely be less than 2 °C.
If I cross plot the high resolution DE-08 ice core from Law Dome, Antarctica against Moberg, I get an ECS of about 1.9 °C with a fairly good correlation. The earlier (deeper and lower resolution) ice cores are poorly correlated with temperatures at millennial scale resolution (see this post for more details).

However, this assumes that all of the warming is anthropogenic… At least half of the warming is highly likely to be natural, yielding an ECS of about 1 °C (the assumed radiative forcing with neutral feedbacks). If at least half of the rise in CO2 is natural, as demonstrated by plant stomata, then the total anthropogenic component is about 0.5 °C. There simply is no scientific basis to predict more than 2 °C of global warming from a doubling of atmospheric CO2 (280 to 560 ppmv). Therefore there is no scientific basis to forecast any effects from more than 2 °C of warming…

Conclusions
Lovejoy’s 99% solution fails to quantify or even accurately describe the patterns of natural variability of the Late Holocene climate. Therefore, his conclusion that the warming since 1880 (~0.4 °C per century) cannot be natural is unsupported in his analysis. While it is possible that up.to half of the industrial era warming might be due to the rise in the atmospheric CO2 concentration, this is hardly conclusive and certainly not at 95% confidence, much less 99%. Davis and Bohling demonstrated that 140-yr runs of 0.4 °C per century runs of warming and cooling were not unusual in the GISP2 ice core. The fact that the industrial era slope is roughly twice the norm of the past 2,000 years does not prove that it is of anthropogenic origin. The Little Ice Age was quite possibly the coldest phase of the Holocene since the 8.2 KYA Cooling Event. The LIA was characterized by maximum glacial advances and the most extensive sea ice coverage since the onset of the Neoglaciation (end of the Holocene Climatic Optimum).

While volcanic forcing may have played a role in the coldness of the LIA, it was clearly a.cyclical cooling event. Much, if not all, of the warming since the late 16th century is clearly part of a millennial climate cycle. This cycle evident in Greenland ice cores throughout the Holocene interglacial and the last Pleistocene glacial stages…

All of the “global warming” from ~1600 AD through 2000 AD barely brought the climate back to “normal.”
I have intentionally not addressed the causes, drivers and/or forcing mechanisms of the millennial scale cycle. My goal here was to describe and quantify how the Holocene climate was behaving prior to the industrial era. Geologists tend to try to figure out what happened before trying to draw conclusions about why it happened. I have a hunch that Henrik Svensmark is on the right track and that the Sun, the stars and cyclical variations in cloud cover and albedo are the answer. Only time will tell.
Selected References
- Alley, R.B. 2000. The Younger Dryas cold interval as viewed from central Greenland. Quaternary Science Reviews 19:213-226.
- Bond, G., W.Showers, M.Cheseby, R.Lotti, P.Almasi, P.deMenocal, P.Priore, H.Cullen, I. Hajdas, and G. Bonani, A pervasive millennial-scale cycle in North Atlantic Holocene and glacial climates, Science, 278, 12571266, 1997.
- Davis, J. C., and G. C. Bohling, The search for patterns in ice-core temperature curves, 2001, in L. C. Gerhard, W. E. Harrison, and B. M. Hanson, eds., Geological perspectives of global climate change, p. 213–229.
- GISP2 Ice Core Temperature and Accumulation Data. IGBP PAGES/World Data Center for Paleoclimatology Data Contribution Series #2004-013. NOAA/NGDC Paleoclimatology Program, Boulder CO, USA.
- Grosjean, M., Suter, P. J., Trachsel, M. and Wanner, H. 2007. Ice-borne prehistoric finds in the Swiss Alps reflect Holocene glacier fluctuations. J. Quaternary Sci.,Vol. 22 pp. 203–207. ISSN 0267-8179.
- Hansen, J., I. Fung, A. Lacis, D. Rind, Lebedeff, R. Ruedy, G. Russell, and P. Stone, 1988: Global climate changes as forecast by Goddard Institute for Space Studies three-dimensional model. J. Geophys. Res., 93, 9341-9364, doi:10.1029/88JD00231.
- Ljungqvist, F.C. 2009. N. Hemisphere Extra-Tropics 2,000yr Decadal Temperature Reconstruction. IGBP PAGES/World Data Center for Paleoclimatology Data Contribution Series # 2010-089. NOAA/NCDC Paleoclimatology Program, Boulder CO, USA.
- Ljungqvist, F.C. 2010. A new reconstruction of temperature variability in the extra-tropical Northern Hemisphere during the last two millennia. Geografiska Annaler: Physical Geography, Vol. 92 A(3), pp. 339-351, September 2010. DOI: 10.1111/j.1468-459.2010.00399.x
- Lovejoy, S., 2014: Scaling fluctuation analysis and statistical hypothesis testing of anthropogenic warming, Climate Dyn. DOI 10.1007/s00382-014-2128-2.
- MacFarling Meure, C., D. Etheridge, C. Trudinger, P. Steele, R. Langenfelds, T. van Ommen, A. Smith, and J. Elkins. 2006. The Law Dome CO2, CH4 and N2O Ice Core Records Extended to 2000 years BP. Geophysical Research Letters, Vol. 33, No. 14, L14810 10.1029/2006GL026152.
- Moberg, A., D.M. Sonechkin, K. Holmgren, N.M. Datsenko and W. Karlén. 2005. Highly variable Northern Hemisphere temperatures reconstructed from low-and high-resolution proxy data. Nature, Vol. 433, No. 7026, pp. 613-617, 10 February 2005.
- Instrumental Temperature Data from Hadley Centre / UEA CRU, NASA Goddard Institute for Space Studies and Berkeley Earth Surface Temperature Project via Wood for Trees.
Your point 3: “A totally unscientific and demistrabky wrong assessment of equilibrium climate sensitivity.”
Fix pronto, as there’s no point to read onwards from such illiteracy.
I wish I knew how to copy/paste that Hansen quote in one of your figures. To paraphrase, “How do change the past measurements to support ….. what?” “The direction I want politics to go”.?
A nice admission by Lovejoy, however:
“Their two most convincing arguments – that the warming is natural in origin, and that the computer models are wrong – are either directly contradicted by this analysis, or simply do not apply to it.”
So ‘deniers’ /do/ make convincing arguments!
Since there is nothing unusual in the current temperature situation that hasn’t already occurred during the MWP or the Roman warm period, how can you simply assert that now is human caused but the past warmth wasn’t ? It’s nonsense on the face of it. More fun with numbers for a compliant media.
The last diagram tells you pretty much everything you need to know about global warming.
Very interesting post, many thanks.
Your Figure 19 refers to the “Original Reference” as Alley 2000; however, his Figure 1 runs only from 16000 to 11000 years BP. Is your Figure 19, or the data on the last 11000 years, published anywhere?
Any surprise that geologists – government ones excepted – are the most sceptical group of all?
BEST has the usual modifications compared to original data, e.g. compared to what is shown in http://hidethedecline.eu/ for original temperature, sea ice, etc. data.
(It was headed by someone who presented himself as an unbiased skeptic but had published beforehand what showed himself to be a biased environmentalist, even if not everyone noticed that).
“I have a hunch that Henrik Svensmark is on the right track and that the Sun, the stars and cyclical variations in cloud cover and albedo are the answer.”
Indeed, and they explain history from the LIA to the global warming “pause,” as in my usual compilation of illustrations in http://tinyurl.com/nbnh7hq .
Good effort.
I think the fact that Lovejoy feels that he needs to take a stab at skeptics in the press reveals someone who is unprofessional and driven by politics.
There is nothing worse than a “scientist” who is driven by politics. Its an oxymoron.
1) Even if they have a good idea it becomes diminished by the fact they’re advocating..
2)They rarely have any good ideas
“Geologists tend to try to figure out what happened before trying to draw conclusions about why it happened.” So true.
If the conclusions of the Lovejoy paper were true in reality, he would have no need to write the idiotic paper.
Lovejoy’s trash talking would put Mohammed Ali to shame.
Mainstream physics tells us that there is a propensity towards thermodynamic equilibrium. The law that tells us this is the poorly understood Second Law of Thermodynamics. Yes, there is a corollary to that law which applies in a non-gravitational field, namely that heat transfer is from hot to cold in a non-gravitational field, or in a horizontal plane in a gravitational field.
Thermodynamic equilibrium does not imply isothermal conditions in a gravitational field, as Dr Roy Spencer thinks.
The state of thermodynamic equilibrium in a gravitational field has a thermal gradient which evolves at the molecular level and more than explains all that “33 degrees of warming.” This autonomous temperature gradient would cause surface temperatures (which are supported by the temperature at the base of the troposphere) to be at least 40 degrees higher in dry regions. But instead, water vapor plays a part in reducing the temperature gradient and keeping us cooler, just like carbon dioxide would if it had any noticeable effect at all, but it doesn’t.
People like Dr Roy Spencer openly claim that “greenhouse gases” (like water vapor) raise the temperature in the lower troposphere and lower the temperature in the upper troposphere. This would be a steeper “lapse rate” supposedly due to water vapor. What a joke!
mikegeo asks rhetorically April 27, 2014 at 2:38 pm
…, how can you simply assert that now is human caused but the past warmth wasn’t ?
Of course they cannot. This is the ultimate lie behind the biggest scam in history.
I personally think that some of these “scientists” should be prosecuted for fraud, but it will take more time for the fraud to be exposed. There is just no way that these people can honestly believe what they publish.
Alex Hamilton, convection does not exist without gravity, so there is no need to go further. Due to gravity, there is convection and therefore no isothermality.
Sorry but there is no periodic behaviour.
Gunga Din, try this webpage: http://projectnaptha.com/
“…you can highlight as well as copy and paste and even edit and translate the text formerly trapped within an image.”
“So, anyone who insists that climate cycles aren’t true oscillations, please pretend that I am using the phrase, “quasi-periodic fluctuations” rather than cycles or oscillations.”
It is the fault of people like Lovejoy and all who push the fairy tale of “consensus science” that you have to include your disclaimer. Among scientists, it is understood that Mother Nature’s cycles rarely show strict periodicity.
Your work is clear, concise, and the to the point. Good job.
It is hard to take seriously the work of a scientist who would say “This study will be a blow to any remaining climate-change deniers…”
NZ Willy says:
April 27, 2014 at 2:04 pm
A little harsh, no? It is obvious at a glance the right hand was simply shifted one key left on the keyboard.
gary
Chuck L says:
April 27, 2014 at 4:50 pm
It is hard to take seriously the work of a scientist who would say “This study will be a blow to any remaining climate-change deniers…”
It was a blow. It is very depressing that work like Lovejoy’s find support among mainstream climate scientists. And any editor worth his/her salt would have insisted on deleting Lovejoy’s vituperative comment.
NZ Willy says:
April 27, 2014 at 2:04 pm
Classic stringer – can’t see the forest if a single tree is out of place. Tremendously frustrating to groupers as even the best ideas are dismissed for the lack of a single dot or cross.
A really simple test. Is the RATE of warmer higher before 1945 or after 1945. The answer is before 1945.
http://sunshinehours.wordpress.com/2014/04/15/could-co2-have-lowered-the-rate-of-natural-warming/
http://sunshinehours.wordpress.com/2014/04/17/could-co2-have-lowered-the-rate-of-natural-warming-in-the-oceans/
I also fat-fingered a couple of extra periods… I wrote this post on my phone. If you find any more typos, please don hesitate to be an qwwy8o2 about the as well.
[T’was fixed. Mod]
The data are available from NOAA’s paleoclimatology library. They ask that the original reference be cited when using the data. I will try to remember to post the link in a comment tomorrow.
A long career in Geochemistry sits neatly with each one of your conclusions, David M.
Especially agree with the comment on layered sedimentology and repetitive processes.
Will a screencap suffice?
http://i90.photobucket.com/albums/k247/dhm1353/Hansen.png
A litle bit of Stratigraphy & Sedimentology can go a long way… 🙂
Robert of Ottawa says:
April 27, 2014 at 4:11 pm
Alex Hamilton, convection does not exist without gravity, so there is no need to go further.
Furthermore, gravity is present everywhere.
“Nothing in Earth Science is 99% certain.” Well, it is 99% certain that it is 99% BS.
Yet another solid deconstruction of the über-lame Lovejoy paper.
Well, I suppose Lovejoy will get the grant he’s obviously trolling for [“This study will be a blow to any remaining climate-change deniers…”]. But it won’t add anything to the scientific knowledge base.
Heck, all the CAGW religious have is their flat-earth belief in a linear CO2 straight-to-a-graphy……
I just had a look at the Lovejoy paper. Correct me if I’m wrong, but I believe if he spent 4 hours observing: a) the flow rate of the Thames River and b) the rising water level at Greenwich as the tide was making, he could use this methodology to conclude with 99% certainty that the rising water level was caused by water coming down the river.
To analyse causation, you need to consider counterfactuals (see for example papers and books by Pearl) but Lovejoy has not done that. He could have done that by looking at temperature trends and human generation of CO2 at other periods in history.
The publication of this nonsense says as much about peer reviewers as it does about Lovejoy.
Terrific article and very useful graphics. Have bookmarked this for future use.
Add satellite data to Figure 2 to show the difference between BEST temps and satellite temps in the industrial era. Satellite data start in 1979.
http://www.woodfortrees.org/plot/best/scale:3/plot/rss-land
Question: Why do BEST temps and satellite temps diverge????\
Answer: BEST temps are wrong. There is no global warming.
I’m not as technical as most of the commenters to this site. I have learned a lot by reading the questions, criticism and explanations… so… thanks!
It seems to me Lovejoy commits some obvious mistakes:
1) His “proof” is a single climate variable, CO2, correlating to temperature. Correlation is not proof.
2) He seems to focus on 1880-, which is a very small and very cherry picked amount of time.
3) The temperature dataset he uses, shows 1998 as being warmer than 1930. This is a bogus data set.
WRT #1 This is similar to nutrition science when most “studies” are simply correlations and thus meaningless. One famous correlation that wasn’t meaningless was the one that showed smokers had a 20x greater chance of cancer. How much stronger than other correlations to temperature is CO2?
WRT #2 I see 1500- and 0- mentioned, but where are they on graph 3.a?
WRT #3 Temperature datasets confuse me. I can’t tell how many there are, what thermometers go into which one, and what math is being performed to stitch, smooth, and fill in. I love the sea ice page. I love the solar page. How about a temperature dataset page!?!?!?!?
Lovejoy boasts that ““This study will be a blow to any remaining climate-change deniers.Their two most convincing arguments – that the warming is natural in origin, and that the computer models are wrong – are either directly contradicted by this analysis, or simply do not apply to it.” First, he has a nerve to generalize about deniers because he is just setting up a straw man to knock them down. Fortunately he chooses to use carbon dioxide as a causative agent which is easy to smash. First, carbon dioxide as the root cause of all global warming started its career with Hansen’s talk to the Senate in 1988. Hansen showed a rising temperature chart from 1880 to 1988. Its high point in 1988 represented the warmest point within the last 100 years, he said. There was only a 1 percent chance that this could have happened by chance alone. And since it ruled out chance it was proof that the greenhouse effect had been detected. No one ever checked his science and on the strength of his presentation IPCC was started up that same year. But if you check out his hundred year warming curve you find that it includes the early century warming from 1910 to 1940. Under no circumstances can this warming be used to support greenhouse theory. There was no parallel increase of atmospheric carbon dioxide in 1910 when it started. This rules out greenhouse warming by the radiation laws of physics. And carbon dioxide was not removed from the air in 1940, the only way you can stop greenhouse warming. Clearly, we have to take off the part of his 100 year warming curve earlier than 1940. That lops off sixty of those 100 years. What is left is a see-saw, 25 years of cooling followed by 23 years of warming. No way does this amount to proof of the existence of the greenhouse effect. But the IPCC nevertheless followed him and still follows him. Venerating the emperor’s new clothes, no doubt. If you want to do real climate science, you have to give up carbon dioxide as a causative agent. Lovejoy has chosen the emperor, however, and is marching along, wondering why the emperor has chosen such fancy clothes to show his subjects.
David Middleton
My guess is the millennial climate cycle is related to or driven by the thermohaline circulation which has a cycle time of 1,000 years.
RACookPE1978 says:
April 27, 2014 at 6:46 pm
… belief in a linear CO2 straight-to-a-graphy……
>>>>>>>>>>>>>>>>>
LOL
Chuck L says:
April 27, 2014 at 4:50 pm
It is hard to take seriously the work of a scientist who would say “This study will be a blow to any remaining climate-change deniers…”
From Theo,
“It was a blow. It is very depressing that work like Lovejoy’s find support among mainstream climate scientists. And any editor worth his/her salt would have insisted on deleting “Lovejoy’s vituperative comment”
Dang , a couple of thoughts ahead of me.
I have offered an entirely different critique of Lovejoy’s piece, one that, like his work, does not depend in any detailed way on climate science theory, merely on the statistical argument:
http://daviddfriedman.blogspot.com/2014/04/two-problems-with-1-claim.html
and
http://daviddfriedman.blogspot.com/2014/04/agw-considered-as-black-swan.html
In null hypothesis testing we always make the dual assumption that the null hypothesis is true and the data are randomly sampled. In this case we may reject the latter at an one percent significance level. In stead of saying that his study is a blow for the skeptics, Lovejoy should show that his data were randomly sampled from the whole period considered.
I am no statistician, but it seems to me that Lovejoy is making nothing more than the most trivial of arguments – that if the variability of recent changes is not natural, then it is probably not natural.
To “prove” that it is not natural, he simply excludes what he thinks is not natural from the data set that he uses for assessing what is natural.
But to do that, he has to prove that the data set that he says is natural contains all possible natural variation – but he has simply not proven that is the case.
Making a 95% certainty claim when your fundamental assumption is utterly unproven is just ludicrous – unless you are claiming an utterly trivial result.
Lovejoys paper is an embarrassment to professional geologists. I predict the paper will be retracted within the year.
“This study will be a blow to any remaining climate-change deniers…”
As mentioned by others, scientists shouldn’t use language like this. It is offensive, and also stupid. From this language, it’s obvious that this person is heavily biased, and his research cannot be relied upon.
There are plenty of sceptics here at WUWT, including myself, but I doubt if there’s a single ‘climate change denier’. Of course, a major sceptical argument is that the climate is always changing (though the last 17.5 years seems to be a bit of an exception).
Ironically, the straight part of the hockey stick is, in essence, a perfect example of real climate change denial.
Chris
There used to be a TV series about a dodgy antiques dealer called Lovejoy.
I wonder if this one is any relation…
Simple solution: don’t write posts on your phone, and then not be diligent about proofreading.
Some of these climatologists are funny people. It’s the only discipline in science that you are apparently allowed to make grand sweeping statements, e.g. “the warming cannot be natural.” Are these climatologists actually claiming to be experts in oceanography, atmospheric physics, meteorology, solar physics, botany, microbiology, and paleoclimatology? Here I am thinking that they were C-rate scientists, but now I see they are super special.
Here is Lovejoy’s explanation of how natural variability has had nothing to do with modern warming, “there is a general consensus that in the recent epoch (here, since 1880) that anthropogenic radiative forcings have dominated natural ones so that solar and volcanic forcings and changes in land use are relatively unimportant in explaining the overall warming (My unfathomable knowledge of the cosmos, 2014).” I added that citation but I can only imagine that it is Lovejoy’s source of this knowledge since he didn’t cite a source on this claim. Perhaps someday we will all be lucky enough to find out how they can make such claims or how this type of language makes it through peer review.
Demetrios Koutsiyannis addressed the problem with statistical analyses previously, both on this site and on “Climate Audit” . Here’s a link to one of his papers.
http://itia.ntua.gr/getfile/849/3/documents/2008EGU_HurstClimatePrSm.pdf
Rainfall, and temperatures, follow a “Hurst-Kolmogorov” distribution rather than a normal distribution. I See Lovejoy was using a normal distribution usning century scales:
“..We statistically formulate
the hypothesis of warming through natural variability by using centennial scale probabilities of natural fluctuations estimated using scaling, fluctuation analysis on multiproxy data. …”
As Koutsiyannis pointed out, anyone who uses a “normal” distribution over ANY timescale is going to be hit by surprising large fluctuations in flooding, drought, etc.
“Long Term Capital Management” tried to cash in on stock market fluctuations using a ‘Normal’ distribution. They didn’t last long term- they quickly went broke when the real world demonstrated a “Hurst” type fluctuation.
There’s a real simple computation that shows natural variability at double the amplitude of CO2. The trend from 1979-2005 during the +PDO was .16C/decade. The cooling from 2005 until present during the -PDO was -.06C/decade. This gives us two equations with two unknowns if we assume the natural variation is equal and opposite.
1) X + Y = .16
2) X – Y = -.06 => X = Y – .06
Substituting for X in 1): Y – .06 + Y = .16 => 2Y = .22 => Y = .11
Substituting for result in 1): X + .11 = .16 => X = .05
This tells us the value of man-made warming is .05C/decade while the value of the PDO yields ± .11C/decade. Of course there are lots of assumptions in this simple calculation. OTOH, it’s probably as good if not better than what Lovejoy did.
The computer models are fine. It’s reality that’s wrong.