…then why do the vertical mean temperature anomalies (NODC 0-2000 meter data) of the Pacific Ocean as a whole and of the North Atlantic fail to show any warming over the past decade, a period when ARGO floats have measured subsurface temperatures, providing reasonably complete coverage of the global oceans? See Figure 1. Or, in other words, why is the warming of the global oceans (0-2000 meters) over the past 10 years limited to the Indian and South Atlantic Oceans, when carbon dioxide is said to be a well-mixed greenhouse gas, meaning all ocean basins should be warming?

Figure 1
Or, to look at it in yet another way, we’re being told that, while surface temperatures are no longer warming, the oceans to depth continue to warm…yet the warming is not occurring in the largest ocean basin, the Pacific, and the North Atlantic is showing evidence of cooling.
Additionally, Kevin Trenberth and associates say the recent series of La Niña events are causing the Pacific Ocean to warm at depths below 700 meters, and as a result, global warming continues. See:
Why then has the annual vertical mean temperatures of the Pacific Ocean (0-2000 meters) failed to show any warming over the past decade? The data for the Pacific Ocean (0-700 meters, 0-2000 meters and 700-2000 meters) in Figure 2 reveals something different than portrayed by Trenberth and associates.
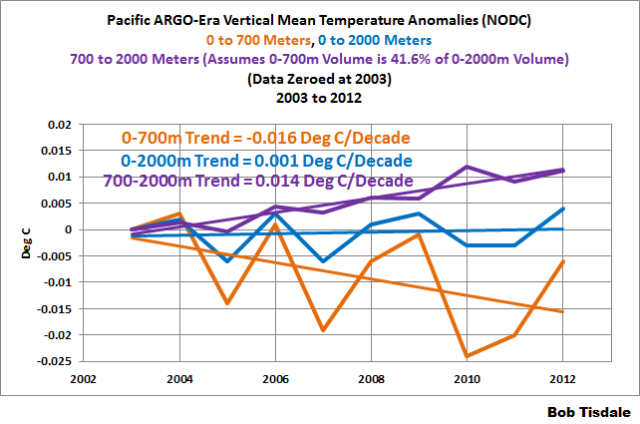
Figure 2
The data for the Pacific indicates that any warming at 700-2000 meters has simply opposed the cooling taking place in the top 700 meters. (Note: The basis for the temperature anomalies at the depths of 700-2000 meters is discussed in the post here.)
 No wonder Trenberth had to use a reanalysis (instead of data) for his recent batch of “hey, I kinda-sorta found the missing heat” papers.
When the data doesn’t meet the climate model-based expectations of the climate science community, the climate science community adjusts the data. Then, when the adjusted data doesn’t meet the climate model-based expectations of the climate science community, the climate science community discards the data and uses the output of another computer model called a reanalysis. Bottom line: instead of admitting the hypothesis of human-induced global warming is fatally flawed, they perpetuate a myth.
A QUICK NOTE ABOUT THE VERTICAL MEAN TEMPERATURE DATA
The NODC’s vertical mean temperature data are the temperature component of their ocean heat content data. The other portion is salinity.
ADDITIONAL READING
Ocean heat content data, and the components that are part of it, are questionable at best, contrived at worst. For further information see:
- Is Ocean Heat Content Data All It’s Stacked Up to Be? (The WattsUpWithThat cross post is here.)
- NODC’s Pentadal Ocean Heat Content (0 to 2000m) Creates Warming That Doesn’t Exist in the Annual Data – A Lot of Warming (The WattsUpWithThat cross post is here.)
- A Different Perspective on Trenberth’s Missing Heat: The Warming of the Global Oceans (0 to 2000 Meters) in Deg C (The WattsUpWithThat cross post is here.)
- Rough Estimate of the Annual Changes in Ocean Temperatures from 700 to 2000 Meters Based on NODC Data (The WattsUpWithThat cross post is here.)
- AMAZING: The IPCC May Have Provided Realistic Presentations of Ocean Heat Content Source Data (The WattsUpWithThat cross post is here.)
- Comments on Stefan Rahmstorf’s Post at RealClimate “What ocean heating reveals about global warming” (The WattsUpWithThat cross post is here.)
- Trenberth and Fasullo Try to Keep the Fantasy Alive (The WattsUpWithThat cross post is here.)
- More on Trenberth and Fasullo (2013) “An Apparent Hiatus in Global Warming?” (The WattsUpWithThat cross post is here.)
between an “observed” 0.01 – 0.069 deg C/decade change – where do those figures sit with respect to the error bars of the measurement devices Bob?
Isn’t it great when reality kicks ’em in the butte.
Thanks Bob.
Easy! It’s not happening (Outside computer games)!
The warming as always is hiding where it can not be measured. Satellites and Argo were the big weapons of proof of man made catastrophic warming. Bad call on the true believers part as this data is harder to fudge, with a big audience watching. Been a wild ride watching the bretheren squirm as their prophecies of doom fail. Now that the knife is inserted please keep twisting it Mr Tisdale.
How come I still don’t understand this? Did I sleep at that point in time in school when the teacher told it? I always had the understanding that cold water is heavy r then warm water. So how could warm water sink under cold water?
It comes to it that they go explain that if you put a pan of boiling water on the stove and turn the stove on and put a raw egg in the water that at the time the water is frozen the egg will be boil d and all the heat is in the egg hands the water become frozen solid.
Ronald says: “How come I still don’t understand this? Did I sleep at that point in time in school when the teacher told it? I always had the understanding that cold water is heavy r then warm water. So how could warm water sink under cold water?”
Ronald, you’re thinking in absolute temperatures, but I’ve presented anomalies.
Any idea why the Indian and South Atlantic are warming and the rest not? Volcanic chains?
I love the smell of alarmist desperation in the morning. Or any other time really.
Hundreths and thousands of a degree C ????
Give me a break.
Anybody who thinks the unreplicated, uncalibrated, non-random, more-precise-than-the-limits-of-observation measurements have this degree of precision and error is a fool. It is very doubtful that the central limit theorem applies to this kind of crap-data since the assumptions are likely false, as usual.
AleaJactaEst says: “between an ‘observed’ 0.01 – 0.069 deg C/decade change – where do those figures sit with respect to the error bars of the measurement devices Bob?”
A brief overview of the ARGO float accuracies are here:
http://www.argo.ucsd.edu/FAQ.html#accurate
BioBob says: “Hundreths and thousands of a degree C ????”
Those hundredths and thousandths of a deg C aren’t coming back to haunt anyone at any time.
Almost the same as with religion and God. First he was in heaven, but when we got space rockets and telescopes he ended up in our minds instead.
I think that’s where CAGW also will ends up some day. In the minds of followers and believers?
What’s the last thing that goes trough a insects brain when it hits the windshield of a car?
A nice proof that the oceans have cycles, even at depth and at different depths. If the oceans have cycles, they can influence the surface temperatures to have cycles as well.
So, GHGs producing an ever increasing ocean heat accumulation everywhere the same or internal Thermohaline Ocean Circulation system dynamics which can provide varying levels of cooling or heating in different regions depending on its internal dynamics.
The data for the North Atlantic down to 400 metres even goes back to 1900. The red and the blue lines here (looks like an AMO cycle).
http://s14.postimg.org/dq96zg4b5/North_Atlantic_Temp_400m_01.jpg
And then one of only two studies looking at ocean temperatures all the way to the bottom, the North Atlantic is cooling below 700 metres to the bottom.
http://www.nature.com/ngeo/journal/v5/n12/images/ngeo1639-f1.jpg
Bob Tisdale says:
December 19, 2013 at 3:39 am
AleaJactaEst says: “between an ‘observed’ 0.01 – 0.069 deg C/decade change – where do those figures sit with respect to the error bars of the measurement devices Bob?”
A brief overview of the ARGO float accuracies are here:
http://www.argo.ucsd.edu/FAQ.html#accurate
=====================================================================
Good review, Bob. Maybe all the heat isn’t hiding in the ocean, but in the Arctic where there are no monitoring stations.
They claim +/- 0.005°C accuracy but don’t mention precision/reproducibility. The two are quite often confused.
That allegedly reputable scientists are getting away with in effect saying, “No!, we really meant it’s over there!” to explain the failure of their predictions is amazing.
tiny percentages can cause a catastrophic collapse of the carbon dioxide trading scheme!
19 Dec: Bloomberg: EU Emission Slump Tests Broker Survival Skills: Carbon & Climate
As middlemen from ICAP Plc (IAP) to GFI Group Inc. (GFIG) lost ground to regulated bourses, fees dropped to as low as 0.5 euro-cent (0.69 U.S. cent) a metric ton from 20 cents a decade ago, said Andy Ager, the head of carbon at Vertis Environmental Finance Plc in Budapest…
“With the collapse in prices, the carbon market has become a virtual tax,” Meyrick said. “People don’t trade taxes. The side effects of low prices include that trading and broking desks are closing.”
http://www.bloomberg.com/news/2013-12-19/eu-emission-slump-tests-broker-survival-skills-carbon-climate.html
They’re running out of hiding places.
BioBob says:
December 19, 2013 at 3:37 am
Totally agree, measuring global temperatures, ocean temperatures, & land surface temperatures, the rates of warming per decade & per century, to a thousandth of degree is just plain ludicrous! Only a precision engineer would work to such accuracy, if they could at all!
Sorry, Bob T., but if you agree with bullcrap claims that field observation float accuracy of .005, I have a bridge …. By definition, you have one unreplicated, non-random, field observation measurement per unit time per area comparable in size to many states. The floats follow currents, which are probably NOT random since large areas of ocean are not measured, and floats may remain in the same mass of water moved by current, etc
1) normal distribution of observations – FAIL N = 1
2) The data must be sampled randomly – FAIL
3) The sample values must be independent of each other – UNKNOWN, but likely FAIL
4) When the sample is drawn without replacement (usually the case), the sample size, n, should be no more than 10% of the population – NO PROBLEMO (N = 1)
5) The sample size must be sufficiently large – FAIL N = 1 (each separate observation is from a population of temperatures that NEVER can be considered the SAME ~ chaos)
I have no issue with the use of Argo for anecdotal observation, but as a basis for statistical analysis eg time series, etc, EPIC FAIL If we are going to bother, lets do it right for a change. N = 30 replicated & random would be about right.
Original for journeymen: “Bottom line: instead of admitting the hypothesis of human-induced global warming is fatally flawed, they perpetuate a myth.”
Translation for laymen: “Bottom line: instead of admitting the hypothesis of human-induced global warming is fatally flawed, they perpetuate a myth, criminally.”
Some of us miss the significance of the claim of the warming hiding in the oceans. Since the Argo system is still very new, they are merely moving the goal posts out past the atmosphere warming halt. They again turn the Null Hypothesis on its head and demand others prove that it is not warming. With no data to support either conclusion at this time (10 years does not a climate make).
There can be no missing heat hiding in the Trenberthian depths. The problem here is not how such heat managed to sneak past 3000 Argo bouys over 700m of ocean. The problem is that the “missing heat” cannot even sneak past the first 10 microns of the oceans skin evaporation layer. Incident LWIR cannot heat nor slow the cooling rate of liquid water that is free to evaporativly cool.
I could suggest other places for Dr. Trenberth to search for his “missing heat”, but I suspect he already has his head in the most likely location.
Any theory that invents unobservables is in serious trouble.
However, the history of belief in such unobservables, as a substitute for abandoning the theory, does not give one great confidence. In several notable instances, generations of scientists have lived and died before the old dogma is overthrown …
The problem with Argo data is that it suffers from the the experimenter expectation effect. When Argo was first released it showed cooling, which was contrary to what the experimenters believed they would see. So they identified those floats that showed cooling and eliminated their data.
However, this assumes that only cooling errors occur. In real life floats will randomly read high or low, so if you eliminate errors you should expect to see nearly equal numbers of high and low reading floats eliminated. Since only mostly low floats were eliminated, the experimenters introduced bias based on their beliefs.
The end result is that Argo is much less accurate than statistics would indicate, due to the selective elimination of low reading floats. Had Argo been conducted on a scientific basis, then elimination of data should have been done using double blind controls, to prevent experimenter bias from contaminating the corrections. This was not done, meaning that Argo data cannot be relied upon to provide an unbiased report of ocean temperatures.
NODC has updated the Argo temperature profile figures for the third quarter of 2013. In the third quarter versus the second quarter, temps changed as follows:
Temps in the 0-2000 metre ocean average declined by -0.004C;
Temps in the 0-700 metre ocean declined by -0.008C;
Temps in the 0-100 metre ocean increased by +0.032C
North Atlantic sea surface temperature (SST) has been following the geo-tectonic trends for at least 120 years. Even more strange is that the AMO (the de-trended NA SST ) is directly correlated to the solar-terrestrial magnetic variability
http://www.vukcevic.talktalk.net/NA.htm
Anomalies are nice but not the point. Heat is sitting in the ocean and heat is temperature just like cold and every thing in between. So warm water is heat and that cant go under cold water because of it being lighter than cold water. By giving it a fancy name it masks the problem of the case. And by doing so they cane take it a way from reality.
Ronald says:
So how could warm water sink under cold water?
Sea surface is warmed by sun, evaporation makes it salty and as such warm water becomes heavier than less saline cold water. In vicinity of Iceland these warm waters sink to a depth of 2000m or more. In the Arctic Ocean all warm water currents circulate below cold fresh water currents
It cannot be repeated often enough:
Climate change is difficult to observe on short timescales – and a decade is still a short time in this sense. The natural variations are just too big. But over longer timescales the climate is still very much within a warming trend that all the models predicted correctly(IPCC: FAR; SAR; TAR, and AR4,..).
Face it.
So show us longer term graphs of say 40 years or so and one can start to analyse a trend.
More details can be found here
http://www.realclimate.org/index.php/archives/2013/12/the-global-temperature-jigsaw
Scuzza Man (@ScuzzaMan) says:
December 19, 2013 at 4:45 am
Any theory that invents unobservables is in serious trouble.
===============
dark matter and dark energy for example.
Our observations of distant objects do not match the predictions. Therefore there must exist dark matter and dark energy affecting the observations. It is not possible that our predictions are wrong because our theories are wrong. The only possibility is that something unseen is affecting our observations.
This illogical thinking, the belief that theories are right and there is something hidden affecting the observations, defies Occams Razor. The simplest explanation is that the theories are wrong.
So now we have unexplained warming in the late 20th century. This is proof that GHG warming exists. Yet we have 300 years of unexplained warming since the Little Ice Age, which is taken to be proof of nothing.
Bob,
You say that “Kevin Trenberth and associates say the recent series of La Niña events are causing the Pacific Ocean to warm at depths below 700 meters”.
Looking at your derived analysis of the 700-2000m depth temperatures, it would appear you are proving Trenberth to be correct, with a cooling surface and warming ocean underlayer. Is my understanding correct?
Correct me if I am wrong,from my understanding of Trenberth’s analysis, I think that the warming down to 2000m is insufficient to account for the anticipated energy imbalance, and hence it is hypothesised that the warming is also taking place at depths below 2000m?
Hello Bob – very useful post, as always….and thanks for the links to the papers, it can take ages to track these things beyond the paywall. Here is the problem laid bare – from Meehl,2013:
‘Suggestions that significant heat could be sequestered in the deep ocean below 700 m on decadal timescales (e.g. Purkey and Johnson, 2010; Song and Colberg, 2011; Palmer et al., 2011; Levitus et al., 2012) prompted an analysis of a global coupled climate model which showed that, during hiatus decades in the model, the deep ocean layers DID INDEED WARM at a greater rate than the surface layers (Meehl et al., 2011). – MY EMPHASIS
The modellers come to BELIEVE that computer virtual reality is BETTER than plain ordinary data-driven but tricky reality…..here Meehl confirms his hypothesis not by data but by a model, and seems incapable of seeing that this is not actually science! Indeed, it is BETTER than science!
I have been trying to track the machinations of this heat budget thing: first – the TOA imbalance is not data driven, because the actual data show an impossible imbalance of 5 watts per square metre. This value has to be either adjusted, or the whole data set rendered useless for absolute values (though still useful for mapping annual and regional variability) – and NASA’s website proudly states that this value is ‘constrained’ by the ocean heat budget measurements. The final value for TOA is given as about 0.5 watts/square metre. BUT when I go to the ocean data merchants, they have a similar story where the inadequate heat content data is adjusted to reflect the TOA excess that everybody just knows must be there (because of…you know the story!)
I would like to see a lot more attention given to the CO2/GHG line-by-line computer codes that calculate the expected imbalance at the TOA….these are hardly ever mentioned, but that is where the models derive their inputs before the feedbacks get to work. It is from these codes that the mid-troposphere hotspot was expected – so they can obviously be faulty. Interestingly, if you look at the surface expectation you get about 1 watt/square metre from CO2 longwave, and 0.5 watts per square metre REDUCTION of short wave…..because the extra CO2 in the atmospheric column ABSORBS some short-wave radiation. That seems important to my perhaps overly simplistic biologist’s mind….less energy to heat the ocean beneath the surface, and this eventually reduces the long wave flux….so theoretically, as CO2 increases, a cooling could set in.
Is anyone out there scrutinising the codes for CO2 in watts per square metre at different altitudes? I know the programme was updated by the European Space Agency (HIGHTRANS) and before that some obscure USAAF outfit generated the data (MODTRANS). This is really at the heart of all the uncertainty – and why the models consistently fail? It is not just that they get the feedbacks and natural variability wrong….there is a fault in the engine room and the main driver.
Ronald says: “Anomalies are nice but not the point.”
Actually, anomalies are the point. For example, let’s say that the average temperature of the Pacific Ocean for the depths of 0-700 meters is about 15 deg C, and that at the depths of 700-2000 meters it’s 5 deg C. Looking at Figure 2, for the example, the 15 deg C temperature at 0-700 meters cooled by about 0.016 and the 5 deg C temperature at 700-2000 meters warmed about the same. The temperature at deeper depths are still cooler.
“…. why is the warming of the global oceans (0-2000 meters) over the past 10 years limited to the Indian and South Atlantic Oceans, when carbon dioxide is said to be a well-mixed greenhouse gas, meaning all ocean basins should be warming?”
I’m not sure that anyone has claimed that ocean temperatures should rise in lock-step with CO2 concentrations? Indeed, this seems most unlikely given what is known about the long term nature of global thermohaline circulation patterns, etc.
The NOAA global data provided show that *global* annual vertical mean ocean temperature (2003 to 2012) for 0 – 2000 metres warmed at a rate of 0.02 deg C per. What explanation for that observation do we have?
Sorry, above post should be 0.02 deg. C per ‘decade’.
Jon says “Almost the same as with religion and God. First he was in heaven, but when we got space rockets and telescopes he ended up in our minds instead.
I think that’s where CAGW also will ends up some day. In the minds of followers and believers?”
Christians do not claim Heaven exists in this Earthly realm in the sky.
‘God does not exist in this dimension at an arbitrary altitude therefore he does not exist’ is fallacious. That is the argument from ignorance.
CAGW is already solely in the minds of believers as CAGW has been proven to be false based on preset physical and logical parameters. God due to the lack of definition/defined parameters and philosophical complexity is impossible to disprove.
There is no doubting that CAGW is a religion though.
All of these discussions sound to me like they led by well-skilled practicioners of three card monte playing their version of “Find the Heat.”
Hi Bob, thanks for the great post. I’m curious as to how the low layers warm but the top ones do not. The only conceivable way as far as I’m concerned is for the conveyor belt systems to gain more input at the equatorial regions. Surely then this would mean that there would be increased water evaporation in those equatorial regions and the tropospheric hotspot would start to appear…which it hasn’t.
I apologise if it’s a stupid question and I’m barking up the wrong Bristlecone proxy pine tree.
Thanks Bob. Timely article for me as I was revisiting ocean rise and ocean energy related material anyway. Much appreciated.
sabretruthtiger says: “Hi Bob, thanks for the great post. I’m curious as to how the low layers warm but the top ones do not.”
If you’ll allow me, I’d like to simply send you to a post from a few weeks ago where we discussed this. It’s under the heading of “BEAM ME UP, SCOTTY!” (which is a repeat of Rahmstorf’s heading):
http://bobtisdale.wordpress.com/2013/11/12/comments-on-stefan-rahmstorfs-post-at-realclimate-what-ocean-heating-reveals-about-global-warming/
Regards
TSI is one main reason.
My bet is the cooling trend has started and will continue with the TSI in the gutter.
https://twitter.com/NJSnowFan/status/413671593760403457/photo/1
dwr54 says: ‘The NOAA global data provided show that *global* annual vertical mean ocean temperature (2003 to 2012) for 0 – 2000 metres warmed at a rate of 0.02 deg C per [decade]. What explanation for that observation do we have?”
Looking at Figure 1, the only two ocean basins that warmed were the South Atlantic and the Indian Oceans.
Part of the warming of the Indian Ocean appears to be ENSO related. The following graph is of Indian Ocean ocean heat content (NODC 0-700 meters) downloaded from the KNMI Climate Explorer:
http://bobtisdale.files.wordpress.com/2013/03/20-argo-era-indian-ohc-v-nino3-4.png
It suggests that the Indian Ocean warms to depths of 700 meters in response to El Ninos, but does not cool proportionally in response to La NInas.
The graph is Figure 20 from the “stacked up to be” post:
http://bobtisdale.wordpress.com/2013/03/11/is-ocean-heat-content-data-all-its-stacked-up-to-be/
Regards
I am confused. Is Kevin Trenberth part of John Cook’s 97%? Does Trenberth believe that Global Land Temperatures have gone up over the last decade? If not, does Cook’s consensus include the global land temperature plateau? Is it now the consensus that land temperatures have been flat for a decade plus?
The density of water is a non-linear function of temperature (and salinity).
Pure water is at its most-dense around 4⁰C at near-enough 1.0000 kg/litre. At 0⁰C, nominal freezing point for pure water, its density is 0.9997 kg/litre.
Consequentially; the temperature of the water bewlow the deep ocean thermocline is 4⁰C. If the oceans wheren’t convecting, one could measure the heating of the oceans indirectly by the depth of the thermocline; as the average temperature rises, the thermocline goes deeper and vice versa.
So, contrary to what some speculate, the heat can’t hide in the deep oceans below the thermocline. The warmer water inevitably ends up above it; defining the depth of the thermocline.
I believe atmospheric CO2 concentration influence on temperature has nothing to do with the fact that different oceans change their temperature at different rates. Exaggerated claims on either side are just wrong. Individual ocean bodies have differently arranged water streams, different supply of (ant-)arctic cold water, different supply of sun radiation, different volume, different mixing with other oceans. All these and many more factors affect how they warm up or cool down. We can always say that if CO2 wasn’t here, Pacific and North Atlantic would be cooling much more. Not that I think that statement is true, but these graphs don’t disprove it.
If you ask why did the average sea temperature not go up in the last decade, then my answer is that’s because chaotic systems tend to go up and down and a decade is a bit too short time span to draw conclusions.
However I dislike claims that deep sea temperature changes in hudredths of degrees are going to kill us in distant future and with full respect to Bob Tisdale’s knowledge and experience, I am not fond of these “proofs” which prove nothing as well.
As Bob’s graphs clearly show, the current pause in global temperature increases can be explained by recent Ocean surface temperature changes. Over the last 10 years, the Northern Hemisphere SST is declining, the Southern Hemisphere SST is flat, the North Atlantic Ocean SST and AMO are declining, the Pacific Ocean SST is flat and the North Pacific Ocean SST is declining. The PDO index is also declining but this is just a pattern change indicator and indicates that there is now more colder water at the eastern side of the Pacific than in the western or central part of the Pacific than we had 10 years ago. There are also fewer strong El Ninos. I don’t see another strong El Nino for some time yet. [3-4 years?] These factors all combined to keep the global temperatures flat and now slightly declining as they did 1880 to 1910 and again 1945-1975. The decline in global temperatures is likely to continue as ocean cycles tend to be long [65-70 years] http://www.woodfortrees.org/plot/hadcrut3gl/last:120/plot/hadcrut3gl/last:120/trend
Bob
Do you have a recent graph for north Pacific SST [ last 10 years ]?
With respect to November 2013 being the hottest November. Clearly this was an isolated and mostly a regional event that mostly happened in Russia and North Asia due to an extra high positive AO. United State’s November was 49 the warmest and most of North America had below normal temperatures
Bob and Willis have each given us an exremely powerful post in the last twenty four hours. Can’ t thank them enough for their efforts.
Sadly, blind belief in CAGW is already driving the UK down a calamitous path of high energy costs, deaths from fuel poverty and probable black-outs. To paraphrase John Maynard Keyne’s comment on stock markets, our leaders seem intent on remaining irrational for longer than the Nation will be able remain solvent.
In reply to:
“Or, in other words, why is the warming of the global oceans (0-2000 meters) over the past 10 years limited to the Indian and South Atlantic Oceans, when carbon dioxide is said to be a well-mixed greenhouse gas, meaning all ocean basins should be warming?” …. “Additionally, Kevin Trenberth and associates say the recent series of La Niña events are causing the Pacific Ocean to warm at depths below 700 meters, and as a result, global warming continues.
Why then has the annual vertical mean temperatures of the Pacific Ocean (0-2000 meters) failed to show any warming over the past decade? The data for the Pacific Ocean (0-700 meters, 0-2000 meters and 700-2000 meters) in Figure 2 reveals something different than portrayed by Trenberth and associates.”
Bravo maestro! Checkmate. You have presented significant unequivocal observational evidence to support the assertion that 1) the majority of the warming in the last 70 years is not due to the increase in atmospheric CO2 and 2) heat is not hiding in the oceans.
The following is a repeat and further support for that line of thought. As CO2 is more or less evenly distributed in the atmosphere the potential for CO2 warming is the same for all latitudes. The actual warming due to the increase CO2 is linearly dependent on the amount of long wave radiation at the latitude in question before the increase in CO2. (Al Gore’s little analogy infrared light bulbs are always turned on and should be distributed – the number of analogy light bulbs per square meter – based on the amount of long wave radiation that was emitted to space prior to the increase in atmospheric CO2.) As the most amount of long wave radiation that is emitted to space is in the tropics the most amount of warming due to the CO2 increase should have occurred in the tropics. That is not what is observed as shown in Bob Tisdale graph. The following is a peer reviewed paper that supports the above assertions.
http://bobtisdale.files.wordpress.com/2013/11/figure-72.png
http://arxiv.org/ftp/arxiv/papers/0809/0809.0581.pdf
“These effects do not have the signature associated with CO2 climate forcing. (William: This observation indicates something is fundamental incorrect with the IPCC models, likely negative feedback in the tropics due to increased or decreased planetary cloud cover to resist forcing). However, the data show a small underlying positive trend that is consistent with CO2 climate forcing with no-feedback. (William: This indicates a significant portion of the 20th century warming has due to something rather than CO2 forcing.)”
“These conclusions are contrary to the IPCC [2007] statement: “[M]ost of the observed increase in global average temperatures since the mid-20th century is very likely due to the observed increase in anthropogenic greenhouse gas concentrations.”
last section should have read: ‘for longer than the Nation will be able to remain solvent’
Ferdberple
” When Argo was first released it showed cooling, which was contrary to what the experimenters believed they would see. So they identified those floats that showed cooling and eliminated their data.”
That is an interesting suggestion and one I hadn’t heard before. Do you – or anyone else – have links for further reading?
I think it might be useful to look at the warming oceans in more detail. Break it down into grids. Where is it warming. It may not be warming everywhere. This could lead to a better understanding of the causes.
Haven’t you read the latest AGW papers? The ocean waters that absorb the heat from CO2 related warming, due to the specific isotope of carbon involved, sink to the bottom of the Ocean. There are numerous papers detailing how water heated this way is heaver and thus makes it more difficult to find. There is a clear indication of higher concentrations of this isotope in the ocean depths that increase at the same rate as the build up of anthropological CO2. /sarc off
herkimer says: “Do you have a recent graph for north Pacific SST [ last 10 years ]?”
Yup, a couple, but not necessarily limited to the last ten years.
Monthly North Pacific (0-65N) sea surface temperature anomalies through Nov 2013:
http://bobtisdale.files.wordpress.com/2013/12/10-n-pac.png
From the November update:
http://bobtisdale.wordpress.com/2013/12/10/november-2013-sea-surface-temperature-sst-anomaly-update/
Weekly extratropical North Pacific (24N-65N) sea surface temperature anomalies from Jan 3, 1990 to September 18, 2013:
http://bobtisdale.files.wordpress.com/2013/09/weekly-extratrop-no-pac.png
From the mid-September 2013 update:
http://bobtisdale.wordpress.com/2013/09/25/mid-september-2013-sea-surface-temperature-anomaly-update/
GHGs can’t warm the deep ocean directly ’cause their IR can’t penetrate significantly beyond the surface layer. GHG IR effects are manifested immediately as water-skin (or land) temp and evaporated water.
Only solar SW can affect water below the surface directly.
Is that ARGO data unadjusted. I have weird picture in my head, that they adjusted north atlantic in some point, because it showed cooling and computer models showed that cooling is impossible. In Finland FMI moves surfface temperature measurement places to warm spots, because trend shows cooling recently.
Short. Direct. To the point. Likely to be read in full and understood completely. Damning.
Excellent post, Bob.
Jon says:
December 19, 2013 at 3:54 am
What’s the last thing that goes trough a insects brain when it hits the windshield of a car?
If it’s head on it’s his a$$.
For those unaware of the Argo adjustments, here is the story.
http://earthobservatory.nasa.gov/Features/OceanCooling/page1.php
In reply to:
@njsnowfan says:
December 19, 2013 at 6:25 am
TSI is one main reason.
My bet is the cooling trend has started and will continue with the TSI in the gutter.
http://www.woodfortrees.org/plot/pmod/from:1970
William:
Mon Dieu! Where is Lief? Who turned off the sun? The significant reduction in TSI is an important issue and should either have its own thread or should be brought up in the next solar thread. The solar presentation at the AGU annual conference noted that solar UV radiation was down 20%.
TSI (total solar irradiation) is down roughly 1.5 watts/meter^2 from past cycles. P.S. The 1.5 watts/meter^2 is not averaged out over the entire surface of the earth, as there is night and day and the earth is a sphere the 1.5 watts/meter^2 is reduced to roughly 0.4 watts/meter^2 averaged over the surface of the planet as compared to the theoretical warming due to the increase in atmospheric CO2 of 1.5 watts/meter^2.
I don’t think there is any issue with deep water warming while surface doesn’t.
If you consider that the entire ocean is still recovering from the depressed temperatures from the little ice age, then you would expect continued warming of the overall ocean mass.
The upper layers would have recovered most quickly, but are moe sensitive to general atmospheric conditions, and so can start to drop more rapidly as well. But while this is going on, the bulk of the ocean is still trying to catch up, and hence the deep ocean continues to warm.
The evidence of this can be seen from the continued steady sea level rise which has remained at about the same rate for 100-odd years, and is driven by thermal expansion.
Is the data for the Indian and South Atlantic oceanic warming sufficiently detailed to compare the annual variation in global CO2 as measured at Mauna Loa to the annual temperature variation of those oceanic areas?
The near uni-modal rise and fall of atmospheric CO2, with a maximum of early May and a minimum in mid-October, makes me suspicious that oceanic de-gassing is a significant source of atmospheric CO2 during the year. If this be the case, then one must wonder how much is potentially simply NOT reabsorbed or reused each year, thereby contributing a non-A portion of the global CO2, because either planckton isn’t doing a 100% job as it did or the ocean surface water is simply getting warmer and thus unable to absorb as much as before.
The CO2 annual budget of the planet is not understood. It is ASSUMED that man’s contribution is THE signficiant portion of the CO2 rise; back-calculations are how we get the breakdown, not front calculations (modelling back-calculations, that is). What is these numbers are slightly out?
Regional, not global: the fingerprints are everywhere (even if we are raising temps with more CO2, the responses look more regional than global, in time as well as geography).
“Then why do the vertical mean temperature anomalies (NODC 0-2000 meter data) of the Pacific Ocean as a whole and of the North Atlantic fail to show any warming over the past decade,”
So to me, the million $ question is, how is slightly cooler water heading into the arctic going to effect ice production or ice area and how will effect the temperature of the water that exists the basin?
Who is monitoring the water stream exiting the arctic? We know the temp and volume going in, so if we know the gosoutsie of the arctic we should be able to estimate the amount of heat rejected and establish treands, right????
Thanks, Bob! Excellent post!
Please send some of that ocean warming to the Great Lakes:
http://www.chicagotribune.com/news/local/ct-lake-ice-boats-met-121713-20131219,0,5159871.story
The answer to your question is surface tension.
CO2 is a well mixed gas. The greenhouse effect must be evident throught the atmosphere.
The fact that the “fingerprint” isn’t there (not as significant as predicted) means that there are convective processes that aren’t properly accounted for and likely reduce the effect.
The effect may be stronger at the surface and transfer heat to the oceans, but this is essentially a giant heat sink and limits the potential impact of warming in the atmosphere.
[ cap says:
December 19, 2013 at 5:04 am ]
Data??
We don’t need no stinkin data.
http://www.realclimate.org/index.php/archives/2013/12/Our mind is like a jigsaw puzzle
/sarc
Olavi says: “Is that ARGO data unadjusted.”
Nope.
I haven’t seen the unadjusted data in temperature format, so we’ll have to look at the ocean heat content version. The “unadjusted” ARGO era data (also includes some other types of data) is represented by the UKMO EN3 data in the following graph.
http://bobtisdale.files.wordpress.com/2013/04/figure-23.png
That’s Figure 2 from the post here:
http://bobtisdale.wordpress.com/2013/04/17/a-different-perspective-on-trenberths-missing-heat-the-warming-of-the-global-oceans-0-to-2000-meters-in-deg-c/
Aaron:
If the sea surface temperature is 70 degrees F and the air temp is 60 degrees F which way is the energy flowing?????
This is really getting entertaining to watch the desperation of warmists. Short of a true or complete conspiracy theory for coordinated obfuscation, one would expect to see an uncoordinated set of excuses and hiding places in the publication mill and data mining exercises for heat and mostly in places beyond the reach of taxpayer funded satellites, ocean buoys, and even legitimate data. Such random desperation will present a fragmented and even more unbelievable science tale over time. The characteristic unraveling of other science theories in history would be relevant comparisons even if the current AGW mantra dwarfs all other science frauds and enforced dogmas that came before it. Before Einstein put the final nail in the coffin of the ether theory, it was already undergoing serious credibility trials amid equally ridiculous defenses of it. That still came too late for some unfortunate young scientists that were punished by the academic enforcers.
There is definitely something going on with SH ice just look at this for a trend
http://arctic.atmos.uiuc.edu/cryosphere/IMAGES/seaice.recent.antarctic.png you don’t even need to draw a line through it its so obvious (straight)
Bob,
Great work as always.
But can’t this and most of these “measurement anomalies” be explained as “things in nature fluctuate”?
That it would be impossible to measure anything and not find anomalies to any selected standard?
Like everything else, one can go out and find ocean areas of every anomaly. A little warming here, nothing there and a little cooling over there. Come back in a few years and they’ve all randomly changed, moved around and switched places. How disappointing it must be for the trend seekers to discover all of their trends are temporary in one scale or another which also vary. .
Polar bear numbers, rainfall, droughts, wildfires, storms, snowfall and all things human.
The “Measuring of all things brigade” seeks to report trends. Preferably alarming trends which imply the need for more monitoring and crafted plans to mitigate the trend, (quickly, before it reverses) for the sake of all things good.
Even the trend seeking monitors themselves trend in participation, funding, activities, reports etc. That just be a problem too?
So as the trending numbers of trend seekers wander the globe with measuring madness they anything they find in a stable, unchanging uniform status will soon be “trending”. They just need to wait and watch.
Now after rambling through all of that, is there any known measuring that has been duplicated precisely as it was previously done before for absolutely reliable comparison?
Because the slight variation in measuring techniques and sampling presents opportunities to create anomalies where none exist.
And so it goes.
Having failed to find the footprint of AGW in the Tropical Troposphere we are now following the muppets into the depths of the oceans. The ice should be melting by now but it’s not as can clearly be seen by the daily satellite data (as referred to above by Eliza).
What next Trenberth?…a debate with Bob Tidsdale (very unlikely)…….or retirement?
The latter one hopes.
Bob Tisdale: December 19, 2013 at 6:36 am
Thanks for the response Bob.
Re your observation that Indian Ocean (IO) heat content rises during El Nino but doesn’t cool proportionately during La Nina: clearly the IO must have some mechanism for releasing heat accrued during El Nino conditions; otherwise nothing would prevent it from continuously building up heat.
When do you think can we might expect to see this heat released?
The proposed mechanism for climate change is that the CO2 traps heat in the atmosphere, and THEN that heat affects the surface. Heat absorption in the atmosphere is a very rapid response, so, if the heat is absorbed by the oceans, there should be a decreasing temperature profile from atmosphere to the ocean surface near the ocean surface, and also a decreasing temperature profile into the ocean surface to a certain depth until it is well mixed. If there’s no significant warming observed in the atmosphere, then the proposed mechanism is disproved.
Also, anybody who has worked with sensors will realize that putting much faith in this temperature data is ludicrous. Undoubtedly, there are corrections and adjustments being made to this data set (as with every climate-change monitoring data set), which tilt the trend in the desired direction.
BioBob, you’ve put your finger right on the incompetent neglect that plagues the entire field of surface temperature studies, including BEST.
Their work shows that they implicitly assume that the Central Limit Theorem applies to the systematic measurement error inherent in the data. It doesn’t. The few field calibration experiments of land surface temperature sensors show an average systematic error of about (+/-)0.5 C, that doesn’t average away.
There have been *no* field calibration experiments of ARGO sensors. But the variation between sensors that should be producing the same water temperatures is about (+/-)0.15 C. That’s got to be a lower limit of systematic error. It’s typically ignored when uncertainties are estimated.
The entire field of climate temperature studies lives on neglected systematic error. If the surface and sea temperature gonzos paid attention to detail, the way of people who actually do science, they’d have nothing to say.
BioBob says:
December 19, 2013 at 4:24 am
Sorry, Bob T……
1) normal distribution of observations – FAIL N = 1
2) The data must be sampled randomly – FAIL
3) The sample values must be independent of each other …..
>>>>>>>>>>>>>>>>>>>>>>
Same goes for the land temperature measurements. For 3) The sample values must be independent of each other …..
we know it is EPIC FAIL since neighboring stations are used to “Adjust” rural stations up to match adjacent urban/airport stations for example. (This is the reason my closest weather station is always adjusted up about 1C the next day.)
There are those in the warmist camp who anticpate that another strong El Nino like 1997/1998 is just around the corner and global temperature will continue to rise in an unprecedented way like 1980 -2000. In my opinion this is not going to happen anytime soon . Matter of fact , I dont see another strong ELNino for many years possibly as late as 2018/2019. The past record of strong El NINO’s during cooling ocean phases is sketchy and the various reports that exist do not all agree what consitutes strong and which ones were actually strong ,but gaps of 10 years or more between some of the strong ones seems to have happened at least 3- 4 times since 1870 . This is another reason why global temperatures are not going to rise as predicted by the flawed IPCC science in my opinion.
The most remote places are the climateers’ favorite, where they can invent any temperature history and trendlines that they like. In the ocean, the deepest places. On land, the Antarctic. On the Antarctic, the Eastern half of the Antarctic peninsula where no manned base exists because it is too cold — so they publish papers that it is rapidly warming there, but still there is no manned base — still too cold. How long can this children’s scam continue to suck the public teat?
Ronald, you’re thinking in absolute temperatures, but I’ve presented anomalies.
Could you present the absolute temperatures?
I don’t find any of the analyses very compelling, yours or those you cite. Because of the ocean and wind currents, there is no reason why a “well-mixed” atmosphere need produce uniform ocean warming. Granted, Trenberth and Fasullo’s hypothesis is ad hoc, and seems positively desperate; I think a full characterization of where, and at what depths, the ocean is warming, cooling, and hardly changing at all will take a while.
Thank you for this post. And for your other ongoing efforts.
cap says:
December 19, 2013 at 5:04 am
It cannot be repeated often enough:
Climate change is difficult to observe on short timescales – and a decade is still a short time in this sense. The natural variations are just too big. But over longer timescales the climate is still very much within a warming trend….
>>>>>>>>>>>>>>
If you are going to pull that particular rabbit out of the hat then get your facts straight. Long term we are in a COOLING trend.
SEE GRAPH: http://i.snag.gy/BztF1.jpg or read these peer-reviewed papers:
A more recent paper looking at glaciers in Norway.
The authors of BOTH papers simply state that most glaciers likely didn’t exist 6,000 years ago, but the highest period of the glacial activity has been in the past 600 years. This is hardly surprising with ~9% less solar energy.
MORE:
You can move a lot of energy into and out of the oceans without changing the average temperature much. Temperature is a terrible way to measure the energy balance of the earth/sun system.
“why is the warming of the global oceans (0-2000 meters) over the past 10 years limited to the Indian and South Atlantic Oceans, when carbon dioxide is said to be a well-mixed greenhouse gas, meaning all ocean basins should be warming?”
Those “hyper-active” molecules that vibrate too much aren’t liked by the other, cooler molecules. So the cool molecules have found a way to essentially exile the hyperactive ones.
Not only does this phenomenon explain the nonhomogenous warming of oceans, it also shows why these warmer molecules are forced to hang out in places where they are less likely to be observed, thus accounting for 50% of the warming since 1997: http://www.realclimate.org/index.php/archives/2013/11/global-warming-since-1997-underestimated-by-half/
I intend to document this alienation / dislocation of these molecules as “Sociological Transitioning Realized: Anthropomorphic Warming Sanctions” aka “STRAWS”
The alienation of these molecules not only demonstrates that warming continues (just in ways that less sensitive observers failed to detect), it also demonstrates a gross injustice to these molecules who vibrate excessively through no fault of their own! These molecules get exiled to remote regions of the world (as the data clearly shows – or omits, which is an even greater injustice!) and then get blamed for things like ocean acidification.
To confront both the social and physical aspects of this I am considering writing a paper: “Grasping at STRAWS: why exiling warm molecules makes for a bad Acid trip.”
SOT but on Inside Science at 4:30pm the question was asked if global warming is continuing and oceans warming how come antarctic ice is increasing.
Basically the answer seems to be that if ice is retreating it’s due to man-made climate change, however if ice is increasing it is due to man-made climate change.
vukcevic says:
December 19, 2013 at 5:01 am
Ronald says:
So how could warm water sink under cold water?
Sea surface is warmed by sun, evaporation makes it salty and as such warm water becomes heavier than less saline cold water. In vicinity of Iceland these warm waters sink to a depth of 2000m or more. In the Arctic Ocean all warm water currents circulate below cold fresh water currents
vukcevic i think (its me personel) you must do your homework. 2 thinks could be happening.
1 your believing a agw story or.
2 your looking at the conveyor belt where cold water sinks to the bottom of the ocean. That happens around the pole, fresh cold water sinks under the warm water what starts the great conveyor of water around the world.
Bob you show just what I mean. The surface is 15 degrees and on say 700m dept its 5 degrees. There is no more to it. Every thing else is making it difficult. Yes for agwers its nice but ye the anomaly goes up so there is the missing heat. But they don’t tell way the anomaly goes up.
Is the surface warming up or is the deeper ocean warming up. And the other way around the same. Is the surface cooling or is it cooling at 700m, Or both.
Reblogged this on Power To The People and commented:
Another case where when reality disagrees with the Climate Change Alarmists reality is not what’s false.
@ Bob Tisdale …..
Bob, I’m a bit confused, and it may be because of too much beer last night, but, your graph seems off to me. Following the link you posted, and going with the yearly data, I get a cooling for 0-2000 meters from 2003.5, globally. at -0.0026 annually.
Ronald’s question:
One example of warm water flowing under the Ocean surface can be found in the Mediterranean Sea outflow. I think I’ve got this right: When there is a lack of precipitation in its catchment area there is negative evaporation balance from the surface. Convection/gravity takes the warm saline water down and it outflows under the ocean water coming in through the Strait of Gibraltar. With greater amounts of precipitation in the catchment area of the M. Sea, the ocean inflow is under the warmer outflow.
Just another example of the dynamic oceans. Not at all like a small still pond in a field.
Has a published scientist taken a look at Bob’s ideas and reviewed them? I am curious to know what another expert thinks of them. He is clearly the resident expert on ocean temperatures around here, but his ideas need to be validated by others at least as knowledgeable on the subject as he is.
Specifically, I observe some of the same holes in logic as others have posted above:
Because of the ocean and wind currents, there is no reason why a “well-mixed” atmosphere need produce uniform ocean warming.
Individual ocean bodies have differently arranged water streams, different supply of (ant-)arctic cold water, different supply of sun radiation, different volume, different mixing with other oceans. All these and many more factors affect how they warm up or cool down. We can always say that if CO2 wasn’t here, Pacific and North Atlantic would be cooling much more. Not that I think that statement is true, but these graphs don’t disprove it.
Re your observation that Indian Ocean (IO) heat content rises during El Nino but doesn’t cool proportionately during La Nina: clearly the IO must have some mechanism for releasing heat accrued during El Nino conditions; otherwise nothing would prevent it from continuously building up heat. When do you think can we might expect to see this heat released?
And please spare me the line about how Bob just presents data, not hypotheses. These statements are certainly more than just presenting data:
“Bottom line: instead of admitting the hypothesis of human-induced global warming is fatally flawed, they perpetuate a myth.”
“Those hundredths and thousandths of a deg C aren’t coming back to haunt anyone at any time.”
Heh, @ Bob, disregard….. copied wrong data.
Bob- I read most of your posts on El Nino/La Nina. It seemed that virtually all ocean warming comes from direct sunlight on the ocean surface, which absorbs and redistributes it. Some must also come from back radiation of IR from the atmosphere, but that is only a relatively small fraction. Then winds and ocean currents redistribute the heat.
That mechanism doesn’t explain why the ocean’s don’t show similar amounts of temperature(heat) change though. But nobody thinks the oceans are well-mixed either. I suspect the Argo data is just another example of poorly we understand the climate system.
Perhaps this means all the ocean heat went into those two oceans. Just because CO2 is well mixed, doesn’t mean ocean heat has to be. What does Trenberth&co missing heat papers say?
How are the Argos distributed between the two oceans?
“Willis also had ocean-based data sets, including temperature profiles from the Argo robot fleet as well as from expendable bathythermographs, called “XBTs” for short. XBTs are the equivalent of a disposable razor. A temperature sensor is spooled out behind a ship by thin copper wire. It sinks, making measurements at increasing depths, transmitting them back to the ship via the wire until the line snaps and the sensor sinks to the bottom of the ocean, discarded.
Artist’s impression of an XBT.
An XBT may look like a rocket, but it’s more like a fishing weight: a heavy zinc nose houses a thermistor (to measure temperature) attached to a spool of copper wire. The XBT is launched from a ship, then falls through the water at a constant rate. Temperature measurements are sent back to the ship through the wire until the entire length of wire is unspooled (up to 1,500 meters), at which point the connection breaks and the XBT falls to the ocean floor. (Render by Robert Simmon, NASA Goddard Space Flight Center.)
The devices are manufactured to free-fall through the water at a known rate; scientists infer the depth of the temperature measurements by the time lapsed after the sensor hits the water. They have been used by the U.S. Navy and oceanographers since the 1960s.
“Basically, I used the sea level data as a bridge to the in situ [ocean-based] data,” explains Willis, comparing them to one another figuring out where they didn’t agree. “First, I identified some new Argo floats that were giving bad data; they were too cool compared to other sources of data during the time period. It wasn’t a large number of floats, but the data were bad enough, so that when I tossed them, most of the cooling went away. But there was still a little bit, so I kept digging and digging.”
The digging led him to the data from the expendable temperature sensors, the XBTs. A month before, Willis had seen a paper by Viktor Gouretski and Peter Koltermann that showed a comparison of XBT data collected over the past few decades to temperatures obtained in the same ocean areas by more accurate techniques, such as bottled water samples collected during research cruises. Compared to more accurate observations, the XBTs were too warm. The problem was more pronounced at some points in time than others.
The Gouretski paper hadn’t rung any alarm bells right away, explains Willis, “because I knew from the earlier analysis that there was a big cooling signal in Argo all by itself. It was there even if I didn’t use the XBT data. That’s part of the reason that we thought it was real in the first place,” explains Willis.
But when he factored the too-warm XBT measurements into his ocean warming time series, the last of the ocean cooling went away. Later, Willis teamed up with Susan Wijffels of Australia’s Commonwealth Scientific and Industrial Organization (CSIRO) and other ocean scientists to diagnose the XBT problems in detail and come up with a way to correct them.”
So where in all this can we find actual technical explanation for the diverse forms of data censoring? Nowhere! All we get is trust-us type statements like:
“…it wasn’t a large number of floats, but the data were bad enough, so that when I tossed (sic!) them, most of the cooling went away.” and
“…diagnose the XBT problems in detail and come up with a way to correct them.”
And that my friends is post-modernist science from a ‘published scientist’ for you! Toss that, and find a way include this, and generally screw around with the (various sources of) data arbitrarily until, basically, ….you get the very result you want.
This is just like the ‘problems’ with atmospheric radiosondes and the missing tropical hot spot all over again.
Sigh!
Thanks Bob!
Stephen Richards says:
December 19, 2013 at 7:39 am
Jon says:
December 19, 2013 at 3:54 am
What’s the last thing that goes trough a insects brain when it hits the windshield of a car?
“If it’s head on it’s his a$$”
HahaHa…beer spewed appropriately over screen.
Ronald says:
December 19, 2013 at 11:55 am
your looking at the conveyor belt …… fresh cold water sinks under the warm water what starts the great conveyor of water around the world.
Belief is a matter of faith, science is a matter of fact, and facts are different to what you sugested
http://science1.nasa.gov/media/medialibrary/2004/03/01/05mar_arctic_resources/currents1.jpg
MikeN says: “How are the Argos distributed between the two oceans?”
See the ARGO webpage:
http://www.argo.ucsd.edu/
logicalchemist says: “I suspect the Argo data is just another example of poorly we understand the climate system.”
Bingo. And the data indicates we’re being misled by the climate science community.
Regards
Brian says: “Has a published scientist taken a look at Bob’s ideas and reviewed them? I am curious to know what another expert thinks of them. He is clearly the resident expert on ocean temperatures around here, but his ideas need to be validated by others at least as knowledgeable on the subject as he is.”
Data are data, Brian. I simply present in relatively easy-to-understand ways what the climate science community refuses to present.
Enjoy your holidays.
James Sexton: Is this the webpage you’re using for annual global vertical mean temperature anomalies for depths of 0-2000meters? I’m seeing a positive trend of 0.02 deg C/decade from 2003 to 2012.
http://data.nodc.noaa.gov/woa/DATA_ANALYSIS/3M_HEAT_CONTENT/DATA/basin/yearly_mt/T-dC-w0-2000m.dat
Matthew R Marler says: “Could you present the absolute temperatures?”
As far as I know, the data is only available as anomalies.
Brian says:
December 19, 2013 at 12:22 pm
You don’t suppose the global oceans might be sharing their water to some extent? Tidal forces and all that?
vukcevic says:
December 19, 2013 at 3:10 pm
Ronald says:
December 19, 2013 at 11:55 am
your looking at the conveyor belt …… fresh cold water sinks under the warm water what starts the great conveyor of water around the world.
Belief is a matter of faith, science is a matter of fact, and facts are different to what you sugested
http://science1.nasa.gov/media/medialibrary/2004/03/01/05mar_arctic_resources/currents1.jpg
If you look at that picture closely what it is showing you, by the fold of the ‘ribbon’ at the turns, is that warm less dense surface water moves from the equator to the pole where it cools and so becoming denser, heavier, sinks and flows back towards the equator where it warms up again, and so less dense rises to the surface and flows again to the pole.
Water flow around the Earth follows the same principle as air flow, warm air at the equator rises because it is less dense and flows to the cold poles, heat flows from hot to cold, there it cools and so denser sinks and flows back to the equator.
The Earth’s spin causes this air flow to change from the simple pattern it would be to the more complicated called the Coriolis effect – for the ocean this is further complicated by encounters with land masses.
Myrrh says:
December 19, 2013 at 6:11 pm
………….
Correct.
Down-welling in the Icelandic seas is caused by the cold Arctic winds’ removal of heat from warm currents at a rate of several hundred watts/m2. In the winter months this happens mainly to the Iceland’s south and in the summer months to its north.
I happen to think that rate of the heat removal is critical to the N. Hemisphere weather and the ultimately climate change since rising warm air distorts the ‘Coriolis effect’ by moves polar jet-stream into more pronounced meridional direction.
Even if we assume constancy of the energy transferred from the equatorial to the polar region, there is another factor which affects rate of down-welling, and that is deep cold current known as ‘North Icelandic Jet’, which appears to be highly variable; in my view the reason for this is the Kolbeinsey’s ridge tectonics, but that is another story.
Myrrh says:
December 19, 2013 at 6:11 pm
………….
Correct.
Down-welling in the Icelandic seas is caused by the cold Arctic winds removing heat from warm currents at rate of several hundred watts/m2. In the winter months this happens mainly to the Iceland’s south and in the summer months to its north.
I happen to think that rate of the heat removal is critical to the N. Hemisphere weather and the ultimately climate change since rising warm air distorts the ‘Coriolis effect’ by moves polar jet-stream into more pronounced meridional direction.
Even if we assume constancy of the energy transferred from the equatorial to the polar region, there is another factor which affects rate of down-welling, and that is deep cold current known as ‘North Icelandic Jet’, which appears to be highly variable; in my view the reason for this is the Kolbeinsey’s ridge tectonics, but that is another story.
Bob said:-
“As far as I know, the data are only available as anomalies”.
But surely the raw data has to exist in order to derive the anomalies? How do we know then that the raw data hasn’t been fiddled to enhance the anomalies? Why has the raw data never been made publicly available? Quis custodiet ipsos custodes?
Philip Aggrey says: @ December 20, 2013 at 8:49 am
…. But surely the raw data has to exist in order to derive the anomalies? How do we know then that the raw data hasn’t been fiddled to enhance the anomalies? Why has the raw data never been made publicly available? Quis custodiet ipsos custodes?
>>>>>>>>>>>>>>>>>>
In the infamous words of Phil Jones, head of CRU:
And this is from the HEAD of the most prominent climate research unit in the world??? That statement alone should make any real honest scientist repudiate CAGW and the IPCC.
Hello Bob. To me it doesn’t look one can say the global ocean as whole warms. Even the Argo doesn’t measure the ocean top to botom, so we don’t really know.
What we know from the Argo positively is that the ocean surface layer in global senseis cooling
And this is more or less going on for whole the Argo era and mainly at the Northern hemisphere. – We can also identify a cooling, however not global, throughout the whole Argo measured ocean column and it is at the Northern hemisphere.
As you can see on the 0-65N and 50-65N graph comparison it is very likely, that this profound Northern hemisphere ocean cooling originates from the Arctic and my opinion is that it is caused by the dispersal of freezing cold water having its origin from the melted Arctic ice. -This is the other side of the surface icemelt (sold using the creepy polarbear pictures as a sign of the “anthropogenic global warming”) – you end up with the whole hemisphere ocean cooled to depth. Most striking is the decline in the sub-Arctic sea surface layer temperature in the Eastern Atlantic – a -0.3+C per decade in the usual relations of the sea surface layer temperature is already quite alot and definitely significant – especially when one considers the ocean cooled all the way down the 2000m measured by the Argo in the 50-65N area – especially in the Atlantic and in fact at most of the Northern hemisphere.
But they say the global ocean allegedly warms. Let’s take Argo global data top to botom, east to west, north to south and use the simple regression analysis and see where it is.
-Not in the geographical sense, but in the sense of the ocean depth. We can see the global ocean “warming” is going on below ~100m depth.
Now the question: is it likely (- given the law of gravity, the 2nd law of thermodynamics and the known properties of liquid water, especially the known firm relationship between its temperature and density) that the “warming” below the ~100m depth (with the cooling above) has anything to do with the present surface or atmospheric conditions?
I very much doubt it and I deem much more likely, that the “warming” below the ~100m depth is in fact a tranversal heatwave which slowly progresses from the surface since the times there was the warming period in the 1970s-2000 – and which ocean “recorded” in its heat content as a temperature change profile, which is now revealed using the Argo network and most importantly: the cause of the heatwave, if we ask where it lies in the sense of time, most likely lies in the past, not the present.
I would like to know, what you think about.
Jan Zeman
vukcevic says:
December 20, 2013 at 3:43 am
Down-welling in the Icelandic seas is caused by the cold Arctic winds’ removal of heat from warm currents at a rate of several hundred watts/m2. In the winter months this happens mainly to the Iceland’s south and in the summer months to its north.
I happen to think that rate of the heat removal is critical to the N. Hemisphere weather and the ultimately climate change since rising warm air distorts the ‘Coriolis effect’ by moves polar jet-stream into more pronounced meridional direction.
See link
http://earth.nullschool.net/#current/wind/isobaric/1000hPa/orthographic=-6.80,53.65,622
Charlie Johnson (@semper ban u): Those “hyper-active” molecules that vibrate too much aren’t liked by the other, cooler molecules. So the cool molecules have found a way to essentially exile the hyperactive ones.
that was an enjoyable read. well done.
Peruvian upwelling is sharply contracting just now suggesting a possible mini-el Nino type east Pacific warming over Christmas, which due to underlying conditions might very well be followed by renewed upwelling a much stronger La Nina type east Pacific cooling and a full-on La Nina. If this scenario were to play out, it would represent a reversal of the ENSO asymmetry, from el Nino>La Nina to el Nino<La Nina, for the first time in the instrumental record. Anyway Happy Christmas, lets see what happens in the New Year.
Indian Ocena Temperatures are Australia’s fault.
Australia is a world leader in CO2 emmissions – that’s what we get told all the time – must be true.
Australia didn’t send a Minister to Warsaw and the Aussie Delegation wore T-Shirts and at junk food.
Australia is getting rid of its’ CO2 tax.
It’s Tony Abbott’s fault.
That is all.
BS ladies and gentlemen BS..truth is all this BS keeps coming because if the truth is reported NO MORE SUBSIDIES for the scientists.FOLLOW THE MONEY