We discussed the Trenberth and Fasullo (2013) paper “An Apparent Hiatus in Global Warming?” in the recent post Trenberth and Fasullo Try to Keep the Fantasy Alive. Since then, Dana Nuccitelli published a post at TheGuardian—cross posted at SkepticalScience—extolling the greatness of Trenberth and Fasullo (2013). So far, the team at RealClimate and Joe Romm at ClimateProgress have been silent about the paper. Give them time.
The following are a few more comments about Trenberth and Fasullo (2013).
MISINFORMATION
In their Figure 4 (copy here), Trenberth and Fasullo (2013) compared the global surface temperatures for the periods of 1982-1993 and 1997-2008. They write:
Even in the last three decades we can ask whether such slowdowns have occurred before, and Figure 4 shows the 11 years beginning 1982 and 1997 in detail, showing a remarkable resemblance in subsequent evolution.
But as we can see in Figure 1, there was little to no slowdown in the warming rate for the period of 1982-1993, using the same global surface temperature anomaly dataset presented by Trenberth and Fasullo (2013). The warming rate is comparable to the trend from 1982 to 2012, “the last three decades”.

Figure 1
Figure 2 presents the 12-year running trends for the NCDC global temperature anomalies. As you’ll note in Figure 2, the y-axis is scaled in deg C/decade. The final point shows the linear trend for the 12-year period of 2001 to 2012, and the data point before it shows the trend for 2000 to 2011, etc., traveling back in time. The first data point shows the trend for the 12-year period of 1880 to 1891. There are no 12-year periods with trends comparable to the period of 2001-2012 until we travel back to the period of 1965-1976.

Figure 2
For those who would prefer to see those two periods compared in a time-series graph of global surface temperature anomalies, refer to Figure 3.
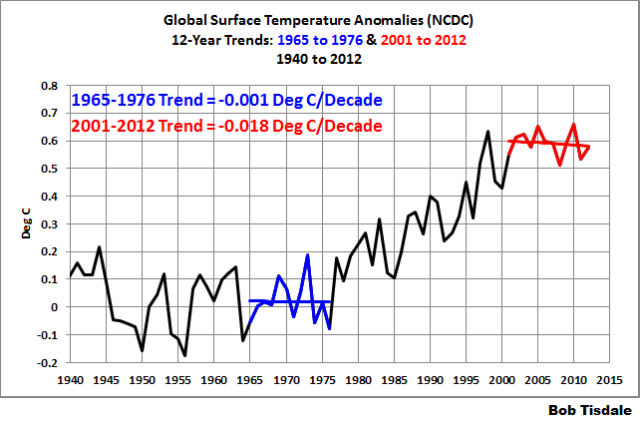
Figure 3
So the answer is NO to Trenberth and Fasullo’s question of “Even in the last three decades we can ask whether such slowdowns have occurred before”, using 12-year periods as they elected to present.
CONFIRMATION BIAS
Trenberth and Fasullo (2013) used the ECMWF ORAS4 ocean heat content in their paper because it met their expectations. They write:
One approach to estimating ocean heat content (OHC) changes is by combining the available observations (surface, ocean, and from space) with an ocean model to produce a dynamically consistent ocean analysis. The new ORAS-4 ocean reanalysis from ECMWF has revealed very distinctive climate signatures that are realistic in magnitude and duration in terms of changes in OHC [Balmaseda et al., 2013] (Trenberth et al., submitted manuscript, 2013). Figure 10 shows the five ensemble members of the ORAS-4 ocean reanalysis OHC for 0–700m and full-depth ocean and reveals the increased heating below 700m depth of 0.21Wm−2 globally after 2000. The orange bars show the times of the El Chichón and Pinatubo volcanic eruptions when sharp drops occurred in OHC that quantitatively match estimates of TOA radiative changes (such as in Pinatubo) [Trenberth and Dai, 2007], as demonstrated in a new analysis by Trenberth et al. (submitted manuscript, 2013).
We’ve discussed in the past that a reanalysis is not data. It is the output of a computer model that uses data as inputs. The model also uses climate forcings, like those from volcanic aerosols, to modify/adjust/tweak the data. (For more information on the ORAS4 reanalysis, see the ECMWF Ocean-S4 Analysis Documentation webpage and Balmaseda et al. (2013) Evaluation of the ECMWF ocean reanalysis system ORAS4.)
My Figure 4 is Figure 10 from Trenberth and Fasullo (2013). As they note in the caption:
The orange bars show the times of the El Chichón and Pinatubo volcanic eruptions.
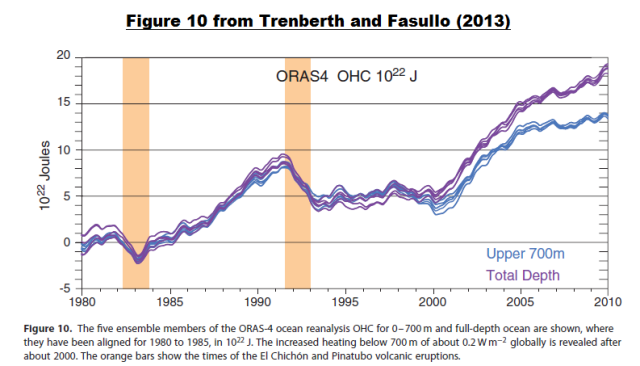
Figure 4
Unfortunately for Trenberth and Fasullo (2013), the dips from those volcanic eruptions don’t appear in the NODC (Levitus et al) ocean heat content data. Willis Eschenbach compared the ORAS4 ocean heat content reanalysis to the NODC data in Figure 3 from his post Why Reanalysis Data Isn’t… at WattsUpWithThat. See my Figure 5.

Figure 5
There Willis Eschenbach writes:
In Figure 3 [my Figure 5], the shortcomings of the reanalysis model results are laid bare. The computer model predicts a large drop in OHC from the volcanoes … which obviously didn’t happen. But instead of building on that reality of no OHC change after the eruptions, the reanalysis model has simply warped the real data so that it can show the putative drop after the eruptions.
I presented that same illustration in my post Open Letter to the Royal Meteorological Society Regarding Dr. Trenberth’s Article “Has Global Warming Stalled?” There, I wrote:
Willis has also identified the timing of the eruptions of El Chichon and Mount Pinatubo. As you can see, the NODC’s ocean heat data does not include the major volcanic dips and rebounds shown in the ORAS4 reanalysis used by Balmaseda et al (2013). In fact, the NODC global ocean heat content data rises, not falls, immediately after the eruption of El Chichon in 1982. And the drop in the NODC data after the eruption of Mount Pinatubo is similar in magnitude to all of the other annual variations. Note also that the reanalysis used in Balmaseda et al also had a period of extreme warming from the early 1980s to 1990 that does not exist in the data. It appears that sharp rise was needed to accommodate the dip and rebound in the reanalysis caused by the eruption of Mount Pinatubo—a dip and rebound that is unobserved in the data.
Bottom line: Trenberth and Fasullo (2013) presented a reanalysis of ocean heat content that met how they expected the oceans to respond to volcanic aerosol forcings. They did not present data that shows how the ocean heat actually failed to respond to those volcanoes.
Some might think the absence of responses to volcanic aerosols is an indication the oceans are not sensitive to changes in climate forcings. Now consider that volcanic aerosols impact sunlight and that sunlight penetrates the oceans to depths of about 100 meters, with most of it being absorbed in the top ten meters. And consider that infrared radiation from manmade greenhouse gases can only penetrate the top few millimeters of the ocean surface. It’s no wonder Trenberth and Fasullo are trying to show some type of response to climate forcings with their use of the ORAS4 reanalysis.
CLOSING
Trenberth and Fasullo (2013) referred a number of times to the submitted, but not yet published, paper Trenberth et al. (2013), “Earth’s energy imbalance”, submitted to Journal of Climate. It appears also to be based on the ORAS4 reanalysis. I suspect in the not-too-distant future I’ll be repeating many of the points made in this post and the post from a few days ago Trenberth and Fasullo Try to Keep the Fantasy Alive, including the caution from ECMWF. (See their webpage here):
Disclaimer. There is large uncertainty in the ocean reanalysis products (especially in the transports), difficult to quantify. These web pages are aimed at the research community. Any outstanding climate feature should be investigated futher (sic) and not taken as truth.
I guess it is the cynic in me, but the fact they rushed the paper out means that the line of “investigated as truth and not taken as fact” is merely a wink wink to the faithful.
philjourdan, or maybe Trenberth is getting ready to retire and he’s getting in a few last jabs.
Bob, have a look at the kinetics of Figure 10 from Trenberth and Fasullo (2013). If you subtract upper 700m from total depth, you get the less than 700 m heat content.
The rate of heating from 2005 in the figure shows that the ocean below 700m is heating more rapidly than the upper 700m, which is rather odd as the heat input into the system is in the first 10m of the surface. This change in the transfer rates of heat CANNOT be explained by a change in the surface heat flux, the putative mechanism by which CO2 in the atmosphere causes heating, as the heat flux must always be from warm to cold.
This has caused them to scratch around and maintain that there have been changes in up-welling and down-welling currents, which may be true, but if heat transfers from the upper 700m to the lower waters are real, then these same currents must also be transferring CO2 and dissolved inorganic carbon, making a mockery of the Bern model oceanic carbon ‘sinks’.
I would really like some people to independently calculate the amount of water in the 700m layer that has to be transferred to the depths, to match the profile show in T&F’s Figure 10.
Did the reanalysis get the -135 right?
A fundamental principle of scientific method that Mr. Tisdale champions is:
“Keep the focus on the observable data and use the observable data to criticize the reanalysis.”
The fact that Mr. Tisdale has to expend huge amounts of energy and time showing the Alarmist community how they violate this principle tells us all you need to know about Alarmist climate science.
Climate science rests on the principle that the more positive examples you can find to support your theory, the more likely your theory is to be true. This is contrary to the scientific method which teaches that no amount of positive examples can ever prove a theory correct. It is the absence of a single contrary example that proves the theory.
For example. Consider a stopped watch. Twice a day it tells the “correct” time. If one only publish studies about when the watch shows the correct answer, then according to climate science one has a perfectly good, accurate, functioning watch.
This is what we are seeing in Trenberth and Fasullo (2013). A study that says: “look at the watch now, it has the correct time, this means it is working”.
If Trenberth and Fasullo (2013) was correct, then it should be impossible to pick any time period AT RANDOM and see a reduction in warming. Instead, they have chosen a specific time period, one which they chose because it showed the answer they wanted. This is no different than telling everyone to look at the stopped watch at the precise time of day when it is telling the correct time.
What Bob Tisdale has done is to point out that if one was to look at the watch at some other time in the day, then it would not have the correct time, which proves the watch is broken. And by the scientific method, it is the broken watch that proves the theory of global warming is wrong.
A broken watch will eventually deliver an infinite number of correct readings. This doesn’t mean it is accurate.
DocMartyn says:
December 11, 2013 at 6:29 am
–
–
…as the heat flux must always be from warm to cold.
——
I think you are forgetting “Immaculate Convection”.
Trenberth probably realises that the jig is up and funding will shrivel in correlation with flat/cooling surface temps. 🙂
The theory that warming is hiding in the oceans is based on a calculated energy imbalance of 0.6+-17W/m2. Last I looked, when you have an error term that is significantly larger than the result, it is a nonsense to assume the result is meaningful.
One might as well say that people are on average 0.6ft+-17 feet tall. The answer is correct, but it has no reliable meaning. It would lead to all sort of nonsensical results if you were to use 0.6ft as the average height of people, simply because people are on average 0.6ft+-17 feet tall.
Imagine if you were to design houses and cars based on an average height of 0.6+-17 feet. Now design the world’s future around a policy based on this number.
If no one looks for a contrary example, then the theory will be proven, according to your statement. Doesn’t sound right.
RealClimate will take a while. I can’t find the post but a few years ago they put up a guest post suggesting that there could be a pause of 20 years or more, at which point global warming would come back with a vengeance. They took care to note that they did not agree with the post. Looks like they were hedging there bets in case there was a long pause.
Alas for Trenberth, his former doctoral student John Christy failed to drink the Kool-Aid and ended up testifying to Congress about it being strange punch indeed.
TRENBERTH LOSES HIS STRAWBERRIES
(See the courtroom scene in The Caine Mutiny)
As greenhouse gases still accrete
This captain of the climate wars
Is searching for the missing heat
That he believes the ocean stores
He’ll prove to all humanity
That danger in the deep resides
The Kraken that he knows to be
That Davy Jones’s Locker hides
The soul’s more heavy than we think
A truth that everyone must face
And to what depths a soul may sink
Oh! To what dark and dismal place!
Does Captain Trenberth understand
That data offers no appeal?
He tumbles in his restless hand
Three clacking balls of stainless steel
MY GEOMETRIC LOGIC PROVES
HEAT TELEPORTS FROM PLACE TO PLACE
FROM SKIES INTO THE DEPTHS IT MOVES
AND IN BETWEEN IT LEAVES NO TRACE!
When silent faces stare at you
It’s always best to shut your jaw
But Trenberth is without a clue
As he believes they stare in awe!
Eugene WR Gallun
Literary Alert!!! — I have completed my poem
“Al Gore — American Bloviator” soon to be
appearing here on these pages!
I don’t understand averaging by year when they have the monthly data. Nature doesn’t know about January and December. Using the unaltered monthly data, when I calculated a linear regression from 1982 thru 1993/12, the rate was +0.13 C per decade. When I calculated from 1997/01 thru 2008/12, the rate was +0.06 C per decade i.e. about half the 1982-1993 rate. Calculating from 1997/01 thru 2013/10, the rate was +0.04 C per decade i.e. about a third.
1997/01 thru 2013/10 ===> +0.04 C per decade
1998/01 thru 2013/10 ===> +0.04 C per decade
1999/01 thru 2013/10 ===> +0.06 C per decade
2000/01 thru 2013/10 ===> +0.04 C per decade
2001/01 thru 2013/10 ===> -0.01 C per decade
2002/01 thru 2013/10 ===> -0.03 C per decade
2003/01 thru 2013/10 ===> -0.03 C per decade
2004/01 thru 2013/10 ===> -0.02 C per decade
2005/01 thru 2013/10 ===> -0.04 C per decade
AND to continue to claim the culprit is always and forevermore CO2, is this not sheer madness?
MAybe the the sun should be investigated … /sarc
.
Bob,
This ocean reanalysis combines model estimated values with observations in a repeated updating process (3D-Var or 4D-Var). How much influence the observations have is related to the ratio of assumed errors in model-estimates and in observations. The updating process involves minimising the sum of squares of model and observation terms, each being divided by its error estimate, roughly speaking.
I’ve looked at the ECMWF Ocean-S4 Analysis Documentation to see what error magnitudes it assumes for temperature measurements. Standard errors used increase from 0.18 C at the surface to 1.0 C at 75 m depth, and then decrease, reaching about 0.62 C at 300 m, 0.39 C at 700 m, 0.18 C at 1500 m and 0.07 C at 5000+ m. These are large errors relative to pure measurement error, because they are intended also to allow for poor representativeness (sampling).
It’s trickier to work out what model temperature estiamte errors are assumed. Above 75 m, it is 0.5 C or more. Below 75 m, I think it is the higher of 0.07 C and 10 m x { the rate of change of model temperature in C with depth in m}.
I suspect that means the assumed observational error is much larger than the assumed model error over a wide range of depths between 75 m and 1500 m, resulting in the observations having much less influence than the model estimates over that range of depths. That is consistent with the finding of large differences between the reanalysis and observational estimates of ocean heat content.
@ ferdberple says:
December 11, 2013 at 7:28 am
“. . . a calculated energy imbalance of 0.6+-17W/m2”
I have seen this several times. When I first saw it I took it to be a typo for 0.17 or possibly 1.7 W/m2. To avoid confusion I always prefer bold decimal points and a leading zero before a leading decimal point. No AGW type I know of. Has stated or suggested that it is a typo. Is there any chance this is in fact a typo?
Anyone?
“Apparent Hiatus in Global Warming” — “Apparent” meaning “don’t believe your lying eyes,” and “hiatus” meaning “it’s just resting, it will be back.” Who’s in denial now?
Trenberth and Fasullo: “Don’t bother us with reality; what we’re looking for is a good climate fantasy!”
Thank you again.
I don’t know how many times these guys can talk out of both sides of their mouth before someone other than us calls them on it.
This is just a hiatus. It’ll be back. Dunno how many solar cycles it’ll take, but … it’ll be back. Remember, just a hiatus.
Warmistas are very smart.
In the past, science worked this way: theory observations. Easy to prove wrong.
Nowadays it works like this: theory -> model observations, decoupling fantasy and reality.
This way, when observations do not match, it is not that the theory is considered wrong, but that the model has few problems, easily to adjust.
This is nothing but distraction, models are the red herring and the good old rules have slowly been altered. So a wrong theory can survive for ever, even become mainstream, and not being questioned anymore. Billions of dollars and resources wasted …
None of this matters now:
Canadian researchers have detected another greenhouse gas – and its global warming potential is extreme.
Over the course of a century, “a single molecule of PFTBA has the equivalent climate impact as 7,100 molecules of CO2,” says a lead author of the study that identified perfluorotributylamine.
Robert A. Taylor-The uncertainty in the surface energy imbalance is, indeed, plus or minus 17 W/m^2. The uncertainty in the “top of the atmosphere” balance, however, is not.
The funny thing is they are supposed to match. The problem is that we are really not scientifically up to the task of measuring the surface energy budget accurately. It’s just beyond the capability of our current observing system.
Eugene WR Gallun says:
December 11, 2013 at 8:02 am
Brilliantly done. That goes in my Climate files.
Actually this is MOST interesting. As a norm the skeptic side is RE-ACTING to articles published on CAGW.
Now that WUWT and others are doing a GREAT job of getting out the message as to how global warming has halted, then the die hard CO2 taxers and warmest’s are feeling the NEED to respond to this issue.
In war, when the enemy RESPONDS, then this is a good thing! It usually a great sign that the tables are turning!
The other question is why is all this mumbo jumbo about the ocean trapping some heat an issue?
Is the theory now that the ocean is behaving DIFFERENT than the last 1000 warming/cooling periods in the history of climate?
Is not the ocean trapping and releasing heat like it ALWAYS did?
Any paper can talk about some interesting ocean trapping some heat, but it CAN NOT be phrased in the context that somehow THIS TIME is any different than the last zillion times that climate cooled or temperatures halted.
Since when did the ocean become SOME NEW scape goat and excuse in this debate?
Are they going to remove the past history of the ocean like the MWP?
Any claim that the ocean is holds heat must be phrased in terms that the ocean has ALWAYS done that and did so for the last 1000+ warming and cooling cycles. The idea that the ocean is now going to be passed off as some BRAND NEW scapegoat that explains away this current halt in warming is downright silly.
Did the ocean in the past have a staff meeting and decide to behave differently and why?
Those folks are very smooth, but I thought there is another method to heat the oceans, one that was recently discovered in the Artic Ocean, near the Soviet side. Still haven’t read any more of the discovery, since the volcano chain was seen to be active. If I remember right, seven of a dozen volcano’s were active, no exploration, must be too cool for babe’s in bikini’s in the middle of the summer, for the old volcanologists to wander to.
@ ferdberple says:
December 11, 2013 at 7:28 am
“. . . a calculated energy imbalance of 0.6+-17W/m2”
I have seen this several times. When I first saw it I took it to be a typo for 0.17 or possibly 1.7 W/m2. To avoid confusion I always prefer bold decimal points and a leading zero before a leading decimal point. No AGW type I know of has stated or suggested that it is a typo. Is there any chance this is in fact a typo?
Anyone?
I have seen the 0.6 +/- 17 many places. I doubt that it is a typo.
Here is the scientific reference for you:
http://www.nature.com/ngeo/journal/v5/n10/full/ngeo1580.html
You can see they show the uncertainty in the surface imbalance is indeed huge.
I’d cut it simple. Dear Kev’s pet didn’t survive the IPCC machine a few weeks ago. It’s unlikely that he had held back any extraordinary evidence then, so these new papers are just more reimagining of the same pet.
They can’t contribute anything new. Mark them for the forgetfulness of history.
When I read about Bob Tisdale’s critical analysis of Trenberth and Fasullo, I am reminded of the Nigerian legacy letters.
Is there anyone out there who has not received one, or a variation on the same theme?
Anyhow, you are asked to send money (in ‘climate science’ terms to pay taxes) to provide access to a golden future (a world without CAGW).
The only problem is there is no substance to either one, only an empty promise of a golden future which requires you to empty your pockets.
While the original scam is obvious to most, there are still many people which are duped by the more sophisticated variations which follow.
Correct me if I’m wrong, but if the IPCC’s past predictions were correct, the atmosphere should be about half a degree C warmer by now. If all that heat went into the vast mass of the deep oceans instead, would we even be able to measure the temperature rise?
So you take the Raw Data, put it through a program (Model) to make it fit what you think is reality.
You then use the output from the model to reinforce your version of reality.
Brilliant, but not anywhere close to actual SCIENCE.
The oceans suffer a measurable and immediate response to heating at any depth by thermal expansion leading to sea level rise, so a sudden switch to hiding heat deep below would be unique enough to create a real sea level surge above and beyond their usual fake sea level surges created by creating calling virtual sea level products “sea level” but simple tide gauge data show no such trend change in the latest standard Church & White update plotted in yellow in 2011:
http://oi51.tinypic.com/28tkoix.jpg
The trend of sea level shows no variation during the last (1940s-1970s) “hiatus” either.
That’s the most powereful skeptical plot of all now. That helps explain why NASA’s layperson web presentation cuts off the last decade of tide gauge data, deceptively:
http://climate.nasa.gov/key_indicators#seaLevel
Ferdberple: totally correct. Can be summarized logically that a false statement implies both false and true statements. A true statement only implies true statements. This asymmetry is not understood even by scientists. The flat-earth model makes many true predictions, explaining why it survived thousands of years.
A C Osborn says:
December 11, 2013 at 10:53 am
Sadly, it is indeed the way a great deal of scientific “work” is done. The pattern is not limited to climate “science” either. Sir Francis Bacon, when he called for state-supported, multigenerational research efforts, neglected the human motivations that were rife in his own time, and which ultimately lead to his own exile from influence. Bacon, an idealist, assumed that scientists were of a like mind.
yup
[youtube=http://www.youtube.com/watch?v=4vuW6tQ0218&w=480&h=360]
If we accept as fact that the real world measurements of global temps show no net change over last 16 to 17 years, then consider two alternative hypotheses:
#1. No change because no changes in significant “forcings” relevant to global temps during the last two decades
#2. No change because positive “forcing” by CO2 and its associated feedbacks happens to be near exactly balanced by a negative forcing by a coincidental subduction of heat into the deep oceans (below 700 meters, ie about 2200 feet, ie VERY deep.)
#1 is simple and plausible to the non-religious-adherent to CAGW.
@2 requires a dubious coincidence of equal and opposite forces, a balanced sustained even though one of the forces is clearly continuously changing (ie, CO2 has been continuously rising during the interval). Talk about Earth in the Balance. Occam’s Razor suggest that a simple one-dimension theory carries logical weight over a complex, multi-dimensional theory. Occam’s razor has proved its worth throughout the history of science, along with other human endeavors.
Yet, sadly, if one is skeptical about #2, one is a “denier”.
Even in the last three decades we can ask whether such slowdowns have occurred before, and Figure 4 shows the 11 years beginning 1982 and 1997 in detail, showing a remarkable resemblance in subsequent evolution.
If Trenberth and Fasullo are trying to say that these 11 year pause are nothing special since they happened before , then he is in for a big surprise because this current pause [ already nearly 17 years ] is likely to extend to 2030/2040 and that this length of a pause was never in their models or reports .
ferdberple says:
The theory that warming is hiding in the oceans is based on a calculated energy imbalance of 0.6+-17W/m2. Last I looked, when you have an error term that is significantly larger than the result, it is a nonsense to assume the result is meaningful.
One might as well say that people are on average 0.6ft+-17 feet tall. The answer is correct, but it has no reliable meaning. It would lead to all sort of nonsensical results if you were to use 0.6ft as the average height of people, simply because people are on average 0.6ft+-17 feet tall.
I’m not sure that the analogy quite works. Since a figure of -16.4W/m2 is at least physically possible. Whereas a person -16.4 feet tall is not.
The issue here is more that the “error” is more than an order of magnitude greater than the supposed “value”.
Timetochooseagain: Unfortunately NATURE and the other 2 or 3 journals claiming to be the”top Journals have been unambigously trashed by none other than a recent Nobel Prize winner (Physiology) these journals are now considered trash. Climate scientist are to blame for most of it. The lawyers representing those people who have lost money in this scam will be prosecuting. see Jo anne nova climate and climatedepot. Also see retraction watch.
Excellent deconstruction of Trenberth et al.
Here is a Linked-In link for any Linked-In members. This is a chance to respond to Ban Ki-Moon’s globaloney nonsense. The UN is just trying to get into everyone’s pockets, as usual.
It looks like the climate fraudsters, ah, I mean “scientists,” are claiming that the heat generated (or retained) from the rising CO2 (only the Mann-made portion of course) is hiding in the deep, deep, deep ocean. OK then we can all go home because the game is over if that is true. After all, it would take a long, long, long time to warm all the ocean depths even a few degrees now would it not? Looks like we have at least several thousand years to study this phenomenon before there is any real change. 🙂
(and no, I don’t personally believe that CO2 does squat to the planet’s climate but I am just going with the 97% of the Team)
Just got off the phone with a friend who lives in Scotland.
She said that since early this morning the snow has been nearly waist high and is still falling. The temperature is dropping far below zero and the north wind is increasing to near gale force. Her husband has done nothing but look through the kitchen window and just stare.
She says that if it gets much worse, she may have to let the drunken bastard in.
“And consider that infrared radiation from manmade greenhouse gases can only penetrate the top few millimeters of the ocean surface.”
Very little will get past the 100% humidity layer just above the ocean’s surface. Evaporation will take care of the rest.
@dbstealey
Saw that earlier in the day. The amount of educated comments ridiculing the article were a joy to behold.
HEADLINE Typo:
Should read:
🙂
If global warming can hide in the deep blue oceans then it has to come out sooner or later. Medieval Warm Period, Little Ice Age, Roman Warm Period, Younger Dryas, Minoan, Holocene Optimum. I have now idea, I’m just speculating like Trenberth and the IPCC.
albertkallal says:
December 11, 2013 at 9:57 am
“The other question is why is all this mumbo jumbo about the ocean trapping some heat an issue?
Is the theory now that the ocean is behaving DIFFERENT than the last 1000 warming/cooling periods in the history of climate?
Is not the ocean trapping and releasing heat like it ALWAYS did?
Any paper can talk about some interesting ocean trapping some heat, but it CAN NOT be phrased in the context that somehow THIS TIME is any different than the last zillion times that climate cooled or temperatures halted.”
Exactly. Parodox piled upon paradox. For the Warmists, allmighty CO2 can make it happen somehow.
Allan MacRae says:
December 11, 2013 at 2:20 pm
Cute. If there are photos please post them or a link to them.
Allan MacRae: Thanks. I enjoyed that.
Berenyi Peter says ………
“…. it’s pining for the fjords”
Genius.
I can’t take these studies seriously when the surface trend is mostly error corrections invented since 1990.
It’s no wonder the models can’t predict a 17-year plateau, they have a classic GIGO problem.
.1 degrees per decade. No good reason to believe anything else.
I rather suspect that “the pause” will turn into “the drop” soon based on these two very simple presentations.
http://www.woodfortrees.org/plot/hadcrut4gl/plot/hadcrut4gl/mean:180/mean:149/mean:123
http://www.woodfortrees.org/plot/uah/mean:90/mean:74/mean:62/plot/uah
Those show a Gaussian (or the nearest to a Gaussian available on Wood for Trees anyway) low pass filtered analysis of both Thermometer and Satellite data sets and I know what I would predict for the near future based on them. 🙂
If anyone doesn’t like Trenberth’s figure 4, they only have to look at Tisdale’s figure 2 above. Over the past few decades for example, one can see that there was a period of slower temperature rise around 0.1-0.2 deg C / decade (including 1982-1993) followed by the increase to 0.2-0.3 deg C / decade, and then back down again to around 0 at the moment. So yes, as Trenberth and Fasullo say, “such slowdowns” have occurred before.
How do you reconcile that with this?
And this?
By understanding that the uncertainties in these warming rates, which were not provided above, are about plus or minus 0.20 deg C / decade for 1982-1993 and 1997-2008. Consider that number in relation to the difference between the slopes of 0.08 deg C / decade.
The problem here isn’t that there is anything wrong with Trenberth’s figure 4, it is that when something like this is presented to people who do not pay much attention to significance or uncertainty, or for whom many of their arguments depend on explicitly ignoring it, it looks to them like something terribly wrong has been done.
Maybe some people think Trenberth was trying to use a couple of temperature plots as Definitive Proof of Something Important, since that’s what they do themselves. But no, it’s just a figure that illustrates slowdowns have happened before.
“Sun’s Current Solar Activity Cycle Is Weakest in a Century”
“SAN FRANCISCO — The sun’s current space-weather cycle is the most anemic in 100 years, scientists say.
“Our star is now at “solar maximum,” the peak phase of its 11-year activity cycle. But this solar max is weak, and the overall current cycle, known as Solar Cycle 24, conjures up comparisons to the famously feeble Solar Cycle 14 in the early 1900s, researchers said.
“None of us alive have ever seen such a weak cycle. So we will learn something,” Leif Svalgaard of Stanford University told reporters here today (Dec. 11) at the annual meeting of the American Geophysical Union.
http://news.yahoo.com/sun-39-current-solar-activity-cycle-weakest-century-163357162.html
Connection with the Global Warming Haitus?? Or did CO2 suddenly drop??????
Boy could we sure use some of Al Gore false promise of Global Warming this week. Single digits in early December??? I don’t recall a winter (well not even officially Winter yet), that has started off this cold this early.
Of course what Talldave2 said above is really what no one is paying attention to: the data has been fiddled to show more cooling before. None of the surface hadcrut GISS ect records can be believed only rural CET from ~1840 shows a total flat line if you include all recent years. Also AMSU and RSS and they show nothing either especially if the current years are included. The AGW crowd are purposely leaving out the last 4-5 years on all their recent presentations (see AGU meeting WUWT) recent, because this is data they can no longer fiddle (its on the record everywhere). Add urban island effect + adjustments and my bet is that all the surface records since 1880 would be basically flat
@ Scott Scarborough says:
December 11, 2013 at 9:58 am
and
@ timetochooseagain says:
December 11, 2013 at 9:52 am
and
@ timetochooseagain says:
December 11, 2013 at 10:03 am
Thank you very much.
I questioned it because I have seen such misprints in the past, and the plus or minus 17 W/m^2 renders any conclusion worthless.
dbstealey says:
December 11, 2013 at 1:45 pm
Excellent deconstruction of Trenberth et al.
Here is a Linked-In link for any Linked-In members. This is a chance to respond to Ban Ki-Moon’s globaloney nonsense. The UN is just trying to get into everyone’s pockets, as usual.
+++++++++
Thank you for the link. Other than a few people including the deluded Bella Angelita, it was refreshing to see so many people who are NOT fooled by the utter nonsense. Her job depends on being ignorant.