Dr. Judith Curry writes about the Cowtan and Way paper which (according to some pundits) purports to “bust” the temperature pause of the last 17 years by claiming we just didn’t pay enough attention to the Arctic and Antarctic where there is no data. They do this by infilling data where there is none, such as NASA GISS tries to do by infilling temperatures from stations far away with their smoothing algorithm.
GISS station data with 250km smoothing:

GISS station data with 1200km smoothing:

Breathless interpreters of Cowtan & Way claim that by doing the same with satellite data instead of tortured surface data, Voilà “the pause” disappears.
Cowtan & Way are trying to address this lack of surface station data in these regions by doing infill from satellite data. At first glance, this seems an admirable and reasonable goal, but one should always be wary of trying to create data where there is none, something we learned about in Steig et al’s discredited paper on the supposed Antarctic warming. Plus, as some WUWT readers know, there’s a reason that satellite temperature data coverage doesn’t fully cover the poles. See the information on the UAH data at the bottom of this post.
A video of their methodology follows.
WUWT readers will note the before and after HadCRUT imagery from Cowtan & Way below. Take special note of the Arctic.

A discussion on that Arctic temperature infilling addition at high latitude follows Dr. Curry’s analysis.
Dr Judith Curry writes:
=============================================================
Let’s take a look at the 3 methods they use to fill in missing data, primarily in Africa, Arctic, and Antarctic.
- 1. Kriging
- 2. UAH satellite analyses of surface air temperature
- 3. NCAR NCEP reanalysis
The state that most of the difference in their reconstructed global average comes from the Arctic, so I focus on the Arctic (which is where I have special expertise in any event).
First, Kriging. Kriging across land/ocean/sea ice boundaries makes no physical sense. While the paper cites Rigor et al. (2000) that shows ‘some’ correlation in winter between land and sea ice temps at up to 1000 km, I would expect no correlation in other seasons.
Second, UAH satellite analyses. Not useful at high latitudes in the presence of temperature inversions and not useful over sea ice (which has a very complex spatially varying microwave emission signature). Hopefully John Christy will chime in on this.
Third, re reanalyses in the Arctic. See Fig 1 from this paper, which gives you a sense of the magnitude of grid point errors for one point over an annual cycle. Some potential utility here, but reanalyses are not useful for trends owing to temporal inhomogeneities in the datasets that are assimilated.
So I don’t think Cowtan and Wray’s [sic] analysis adds anything to our understanding of the global surface temperature field and the ‘pause.’
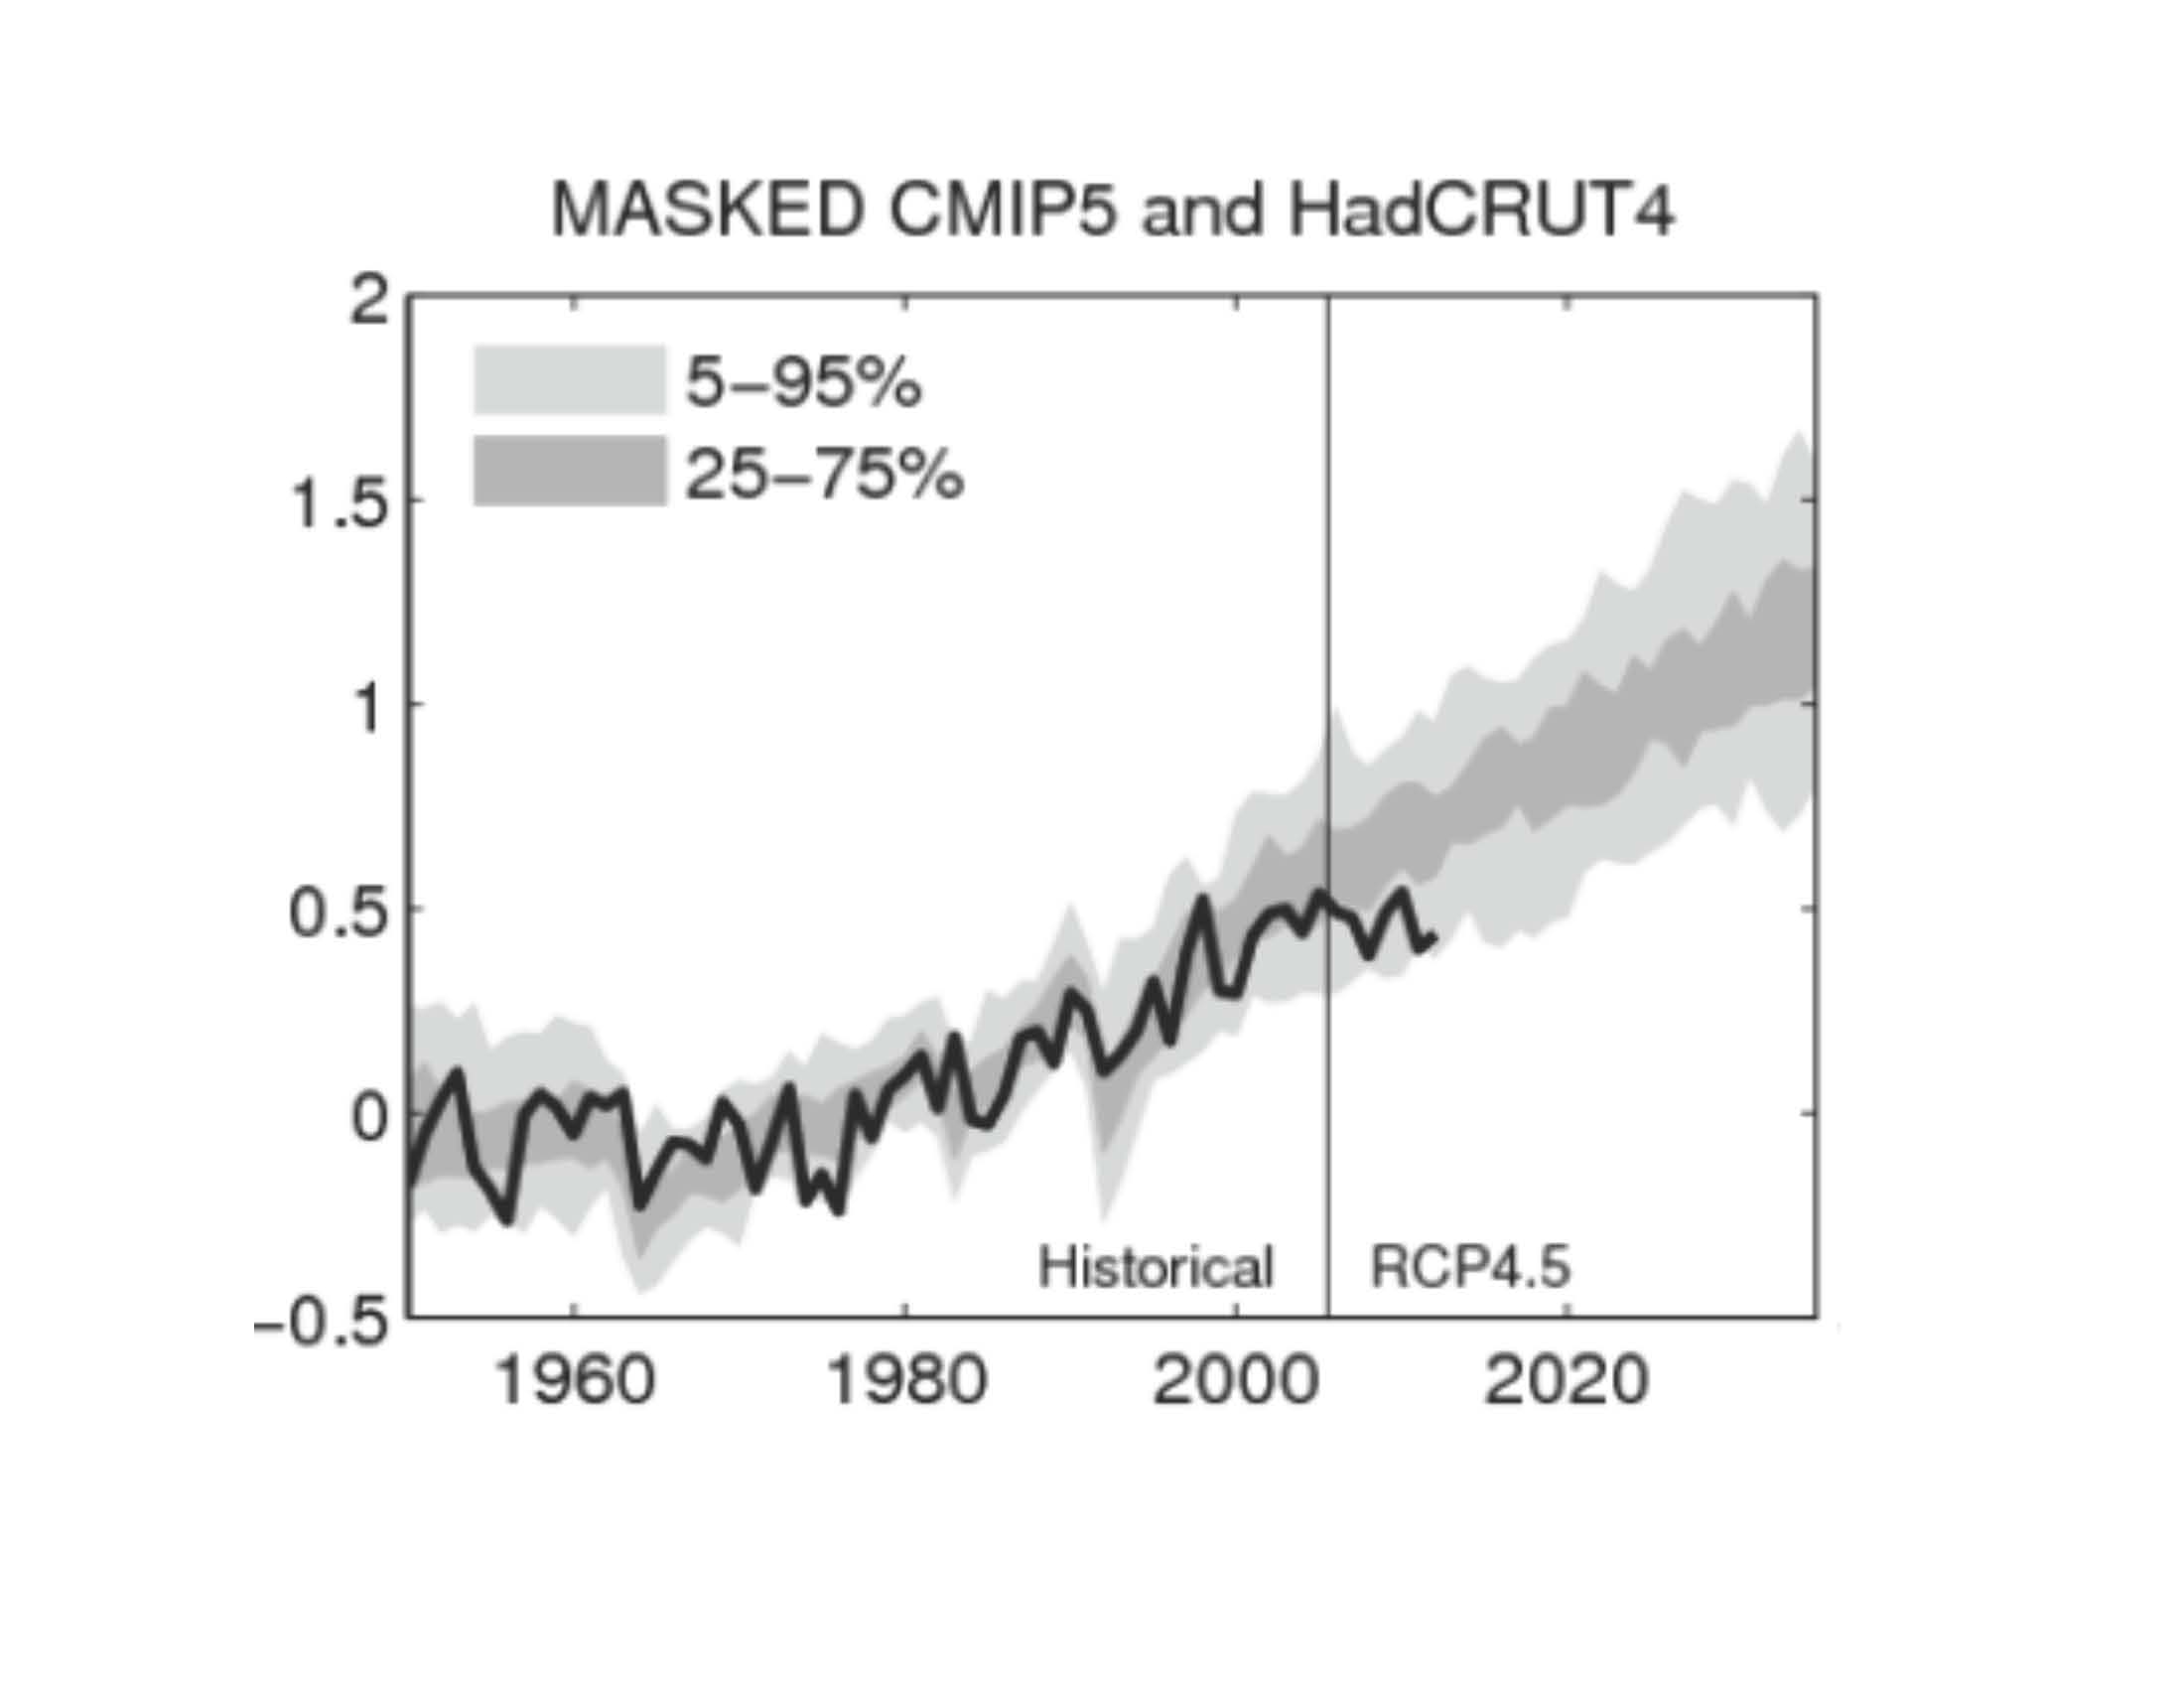
The bottom line remains Ed Hawkins’ figure that compares climate model simulations for regions where the surface observations exist. This is the appropriate way to compare climate models to surface observations, and the outstanding issue is that the climate models and observations disagree.
Is there anything useful from Cowtan and Wray? Well, they raise the issue that we should try to figure out some way obtain the variations of surface temperature over the Arctic Ocean. This is an active topic of research.
===============================================================
More from the same post at Dr. Curry’s site here
What is really funny is how Dana Nuccitelli has done an about-face since the satellite data now supports his argument. In his Guardian 97% piece [cited in Dr. Curry’s article] he’s all for this method.
But, just two years ago he was trashing the UAH satellite data on SKS as “misinformation”.

[http://www.skepticalscience.com/uah-misrepresentation-anniversary-part1.html]
But Dana thinks UAH data is apparently OK today. What a plonker.
I will give Dr. Cowtan props though for realizing what the hypers don’t. He says this in the Guardian article:
“No difficult scientific problem is ever solved in a single paper. I don’t expect our paper to be the last word on this, but I hope we have advanced the discussion.
I give him props for having a sense of reality, something sorely lacking in climate science today.
Here’s why trying to use the satellite data to infill surface data at the poles is problematic:
Take a look at this latest image for 1000mb (near the surface) from the polar orbiting satellite NOAA-18, one of the satellites UAH now uses for temperature data:

Source: NOAA/NESDIS Office of Satellite Data Processing and Distribution (OSDPD)
Note how the data near the poles starts to get spotty with coverage? Note also how the plot doesn’t go to 90N or 90S?
NOAA doesn’t even try to plot data from there, for the reasons that Dr. Curry has given:
Second, UAH satellite analyses. Not useful at high latitudes in the presence of temperature inversions and not useful over sea ice (which has a very complex spatially varying microwave emission signature).
NOAA knows high latitude near-pole data will be noisy and not representative, so they don’t even try to display it. UAH is the same way. Between the look-angle problem and the noise generated by sea ice, their data analysis stops short of the pole. RSS does the same due to the same physical constraints of orbit and look angle.
As you can see, the polar orbit isn’t truly polar. Here are maps from UCAR that helps to visualize the problem:

As you can see, the orbit path never reaches 90N or 90S.

Source: http://www.rap.ucar.edu/~djohnson/satellite/coverage.html#polar
They write:
Note that the orbit is slightly tilted towards the northwest and does not actually go over the poles. While the red path follows the earth track of the satellite, the transparent overlay indicates the coverage area for the AVHRR imaging instrument carried by NOAA/POES satellites. This instrument scans a roughly 3000 km wide swath. The map projection used in this illustration, a cylindrical equidistant projection, becomes increasingly distorted near the poles, as can be seen by the seeming explosion of the viewing area as the satellite nears its northern and southern most orbital limits.

So, not only is the satellite coverage distorted at the poles due to the look angle, the look angle issue actually causes the satellite to image a wider swath of an area known to produce noisy and highly uncertain microwave data. Basically, the higher the latitude of the satellite imaging past about 60N/60S, the more uncertain the data gets.
It seems to me that all that Cowtan & Wray have done is swapped one type of highly uncertain data infilling with another. The claim that the addition of this highly uncertain data to HadCRUT4 seems to contradict ‘the pause’ most certainly isn’t proven yet, as even Dr. Cowtan admits to in his caveat.
When you wrote “A video of their methodology follows”, I thought I was going to be treated to some amusing shots of chimpanzees flinging feces at one another. Well, same difference.
Way not Wray – “Robert G. Way”
Si, we don’t know anymore now than we did before, right?
Dr Curry has a misspelling (just so you know):
It’s Robert Way (not Wray)
Kevin Cowtan (University of York) and Robert Way (University of Ottawa)
REPLY: yes, and I picked up on that and repeated it in my post. This is now corrected in the post, and I added a [sic] next to Dr. Curry’s typo. – Anthony
Just like Kloor has shown it’s ridiculous now for alarmists to do their regular ambulance chasing at every hurricane or drought, likewise scientists should stop claiming to have found the missing heat in the most convenient of places, namely where nobody can get much reasonable data from (it was the depths of the ocean, not it’s the most remote of the North Pole).
There are also many other problems with this pausebuster. Have the scientists involved deliberately misled the IPCC by telling nobody about what was incoming two months later? If they are right, isn’t Dear Kev wrong about the oceans?
If they are right, then people claiming that there was a pause (based on non-infilled data)were right, and Dana and SkS wrong in dismissing the pause.
Also if the North Pole puts the trend back to expected values, this means the recent warming is becoming more and more northern-polar than global.
Furthermore this would be yet another AGW miracle, with values magically going back to be exactly as expected.
Etc etc.
Here we go again – more data from the ‘middle of nowhere’, literally! I dunno whether I can stomach to watch the method video. Someone tell me if it makes sense, and if I can use the same methodology to magic money into my bank account, as there is none there at present!
It’s not really a “pausebuster”, that’s just the way Stefan Rahmstorf describes it.
If you look at the actual reconstruction (Cowtan & Way, Figure 4a), which I think is “hybrid” method…what pops out at you initially is a big difference in trend.
If you look at it more carefully, what you notice is, actually it tracks the other curves pretty well except for the period 2010-2012, where there is a big excursion. If you look carefully, at the most recent points, the “hybrid” method seems to be converging back to the other curves. Whether it will end up tracking the other methods, time will tell.
If you ordinary-least-fit (OLS the curve, where you have a large excursion near one end point, OLS will over-weight this excursion in it’s fit. Especially if you cherry pick the intervals like Rahmstorf did. The claim by Ramhstorf “Global Warming Since 1997 Underestimated by Half” is owned by Rahmstorf and not by Cowtan. The paper does not make this claim, nor do I think, do Cowtan nor Way.
Regarding the 2010-2012 excursion, “R”, over on Lucia’s blog suggests:
It’s worth verifying his recollection, but the bigger point is, adding more data points in the Northern Arctic mixes into the stew the variations from that region that were previously missing. You’ll get more features in the global mean temperature series associated with polar variability. That’s pretty sensible.
Time will tell whether or not the small trend difference seen from 2005-now is real, or just associated with longer period polar variability. Obviously it’s too short of an interval to be popping the champagne, as Rahmstorf appears to be doing, celebrating 20 more years of global warming [funding].
Even GISS figures with their 1200km smoothing (right or wrong) show the same pause as the other sets, so they cannot argue the poles are being ignored.
Indeed, take out the poles from the GISS dataset, and I would imagine you would end up with a cooling trend.
Lots of sciency talk. Lets just simplify: “We made stuff up.”
Lots of Sciencey talk. Here’s the bottom line: “We made stuff up to support the cause.”
Filling in data is worse then doing nothing.
Carrick says:
November 14, 2013 at 9:38 am
“If you look at it more carefully, what you notice is, actually it tracks the other curves pretty well except for the period 2010-2012, where there is a big excursion. If you look carefully, at the most recent points, the “hybrid” method seems to be converging back to the other curves. Whether it will end up tracking the other methods, time will tell.”
Let’s call the excursion “the ghost of warming past”. I haven’t looked at their method but wouldn’t be surprised that if you repeated their computation in a year from now you would see the ghost of warming past following the present in a convenient constant distance. Because that would be a great Way (no pun intended) to create the necessary science. I think we don’t need scare quotes around the word science anymore. There is korrekt science, and then there is anti-science, which is evil.
So, just to clarify:
At first they claimed there was no pause. Then they admitted there was a pause but it didn’t matter because all the heat was teleporting into the deep ocean via some yet-to-be-decided upon mechanism. Now they claim there is no pause because all the heat is actually in the Arctic?
They seem to like satellite data when it suits them. Why not just use the satellite data, period, so that you aren’t picking and chosing from different sets of data?
Can Steve Mosher chime in on this?
Bwilliams says:
November 14, 2013 at 9:50 am
So, it must be really, really hot in the depths of the Arctic Ocean!
There’s a missing “y” near the start of the quote from J. Curry:
“The state that most of the difference . . . .”
“reconstructing the unobserved regions”
There… are… no… words.
I dont’ know why such drivel (The paper) even gets mentioned here.
So they are basically saying that we can’t measure the earth’s “temperature”, and shouldn’t draw any conclusions from our current data – warming or cooling. OK, lets improve our data collection and let our great-grand children revisit this debate.
Does this not mean that “global” warming is actually regional warming?
There is a concerted attempt to translate a global, CO2-induced, IR re-radiative warming force into a series of local or regional events. The warming is not in the troposphere, it is lower or higher. The drought is not here or here, but there, the rainfall etc. Even the oceans: the warming is not at the surface or even in the top 700m, but deep. In each of these examples a purported global phenomenon – retained heat proportional to the local insolation and re-radiation – has been collected and concentrated without altering conditions of the greater parts. We are supposed to see meaningful spikes without a trend in spikes or a trend in the background. Haiynan, for example, is ferocious because of global warming, but only that hurricane, not the other storms of the season or seasons past.
If you frame “global” as the sum of “regional”, you have what I call Computational Reality. The numbers work that way. But if you see “regional” as indicative of regionality, i.e. a non-random distribution of situations that may or may not have a global cause, you are working towards what I call Representational Reality. Which is not necessarily the same thing.
These authors – and many others, including butterfly specialists – put out papers that profess to show Representational Reality. I say they only achieve Computational Reality; the greater Reality remains to be determined. Unfortunately, neither the MSM nor the editors nor the grant-dispensing machines care to ensure that difference is noted.
A bit more info at Dr. Cowtan’s website including some data and code.
http://www-users.york.ac.uk/~kdc3/papers/coverage2013/index.html
Off topic, you must hear Larry the Cable Guy’s global warming bit.
I have a very basic question and asked a BEST person on Climate Etc of which may be directed to Dr Way. That is when I strike a midsection trend (not OLS trend) through Hadcrut 4 (1979-2013) the trend shows up at about a 20 degree angle. When I did the same on Cowtan and Ways chart that shows up at the end of that video (1980-2013 and posted on another site) it shows up at about a 35 degree angle. Then when I plot it through the UAH chart (1979-2013) it shows up at somewhere between 10 to 15 degrees. This is all very approximate; it is obvious to the eye which is why I bothered. Why are there big differences?
“Bwilliams says:
November 14, 2013 at 9:50 am
So, just to clarify: ”
No, you missed out that the lack of warming is also because of the reduction of CFC’s.
http://wattsupwiththat.com/2013/11/11/busted-messaging-cfcs-cause-warming-and-cooling/
In reality all of the wind turbines are causing such a breeze that they must have cooled things down as well. Also replacing the space shuttle with Russian rockets plus Chinese, japanese and Indian rockets means that more and bigger holes are being punched in the stratosphere and letting more heat out (;>)
The ghost of Stefan-Boltzmann haunted the debate from day one and now it is back.
For easy figuring, it takes about 1.8 w/m2 to raise the temperature in the Antarctic from 200K to 201K, or 1 degree. But that same 1.8 w/m2 in the tropics at 303K only raises the temperature by less than 0.3 degrees!
The mind numbing stupidity of averaging temperatures from widely disparate temperature ranges is ridiculous in the first place. But hey, let’s role with their version of exactly where the Lock Ness monster is hiding anyway. Let’s say these places where nothing lives, nothing grows, and everything is frozen, warm by several degrees. The result will be that these are now places where…. nothing lives, nothing grows, and everything is frozen. Yay! We’re saved! The rest of the planet will be fine because the poles took a few photon torpedoes for us.
Question – how do they justify feed backs at the poles? At those temps, water vapour is pretty much zilch, and warming by a few degrees would increase the holding capacity by about… zilch. So if we assume for a moment that they are right, that the heat is accumulating at the poles, then an absence of water vapour and low ozone levels pretty much gaurantees that the heat gets radiated to space anyway.
Or are we now concerned that the heat may suddenly come back from outer space too?
My first thoughts were the same as Bwilliams. How come Dana et al can once again embrace ‘no pause’ denialism if they’ve already ‘explained’ the pause in surface temperatures as the result of heat accumulating in the ocean depths? Was that just an ad hoc theory they spun to keep their support base happy? Or is it even worse than we thought? Or are they just making it up as they go along?
I don’t understand how they can infill the poles with satellite data when:
UAH only covers up to 85N and 85S
And
RSS to 82.5N and 70S.
Are they infilling from their infill?
I can prove anything by making up the data.
So…. I assume they are correct — and further that saves the effort having to fully read this post or their paper. It’s a real time saver.
Any other questions?
“Or are we now concerned that the heat may suddenly come back from outer space too?”
It bounces off the moon.
Like the country gal said regarding infilling data, although she might have thought we were talking about inbreeding:
We don’t need no outside data when we have our own “dada”.
🙂
The page with the figures about the orbits keeps talking about geostationary satellites — but POES is obviously very much not geostationary, and the ground track of AVHRR is not 3000km. I’m not sure what’s going on there. Instead, let’s look at some engineering data about these particular satellites:
http://www.osd.noaa.gov/Spacecraft%20Systems/Pollar_Orbiting_Sat/NOAA_N_Prime/NOAA_NP_Booklet.pdf
The satellite orbits at 870km, with inclination about 98. AVHRR can see 55.4 degrees from nadir. That means the satellite gets to 82 degrees North, and can see about 700 km (6.5 degrees latitude) further North than that. So there’s only a hole above 88 degrees. AMSU can see 48.3 degrees off nadir, making for a slightly larger polar hole in that instrument, three degrees latitude radius. Two poles, so they’re missing 0.15% of the surface, as opposed to 14% for surface instruments.
High latitudes get a lot more coverage than low latitudes, because the view tracks overlap up there; the satellite sees the same spot several orbits in a row, rather than once a day. I can well believe the data is harder to use though.
But Dana Nuccitelli said the missing heat went into the deep oceans.
read lubos motl post about it…
It’s really funny how the ‘missing heat’ always goes into locations where we don’t have thermometers.
Jimbo says:
November 14, 2013 at 11:13 am
But Dana Nuccitelli said the missing heat went into the deep oceans.
I believe the claim was that it was hiding there.
Once we found the hiding place, it moved, according to “them” it is now at the poles.
But, now we found it again, so where will it go next?
I’m suggesting under the seats of the CAGW alarmists.
🙂
davidmhoffer: “Question – how do they justify feed backs at the poles? At those temps, water vapour is pretty much zilch, and warming by a few degrees would increase the holding capacity by about… zilch. So if we assume for a moment that they are right, that the heat is accumulating at the poles, then an absence of water vapour and low ozone levels pretty much gaurantees that the heat gets radiated to space anyway.”
The main feedback for arctic amplification is albedo, not water vapour. Melt the ice and snow in summer (but leave the surface frozen in winter), and less of the solar energy will be reflected.
Your argument about water vapour is backwards: the lower the temperature, the more relative increase you get in water vapour from a given number of degrees temperature increase.
What have we seen in the Arctic this year? It was a chilly one and sea ice extent was significantly higher this September on last year. This past summer it was the record coldest daily mean temperature for the Arctic area north of the 80th northern parallel, plotted with daily climate values calculated from the period 1958-2002.
http://ocean.dmi.dk/arctic/meant80n.uk.php
numerobis;
Your argument about water vapour is backwards: the lower the temperature, the more relative increase you get in water vapour from a given number of degrees temperature increase.
>>>>>>>>>>>>>>>>>
Oh is it now? What was my argument? My argument was that at very cold temperatures holding capacity doesn’t change very much, almost none.
http://www.engineeringtoolbox.com/water-vapor-air-d_854.html
As you can see, below freezing the numbers get so low that they don’t matter, let alone at -40C to -80C at the poles.
Dana’s Guardian blog is a bit like the missing heat. It’s always lurking there until sceptics come tolhave a look. Then it moves somewhere new.
Dana was all over this paper as proof that the world is ending after all.
But now that WUWT has broadcast Professor Curry’s review the Guardian has dropped Dana’s blog from the front of its environment page. Of course, it was yesterday’s news and there have been bicycle crashes in London so it may just be a matter of newsworthiness. AGW has to compete with other dangers for vital electronic newsprint.
Which is rather a shame as my one of my favourite comments of all time was plopped onto Dana’s blog by Danabanana. I think he must be taking the mickey as the pause is being discussed and the Poland Climate talks are not:
http://discussion.theguardian.com/comment-permalink/28840072
Hilarious.
Oh look. Another hockey stick. We’ll have enough for a game now.
‘John says:
November 14, 2013 at 9:54 am
They seem to like satellite data when it suits them. Why not just use the satellite data, period, so that you aren’t picking and chosing from different sets of data?
Can Steve Mosher chime in on this?
###################
1. Its well known that leaving out arctic data causes a cool bias
A) reanalysis ( which anthony uses) shows this
B) when CRU added more arctic stations they warmed ( as I predicted)
C) We use more arctic data than CRU and are warmer.
In a nutshell. The CRU method forces them to only consider a small subset (5K) of all stations.
When they leave out the arctic they implicitly imput the GLOBAL AVERAGE to the missing
data. Folks need to get that. We see a pattern of warming as we go from 0-70degree
That pattern says warming trend increases with latitude. Now, when CRU leave the pole missing, that imputs a LOWER trend to areas north of 70 degrees. Giss, extrapolate over the pole. They imput the SAME trend at 70 to areas from 70 to 90.
As we look at other sources of data, namely bouys and short data series closer to the pole,
we can see that CRU is wrong to imput a lower trend to areas north of 70.
2. How do we estimate the ‘missing data’
A) if you leave it out you are STILL imputing a trend. you are imputing the lower trend
of the entire globe. And all your data says that trend increases from 0 to 70 degrees..
Why on earth would you asssume it would go down from 70-90. Understand, leaving
this area ‘unestimated’ HAS THE MATHEMATICAL EFFECT of imputing a lower trend
to areas north of 70
B) extrapolate from 70 north to 90 north. This effectively argues that the warming
trend versus latitude CEASES at 70 north. On what basis is this assumption made
C) come up with a method that is based on some data.
So Kevin and Robert choose to do something similar to what Mcintyre, Jeff ID, Ryan Odonnel, and nic Lewis did for antarctica.
Use the PATTERN of UAH data to draw inferences about the missing data
lets show a really simple example
measure A Measure B
7 5
7 5
7 (held out)
4 3
4 3
4 (held out)
7 missing
4 missing
So, you use measure A to infer what is at measure B. And you ‘hold out” samples
of measure B.
you then predict those hold outs.
you then compare your prediction to the hold outs
That test the validity.
You then use the method to fill in the missing.
the great thing about this study is that somebody finally used arctic bouy data.
you see there ARE observations of surface air temp in the arctic but to date nobody
has figured out how to use them. CRU can NEVER use them because CRU requires
20 years of data between 1960 and 1990. But more advanced methods dont have this requirement
So here is the question.
CRU predicts nothing for the artcic
GISS extrapolates 70degrees to 90.
Way uses data from UAH to predict a temperature north of 90 and then CHECKS IT
against bouy data.
Which gives you a better picture
CRU, which infers that warming north of 70 will be LESS THAN warming at 70
GISS which infers that warming north of 70 will be the SAME as warming at 70
or Keven and robert, who make an estimate based on a methodology that passes
cross validation? and who test this using actual measures.
For the record, if the UAH data were garbage at the pole it never would have passed the validation.
and hint…. there might be an even better source of data ( hehe).. maybe I’ll let folks say a few more dumb things first…
“That if desperate times call for desperate measures, then I’m free to act as desperately as I wish.”
― Suzanne Collins, Catching Fire
Water vapour isn’t believed to be the main reason for arctic amplification. After all, the water feedback operates everywhere.
That said, the strength of the feedback is logarithmic: you get X warming by doubling the number of molecules. That’s why trace gases are more bothersome than more common gases: it’s easier to double the number of molecules of CFCs than to double the amount of CO2, so each molecule causes more warming. So yes, there are very few molecules of water in cold air. But that means a change of 1 degree, which is a bigger relative change in temperature at 200K (polar winter) than at 300K (every day in the tropics), and thus a bigger relative change in the number of H2O molecules, has a bigger effect.
numerobis;
That said, the strength of the feedback is logarithmic: you get X warming by doubling the number of molecules.
>>>>>>>>>
Provided that they are evenly distributed through the troposphere….which water vapour is NOT.
My point remains that the main greenhouse gas is water vapour, it is 30,000 to 40,000 ppm over the oceans in the tropics and only dozens at the poles. A few degrees change in temp at the poles isn’t going to make a substantial difference in terms of what the ghg’s do, but it does make a substantial difference in terms of energy being radiated to space. So the heat can “go” to the poles, but it can’t “hide” at the poles.
Steven Mosher,
“maybe I’ll let folks say a few more dumb things first…”
Life has been enriched once again. Well done you.
Steven Mosher;
That’s all well and good, but you can look at it both ways. Not including arctic regions may result in the global trend being under estimated, or you could as easily say that including them results in the global trend being over estimated.
The truth of the matter is that unless, and until, the temperature data is FIRST converted to w/m2 and THEN averaged,the trends from UAH, RSS, GISS, HadCrut and BEST are meaningless. You cannot use temperature averaged in any way shape of form as a proxy to measure energy balance. In other words, any estimation of temperatures in the arctic regions is just a new way of understanding energy balance that like the old way, is wrong.
Just for the record, I got in the second comment on Dana’s piece, which also gathered the most ‘recommends’. It was removed by a moderator. Can anyone tell me what was so offensive and outrageous about this that it warranted censorship? –
http://oi44.tinypic.com/2ebhjyv.jpg
Steven Mosher says:
November 14, 2013 at 12:03 pm
Should the gatekeepers find Arctic temperatures too cold, they’ll just “adjust” them upwards, anyway.
1200 km for estimating temperature? I live in Richmond, VA. I’ve lived in Kalamazoo, MI, (~900 km from Richmond) and New Orleans (~1350 km from Richmond). I wouldn’t have thought that the temperature data from anyone of these would be an appropriate substitute for the other. Particulary the years I spent getting on an airplane in 90F NOLA and getting off in the snow in KZ. I guess that’s why I’m not an expert climate scientist because I’ve always been a bit less sloppy with estimating missing data.
Doug Proctor says:
November 14, 2013 at 10:19 am
davidmhoffer says:
November 14, 2013 at 10:37 am
Both make good points. And since the warming only affects certain remote and uninhabited regions, people living in inhabited regions have nothing to fear from Nonglobal Warming! (Typhoon Haiynan turned out NOT to be an example of Global Warming Catastrophe – it did not track over unprecedentedly hot waters, nor blow unprecedentedly hard.)
There was a time when people understood that even two valleys next to each other could have different weather , there was a times when people understood that mountains create their own weather and you can not use their weather patterns to predict what happens in other areas.
But now thanks to the ‘magic’ of AGW we can take weather data from one area and apply it to another one many,, many miles away which is total different in nature .
When plotting data from 1979 to 2013, all of the datasets show warming to various amounts. They all show a reduced trend since around 1998. Presumably there has been extensive analysis comparing surface and troposphere measurements at a plethora of locations around the globe. There should not be any surprises wherever this comparison has already been made. That turns out to be at least 90% of the global surface.
Now consider the Arctic region, where all the bright red temperature anomalies apparently exist. From the Arctic circle to the pole, this represents only about 4% of the total globe surface area. In order for this tiny chunk of area to create a significant change in the global surface temperature trend, the temperature trends there must be absolutely massive.
This is not credible. Something is fishy in Denmark.
On a positive note, if this paper turns out to be valid, then the global surface temperature trend prior to 1979 is essentially unknowable.
So the latest in sophisticated methodology, using populations of 0 to prove the presence of the desired outcome, becomes ever more popular with AGW hypesters.
So, if they’re right, then the pause is actually a slowdown that should have been a period of acceleration per circa 1990 official story line. Remember the IPCC report with the graphic showing ever increasing trends of warming that supposedly proved it’s us and it’s worse than we thought and we’re doomed? Sorry, I don’t see it as a problem for the “skeptical” position of low sensitivity if Global Warming has slowed down during a period of ever increasing CO2 concentration.
Perhaps I can be more clear…
That study is clearly worth a Lew-en-dorsement!
It has all the required features — including data derived from …. nothing… zero sum, ergo sum.
This latest paper stinks of post hoc excuse finding. First the pause was due to heat magically hiding in the deep ocean, conveniently out of reach of measurement. And skeptics were shredded by the climatistas for questioning the mechanism of transportation. Now the warming is hiding at the poles, also conveniently out of reach of measurement.
And skeptics are to be blamed for asking “how does that work?”, and for pointing out flaws in the methodology of the latest “where’s AGW?”.
AGW is like tinkerbell- if we wish really really hard, AGW will be all better.
davidmhoffer says:
November 14, 2013 at 12:30 pm
numerobis;
That said, the strength of the feedback is logarithmic: you get X warming by doubling the number of molecules.
>>>>>>>>>
Provided that they are evenly distributed through the troposphere….which water vapour is NOT.
Water does not scatter the infrared it absorbs it. Thus it raises the heat content of the air without raising its temperature. That is the enthalpy of the air (its heat capacity) increases as the humidity increases.
Mosher and all the other non-engineers are averaging temperature are thus averaging the wrong metric. They should be measuring heat content in kilojoules per kilogram. After all isn’t the ‘global warming hypothesis’ about trapping heat – you can’t trap temperature Steven can you?
So as davidmhoffer says it requires almost no heat at all to raise the temperature of a volume of dry arctic air at minus 30C by one degree, but a large amount of energy is required to raise the temperature of a similar volume of 90% humidity equatorial Pacific air by one degree because the humid air enthalpy is so much higher. Yet you ‘highly trained climate scientists’ average the temperature of these volumes of air to measure heat???
For that reason alone the Cowtan and Way should have been thrown out at peer review.
Steven Mosher says: “2. How do we estimate the ‘missing data’…”
Use satellite-enhanced sea surface temperature data for the open ocean, when there is open water in the Arctic and Southern Oceans. The poor in situ coverage of the polar oceans is one of the primary reasons satellite-enhanced SST datasets exist.
So………….the missing heat is hiding in the cold?
Jimbo says:
“November 14, 2013 at 11:30 am
What have we seen in the Arctic this year? It was a chilly one and sea ice extent was significantly higher this September on last year…
http://ocean.dmi.dk/arctic/meant80n.uk.php”
This web site has the following info:
“Plus 80N Temperatures – explanation.
The temperature graphs are made from numerical weather prediction (NWP)
“analysis” data. Analyses are the model fields used to start NWP models. They
represent the statistically most likely state of the atmosphere, given the
information available to make the analysis. Since the data are gridded, it is
straight forward to deduce the average temperature North of 80 degree North.
However, since the model is gridded in a regular 0.5 degree grid, the mean
temperature values are strongly biased towards the temperature in the most
northern part of the Arctic! Therefore, do NOT use this measure as an actual
physical mean temperature of the arctic. The ‘plus 80 North mean temperature’
graphs can be used for comparing one year to an other.”
My question is can this data be converted to annual mean temp and compared to
previous years?
The following sums up the Cowtan and Way “analysis”:
“When you reach the end of your rope, tie a knot and hang on.”
― Abraham Lincoln
What exactly is the justification for using some of the satellite data and not all of it?
Both satellite series support the existance of the pause.
“At first glance, this seems an admirable and reasonable goal, but one should always be wary of trying to create data where there is none, something we learned about in Steig et al’s discredited paper on the supposed Antarctic warming.”
Steig’s paper was not discredited, and particularly not his method of fitting satellite-derived EOFs to station data to infill. His critics Ryan et al used the same method. They used more EOFs, which gave an improvement.
Whenever you calculate a space average from sampled data, there is an implied assumption that the samples are representative of data in between. That’s not just climate science, it’s for any continuum analysis. The average is justified by interpolation. Any form of rational interpolation is better than leaving areas out.
The Apocalypse has risen, Alleluia!
Ian W;
I hate to burst your bubble, but ghg theory has little to do with heat capacity or heat at all. We get very sloppy with terminology in this debate. The relationship is to energy flux and temperature. That’s why I said “energy balance” above rather than heat, but I am one of the ones guilty of sometimes using “heat” when that is the wrong term. Per your comment, water vapour does absorb but it also re-radiates, and this changes the mean radiating level and the temperature profile from surface to TOA as a consequence. Here is a pretty good explanatio:
http://wattsupwiththat.com/2011/03/10/visualizing-the-greenhouse-effect-emission-spectra/
Stupid question for Mr Mosher:
If we extrapolate arctic region temps from measured temps, assuming the methodology is accurate, would not a 17 year pause in the measured temps result in a 17 year pause in the extrapolated temps?
Nick Stokes said,
I’m often critical of Nick but I’ve got to say I think he’s got a point here. I haven’t read the paper (with my limited grasp of the science it wouldn’t make all that much difference if I did) but from what I’ve gathered so far from the discussions about it I’m thinking this paper is probably pretty solid. Perfect? No, but it’s probably a step in the right direction.
…and here is my favourite graphic from ERBE:
http://eos.atmos.washington.edu/cgi-bin/erbe/disp.pl?net.ann.
A few moments studying this, and you can easily see that
1. The tropics are net absorbers of energy. They absorb strongest over regions where humidity is high.
2. The arctic regions are net radiators of energy.
So, simply put, energy is absorbed from the sun in the tropics, via various mechanisms such as wind and water currents it is moved to the arctic regions, from which it is beamed out into space. If the temps in the arctic regions are in fact rising while the rest of the earth has remained the same, it means that energy is being pumped into space FASTER than before and (depending on by how much) this may mean the system is LOSING energy and thus COOLING despite having a higher average temperature.
Which is why it is insane, ludicrous, and completely useless to average temperature in the first place.
Re: numerobis 11:11 am
I find it quite ironic that in the polar latitudes where the solar-synchronous orbits allow overlap and multiple readings per day instead of just one daylight reading per day at the equator, the data gets harder to use.
“Climate Science”: Making stuff up for a generation
What pause?….the planet is not behaving in the way predicted by the models because they are acts of fantasy. The AGW mob had their chance in 2002 but the Aqua satellite found no evidence of Troposphere warming….game over in the real world. However when a theory is turned into an agenda, then a way of life and the believers turn it into a religion there is no going back…or not for this generation anyway. If as seems likely the Solar Physicists are correct and we experience a deep solar minimum in the middle of this century we will need all the CO2 we can get but until then the madness will continue.
One would have thought by now that the media could have shown just a little professionalism by comparing current temps with those from earlier this Holocene…and several recent Holocene’s as well.
Nick Stokes: “Steig’s paper was not discredited, and particularly not his method of fitting satellite-derived EOFs to station data to infill”
Define discredited. Because just looking at the before/after pictures at the link show that, whatever Steig was doing, it didn’t have any relation to thermometers.
And define ‘fitting …. to…’ Because if we’re fitting satellite imagery to faked numbers, then it’s damned wrong on it’s face. No matter if it’s done in the manner or Steig, Ryan, or in any other fashion.
“The average is justified by interpolation. Any form of rational interpolation is better than leaving areas out.”
Because “We don’t know and need more instruments” isn’t good for… funding? Nope, that gets you funding. Must be for the speaking tours and activism.
And define ‘rational’, because what is irrational is to state that the area under a curve we know to be non-linear and with possibly zero peaks, possibly many, is some ‘smooth’ progression from place to place. It’s even more irrational to state you can take any manner of sensible average off that. For all that’s worth you might as well measure hips, busts, fake some waist measurements, and call it the average Marilyn Monroe. It’s that not just numerology, but whiskey-fueled ditch-drunk numerology.
If climate scientists accept this paper, won’t they be admitting that they have been calculating the average global temperature wrong all this time? If they could make such a big mistake in how they estimated polar temperatures, doesn’t that open the door to the possibility of other major mistakes in their methodology? Do they really want to admit that the science isn’t so settled after all?
Mr. Greene, you misunderstand. The belief is that while obviously the temperatures will be different between any two locations 500km apart, the trends in the data will be similar. So if
you don’t have enough data to compute a valid trend at station A, but you do at station B which is within some radius (500km, for example), you can assume that the trends will be similiar at both stations and can compute a trend at station A based on the data that is available for station A using the trend information from station B. I’m not sure I buy into that, I suspect that geographical, land use, development (UHI) and microclimatalogical constraints apply to the choice of station B, but there you are.
Nick Stokes;
Any form of rational interpolation is better than leaving areas out.
>>>>>>>>>>>.
…and same question to you as to Mr Mosher. If there has been a 17 year pause in the MEASURED temps, then how does one arrive at anything but a 17 year pause in the INTERPOLATED temps?
I’m guessing this is another of those papers that will be used by politicians as if it was written on tablets of stone and will be quoted as the reason why we must continue to de-industrialise the West.
JQuip,
My view is that sure, it would be lovely if we had surface readings everywhere. The fact is that we don’t. The question becomes, how best do we deal with that?
Steve and Nick seem to be arguing that ignoring this is worse than using this approximation – and I don’t think anyone is pretending this is anything but an approximation or estimation method. At least I hope they aren’t. But I don’t seem to see anything insane in what Steve or Nick are saying.
The question for me is, did they do a reasonable job when they worked it out in the paper? The fact that they published accessible methods code & data looks promising. My impression is that they worked pretty hard to validate the method as best they could. If I had to bet I’d bet this is solid.
~shrug~
Just my two cents.
Davidmhoffer,
I suspect the ‘pausebuster’ hype is just that; a bunch o’ hype without much substance. Over in the comments at Climate Etc. I think someone showed the statistics demonstrating this really doesn’t mean much of anything, not for the pause and not for the models either.
The sad thing here appears to be using data which is not understood.
The even sadder thing, is that a (supposedly) respected journal and its expert reviewers didn’t catch that.
How to be a “Climate Scientist”
Step 1: Take a dataset that superficially shows the effect you like, despite being thoroughly riddled with errors and biases, leading to error bands larger than that effect.
Step 2: Pretend the enormous error bands do not exist, and declare that the dataset is wonderful as is, and perfectly good for informing thousand trillion dollar decisions with high certainty.
Step 3: Selectively eliminate some of the errors in the dataset, with corrections that drive the results toward your pre-selected “finding”. Hysterically declare: It’s worse than we thought!
Step 4: Declare the newly improved dataset is wonderful as is, and perfectly good for informing thousand trillion dollar decisions. Decry the ‘uncorrected’ dataset as hopelessly biased and useless for any decision making, especially if the recent data in that version is trending in inconvenient directions. Belligerently assert that even though you are constantly ginning up changes that as much as double the severity of your estimates from one instance to the next, your ongoing confidence in the accuracy of your estimates remains beyond question.
Rinse, repeat.
David,
Yeah, the comment I was referring to about the lack of impact on the pause was:
http://judithcurry.com/2013/11/13/uncertainty-in-sst-measurements-and-data-sets/#comment-413386
The discussion of how this doesn’t save the models is over at Lucia’s.
Mosher, good points. Except your GISS claim that their trend at higher latitudes is equal to the trend at 70N is not supported by GISS data. The trend by latitude graph from the giss.website run from 1998-present (or any other recent time period) shows latitudes north of 70N having a significantly higher positive temperature trend.
http://s21.postimg.org/eej70vqnb/nmaps_zonal.gif
Source site: http://data.giss.nasa.gov/gistemp/maps/
“The new research suggests, however, that the addition of the ‘missing’ data indicates that the rate of warming since 1997 has been two and a half times greater than shown in the Met Office studies.”
But if the warming since 1997 has been essentially zero, then 2.5 X 0 = 0, doesn’t it?
Mark Bofill: “The fact is that we don’t. The question becomes, how best do we deal with that?”
Set up new instruments so we can get the data we don’t have. Ostensibly (Caveat Latitude) we have spacecraft now and shouldn’t be interpolating anything. But then no one seems to like the satellites since they don’t seem to be terribly reliable.
But as for interpolating? Sure, if you already know what the empty space *should* look like as a statistical normalcy. But to know that, you’ve had to have measured it, a bunch, previously. Otherwise it’s just made up numbers and you’d be just as close, or as far, to treat it like Dungeons and Dragons, and roll dice for every empty mile.
David Hoffer
The average does not reflect the temperature gradient. In fact, the average you are talking about reflects an observed cooling in the south pacific (17 year pause). If the interpolation was taken strictly from that region and applied over the arctic it would show decided cooling over the last 20 years.
of course, they did not apply normalized temperature changes from the tropical pacific to the arctic, they used regions approaching the northern limit of the UAH data and compared them with observed surface temperatures.
Since the polar regions show a much higher average temperature increase than the global average, the interpolated temperatures show higher rates of warming when applied.
Of course, this is a methodology that so many here decried when applied to the GISS data. As if not leaving the arctic warming out of the average is somehow manipulating the data so that it is no longer honest, or, that the only “honest” measurements don’t include the arctic where the majority of the observed warming has been occurring.
Whenever you calculate a space average from sampled data, there is an implied assumption that the samples are representative of data in between.
Has the assumption been tested? Are the sample intervals small enough to detect discontinuities? Because we know from experience that temps can vary greatly over just a few miles. So what is the data grid? What is the interpolation grid?
the arctic where the majority of the observed warming has been occurring.
Shouldn’t we see low sea ice extent as we did in 2012?
I still don’t know that I’m happy with comparing simulated-GMST to actual-GMST as a measure of ‘model error’ in the first place.
If the model underpredicts somewhere (say, Seattle) by 1C, and overpredicts somewhere else of vaguely equal size (say, near Houston) by 1C, the error should be determined -before- the averaging. If you do it after the averaging you get ‘zero error’, which is incorrect. This is like least-squares, where an error in either direction is always added to the cumulative error – and here performed in a spatial fashion.
Interpreting the deviations in this fashion should also highlight any specific regional difficulties or successes. (Hey, Model X doesn’t work on coasts, Model Y does non-tropical oceans very well, etc.)
jai mitchell;
Since the polar regions show a much higher average temperature increase than the global average, the interpolated temperatures show higher rates of warming when applied.
>>>>>>>>>>>>>>>>>>>>
You can’t interpolate rising temps from something that isn’t rising. Thanks for playing, but I will be patient and wait for someone who actually knows what they are talking about to answer.
I love the smell of desperation in the morning. So, basically, they’re saying all their previous handwaving was just so much bluster. Otherwise, they would reject this alternative, claiming they already had the reasons for the “pause” in hand.
So those 1070 hPa polar anticyclones never existed since it’s all warm in the Arctic… LOL
In an effort to be scientifically correct we seem to be hyper-focused on an area of the planet where nobody lives.
Moreover, IF these guys are right, then what should we think of the IPCC “scientists” who explained the pause? Once again, this shows how biased the HadCRUt/GISS stuff is and how o.5C can be generated by statistical artefacts. Fortunately pressure readings are not subjected to that kind of BS…
UAH already covers up to 85N.
The total Earth surface area above 85N is 0.0019 of the total area or 0.19%
It takes a lot of warming in a 0.0019 area to change the global temperature anomaly from UAH by 0.01C. 5C I guess.
It doesn’t matter, all the other temperature datasets are now so contaminated that we should just give up on them and quit quoting the numbers.
If the warmers are still in business by the year 2100, their warming metric is going to show +3.0C no matter what the actual temperatures have done. In the year 2100, everyone will know it was too cold in 1900 to grow corn in Iowa.
davidmhoffer says: “Let’s say these places where nothing lives, nothing grows, and everything is frozen, warm by several degrees. The result will be that these are now places where…. nothing lives, nothing grows, and everything is frozen.”
O, the humidity!
Steve from Rockwood: “In an effort to be scientifically correct we seem to be hyper-focused on an area of the planet where nobody lives.”
That’s exactly why we need to be hysteric about it. If the global warming thesis is true, they will be. In a few hundred years or so.
Jquip says:
Disclaimer – to make use of the distinction David advanced, I don’t know what I’m talking about. Haven’t read the paywalled paper, probably wouldn’t be competent to opine even if I had. Effectively I’m repeating hearsay from people I presume are more competent than myself; caveat emptor.
This said, my understanding is that the method figures out a relationship between the satellite data and the surface readings, and uses that relationship to deduce what the surface readings ought to be from the satellite readings.
RSS shows no warming for 17 years. And the major focus has been on the Arctic and not the Antarctic. RSS covers up to latitude 82.5 degrees.
With the circumference of Earth being about 40000 km, the distance from 82.5 to 90 would be 7.5/90 x 10000 = 830 km. So the area in the north NOT covered is pir^2 = 2.16 x 10^6 km2. Dividing this by the area of the earth, 5.1 x 10^8 km2, we get about 0.42% NOT covered by RSS for the portion relevant to our discussion. As a fraction, this is about 1/230 of the area of the earth. So for argument sake, let us assume that this 1/230 warmed up more than other parts over the last 17 years. How would that change the length of the pause according to RSS? Would it become 16 years and 10 months perhaps?
At best this would a stopgap measure. Since the satellite data shows cooling outside of the polar areas the most likely situation is that the poles are simply lagging the rest of the planet and will also start to cool. And, they will likely cool faster than the rest of the planet. So, while this might provide some short term relief to the pause, it will eventually lead to a faster rate of cooling.
But it is even worse than you think!
A little more accurately, for a radius of 6371 km, you can show that:
Between 81 degrees and the pole, there is a total of 3,139,000 sq km
Between 82 degrees and the pole, there is a total of 2,481,000 sq km
Between 83 degrees and the pole, there is a total of 1,900,000 sq km
Between 84 degrees and the pole, there is a total of 1,397,000 sq km
Between 85 degrees and the pole, there is only 970,000 sq km
So this entire earth-equally temperature INCREASE has to occur within a maximum limit of 2.5 million sq km’s ……
At the same time that the DMI ENTIRE summertime record from 1959 through 2013 for latitude 80 north shows 0.0 difference in temperature between days 150 and 250 of the year.
So you actually need a very hot Canadian and Siberian Arctic land temperature, a stable (not increasing!) temperature band at 80 north latitude, and THEN a sudden (but unmeasured!) temperature increase in a very small area across the pole!
The germane question IMO is, if using these new methods had increased the temp hiatus or indicated a large cooling trend, would they have discarded it as an error or still publishe?
The paper picks 1997 – 2012 for analysis. Why?
The paper picks UAH rather than RSS. Why?
The paper’s hybrid result claims 0.18 C rise from 1997 – 2012.
From Wood For Trees:
HadCRUT4 gives 0.08 C rise from 1997 – 2012.
UAH gives 0.16 C rise from 1997 – 2012.
RSS gives 0.00 C rise from 1997 – 2012.
So, the paper pulls data from UAH that covers 3% of the globe (the Arctic), adds it into HadCRUT4, and gets a temp rise that is higher than either UAH or HadCRUT4.
Oh really?!???
“It’s really funny how the ‘missing heat’ always goes into locations where we don’t have thermometers.” (Jimbo at 11:17am today)
Yup. Aaaaand that, boys and girls, is why Santa Claus lives at the North Pole.
Steig’s paper has been discredited and not just by O’Donnell [2010]. Please see my comments here, here and here. The powerpoint referenced in the second link is here. It is interesting that there is a newer paper than Steig’s (Bromwich, D. H., et al. [2012]), Tropospheric clouds in Antarctica, Rev. Geophys., 50, RG1004,
doi:10.1029/2011RG000363.) that references Comiso 2000 (discussed in my second link) that states:
Bromwich references over 200 papers but does not mention Steig [2009], even though Steig [2009] pretended to “correct” Comiso [2000]’s slight cooling trend in Antarctica to a slight warming warming trend, as explained in my referenced comments.
However, perhaps a better point to be made is a qoute from Comiso [2000] that I made in my third linked comment:
It would seem that determination of Arctic temperatures from satellite infrared data would have similar problems to those shown for Antarctica. From Minnis, P., et al. (2003) Distribution and validation of cloud cover derived from AVHRR data over the Arctic Ocean during the SHEBA year. In Proceedings of the 13th Atmospheric Radiation Measurement Science Team Meeting, Ed. by D. Carrothers, Richland, WA: Department of Energy.:
Cloudiness is significant in the Arctic (also from Minnis [2003]:
When individual temperature values have such large uncertainty, it is difficult to believe that claiming statistical miracles via the Central Limit Theorem or anything else can justify quoting trends in thousands of degrees C.
“You can’t interpolate rising temps from something that isn’t rising.” (David Hoffer at 3:27pm today)
Apparently, it’s worse than that (See: Rob Dawg at Rob Dawg says: November 14, 2013 at 10:11 am
“reconstructing the unobserved regions” … .”)
You can’t interpolate (or whatever their “method” actually is — it makes zero difference) from NOTHING.
Bob Tisdale should be the one to post about this aspect, but, since he’s apparently out on the lecture circuit 😉 — FWIW:
This stupid paper (given that it reveals ANY truth) does at least indicate that the IPCC models which projected Arctic cooling are even WORSE than we already knew that they were ……….which isn’t saying much …………………. which makes this paper just a piece of junk.
As someone above aptly said: THEY ARE JUST MAKING IT UP AS THEY GO. Pitiful.
*************************
(some emphasis mine)
**To answer the argument that Tisdale doesn’t use ALL the IPCC models in his analysis:
(Source: Climate Models Fail, Bob Tisdale, Chapter 5 at pp. 180-84 (esp. Figures 5-22 and 5-26); See also Ibid, Chapter 2.8 Polar Amplification)
Oh, bother!
Re: the faux-poetry line breaks above….. (head shake) — I apologize. It’s happened to me before when copying from a pdf file into this comment box (on WUWT). I don’t know how to prevent it (because JUST LIKE GLOBAL CLIMATE I don’t know what causes it to happen the way it does, lol).
Above “SPECIAL NOTE” quote from Climate Models Fail is at p. 157.
GREAT POST at 6:58pm, Phil (the good one, NOT “The Dot”).
#(:)) Very helpful information. Thanks.
If we look at when the Arctic ocean is warming, the step up points are all during increasingly negative North Atlantic Oscillation episodes, which means that the Arctic ocean warming is a response to a cooling signal, typically during episodes of lower solar plasma speeds. Naturally with a warming signal we would expect more positive NAO conditions and a cooler Arctic.
UAH lower troposphere north pole ocean: http://snag.gy/6Aths.jpg
NAO: http://www.cpc.ncep.noaa.gov/products/precip/CWlink/pna/nao.timeseries.gif
I almost forgot! THANK YOU, ANTHONY, for all the great education above. Your time and effort putting that tutorial together is much appreciated.
There is some surface temperature data from northern latitudes, from DMI. IIRC, this is the Danish Meterorological Institute. This indicates surface temperatures north of 80 degrees north duriing their warmest couple months of the year being impressively regulated to close to the melting point of ice. Infilling or use of satallelite data available for 80-85 degrees north would indicate more warming trend than actually exists at the surface in the 80-degrees-plus north area.
Another (or related) infilling issue, which I have seen in GISS, is temperature measurement loactions in the Arctic having more snow / ice cover variability (and thus greater local surface albedo positive feedback) than areas that these locations represent, or areas that these locations are used to infill.
My favorite surface index is HadCRUT3, due to better correlation with both UAH and RSS than the other surface indices, including HadCRUT4.
Meanwhile, if one smooths UAH, RSS, or HadCRUT3 by a few years and plots a graph, it gets easy to see that the hiatus of global warming started in late 2011 – 12 years ago. 17 years requires cherrypicking to include a century-class El Nino in the beginning part of the time period under consideration. However, I give fair chance that global temperature will continue to largely flatline for another 20 years, and increase in the ~2035-2070 period at a rate little worse than that of from the early 1970s to ~2004-2005, and increase at a much slower rate after that. I base this on the periodic component that shows up in HadCRUT3.
[“Meanwhile, if one smooths UAH, RSS, or HadCRUT3 by a few years and plots a graph, it gets easy to see that the hiatus of global warming started in late 2011 – 12 years ago. ” Rather: “2001, 12 years ago?” Mod]
No, please, Steven. We are not worthy.
The abstract of the paper states that “The methods are validated on the basis of their skill at reconstructing omitted sets of observations.”
Surely this is the most important point? Remember everyone, a hypothesis is true or false based upon evidence alone, not whether it conforms to our pre-conceived beliefs one way or another. Has anyone with access to the entire paper looked at the validation methods used? How robust are they?
Steven Mosher says:
“That pattern says warming trend increases with latitude.”
Two questions.
Why?
and
If true, why does he suppose that the trend continues beyond the latitudes that are measured? The infamous Gaussian or Normal curve is only one example of an increasing trend that levels off as it nears a peak.
davidmhoffer says:
November 14, 2013 at 1:35 pm
Ian W;
I hate to burst your bubble, but ghg theory has little to do with heat capacity or heat at all. We get very sloppy with terminology in this debate. The relationship is to energy flux and temperature. That’s why I said “energy balance” above rather than heat, but I am one of the ones guilty of sometimes using “heat” when that is the wrong term. Per your comment, water vapour does absorb but it also re-radiates, and this changes the mean radiating level and the temperature profile from surface to TOA as a consequence. Here is a pretty good explanatio:
http://wattsupwiththat.com/2011/03/10/visualizing-the-greenhouse-effect-emission-spectra/
Water vapor possibly does radiate according to its emissivity and temperature. However, water vapor also raises the enthalpy (specific heat) of the air meaning that more heat is required to raise the temperature of a volume of humid air than dry air. Which is what is being discussed, ‘trapping’ outgoing longwave radiation which water does, unlike CO2.
http://www.engineeringtoolbox.com/enthalpy-moist-air-d_683.html
It would really be useful for people to use the correct metrics. Temperature is the wrong metric for atmospheric heat content it should be kilojoules per kilogram then comparisons would be correct. Averaging temperatures of different atmospheric volumes with different enthalpies is nonsense.
Agreed. I have not yet, I hope to find some time to this weekend. For those interested, their methods are apparently discussed here:
http://www-users.york.ac.uk/~kdc3/papers/coverage2013/methods.html
Seems like an application of http://en.m.wikipedia.org/wiki/Simpson's_paradox
And/ or picking your statistics just right to counterdict known data that shows no trend. It’s a well known error in statistics and I would be very surprised that interpolating based on no trend produces a trend is not subject to some simple mistakr
Judiths rebuttal begins:
“First, Kriging. Kriging across land/ocean/sea ice boundaries makes no physical sense. ”
While this is true, that is not how the technique was applied.
They used kriging to estimate the surface temperature from the satelliite data which measures the troposphere temperature, not between surface temperatures.
Do sceptics blindly accept what they are told, or do they question it on principle?
I’m still waiting for Mosher to explain to me how stupid I am.
I’ve been waiting for years for ANYONE from the “let’s trend the temperature data” crowd to even TRY and mount a counter argument to my point that averaging temperature as a proxy for energy balance is a fool’s errand. Every physicist I’ve ever discussed this with agrees, with the possible exception of Joel Shore who admits the problem but maintains that the metric is still useful.
Use these methods on any equal amount of time in the last 12,000 years. Do the results provide an accurate forecast?
Now the door is open to adjust the 1980s downward because the cold polar amplification made that period to hot! Wait for it in AR6.
BogusSophist says:
November 15, 2013 at 7:20 am
“Do sceptics blindly accept what they are told, or do they question it on principle?”
My Null hypothesis is that warmists are corrupt.
Cui bono.
The combined available Arctic stations are no different in recent years than during the 1930’s and 1940’s.
http://imagizer.imageshack.us/v2/564x475q90/141/arctictempstrend.png
GISS recent data already takes the infilling into account and yet the difference between this and RSS is huge to warm only above 82.5N and keep the data sets the same average temperature.
http://imagizer.imageshack.us/v2/564x284q90/829/gissvrssextarc.png
Can any one see the Arctic above 82.5N being up to 100c higher than what the RSS should show?
This suggests the infilling of data is an artefact of the GISS data set and is there because it not scientifically possible to support the difference between the two demonstrated here. Hence, the huge temperature difference demonstrates the infilling data is the incorrect procedure. It conclusively doesn’t support the north pole is the only difference between the two data sets GISS and RSS.
I must admit to some bias in the area of interpolation. In my experience as a garden variety physicist, interpolation has been a very useful tool for retrieving or visualizing intermediate values in a computationally efficient way when the underlying dynamics being considered are well understood, with benchmarking experiments sufficiently dense throughout the range being interpolated. Using interpolation as a basis to modify one’s understanding of underlying dynamics just seems backwards to me.
The techniques used by this paper seem to me more like extrapolation than interpolation. Extrapolation has been useful to check the implications of a proposed understanding of underlying dynamics and to suggest potential measurements to confirm the extrapolation of the dynamics. For example, the original postulates of the existence of black holes were extrapolations of a dynamical understanding (i.e. a solution of Einstein’s equations) of general relativity in the case of a spherically symmetric empty space with a single source of gravity (Schwarzshild) or a similar solution with rotational symmetry (Kerr). In these cases the solutions could be extrapolated to devise observations to determine if the solutions seemed to be realized in nature. Another example would be Dirac’s postulate of the existence of a positron by extrapolating solutions he obtained for his proposed Dirac equation.
Examples of unproductive (perhaps better described as counterproductive) attempts to extrapolate might be the epicentric view of planetary motions about a central earth as described by extrapolations of circles. This particular case produced one of the early “deniers” to suffer for believing his eyes, namely Galileo, who has only recently been de-excommunicated. Other examples are Lamarckian evolution and Balmer’s (1885) discovery of extrapolation of some spectral lines by numerological constructions of series. Balmer’s case is particularly interesting (perhaps relevant) in that when he learned that some experiments seemed to violate his formulas, he doubted the observations and not his formula.
So, in short, the application of “interpolation” in this particular paper seems to me more along the lines of past errors in extrapolation. It seems it would have been much easier and less trouble to simply say we need more and better measurements where we don’t have them now.
Balmer’s case raises another interesting issue, namely the notion of “credentialed climate scientist.” Balmer taught mathematics at a high school for girls and would not be considered, in today’s parlance, a “credentialed physical scientist.” Besides WUWT, I must admit I fairly regularly visit SKS, the Guardian environmental pages, Mother Jones, etc. to obtain information. The proponents of CAGW seem particularly intense about who is and who is not a “credentialed climate scientist.” For example Dr. Soon is described as “someone without credentials in climate science,” Dr. Matt Ridley excoriated in terms of “since when is zoologist Mat Ridley an expert on climate science?” Dr. Tim Ball is dismissed as a “mere geographer, not a climatologist.” Dr. Tol is dismissed as a “mere economist,” apparently not understanding the difference between econometrics and economics, etc. (Please forgive me for quoting the examples, but it is useful for the following contrast.) The classification of “credentialed climate scientist” seems to be reserved for scientists who advocate CAGW. (BTW, the list of contributors to the IPCC contain many economists, geographers, etc.) So, I looked for the “climate science credentials” for Drs. Cowtan and Gray. Doing a quick GoogleScholar one finds Prof. Cowtan is an accomplished and prolific worker in chemistry, particularly molecular imaging, crystallography, and related data analysis, image reconstruction and feature recognition, with many publications in those fields. This appears to be his first in “climate science,” but I may be wrong about that. It was harder to track down Mr. Way. It turns out he is a PhD candidate in geography at U. Ottowa, where geography is housed in the Faculty of Arts not Science. This appears to be his first publication, but again, I may be wrong. By no means do I mean to denigrate either chemists (I have worked with many and enjoy doing so immensely) nor geographers, or even PhD candidates; candidacy can be a wonderful experience.
Not being a climate scientist myself, I must admit to wondering from time to time what “credentialed climate scientist” means. It seems to me that Drs. Soon, Ridley, Ball, Tol, etc. possess as much scientific credential to warrant serious consideration of analysis they present as Prof. Cowtan and Mr. Way. What I do mean to point out is the remarkable asymmetry in notions of “credentialed climate scientist.”
In a perfect world, interested and talented parties could gather somewhere (the moon strikes me as a good place), have guaranteed research funding support, for a time forswear economic gain or attribution and accolades, and work on nothing but understanding the physical future of the earth. A specific goal would probably help. The Manhattan project comes to mind. Unfortunately, we seem stuck in a morass of agendas masquerading as science, and the science appears to be suffering for it.
DirkH says:
November 15, 2013 at 9:15 am My Null hypothesis is that warmists are corrupt.
Cui bono.
Thank you Dirk. While your faith is touching, it does not address what I said in any way at all.
My corruption is so great that I cannot afford to access the relevant paper, so my remark was based on this analysis from realclimate http://www.realclimate.org/index.php/archives/2013/11/global-warming-since-1997-underestimated-by-half/ “Cowtan and Way circumvent both problems by using an established geostatistical interpolation method called kriging – but they do not apply it to the temperature data itself (which would be similar to what GISS does), but to the difference between satellite and ground data. So they produce a hybrid temperature field. ”
I can’t really see why they would misrepresent the methods used, even if they are corrupt, as they are praising how clever it was.
If you read a rebuttal which contains such a glaring error in the very first line, how much do you trust it? Presumably Curry read the paper in question, so either she misunderstood it, or she is misrepresenting it on purpose.
BogusSophist says:
November 15, 2013 at 12:27 pm
“I can’t really see why they would misrepresent the methods used, even if they are corrupt, as they are praising how clever it was.”
I don’t rule out stupidity.
“If you read a rebuttal which contains such a glaring error in the very first line, how much do you trust it? ”
What is J Curry’s glaring error?
The Sophist directed me to RC; an experience I deeply abhor; but I found this over there:
Michael Sweet says:
13 Nov 2013 at 10:40 PM
“Robert Way has published 4 papers. All are on the subject of climate change. The suggestion that only one is relevant is false. He is a graduate student, how many papers do you expect? One of his papers is the widely discussed paper with the group from Skeptical Science (where he posts regularly) on scientific consensus. Two big hits and he is only a graduate student! What will he publish next year?”
And googling it one finds:
http://iopscience.iop.org/1748-9326/8/2/024024/article
So my Null hypothesis (see above) looks very good indeed; and Way is one aspiring new agitprop artist obviously; a little usefool number twiddler for The Cause – whatever works.
Now I’m waiting for the Mc’s to make mincemeat out of it.
BogusSophist says:
November 15, 2013 at 12:27 pm
“What is J Curry’s glaring error?”
I already told you in the first post.
She criticises them for “Kriging across land/ocean/sea ice boundaries”
They did not use the technique for that.
They used it to “kriging – but they do not apply it to the temperature data itself (which would be similar to what GISS does), but to the difference between satellite and ground data.”
They are kriging vertically to generate ground temperatures from satellite readings of the troposphere, not horizontally across land/ocean/ice boundaries.
Can you tell the difference?
BogusSophist says:
“Can you tell the difference?”
I don’t care, Sophist. Now that I know who the guy is I need to stock up on popcorn. Because science this is not.
DirkH says:
November 15, 2013 at 1:44 pm
“Because science this is not.”
LOL you would not recognise science if it punched you on the nose.
Would anybody rational care to address the point I was making?
Are there any sceptics in the house?
Dear Dirk,
Popcorn is a GREAT idea, here, lol. Hope you have a good movie to watch, too, because this bogus paper is too dull to be entertaining for long.
That B.S. is a pretend sophistical reasoner means he or she is likely someone we know… heh. Leaving that aside to address (for the sake of preventing misunderstanding by the silent readers) the sophistry,
B.S. is either intentionally ignoring (a.k.a. being deceitful) the context for Judith Curry’s kriging remarks or is ignorant of it.
She is (see her post at: http://judithcurry.com/2013/11/13/uncertainty-in-sst-measurements-and-data-sets/) responding to this quote from the Guardian article (http://www.theguardian.com/environment/climate-consensus-97-per-cent/2013/nov/13/global-warming-underestimated-by-half?CMP=twt_gu) which she had just cited:
(partial quote of Guardian article from Curry’s site; emphasis mine)
Thus, B. S. is mistaken (or lying) in his or her statement: “They used kriging to estimate the surface temperature from the satellite data which measures the troposphere temperature, not between surface temperatures.” (B.S. at 7:20am today)
Hope all is well over there, Dirk. Remember, as sickeningly green as it can get around you there, you are not alone.
Your American ally for truth,
Janice
*************************************
Thanks, Bogus Sophist (whoever you are, lol), for being our devil’s advocate to stimulate discussion. Keep up the good work. You are doing great!
#(:))
A clue! (well, heh, now we wouldn’t really know, though, would we? ….) B.S. spelled “skeptic” the British way… .
BogusSophist says:
November 15, 2013 at 2:26 pm
“LOL you would not recognise science if it punched you on the nose.”
Hm. Then you’re probably Lewandowsky. Now, listen Lew: I have no problem at all accepting that you can travel to the moon if you just burn enough Kerosene. You’re Australian, so you never managed, and the Amis only managed after the Germans showed them how to burn Kerosene properly; and NASA is currently having a private company 3D scan the last surviving F1 booster because Big Government is simply too stupid to do it themselves these days when they have no surviving Germans.
Well, it was fun talking to you, Lew, I’m deeply amused how you people tie yourself to an already discredited 2nd rate comedian like Way.
Janice Moore says:
November 15, 2013 at 2:28 pm
“Thus, B. S. is mistaken (or lying) in his or her statement:”
Thanks for dissecting it. I’m simply too lazy these days to still look for sense in anything the warmist machine does.
“Hope all is well over there, Dirk. Remember, as sickeningly green as it can get around you there, you are not alone.”
I’m outnumbered but not outsmarted…
@ Dirk…. and never outclassed. #(:))
Hi Janice.
Don’t put too much store in the name, I like silly names and anonymity. John Smith would just be boring. No, you don’t know me, but you are somewhat smarter than Dirk, at least you got the right side of the planet, the right country. I’m anything but a sophist, I prefer facts and reasoning over rhetoric. Probably a sceptic really in the proper philosophical sense, though it is impossible to be certain, firm beliefs are for the gullible.
I gave the reference for where I got the vertical kriging, so no, that was not any invention of mine. Looking on Curry’s blog, there is an interesting exchange between her, Cowlan and Way. It is somewhat more complex than I thought based on the limited information I had. They do use kriging in some parts in the horizontal, but one point of their paper is a comparison of different methods of filling in the gaps to identify the most effective in different siruations. If you believe Curry to be infallible, then clearly she wins by default. If you read it with an open mind, you might learn something.
Did you enjoy the video? Buzz is a bit old school, the right stuff. He knows how to reason with [Snip. Read the site Policy. ~mod.]. I wouldn’t have the muscle or the nerve myself.
Janice Moore says:
November 15, 2013 at 2:28 pm
Thus, B. S. is mistaken (or lying) in his or her statement: “They used kriging to estimate the surface temperature from the satellite data which measures the troposphere temperature, not between surface temperatures.” (B.S. at 7:20am today)
Neither mistaken (although this happens on occassion) , nor lying (which never happens).
It’s his, to save you writing his or her, which could get tedious.
Here is the relevant quote:-
from realclimate http://www.realclimate.org/index.php/archives/2013/11/global-warming-since-1997-underestimated-by-half/ “Cowtan and Way circumvent both problems by using an established geostatistical interpolation method called kriging – but they do not apply it to the temperature data itself (which would be similar to what GISS does), but to the difference between satellite and ground data. So they produce a hybrid temperature field. ”
My bold (If I have guessed the right tags).
This is the “hybrid method” refferred to in your quote of Judith’s quote.
BogusSophist says:
November 15, 2013 at 3:45 pm
“Hi Janice.
Don’t put too much store in the name, I like silly names and anonymity. John Smith would just be boring. No, you don’t know me, but you are somewhat smarter than Dirk, at least you got the right side of the planet, the right country.”
And in what country do you think Lewandowsky is currently, Mr. SuperSmart? You people are so amusing.
DirkH says:
November 15, 2013 at 5:45 pm
And in what country do you think Lewandowsky is currently, Mr. SuperSmart? You people are so amusing.
No idea where he is, why should I care as to his whereabouts?
You made a wild guess, then mistakenly assumed you were correct.
The odds were about seven billion to one!
Are you still pissed about recursive fury?
I found it quite a good read myself. it’s not often that a science paper makes me laugh out loud.
David Hoffer,
Even the UAH temperature data from 60 degrees north to 80.5 degrees north shows warming.
http://theinconvenientskeptic.com/wp-content/uploads/2011/03/NP-Feb-2011-uah.png
This is the data that was used not the south pacific temperature trends that you use to justify your supposed “pause” in warming
http://theinconvenientskeptic.com/wp-content/uploads/2011/01/Tropics-UAH-change.png
jmitchell;
This is the data that was used not the south pacific temperature trends that you use to justify your supposed “pause” in warming
>>>>>>>>>>>>>
I never said a single thing about the south pacific, or what I based the pause on. Don’t put words in my mouth.
BogusSophist says:
November 15, 2013 at 6:12 pm
“Are you still pissed about recursive fury?”
Why should I be pissed about a warmist crackpot ruining his reputation? No, I’m constantly amazed by these people.
“I found it quite a good read myself. it’s not often that a science paper makes me laugh out loud.”
I think I looked at it once; but I’ve seen too much propaganda in my life to actually still find the energy to read dreck like that.
[snip – fake email address. A real email address is required to comment here by policy – mod]
BogusSophist is Underminingorthodoxy, one of Drillbit Dana`s sock puppets on the Guardian Environmental pages. Still, I have to say kudos for coming over here, (full of) BS, where you can`t hide behind the new level of SkS moderating on CiF.
https://id.theguardian.com/profile/underminingorthodoxy/public
Can people like DirkH get a timeout from commenting when people are actually discussing the topic at hand and he continously butts in and steers the conversation elsewhere? I can see several points in the policy thats being violated.
I am still eager to read and learn more about this paper.
Here are some actual long-term high latitude stations (direct from the sources of UK Met Reader Antarctica and Environment Canada rather than the adjusted GHCN or GISS data). Should be clear that starting in 1979 or 1997 provides a false signal and/or polar amplication hasn’t actually occurred over the long-term.
In order of Amundsen Scott 90S, Mawson 70S, Faraday 65S and Eureka Nunuvut Canada 80N – all world-class weather stations staffed by several researchers.
http://s13.postimg.org/6w98pvd8n/Amund_Scott_90_S.png
http://s8.postimg.org/7l41rf5b9/Mawson_70_S.png
http://s11.postimg.org/q80w8vwv7/Faraday_65_S.png
http://s7.postimg.org/6y6u8vpuz/Eureka_80_N.png
If someone knows where the raw data for Greenland from DMI is, I’d appreciate it.
A lot of comments here are about the arctic regions however looking at the map of HadCRUT coverage there are large areas in other places like Africa and South America. To work out how relevant all the to-ing and fro-ing about the influence of the arctic values is, can someone please post what percentage of the missing coverage is in difference areas? It’s difficult to tell the areas from images due to the projection used in various images.
Pat of Charleston says:
November 14, 2013 at 1:22 pm
—————–
Look at the INCREASED extent. Warmth is a funny thing. We are seeing climate change but it takes time. One day wit will all suddenly melt away. 🙂