This is another post that illustrates and discusses just how poorly climate models simulate one of the most important climate variables: global surface temperatures. I’ve included a copy of this post in pdf format, linked at the end, for readers who would like to treat this post as a supplement to my ebook Climate Models Fail.
My blog post No Matter How the CMIP5 (IPCC AR5) Models Are Presented They Still Look Bad was cross posted at WattsUpWithThat here. Scrolling down through that WUWT thread, you’ll find a comment by Bill Illis:
Bill Illis says:
October 5, 2013 at 6:10 am (Edit)
Comment from Jochem Marotzke of the Max Planck Institute in a presentation at the Royal Society about the IPCC report.
“As a result of the hiatus, explained Marotzke, the IPCC report’s chapter 11 revised the assessment of near-term warming downwards from the “raw” CMIP5 model range. It also included an additional 10% reduction because some models have a climate sensitivity that’s slightly too high.”
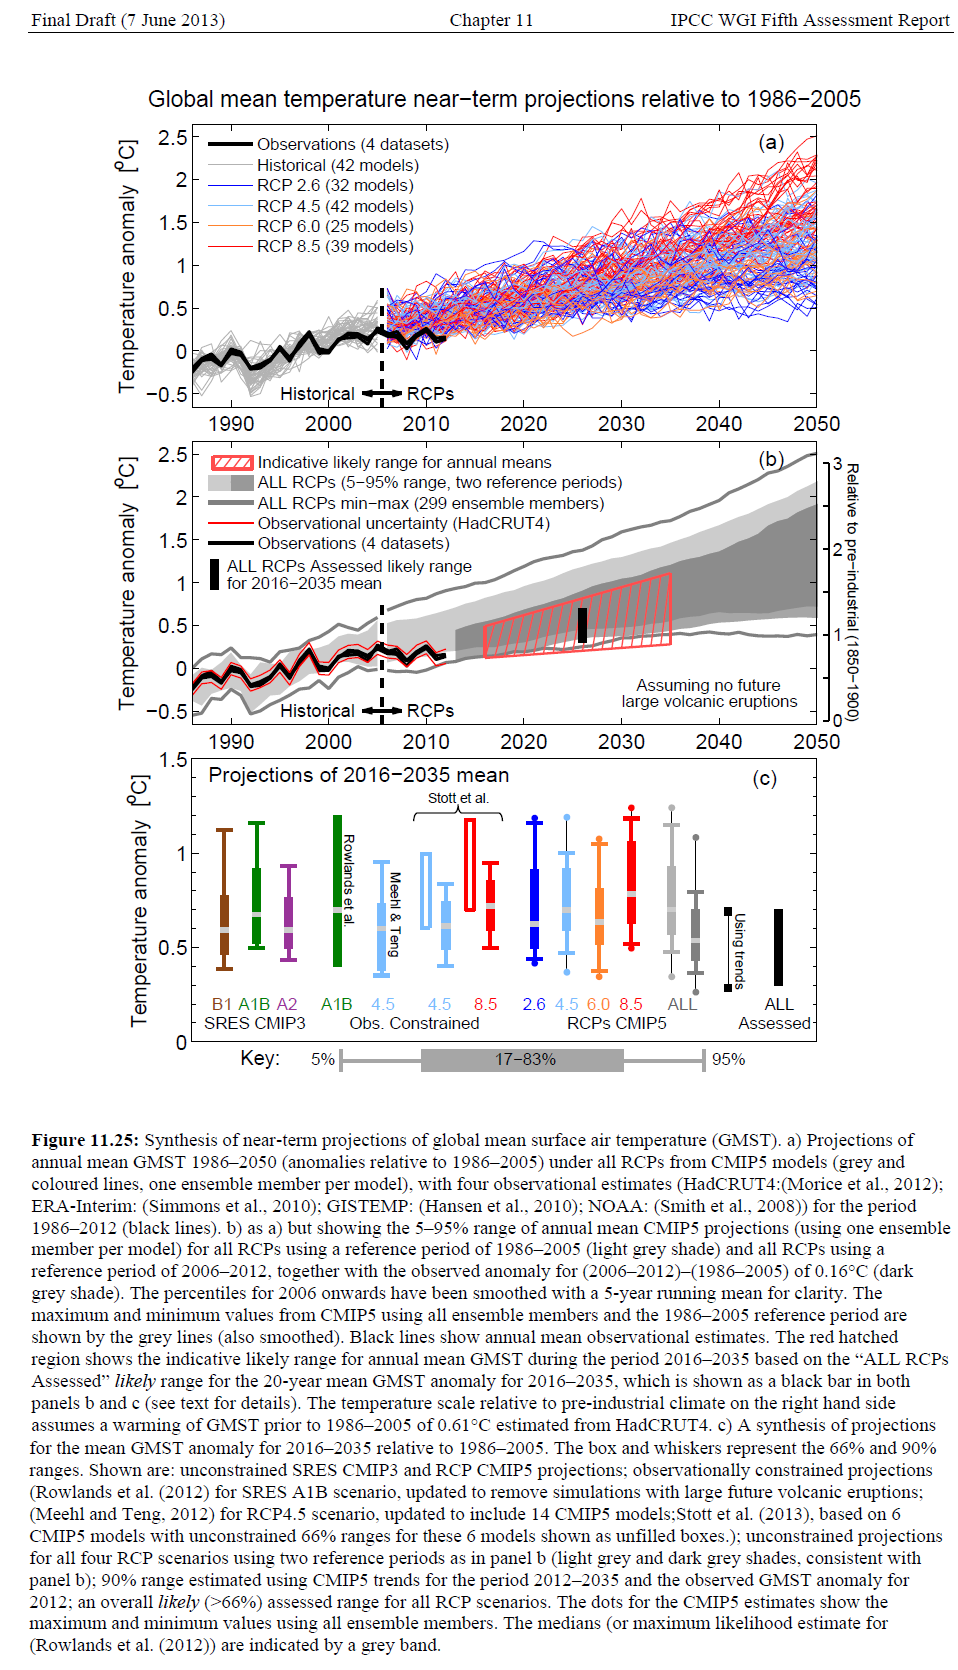
Sure enough, if we look at the IPCC’s Figure 11.9 (my Figure 1) and Figure 11.25 (my Figure 2) we can see how the IPCC has lowered the near-term predictions—without changing their long-term prognostications.

Figure 1 (Full-sized with caption is here.)
# # #

Figure 2 (Full-sized with caption is here.)
# # #
The IPCC discussed Figures 11.9 and 11.25 in Chapter 11 of the IPCC’s 5th Assessment Report (6MB .pdf). For the discussion of Figure 11.9, see page 24/123 (Adobe Acrobat page numbering), under the heading of “11.3.2 Near-Term Projected Changes in the Atmosphere and Land Surface”, and with a further subheading of “11.3.2.1.1 Global mean surface air temperature.”
Figure 11.9 can be found on page 102/123.
For Figure 11.25, see the discussions under the heading of “11.3.6.3 Synthesis of Near-Term Projections of Global Mean Surface Air Temperature” starting on page 53/123.
Figure 11.25 can be found on page 120/123.
# # #
The October 3, 2013 article Bill Illis linked at EnvironmentalResearchWeb Royal Society meeting discusses IPCC fifth assessment report was written Liz Kalaugher. Jochem Marotzke was described in the article as:
…Jochem Marotzke of the Max Planck Institute for Meteorology, who was part of the IPCC team assembling scientific evidence on trends in temperature over the last ten to fifteen years.
In the article, Jochem Marotzke tried to downplay the significance of the hiatus:
“Such hiatus periods are common in the record and yet this last one has sparked enormous debate,” Marotzke told delegates at the Royal Society. “Does the surface warming hiatus mean global warming has stopped? No. Warming of the climate system continues. Sea ice continues to melt, the ocean continues to take up heat, sea level continues to rise.”
But if “hiatus periods are common in the record” why must the IPCC revise “the assessment of near-term warming downwards from the ‘raw’ CMIP5 model range” and include “an additional 10% reduction because some models have a climate sensitivity that’s slightly too high”? And if they’re so common, why did the IPCC have to create a team to assemble “scientific evidence on trends in temperature over the last ten to fifteen years”?
The answer to both questions is, the CLIMATE MODELS CANNOT SIMULATE the multidecadal variations that exist in the surface temperature record. These multidecadal variations are seen as warming periods that last for approximately 3 decades followed by periods of about 3 decades without warming. We’ve recently discussed this in the posts IPCC Still Delusional about Carbon Dioxide and in Will their Failure to Properly Simulate Multidecadal Variations In Surface Temperatures Be the Downfall of the IPCC? (Also see the cross posts at WUWT here and here.) These multidecadal variations are well-known to the public, and that’s why I presented (in the “Downfall” post) the difference between the IPCC’s projection of Northern Hemisphere surface temperature anomalies and the public’s vision on how the warming will occur based on the past variations…assuming surface temperatures continue to warm in the future. (See Figure 3.)

Figure 3
And it’s well known by the public that the models used by the IPCC are tuned to the upswing that started in the mid-1970s (see Mauritsen, et al. (2012) Tuning the Climate of a Global Model [paywalled]. A preprint edition is here.), while failing to consider the impacts of naturally occurring multidecadal periods of no warming on their long-term (to 2100) prognostications.
Last, as far as I know, the IPCC did not lower their long-term prognostications based on their lower short-term predictions.
SUPPLEMENT 3 TO CLIMATE MODELS FAIL
For those who are collecting the blogs posts in pdf form as supplements to my book Climate Models Fail, the copy of this post is here.
Supplement 1 is here. It’s a reprint of the post Models Fail: Land versus Sea Surface Warming Rates.
Supplement 2 is here. It’s a reprint of the post IPCC Still Delusional about Carbon Dioxide.
Really appreciate your posts: Thanks again Bob.
And what happens to these trends if the sun goes quiet?
If the model output is the basis and result of your science, you must use the model output.
Oops. Thanks for the link, Bill Illis.
If we are entering a solar minimum none of the models will stand up. Time will tell. But sunspots (and other relevant solar parameters) may predict.
If the model output is the basis and result of your science, you must use the model output.
Use it for what? And if the science included in the models is wrong or incomplete?
AnonyMoose:
At October 29, 2013 at 4:31 am you say
Please explain how anything can be both “the basis and result of your science” without the result being an outcome of a circular argument and, therefore, false.
Richard
I’d assume AnonyMoose is simply descirbing the IPCC’s rationale, if you can call it that and just forgot to add a /sarc tag or something. At least this is how i read it.
Thanks Bob for another informative post. I was wondering when you would spot the new ‘supercreative’ near-term projections, chopsticks with very interesting uncertainty ranges. Whatever happens in the next decade, unless temperatures are going down drastically on global scale, the IPCC will claim they had it covered. Most people discussing climate change are well aware GMST is a meaningless metric anyway and it’s encouraging to see how the focus is shifting away from it recently.
Anyone can use my comments, links, graphs, whatever, without attribution. I’m in this debate for the truth only and that’s it.
The point is you don’t get to just change your numbers after the fact. What kind of science is that? And then you don’t get to pretend your predictions were accurate if you just changed them after the fact. What kind of accountability is that?
This theory is about what will happen in the future. That is what it is about. It is about predictions of the future. We have to be able to track what this theory is all about, predictions of the future.
In the year 2090, are they going to say, we predicted this flat century of temperature and, therefore, global warming theory is correct. Going by what they have done in the last two decades, you could predict the future just by assuming that is what they will do.
“Please explain how anything can be both “the basis and result of your science” without the result being an outcome of a circular argument and, therefore, false.
Richard”
That’s precisely the point Anonymoose is making, is it not? I think you are reading his/her comment too literally.
“Does the surface warming hiatus mean global warming has stopped? No. Warming of the climate system continues. Sea ice continues to melt, the ocean continues to take up heat, sea level continues to rise.”
Well, except that the claim of CAGW by CO2 alarmists is that as atmospheric CO2 levels rise, so too will the surface warming.
Also, sea ice would melt faster, the ocean’s would take in more heat, and sea levels would rise faster. Catastrophic climate events would then ensue.
However, they did not say, “sea ice would continue to melt but slower, the ocean’s would take in more heat but warm less, and sea levels would rise at a slower rate along with a surface warming “hiatus””, did they?
It pains me as a Canadian to see Obama destroy the USA, over unbelievable fraud and lies. [all areas]
Why no impeachment? I thought CO2 lagged global temps, and after 16+ years of no warming despite CO2 levels being up, debunked CO2 as a cause.
Why continue to believe the myth?
I’m not so sure that comparing the US today to the fall of the Roman Empire is all that far off.
The whole AGW meme is a COS. IMO.
This ‘science’ is absolutely brilliant value, and it costs us less than $1.0 billion per day! See below
I am reminded of that scene in the movie Lord of War, where Nicholas Cage is yelling: “Guns, guns, guns!”, as he successfully gets a bunch of impoverished Sierra Leonans to take all the obsolete weapons off his plane before the UN police arrive.
In this case however, it’s: “Models, models, models!” And we are being asked to take obsolete models as being gospel truth, just because they have been yet again manipulated. In real science, this type of manipulation is not allowed; in ‘climate science’ it is standard practice.
http://joannenova.com.au/2013/10/nearly-1-billion-a-day-to-change-the-climate-the-invisible-vested-elephant-in-the-room/
If the model output is the basis and result of your science, you must use the model output.
But then, it’s about the same level of science as proving that God exists assuming that God exists..
Sorry to be repetitive, and be always plowing the sands, but all that this shows is that the IPCC NEVER knew what it was doing, and NEVER did any science. And we have known this for years. But still no-one who matters is taking any notice whatsoever. It may be decades before the empirical data proves that CAGW is a hoax, but what damage is going to be done in the meanwhile?
. We are currently about where the planet was back about 1807 and again in 1885, just 2 years past the solar maximums of 1805 and 1883 of the first low solar cycles # 5 and again # 12. These were the first solar cycle in series of three low solar cycles.. The ocean SST and AMO were in the cooling mode heading for troughs by1820 and 1910. The Arctic was cooling as indicated by Greenland oxygen isotope records. What followed according to CET records was a decade or two of cooler winter climate, starting at the end of the first and during the second and third solar cycles.
One of Bob’s previous Graphs as shown below is a detrended historical plot of the sea surface temperature anomalies (HADSST3) for the Pacific and Atlantic Ocean basins from pole to pole The peaks and valleys of this plot match the peaks and valleys of global cooling and warming temperature patterns over the last 130 years . The surface temperatures of these oceans seem to have peaked and are again heading for a cold trough by about 2040 like they did 1910 and 1975. A global warming peak like 2005 is not predicted for 60- 70 years or until 2065/2075. So IPCC predictions of continued temperature rise of 1.8 to 4 C by 2100 are not only wrong but very unlikely regardless what their models say. If the oceans are cooling so will the global atmosphere. I agree with Bob that IPCC continues to be unable to simulate SST’s
Courtesy of Bob Tisdale’s and WUWT web pages
http://bobtisdale.files.wordpress.com/2013/07/figure-72.png
http://wattsupwiththat.com/2013/07/30/part-2-comments-on-the-ukmo-report-the-recent-pause-in-global-warming/
some good news, folks, Lord Oxburgh fails:
29 Oct: Guardian: Rowena Mason: Energy firms raised prices despite drop in wholesale costs
Energy bill increases are continuing to cause a headache for the coalition, as a new YouGov poll shows 68% of the public believes Labour’s energy ***Another amendment in favour of decarbonising all of Britain’s electricity by 2030, tabled by Lord Oxburgh, a former chairman of Shell, narrowly failed to pass.
http://www.theguardian.com/business/2013/oct/29/energy-firms-raised-prices-as-wholesale-costs-fall
Follow the money. The money is driving the AGW models and predictions and the money, in terms of negative economic impacts upon society, is what will stop the poor science. More emphasis upon those negative economic impacts so that people understand just what this hoax is costing THEM in their own personal pocketbook in terms of taxes, energy costs, transportation costs, heating costs, cooling costs, ad infinitum, ad nauseum is what it will take to stop this runaway train of stupidity. For every graph put out to show the truth of the science, two will be put out by the AGW crowd to protect their money and most people do not understand the science. They do understand their pocketbook. How much more is our cost of living, in general, due to the green movement’s interference in the economy?
Cost of oil/gas?
Cost of electricity?
Cost of food?
Etc.
Etc.
+
+
+
.
.
.
.
pat’s news article is a hint of just how insidious the social madness of AGW really is.
Oxburgh, made no small part of his fortune running a large oil company. He is now ransacking the tax payers and rate payers by using trumped up claims about CO2. And yet he was appointed as the head of a committee whose job was allegedly to look for problems in the scientists and their behavior regarding the very thing he is now profiting from.
The more I look at the madness gripping the EU and the US, the more I think that AGW is simply a very dangerous symptom of a deeper dysfunction. Corruption is the true disease that underlies the bad governance, the squandering of trillions, the irresponsible spending by so many governments, etc. The $ billion per day now being wasted on the AGW industry is probably just a small part of the total wastage being achieved by our so-called “progressive” leaders.
Great Post Your most peoples projection shows that everyone – outside the IPCC faithful has finally decided to include the 60 year cycle. I’m grinding away to try to getthe realists to accept the 1000 year cycle as well – its really not rocket science but the simplest Occams razor assumption.
To see the estimated timing and amount of the coming cooling including the obvious 1000 year cycle go to
http://climatesense-norpag.blogspot.com
hunter says:
October 29, 2013 at 6:33 am
Oxburgh, made no small part of his fortune running a large oil company.
=====
no surprise he wants to decarbonize the economy. coal is the only serious competition to oil, and if you eliminate carbon you eliminate coal. without coal, oil then has a monopoly on the market.
but, but, but you say. oil has carbon. ah, but not as much as coal. so if you penalize carbon you raise the price of coal much more than oil, which allows oil profits to increase to match the now higher price of coal.
the big loser in all this are the consumers, that in the end will pay the tax in the form of higher prices. the big winners will be the oil companies, who will get to increase their profits to match the larger taxes on coal.
Excellent article.
Correctly predicting the future is certainly a difficult task.
This is not my original thought but is it not possible that climate sensitivity to CO2 is variable? (This is where the second Earth for experimentation would be handy…)
However, my own original thought is that if CO2 sensitivity is actually variable, then figuring out how the climate system actually works (and thus make useful future predictions) would probably beyond our capability for a very long time. I mean it’s hard enough as it is right now.
Pat at 6.11am
At the end of your link to the Guardian article, there was a reference to an important defeat for the greens in the House of Lords yesterday. They wanted to amend the new UK energy bill to force a decarbonisation target for 2030. All of the usual suspects such as Greenpeace, WWF and Co., lobbied very hard for the amendment (letters to The Times etc) and will be gutted that it was not passed.
During the debate, (Viscount) Matt Ridley made a powerful speech in which he likened the UK’s unilateral approach to carbon reduction to building a flood dam at the bottom of ones garden when your neighbour isn’t. More importantly, he cited all of the elements of the IPCC report that indicate less certainty over their warming projections.
Although the vote went very much along party lines, his speech may well have swayed some doubters to vote against the amendment. Apart from the vote, It was good to hear the facts spelled out so clearly in such an important venue, and I am sure that it has given a number of our lawmakers food for thought.
For those in the UK, the debate is on BBC Iplayer for the next five days and it is worth hearing Matt Ridley. He speaks about two thirds of the way through (skip the rest).
Have you all seen this rubbish?
The comments at the bottom amuse me. ‘She raises a good point’. Really? Where? I must’ve missed it.
http://www.newstatesman.com/2013/10/science-says-revolt
So temps will just go up up up for ever…yeah right. Dolts.
I think it should be pointed out more often that the rate a warming over both the past 50 years and 100 years are rates that would be beneficial to society and ecology. And If we were to expect warming to persist at the these benign rates, we would need to assume that ALL warming over those time periods was due to anthropogenic global warming.
Thanks Bob. These guys just don’t get it. They are painting themselves into a corner by keeping the same targets, and delaying the start to climb to that peak, making the climb steeper, and more unlikely.
By 2021, a quarter century past Gaia’s last discernible warming uptick at end-1996, odds are that Earth will be gripped by a 70+ year “dead sun” Grand Solar Minimum similar to that of 1645 – 1715, the very depths of a 500-year Little Ice Age (LIA). Given that, absent the 1,500-year Younger Dryas “cold shock” c. BC 8800 – 7300, our current Holocene Interglacial Epoch was due to end c. AD 450 coincident with the fading Roman Warm, odds are that this 21st Century cooling will in fact precede the onset of a cyclical Pleistocene Ice Age lasting an average 102,000 years.
Million$ forked out.
Return on investment: monotonically increasing curve.
(Why do we keep paying for that thing over & over & over again?)
They used to do straight hair. Now they’re exploring cosmetics. With million$ more we get waves & curls on the same monotonically increasing hair do …but they still have no real understanding of multidecadal variability …nor even a desire for it.
They’re darkly ignorant &/or deceptive about multidecadal variability, so they have no credibility.
A more interesting revelation (to me at least) from Ch11 is that they seem to replace the concept of SF (Surface Forcing) with the concept of ERF (Effective Radiative Forcing). They then go on to make this most startling statement:
As described in Section 8.1.1.3 CO2 can also affect climate through physical effects on lapse rates and clouds, leading to an ERF that will be different from the RF. Analysis of CMIP5 models (Vial et al., 2013) found a large negative contribution to the ERF (20%) from the increase in land surface temperatures which was compensated for by positive contributions from the combined effects on water vapour, lapse rate, albedo and clouds. It is therefore not possible to conclude with the current information whether the ERF for CO2 is higher or lower than the RF. Therefore we assess the ratio ERF/RF to be 1.0 and assess our uncertainty in the CO2 ERF to be (–20% to 20%)
I have to ask the question. Does this not imply that feedbacks from CO2 are close to zero, contrary to the meme carried on in the rest of the AR5 report?
Bob Tisdale,
Thank you for your persistent tracking and analysis of modeling failure ‘rationalization’ tactics. Tactics that I think are coordinated by the intellectuals in the IPCC’s Bureau.
What is their next strategic step? Where is their modeling failure ‘rationalization’ hockey puck going to go next?
I think their next play, which I suggest will occur in January 2014 concurrent with the official publication of AR5, will be an announcement of plans for an independent audit of their modeling assessment processes and also of their non-rigorous decision to place virtually all emphasis on CO2 driven modeling over the past several decades of assessments. I think the next audit will be different than the 2010 IAC audit of the IPCC in that it will not be a general one, but a modeling centric one.
So, we will see. And if it does occur, there will need to be very very active efforts to ensure any such audit will be clearly independent in a strictly skeptical sense.
John
@Alberta Slim
“Why not impeach Obama”
Because the man apparently does not know anything. He did not know about Benghazi, he did not know about Fast and Furious, he did not know about Solyndra, He did not know that people would lose their health care coverage, he did not know that the IPCC was a simple paid for science group with an agenda.
Is gross ignorance an impeachable offense?
Look I have my own pet beliefs, I admit they are beliefs and they may well be shown to be little more than fanciful imaginations of my own delusion. I would hope history would hold me accountable for my failings. A hundred years from now people will look back at this time period and ask, ‘Why did this happen?’, ‘Who was responsible for it?’ and the answer will be simply this. People believe the appeal to authority, the authority today being the media and ‘scientists’.
Never mind that you have other scientists that disagree, they do not matter if the media is not behind them. Then we will see ‘science blogs’ like this one, which allowed an outlet for truth to be known or at least discussion of skepticism to exist, and I believe it will be remembered fondly and as the pivotal turning point to forcing a more honest discussion of the ‘facts’.
In the end I want the Obama administration in there as things come crashing down. I do not want the pain of the crash, but who better then him to still be at the helm? I just hope the crash comes in the next 3 years rather than when I expect it to which is late 2016 to early 2017…
They completely obsfuscate past (AR4) model to data comparison by layering current (2012) model runs on top of it, basically saying this is the new starting point but everything else remains the same. The possibility that the models are inherently incorrect, as evidence by reality exiting their model runs, is never even considered, apparently.
How could anyone take something as complex as the climate and attempt to gloss over the modelling-to-reality failure by making a completely arbitrary 10% adjustment to bring them in line with each other. This is the most bald-faced tuning I have witnessed (I suspect what I haven’t seen is much worse). At least show us the Smith and the Meehl & Teng hindcasts so we can assess whether they seemlessly can cover the whole comparison range rather than just from the recent startpoints. Note that we are already exiting Meehl’s window, and the Smith forecast shows as starting… right now and is therefore completely useless for data-to-model projections at this time.
“It also included an additional 10% reduction because some models have a climate sensitivity that’s slightly too high.”
Wouldn’t it make more sense to adjust those model’s climate sensitivity and post the results of new runs with the new sensitivity? And if that is too time-consuming, delete the models you know are too sensitive and analyze with what’s left and let us know it was done and how it affects the projections from now on compared to what we had before. In what science are you allowed to instead do a one-time 10% reduction and keep the internals of your otherwise falsified model intact?
There’s a Bayesian approach to this, which I mention because IPCC has used Bayesian approaches in some of its analyses. Being based on expert opinion, and in fact being the best collection of summaries of “expert opinion” for this class of “experts”, the model forecasts provide a prior distribution on the temperatures for a future time. Given data at time t, the posterior distribution can be derived, and that can be taken as the predictive distribution for time t+1. From this perspective and some other readings about Bayesian inference, they are not revising their projections downward enough, a common finding in research comparing humans to the Bayesian standards.
“If the model output is the basis and result of your science, you must use the model output.” — AnonyMoose
“Please explain how anything can be both “the basis and result of your science” without the result being an outcome of a circular argument and, therefore, false” — richardscourtney
“How could anyone take something as complex as the climate and attempt to gloss over the modelling-to-reality failure by making a completely arbitrary 10% adjustment to bring them in line with each other. ” — Hmmm
These three quotes should be burned in everyone’s brain. As they represent the entirety of the purpose and endeavour of science.
1) If we’re hypothesizing and constructing a theortical framework, then AM is correct. We’re required to use prior arguments to construct the later ones. But RC is also correct. Yet a circular argument is not simply ‘If A, then A.’ But ‘Assume A. If A, then A. But A, Therefore A is TRUE.’ Not, ‘A is necessary because we have already assumed it.’ But True of itself externally in reality as a consequence of assuming and hypothesizing about it while scribbling on a piece of paper. In this H is correct as if we’re not using our theory to theorize with, then we’re necessarily using a different theory. You can’t just switch gears in the middle and pretend you have not switched gears.
2) If we’re comparing the theory against reality, then AM, RC, and H all have it dead to rights. We cannot state we are testing our theory, if we aren’t using our theory. But RC is correct in that because the results of our arguments don’t fail a given test, it does not make the theory existentially true, even if the predictive math is useful. In this case Circular, but by why of equivocation or change of subject. eg. ‘Long’ is absurd, because ‘Long’ is not a long word. And H has the right of it, for if we’re comparing the previous model, against current and future reality, then we can’t pretend that the model said something it didn’t. Which is a restatement of AM.
“If the model output is the basis and result of your science, you must use the model output.” — AnonyMoose
Yes, if all you have is a kazoo, you play the kazoo. This is not a surprise. The surprise is that the other members of the orchestra have not arisen, put the kazoo where the kazoo player can’t blow it, and ejected him and his instrument from the auditorium, ♫ ♫ ♫…
Good post, but it is just hammering home the same points that have been made over and over again at this point: in the Stefan-Boltzmann equation (or better yet, because of the way the actual Planck distribution shifts around with temperature across the various absorptive/radiative cross-sections involved). Note
  , not
, not  to any power.
 ensures that as long as the hottest times are a bit hotter and the coldest times are equally a bit colder, the rate of energy loss during the warmer part of the sinusoid will exceed the rate at which energy is retained (relative to the original mean at constant temperature) so that the time average rate of energy loss will increase even though GAST remains unchanged.
a) The IPCC routinely includes GCMs in their forecast spaghetti graphs that any rational person would simply reject on the basis of a failed hypothesis test when compared to the entire stretch of data after the fit region.
b) The “mean” of the model predictions continues to be presented as if it has some meaning, and the “spread” of the GCMs is presented as if it has some meaning. Neither is true according to the rigorous theory of statistics, as GCMs are not iid samples drawn from a common distribution. Each GCM must separately be subjected to a hypothesis test to determine whether or not it is plausible that it is correct before using it for any purpose whatsoever beyond earning the modeler some publications in learned journals presenting tentative, not-to-be-taken-seriously results.
c) The period used to “fit” the GCMs to the GASTA was, for better or worse, a period that happened to precisely coincide with what appears to be a cyclic natural variation clearly evident in HADCRUT4 (which can be fit quite excellently with a three-degree of freedom fit consisting of a straight line plus a sinusoid with a period around 65 years). The GCMs fit what is literally the stretch with the greatest slope on this curve, which has a remarkably small slope in the linear part of the behavior that has not changed across the entire dataset.
d) Because all of the models assumed far too high a climate sensitivity, they compensated for it with far too high a response to e.g. volcanic aerosols. Because the models appear incapable of representing any of the true natural complexity of the real climate, most of the GCMs continue to advance at a “blistering”, nearly monotonic pace even though aerosols are if anything reduced (no major volcanoes for some time). The climate, OTOH, has flattened and even cooled a bit, precisely as one expects from the 3 degree of freedom numerological fit mentioned above.
e) The “10% adjustment” is what we in the business might call a “fudge factor” — a purely heuristic correction added in this case to conceal the obvious failure of the GCMs to correspond to reality. If one simply started dropping failed GCMs from CIMP5, it would drop a lot more than 10%, especially if one used more criteria to reject a failed model than only failure to reproduce GASTA. How about failure to correctly predict: global precipitation, global ice formation, global SLR, global LTTs, global ice formation, ENSO, the PDO, NAO, and failure to come within a three degree range of GAST, the actual global average surface temperature (note well, not the “anomaly”). Would one single GCM survive the cut when by producing one single ensemble run in a hundred that actually matched any three of these within the noise in the real world data? I don’t think so.
f) Let me emphasize this last point: The GCMs are utterly incapable of reproducing GAST, either from model to model, or model run to model run within its ensemble, or with some defensible way of computing GAST given the data. This is astounding! NASA has an entire web-page of apologia for their inability to tell us what the actual global average surface temperature is within a two to three degree Celsius range even as they make claims to know the GAST anomaly to within a few tenths of a degree!
Last time I looked, the rate at which the various components of the Earth’s surface structure radiate energy away to outer space all depend on the temperature in absolute degrees, not the temperature anomaly, whether it be the global anomaly or the local anomaly of the particular patch or slab of surface structure in question. Total outgoing radiation is very sensitive to precisely how absolute temperature is spatiotemporally distributed because of the
To help one understand the impact of this, one can actually radiate away more heat at exactly the same average temperature by simply increasing the amplitude of a completely systematic oscillation around that average temperature. The
Precisely the same result can be obtained spatially — one can increase the rate at which the planet loses heat at constant temperature by increasing the mean temperature of half of the area and decreasing the mean temperature of half of the area by the same amount. Radiation rate is not proportional to the temperature anomaly, and it depends in detail on the spatiotemporal distribution of absolute temperature.
This makes me very uncomfortable. I find it extremely difficult to take model results seriously when different ensemble runs produce GASTs that differ by several degrees C but somehow all have to same shape of their anomaly. Really? How in the world can that possibly work? The runs that are (say) 2C higher in GAST ought to be losing heat at a rate that is 3-4% higher than the runs that are 2C lower in GAST. They all supposedly have the same insolation. Everything ought to be not only different, but radically different, between the two runs. Yet I’ve seen GAST from multiple GCM ensemble runs plotted on the same scales all with the same general anomaly!
How’s that again? Why, exactly, aren’t the too-hot runs cooling and the too-cool runs warming given that total energy in is the same, all the forcings are the same, and all we’re really looking at is tiny perturbations in initial conditions?
So here we are, taking seriously a proposition like: “We don’t know the global average height of a human being to within a centimeter, but we are certain that the average height of human beings is increasing at a rate of a centimeter per century!”
If I state it that way, the absurdity of the proposition is apparent. It is even more apparent when I tell you that the bulk of the data I’m using for my conclusion comes from height measurements conducted in only the US and Europe, and then only in or near big cities, with comparatively little data draw from China, India, Africa, Asia in general, South America, Australia. All of these contribute data that isn’t too bad over the last forty or fifty years (although it is still horribly biased in the sampling mechanism used to obtain it) but before that, it is anybody’s guess how tall the average Chinese person was a hundred to a hundred and fifty years ago (aside from some lines discovered that are scratched on to ancient trees that are supposed to be height measurements made of Chinese boys as they grew up). We have no difficulty at all concluding that we cannot possibly take the latter statement — that the average height of the human race is increasing at the average rate of a centimeter per century — seriously when we don’t even know what the average height is right now to within a centimeter, let alone what it was a hundred years ago!
Yet in climate science this is the accepted way of doing business! If we don’t know GAST right now within a couple of degrees either way, that is very close to a 1% range, quite comparable to an uncertainty of 1 cm in the height of a roughly 2 meter tall person. The rate of expected increase over a century is also order 1% — the change in the anomaly. Yet it is asserted that we know the rate of change of the anomaly quite accurately when we don’t know the current GAST much more accurately than the entire century-scale asserted change and when we don’t know the GAST from 100 years ago anywhere nearly as accurately as we (don’t know it) today!
I have to say that this way madness lies. If we cannot or do not know GAST accurately, I have a very hard time accepting that we know GASTA more accurately. Since any sane treatment or modeling of global energy balance relies exclusively on ST, not the STA, and worse, depends on the spatiotemporal distribution of ST in detail, not as an average global or not, and where the rate of net energy gain and loss is strongly multivalued when plotted against things like GAST let alone GASTA, I simply do not think we can even conceivably solve the problem of getting GASTA right when we still don’t have GAST right.
rgb
[For new readers,
GCM == Global Circulation Models
ST == Surface Temperature
GAST == Global Average Surface Temperature
GASTA == Global Average Surface Temperature Anomaly …. 8<) .. Mod]
“Good post, but it is just hammering home the same points that have been made over and over again at this point:” — rgb
Short version: Climatology has rejected both of thermodynamics and exponents.
Corollary: Modern science, and these guys are doing modern science in the modern way, has the same rigor and knowledge that the Ancient Egyptians had.
AnonyMoose says:
October 29, 2013 at 4:31 am
If the model output is the basis and result of your science, you must use the model output.
This is exactly the point. Others have answered above, however there is one important point to add from my point of view: climate models do not have the real physics inside. but just a “guesstimation” which is by far wrong.
What is the real physics of CO2? What happens to the net heat transfer in the atmosphere?
1) CO2 has some bandwidth of IR where it is opaque, especially around the main resonance of wavenumber 667. This means that IR radiation in this bandwidth will not travel more then 10-12 meters in the air. If anything happens in this bandwidth between the atmosphere and the soil it happens only in the very first 10-12 meters of the atmosphere. Increasing CO2 concentration shortens the visible path to 9-11 meters etc.
2) There is no such heat transfer by radiation through CO2 in the atmosphere.
Nobody has ever done the calculation of the net heat transfer that would be done between the various CO2 strata in the atmosphere as the numbers are infinitesimally small.
3) Changes in the radiative spectra from the top of the atmosphere to the “universe”. There are some attempts at calculating it and measuring it.
What is the physics in the models?
A guessed “forcing” as “backradiation” from the top of the atmosphere that should replace the effect for the 3 points above and which was 3.7 W/m2 and was reduced at 3.4 W/m2 for CO2 doubling + the addition of other factors influenced by this (feedbacks)
It does not fit.
So to my understanding the models fail completely to model the physics and are just a guesstimates of a value that is potentially so small that we cannot compute, this is why they fail miserably at predicting future temperatures. They interpret the warming as CO2 effect and if there are other factors they are clueless and not helping to understand the situation.
Of course if one looks back and puts the values of the guesstimate that fits the past behaviour, voila, we have wonderfully backcasted the climate, a bit aerosols for the cooling at the right periods etc.
And of course if they re-calculate the past temperature with the help of the same models (what they do… why the whole past cooling…) one of course gets even more “fittings”. So circular reasoning and confirmation bias.
The models with such crude approximation of the physics are fit for 7 days forecast and nothing more.
Now if my understanding in climate modeling is completely wrong, shoot and tell me where, what did I misunderstood?
I really hate the Lady Gaga song “Applause”, but it would make a great parody video about “the pause”.
The key inference from the pause is that if global warming was significant enough to be a problem, rather than neutral or a benefit, there couldn’t be “a pause”.
The butcher’s thumb rests
Upon the scales adjusting
Cargo cult results
@rgbatduke (October 29, 2013 at 12:57 pm)
good notes on spatiotemporal T^4 — something Piers Corbyn stresses
Matthew R Marler wrote:
October 29, 2013 at 10:52 am
… at time t, the posterior distribution can be derived,…
I knew it was something about the IPCC, one big posterior distribution.
Warmist says: “Does the surface warming hiatus mean global warming has stopped? No.”
Of course that’s not the issue. The issue is that reality has stopped warming at a time when the models predicted steady warming. The models are the basis of the claim that anthropogenic CO2 will cause catastrophic warming. Falsify the models and the whole house comes down.
As usual, when reality fails the models, the models get adjusted again to fit the new data. Either that, or the data gets adjusted to fit the models.
rgb at duke: To help one understand the impact of this, one can actually radiate away more heat at exactly the same average temperature by simply increasing the amplitude of a completely systematic oscillation around that average temperature. The T^4 ensures that as long as the hottest times are a bit hotter and the coldest times are equally a bit colder, the rate of energy loss during the warmer part of the sinusoid will exceed the rate at which energy is retained (relative to the original mean at constant temperature) so that the time average rate of energy loss will increase even though GAST remains unchanged.
A lot of people seem to be oblivious to that point.
This part too Matthew R Marler (October 29, 2013 at 9:01 pm) :
rgbatduke (October 29, 2013 at 12:57 pm) wrote: “Precisely the same result can be obtained spatially — one can increase the rate at which the planet loses heat at constant temperature by increasing the mean temperature of half of the area and decreasing the mean temperature of half of the area by the same amount. Radiation rate is not proportional to the temperature anomaly, and it depends in detail on the spatiotemporal distribution of absolute temperature.”
Can anyone explain to me what will be so bad about getting back to temperatures that existed prior to the “little ice age” in the late 1300’s? On a positive note you could grow wine grapes in England again and have them survive to make a vineyard. I’ve read the estimate was that the mean temeperate went down approximately 1 degree C.at that time.
Bob Tisdale says: From the public’s point of view, “multidecadal variations are seen as warming periods that last for approximately 3 decades followed by periods of about 3 decades without warming”
The warmists do not necessarily understand the reason for the warming, neither since the LIA nor just the recent warming from the 1970s. Let me suggest an analogy / example.
Suppose, a comet has been spotted entering our solar system, traveling toward the sun.
eg. http://www.st-andrews.ac.uk/~bds2/ltsn/ljm/JAVA/COMETORB/orbit.gif
1. Scientists who understand the physics plot the course and velocity as it approaches, and they predict the likely path and decreasing velocity as it rounds the sun and heads out of the solar system.
2. CAGW scientists notice that as the velocity increases on its inbound course, the comet’s tail grows. They theorize that the growing tail is providing the energy for the velocity to increase. (It’s never the sun, is it?) They forecast not only that the comet’s velocity will continue to increase forever, but also that the tail will continue to grow forever.
Is the IPCC making its models easy to test and disprove, or as hard as possible to test and disprove? Honest science does the former, shyster science the latter.