Dana Nuccitelli published an article today in The Guardian Does the global warming “pause” mean what you think it means?…a play off a line by Inigo Montoya from “The Princess Bride”. Dana has expressed his misunderstanding of one of the most commonly used metrics of global warming—the surface temperature record. And he continues to display his unwillingness to accept that the hypothesis of human-induced global warming is dead.
Nuccitelli presents Box 3.1 Figure 1 from Chapter 3 of the IPCC’s 5th Assessment Report (my Figure 1).

Figure 1
(See the approved Chapter 3 (Observations: Ocean) of the IPCC’s 5th Assessment Report.)
Nuccitelli writes:
The speed bump only applies to surface temperatures, which only represent about 2 percent of the overall warming of the global climate. Can you make out the tiny purple segment at the bottom of the above figure? That’s the only part of the climate for which the warming has ‘paused’.
Nuccitelli is correct that the halt in global warming applies to surface temperatures, but he’s incorrect that it applies only to it. The warming of the top 700 meters has also slowed to a crawl, and is nonexistent in the North Atlantic and North Pacific, but more on that later.
The global surface temperature record includes land surface air temperature (measured at 2 meters from the surface) and sea surface temperature measurements. And as a reference, the GISS, NCDC and UKMO global surface temperature products show little (GISS) to no (UKMO & NCDC) warming since January 2001, based on the linear trends. (See Figure 2, which is from the post here.)

Figure 2
Nuccitelli refers his readers to “tiny purple segment at the bottom of the above figure” (my Figure 1), which is identified by the IPCC as “Atmosphere” in the illustration—not the surface of the oceans.
In their discussion of “Atmosphere” for their Box 3.1, Figure 1, the IPCC explains that the atmospheric component is estimated from lower troposphere and lower stratosphere temperatures, based on satellite measurements. The lower troposphere temperature measurements are from the layer that is approximately 3000 meters above sea level.
The IPCC has NOT presented the heat content for the surface of the oceans in their Box 3.1, Figure 1. The ocean surface warming is included in top 700 meters of ocean warming—not in the atmosphere.
# # #
Further to the IPCC’s Box 3.1, Figure 1, Dana Nuccitelli forgot to advise his readers that the data in the IPCC’s graph have been smoothed with a 5-year filter, and that the smoothing would hide the slowdown in warming of the oceans at depths of 0 to 700 meters and 700 to 2000 meters. And he has elected not to tell his readers that the quarterly NODC ocean heat content data for the North Atlantic during the ARGO era continues to show very little warming for depths of 0-2000 meters and cooling at depths of 0-700 meters. (See Figure 3.)
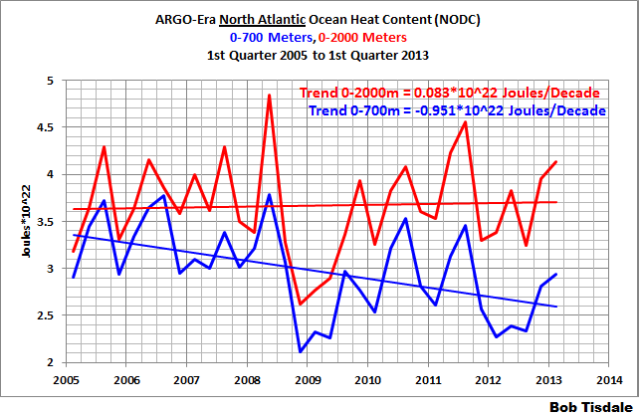
Figure 3
He’s overlooked the fact that the ocean heat content data for the North Pacific show cooling at both levels, with the 0-2000 meter data cooling at a lesser rate than the 0-700 meter data. (See Figure 4.)

Figure 4
(Figures 3 and 4 are from the post here. And the data are available here from the NODC website.)
CO2 is supposed to be a well-mixed greenhouse gas. Obviously, increased CO2 emissions in recent years have had no impact on the ocean heat in the Northern Hemisphere.
# # #
Nuccitelli uses the tired and misleading “atomic bomb” metric:
As the IPCC figure indicates, over 90 percent of global warming goes into heating the oceans, and it continues at a rapid pace, equivalent to 4 Hiroshima atomic bomb detonations per second.
The IPCC doesn’t mention Hiroshima atomic bombs anywhere in their Chapter 3; the words “Hiroshima”, “atom”, and “bomb” do not appear in Chapter 3 of the IPCC’s AR5; so don’t think the IPCC is responsible for this nonsensical claim. One would have to assume Nuccitelli is referring to the 0.6 watts/meter^2 imbalance at the surface found in papers like Stephens et al (2013). See Figure 5.

Figure 5
As I wrote in Climate Models Fail:
The total of the downward shortwave (solar) radiation and longwave (infrared) radiation is about 534 watts/meter^2, so the estimated imbalance of 0.6 watts/meter^2 is only about 0.1% of the total downward radiation at the surface. Or, in other words, the total amount of downward radiation at the surface is about 890 times more than the difference. Also note the uncertainty in the imbalance. The estimated imbalance is 0.6 +/- 17 watts/meter^2. That is, the uncertainties are 28 times greater than the estimated value. Bottom line: the surface imbalance may exist or it may not.
Note: Radiative imbalance is the metric that alarmists like to portray in terms of atomic bombs. What the alarmists fail to tell their readers is that sunlight and natural levels of infrared radiation at the surface are almost 890 times the number of atomic bombs they’re claiming, and that the uncertainties in radiative imbalance are 28 times the radiative imbalance.
# # #
Nuccitelli continues to mislead his readers in that article:
Over longer time frames, for example from 1990 to 2012, average global surface temperatures have warmed as fast as climate scientists and their models expected.
As I noted in the post Open Letter to the Honorable John Kerry U.S. Secretary of State, the modelers had to double the rate of the warming of global sea surface temperatures over the past 31+ years in order to get the modeled land surface air temperatures even close to the observed warming. (See Figure 6.)

Figure 6
So let’s look at the difference between modeled and observed global sea surface temperatures since 1990 to put it into the time period Dana Nuccitelli prefers, Figure 7. “Climate scientists and their models expected” the surface of the global oceans to have warmed at a rate that was almost 3 times faster than observed since 1990.
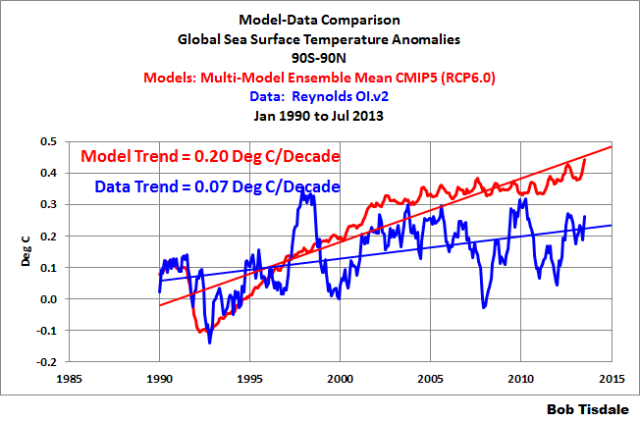
Figure 7
Three times as fast must mean “as fast as climate scientists and their models expected” in the new climate change doubletalk of global warming enthusiasts.
# # #
Nuccitelli and the global warming enthusiasts from the IPCC like to present global warming in terms that are meaningless to most people, in Joules with lots of zeroes after it. The units in the IPCC’s Box 3.1, Figure 1 (my Figure 1) are in Zettajoules or Joules*10^21. But as we’ve illustrated and discussed recently, the warming of the oceans takes on a whole new perspective when we present it in terms familiar to people: deg C. (See Figure 8, which is from the blog post here.) Surface temperatures stopped warming, the warming of the top 700 meters of the oceans has slowed to a crawl, so if there is continued warming at depths of 700 to 2000 meters, it is so miniscule that it’s not coming back to haunt anyone at any time in the future.

Figure 8
# # #
After a long discussion of multidecadal variations in surface temperatures, Nuccitelli’s final paragraph begins:
In terms of the threat from long-term global warming and climate change, it really doesn’t mean anything. It just means that at the moment, more global warming is being absorbed by the oceans, but the next time ocean cycles shift, we’ll experience accelerated surface warming just like we did in the 1990s.
But Nuccitelli misses the obvious. We discussed this in the post Will their Failure to Properly Simulate Multidecadal Variations In Surface Temperatures Be the Downfall of the IPCC?:
Most people will also envision the multidecadal variations extending further into the future. That is, they will imagine a projection of future Northern Hemisphere surface temperatures repeating the slight cooling from 1945 to the mid-1970s along with the later warming, followed by yet another slight cooling of Northern Hemisphere surface temperatures, in a repeat of the past “cycle”. That is, they will envision the surface temperature record repeating itself. And in their minds’ eyes, they see an ever growing divergence between the models and their projections, like the one shown in Figure [9].
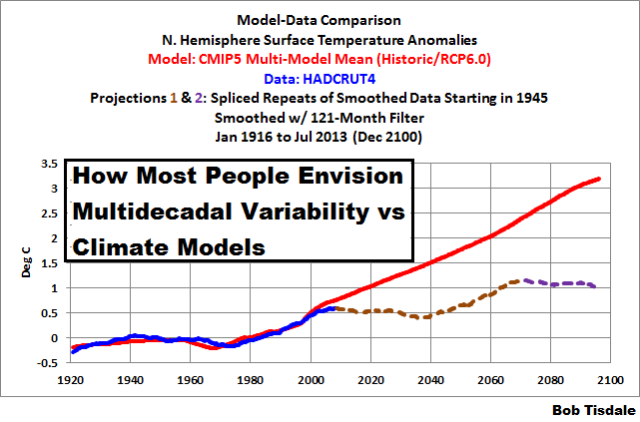
Figure 9
FURTHER READING
In my book Climate Models Fail, I have collected my past findings about climate model failings, and illustrated others, and I’ve presented highlights from the research papers critical of climate models—and I “translated” those research findings for persons without scientific or technical backgrounds. And as noted earlier, there is also a discussion of the natural warming of the global oceans. The free preview of Climate Models Fail is available here. It includes the Introduction, Table of Contents and the Closing. Climate Models Fail is available in pdf and Kindle formats. Refer to my blog post New Book: “Climate Models Fail” for further information, the synopsis from the Kindle webpage and purchase/download links.
Ocean heat content data and satellite-era sea surface temperature data indicate the oceans warmed via natural ocean processes, not from manmade greenhouse gases. This has been addressed in dozens of blog posts here and with cross posts at WattsUpWithThat for almost 5 years. I further discussed this in minute detail in my book Who Turned on the Heat? It is only available in .pdf form. A preview is here. Who Turned on the Heat? is described further in, and is available for sale through, my blog post “Everything You Ever Wanted to Know About El Niño and La Niña”.
CLOSING
The hypothesis of human-induced global warming is dead. Global warming enthusiasts like Dana Nuccitelli and the IPCC just haven’t come to terms with their losses. They should be burying it with dignity, and moving on to greener pastures, but they’re not. They’ve chosen to parade around a failure of science like a pull toy.
The problem is “blog post” – why not submit your work to a journal to get it peer reviewed?
on el nino or la nina…one place warms while the other cools…and vice versa…why is it not a wash as far as the so called global average temps are concerned ??
to dingo…the peers wont let it be published…i know…i tried
It’s worth reading the komments section below the article…
[Nuccitelli – mod] manages to get a “cherry pick” in there quite easily, but it seems ‘error418 ‘ got the better of him
Thanks Bob.
Excellent!
Dingo says: “The problem is “blog post” – why not submit your work to a journal to get it peer reviewed?”
Two things, Dingo: (1) I present data, and the data I present is associated with papers that have been peer-reviewed. (2) the newspaper blog post to which I am responding also has not been peer-reviewed. You are insisting that I present this blog post and others for peer review when you do not insist that Nuccitelli do the same for his nonsensical opinion pieces in “The Guardian”. Seems to be a double standard there on your part.
Adios!
Dingo
The problem is “blog post”
Indeed but it carries more weight than that of a poorly informed journalist with a particular world view, and one who writes for a newspaper that considers climate scientist to include biologists, psychologists and sociologists (as stated in one article) but not geologists (as stated in another).
Dingo says:
October 18, 2013 at 5:47 am
The problem is “blog post” – why not submit your work to a journal to get it peer reviewed?
_________________
I agree. Send it to Phil Jones for a quick review.
I suppose Dana’s essay and Bob’s both seem pretty plausible. though they arrive at completely differing viewpoints using the same data. Short of doing as Dingo suggests and submitting both studies for peer reviewed publication, we can only assume it’s another nail in the coffin for those who feel that science is always objective and there is no subjective influence governing the conclusions.
“Dingo says:
October 18, 2013 at 5:47 am”
Same dog that stole the EAU CRU raw data?
Bob
The problem is even when the obvious is pointed out to them they’ll still continue to peddle whatever nonsense their editor tells them.
The two worst papers in the UK are the Daily Mail (note not the Sunday Mail) and the Guardian. Both play to their respective galleries irrespective of the impact of such irresponsible journalism. The only difference is that the Guardian assumes (as does its readers) the seriousness of a broadsheet. It has no such qualities, its articles are generally simple binary pieces with heroes and villains. If one wants a proper left-leaning paper read the Independent.
Apologies Bob, our posts seem to have crossed each other, I did not see yours until after I had posted, cheers G.
Nutticelli’s blog post is an example of the pseudoscientist warmists’ current tactic, which is to redefine what ‘global warming’ means, so that they can pretend that it is still happening the way their chicken little scare stories claimed it would. This method of telling a lie is so common that it has been given a formal name: equivocation.
Sorry warmists. You don’t get to equivocate. You conceptualized, defined, modeled, and sold ‘global warming’ to a gullible public as a phenomenon of globally averaged surface temperature. Your attribution of ‘global warming’ to human causes, and your effects studies that claim ‘global warming’ will be the death of us all, all depend on dramatic increases in globally averaged surface temperature. Those scary stories talked about an increase of 4-8C in globally averaged surface temperature. That ain’t gonna happen, and you know it as well as we do. More to the point, you knew it as well as we did, and told the scary stories anyways.
You want to redefine ‘global warming’ to be a phenomenon that manifests as a change in ocean heat content? Fine. Back to first principles for you. Call back in 150 years, when you have enough ocean heat content data to talk about.
And this time, do it on your own dime.
James Strom says: “I agree. Send it to Phil Jones for a quick review.”
I use EXCEL. Last I heard Phil Jones didn’t know how to use a spreadsheet.
@James Strom – that is the Phil Jones that conspired to change what a “peer reviewed” paper was to ensure none that did not conform to their opinions, correct?
gopal panicker says: “on el nino or la nina…one place warms while the other cools…and vice versa…why is it not a wash as far as the so called global average temps are concerned ??”
ENSO acts as a chaotic, sunlight-fueled, recharge (La Nina)-discharge (El Nino) oscillator, and the discharge also includes a redistribution of warm water after the El Nino. This will give you an overview (42MB):
http://bobtisdale.wordpress.com/2013/01/31/the-manmade-global-warming-challenge/
UPDATE: Oops, wrong link. Here’s the direct link to the essay in pdf form:
http://bobtisdale.files.wordpress.com/2013/01/the-manmade-global-warming-challenge.pdf
Bob
I remember not so long ago everyone was getting excited when it was suggested that seismic events may be the trigger for El Nino events (and obviously not the source of the thermal energy). I take it this has now been assigned to the shelf of “many possibilities”.
The total global heat content for the 0-700m range can be found here
http://www.nodc.noaa.gov/OC5/3M_HEAT_CONTENT/
I’d like to see someone subtract of the 0-2000m to leave the 700-2000m heat content… just out of interest, I think WillisE did that in a post but I can’t find it
anyway the problem with trying to drive home the whole “pause” in surface temperatures angle is that they can easily just point to heat content, as Dana does.
Dana N. sets out his rationale on Skeptical Science, http://www.skepticalscience.com/does-global-warming-pause-mean-what-you-think.html I’ll also link Bobs response on that site. I’d be very interested to see Dana’s response to Bobs analysis of the situation.
Bob, nice post. I do accept that there is a forcing from CO2, but the size of the net forcing is up in the air, so to speak. The trend for the past one or two decades has been tiny. You illustrated one huge problem when you said–
>>Also note the uncertainty in the imbalance. The estimated imbalance is 0.6 +/- 17 watts/meter^2. That is, the uncertainties are 28 times greater than the estimated value. Bottom line: the surface imbalance may exist or it may not.<<
In both sea and atmospheric temperatures, to claim that we have measured a warming trend is to pretend to a precision that does not exist. And the same holds for net energy flows, as you show.
Koch brothers funding update:
A couple of days ago I wrote an open letter to the Koch brothers welcoming a donation from them.
http://bobtisdale.wordpress.com/2013/10/15/open-letter-to-the-koch-brothers/
And I had provided a link on one of Anthony’s posts here at WUWT. There was a LOT of interest based on the number of visits that post received. So here’s the update for those who came to visit:
I’m sorry to inform you that I have not received any funding yet from the Koch foundations. If I do, I’ll be more than happy to report it in great big capital letters.
SideShowBob says: “I’d like to see someone subtract of the 0-2000m to leave the 700-2000m heat content… just out of interest, I think WillisE did that in a post but I can’t find it”
Gotcha covered:
http://bobtisdale.wordpress.com/2013/07/04/rough-estimate-of-the-annual-changes-in-ocean-temperatures-from-700-to-2000-meters-based-on-nodc-data/
cd says: “I remember not so long ago everyone was getting excited when it was suggested that seismic events may be the trigger for El Nino events (and obviously not the source of the thermal energy).”
Sorry, cd. I don’t recall that discussion of seismic events triggering El Ninos. I will be publishing a post next week about the known triggers of El Ninos.
Regards
One must wonder if Nuccitelli is ignorant or disingenuous. I vote for the latter.
Bob
http://onlinelibrary.wiley.com/doi/10.1029/00EO00194/abstract
I didn’t read it all, just the abstract. I remember some excitement about the possible association. I think there are others, I’ll have a look.
Bob
I think this has references to a causal link. The last link had the causality the other way around.
http://www.nytimes.com/1988/11/29/science/theory-ties-earthquakes-in-pacific-to-el-nino.html
Could you give a more precise statement of “the hypothesis of human-induced global warming” that you claim is now dead?
For example, many skeptics say that they think AGW in general is plausible, but they object to the idea of “catastrophic” AGW, although different skeptics define this in different ways, often without saying exactly what they mean making it hard to make comparisons. Here, you seem to be rejecting not just CAGW, but AGW as a whole.
Another example, are you claiming that “the hypothesis of human-induced global warming” across the whole twentieth century is dead?
Wasn`t there a post somewhere, recently, that showed that on the SkS search facility, “ocen heat” was searched for roughly four or five times a year, yet in the last two years that number has reached in to the hundreds?
And they say that the emphasis has never been on atmospheric temperatures?
“The estimated imbalance is 0.6 +/- 17 watts/meter^2. ”
Why on earth would anyone try to draw ANY conclusion about energy imbalance based on that? It truly boggles the mind that anyone would think that that was significant in any way.
Ask a gambler to place a bet if you give him “The Dallas Cowboys will score 30 points +/- 840.” (obviously I’d take that bet all day long). It’s meaningless, as is the imbalance estimate.
I really do not like the title of this otherwise excellent article.
It is common practice for alarmists to muddle up AGW with CAGW. Sceptics should not make the same mistake.
AGW exists, but nobody knows how to quantify it or how to tell you what the Earth’s temperature would have been like over the past 100 years without the activities of man. What we do know about AGW is that it is a mild, almost entirely beneficial phenomenon.
CAGW, on the other hand, is a total hoax, something dreamed up by the Global Warming Industry to scare gullible politicians into pouring billions of tax dollars into the overflowing troughs of bad science, thus perpetuating the comfortable lifestyles of dubious ‘climate scientists and statisticians’.
Bottom line: The concept of AGW, as it really is, pays no bills, while CAGW keeps those troughs overflowing.
Chuck
It’s a tough one. I’d guess he holds a certain world view that means AGW is right and in the end he will be proved right. And for that reason alone all the disinformation and obfuscation is justified.
You get this from left-leaning “mediocrities”; they love to extol their wisdom and virtue and impart it to the rest of us. Sanctimonious hypocrites of you ask me.
The Ocean Heat Content uptake has not increased.
The rate has fallen.
It has not increased, temporarily taking energy away from potential surface temperature increase. The OHC uptake rate has decreased and the surface temperatures have flatlined.
There is something missing or not correctly outlined in global warming theory. It is as simple as that.
JK says: “Another example, are you claiming that ‘the hypothesis of human-induced global warming’ across the whole twentieth century is dead?”
JK, we only need to discuss the past 30 years. That’s the period the IPCC says the warming can only be explained by the emissions of manmade greenhouse gases.
For the past few years in numerous blog posts, I’ve illustrated and discussed how the ocean heat content data and satellite-era sea surface temperature data both indicate they’ve warmed, but they’ve warmed due to naturally occurring, naturally fueled ocean-atmosphere processes—not manmade greenhouse gases. See my illustrated essay “The Manmade Global Warming Challenge” for an overview:
http://bobtisdale.files.wordpress.com/2013/01/the-manmade-global-warming-challenge.pdf
Regards
Chuck L says:
October 18, 2013 at 7:05 am
One must wonder if Nuccitelli is ignorant or disingenuous. I vote for the latter.
I would not eliminate the possibility he is both.
Interesting that Stephens et al don’t display what the models’ imbalances are. One can do the math for oneself, I suppose. It would appear that the average model has a TOA imbalance 2.2 W/m^2. I’m not sure the mins and maxes go with each other for the different things, but assuming they do, the minimum corresponds to an imbalance 9.8 W/m^2 and the maximum to -6.3 W/m^2 (yes negative). Curiouser, for the observations I get .5 W/m^2 not .6, but close enough.
With the surface those values are .9 W/m^2, 64.8 W/m^2, -6.6 W/m^2, and .6 W/m^2 respectively. Well at least this time the observational value matches that Stephens et al put down exactly. It appears that:
1. The models have too high of imbalances on average and
2. Models do not make a meaningful set of predictions about the imbalances, since they appear to give ranges of values much larger than the uncertainties in the measurements thereof, and even spanning no imbalance.
An observation one could make simply glancing at the values Stephens et al. did give: It’s quite obvious that we cannot be meaningfully said to have measured the surface imbalance, since the uncertainy is two orders of magnitude larger than the central estimate of it’s value. One wonders why we speak of the surface imbalance at all, since it is not actually known to exist.
I am confused. Dana seems to discount efforts to use any type of natural cycle as a reason for the current cooling. Then in his next statement asks the reader what will happen when the ocean shifts to a warming phase? Doesn’t that statement mean he accepts natural cycles?
Also, having sensor accuracy 28 times larger than the perceived mathematical difference would have shut this whole debate down in the real world.
Bob, you do great at explaining in layman terms what is happening, thank you! Could you do me a favor and find a better word for “crawl”? Adjectives in technical papers always set off my alarm bells.
Thanks again…..
Aside from not wanting people to notice, Nuccitelli and his partner activists at modern Anglosphere environmental studies institutions aren’t bothered in the slightest bit by several tenths of a degree contradiction in their rewriting of history (as highlighted, for example, about 1/2 of the way down in http://img176.imagevenue.com/img.php?image=81829_expanded_overview_122_424lo.jpg ), which makes worthlessly untrustworthy their claims implying hundredths of a degree change in deep ocean water temperatures.
The very fact that they publicize, to the public, ocean temperature change solely in joules rather than in degrees, to mislead, should already make someone realize dishonesty is more probable than not.
Heck, looking at figure 8, it appears that, among other aspects, they were sloppy enough to just make up about a straight line of pretended data from 2008 on, neglecting how poorly that compares for plausibility to the surface temperature pattern; they had for earlier years tried to follow it more, to make the BSing less obvious, but gave up when unwilling to show the inconvenient downturn.
If someone lies to you X times in a row, there is no reason to auto-trust them on the X+1 iteration. When a source is compromised, it is compromised. Few people appreciate such (partially due to carry-over of politeness instincts from face-to-face conversation), and liars take advantage of the mistake, too often correct in figuring that, if they just keep lying harder and harder, repeatedly and repeatedly, people will sooner or later believe. Claimed ocean heat content is garbage. Would people believe if they next were told the heat was hiding on the other side of the universe, conveniently away from independent verification?
If the NODC was disgusted to be partnered with the dishonesty of the rest of the CAGW movement, accordingly speaking against such, and, if it was staffed all by people who wouldn’t ordinarily come to it (non-environmentalists), then there might be some reason to trust them. As it is actually? No way.
JK says: “Another example, are you claiming that ‘the hypothesis of human-induced global warming’ across the whole twentieth century is dead?
Henry says
fyi
Dana is nuts. He automatically wipes all comments made by known skeptics.
They must keep a close record of that (at his guardian newspaper)?
It showed to me how close we are to being watched by big brother and how easy it is to ostracize certain people (like in the the nazi period it was jews, we know that in the future it will be those who believe in Christ)
look at global minima to rubbish AGW (minima are not pushing up the average temps)
look at global maxima if you want to predict the future (maxima are an independent proxy for energy coming through the atmosphere)
if you follow these simple procedures you will or you should get the same results as I got
http://blogs.24.com/henryp/2013/02/21/henrys-pool-tables-on-global-warmingcooling/
http://blogs.24.com/henryp/2012/10/02/best-sine-wave-fit-for-the-drop-in-global-maximum-temperatures/
once you have figured that all out
it should not be long before you come to agree to my final report on this
http://blogs.24.com/henryp/2013/04/29/the-climate-is-changing/
gopal panicker says:
on el nino or la nina…one place warms while the other cools…and vice versa…why is it not a wash as far as the so called global average temps are concerned ??
It probably does, but the issue is, over what time period? The PDO cycles over 60 years. So there is bound to be a residual in the noise, unless the signal is integrated over a time period that is very long compared with 60 years. Our data has far too short a time period for the ENSO residual to be “a wash”
JK says: “Another example, are you claiming that ‘the hypothesis of human-induced global warming’ across the whole twentieth century is dead?
Henry says
fyi
Dana is nuts. He automatically wipes all comments made by known skeptics.
They must keep a close record of that (at his guardian newspaper)?
It showed to me how close we are to being watched by big brother and how easy it is to ostracize certain people (like in the the nazi period it was jews, we know that in the future it will be those who believe in Christ)
look at global minima to rubbish AGW (minima are not pushing up the average temps)
look at global maxima if you want to predict the future (maxima are an independent proxy for energy coming through the atmosphere)
if you follow these simple procedures you will or you should get the same results as I got
http://blogs.24.com/henryp/2013/02/21/henrys-pool-tables-on-global-warmingcooling/
http://blogs.24.com/henryp/2012/10/02/best-sine-wave-fit-for-the-drop-in-global-maximum-temperatures/
once you have figured that all out
it should not be long before you come to agree to my final report on this
http://blogs.24.com/henryp/2013/04/29/the-climate-is-changing/
xxx
Tiny edit to prior post: Once “deep ocean” would fit where “ocean” is used.
K says: “Another example, are you claiming that ‘the hypothesis of human-induced global warming’ across the whole twentieth century is dead?
Henry says
fyi
Dana is nuts. He automatically wipes all comments made by known skeptics.
They must keep a close record of that (at his guardian newspaper)?
It showed to me how close we are to being watched by big brother and how easy it is to ostracize certain people (like in the the nazi period it was jews, we know that in the future it will be those who believe in Christ)
look at global minima to rubbish AGW (minima are not pushing up the average temps)
look at global maxima if you want to predict the future (maxima are an independent proxy for energy coming through the atmosphere)
if you follow these simple procedures you will or you should get the same results as I got
http://blogs.24.com/henryp/2013/02/21/henrys-pool-tables-on-global-warmingcooling/
http://blogs.24.com/henryp/2012/10/02/best-sine-wave-fit-for-the-drop-in-global-maximum-temperatures/
once you have figured that all out
it should not be long before you come to agree to my final report on this
http://blogs.24.com/henryp/2013/04/29/the-climate-is-changing/
xx
I enjoy your posts, Bob. Thanks.
I’m not sure how this is a rebuttal of Nuccitelli’s article. Bob spends a lot of time discussing surface temperatures and models, which do not contribute to the main point of Dana’s article. In fact Dana says “the best climate contrarians can do is find a flat 10-year surface temperature trend”, and Bob’s rebuttal does exactly that. Also, Bob largely ignores the ocean from 700-2000m, which is where Dana says heat is increasing most. Bob dodges the point by saying that people can’t understand Joules.
I’m not saying that Nuccitelli is correct, but this post does almost nothing to discredit him.
^^^ One of the reasons dishonesty is so prevalent amongst many groups engaged in pushing a cause or argument is that it gives a major selective advantage, like natural selection, if the other side is too polite or unwilling to deviate from taking anyone’s published statements (or NODC “data” in this case) at face value auto-trusted. The dishonest side has the advantage then, as all they have to do can be to find a lie hard to disprove, like somewhere where there aren’t enough of other data sources for cross-checking. Such is particularly easy if prior lies and proof of bias are ignored, as if they should be auto-trusted anew each time, as sooner or later they can come up with something relatively effective in that context.
It is BS, though, compared to the overall picture in http://img176.imagevenue.com/img.php?image=81829_expanded_overview_122_424lo.jpg
JK says: “Another example, are you claiming that ‘the hypothesis of human-induced global warming’ across the whole twentieth century is dead?
Henry says
fyi
Dana is nuts. He automatically wipes all comments made by known skeptics.
They must keep a close record of that (at his guardian newspaper)?
It showed to me how close we are to being watched by big brother and how easy it is to ostracize certain people (like in the the nazi period it was jews, we know that in the future it will be those who believe in Christ)
look at global minima to rubbish AGW (minima are not pushing up the average temps)
look at global maxima if you want to predict the future (maxima are an independent proxy for energy coming through the atmosphere)
if you follow these simple procedures you will or you should get the same results as I got
http://blogs.24.com/henryp/2013/02/21/henrys-pool-tables-on-global-warmingcooling/
http://blogs.24.com/henryp/2012/10/02/best-sine-wave-fit-for-the-drop-in-global-maximum-temperatures/
once you have figured that all out
it should not be long before you come to agree to my final report on this
http://blogs.24.com/henryp/2013/04/29/the-climate-is-changing/
I wonder why any of my comments are not being posted…
REPLY: two reasons “henry”
1. Too many links trigger spam filter
2. Too many words w/ links increase likelihood of spam score being high
3. You change handles
All up now, in quadruplicate – Anthony
Bob,
This was the first time I have seen figure 5. The balance 0.6 +- 17 of course makes me ROFL. But what caught my attention was actually the other balance at TOA. You have probably digged into this already, but there seems to be some error with these values. Shouldn’t the balance be 0.5 +- 4 instead of 0.6 +- 0.4? I don’t see, in general, how the uncertainty could decrease when adding values together.
BR,
Nicklas
NicklasE- The uncertainty of such things can go down if errors are expected to be correlated between the different terms.
BOB,
Great post.
You say that the ‘4 Hiroshima bombs’ that Dana keeps banging on about is probably derived from a surface imbalance of 0.6w/sq.m.
From articles on SKS, Dana and his fellow alarmists don’t appear to claim that downwelling radiation from CO2 actually heats the oceans directly, but that it heats the thin cool-skin surface layer (which is apparently less than 1mm thick), causing a change in the heat gradient across the layer and thus reducing the rate of conductve heat flow through it to atmosphere. Dana himself does not seem to deny that the source of ocean heat is actually insolation.
I have never seen a reference to any paper that confirms quantatively that an imbalace of (say) 0.6 w/sq.m. could cause a change in the conductvity of the thin film layer such that it would reduce heat loss by the equivalent of 4 Hiroshima bombs per second.
Dana is really just handwaving on this, but he gets a lot of gullible people enthusiastically waving back. It would therefore be great if you or another contributor to WUWT could show by (even approximate) calculation that the ‘4 Hiroshima bomb’ claim using the ‘thin film’ mechanism, is a fallacy. Sadly, I don’t have the ability to do this, but it would certainly put a timely bomb under a claim that the alarmists are eager to promulgate.
Thanks for the effort, Bob. Another alarmist post is now ready for the “round-file”.
Hey Dana, we sure hope all that ocean heat ends up warming up ENSO waters soon. We seem headed for another December with “the girl”!
Help ! Can one of you mega-brains out there in WUWT-land explain something to me about Figure 5 (Figure 1 in Stephens et al).
Regarding the TOA budget, the error bars are +-0.1 for SW In, +-2 for SW out, and +-3.3 for LW out. It therefore seems to me that the combined error bar for TOA imbalance ought to lie between:
3.3 + 2 + 0.1 = 5.4 i.e. the largest combination of the 3 numbers
and 3.3 – 2 – 0.1 = 1.2 i.e. the smallest combination of the 3 numbers
So how do we arrive at an actual error bar of +- 0.4 ?
Regarding the imbalance at the surface, the fact that the error range is more than an order of magnitude greater than the item we are trying to estimate and that the zero value is very close to the centre of the range means that (1) we have no real idea of what the true imbalance is, and (2) it is almost 50/50 that there is a net outflow meaning there is no missing heat. Is this interpretation of the Figure 5 correct ?
Thanks to anyone who takes the time to educate me on this.
I’m not clear on the point of this post. Nuccitelli’s argument essentially revolves around the IPCC figure 3.1 energy accumulation graph. Bob presents surface data and regional energy accumulation data. Surface data, while of great interest to us surface dweller, being two-dimensional, doesn’t explicitly tell us anything about energy content/accumulation. The regional energy accumulation data showing an apparent northern/southern hemisphere difference is also interesting, raising questions about mechanisms of energy distribution, but doesn’t by itself refute the IPCC “world total” accumulation figure. Unless one can do that, I don’t see how the conclusion “The hypothesis of human-induced global warming is dead.” necessarily follows.
Bob your Fig 9 shows projections of the empirical 60 year cycle. You really should project and include the 1000 year cycle as well . See the timing and extent of the coming cooling using the 60 and millennial cycles at http://climatesense-norpag.blogspot.com
Here’s a summary
1 Significant temperature drop at about 2016-17
2 Possible unusual cold snap 2021-22
3 Built in cooling trend until at least 2024
4 Temperature Hadsst3 moving average anomaly 2035 – 0.15
5 Temperature Hadsst3 moving average anomaly 2100 – 0.5
6 General Conclusion – by 2100 all the 20th century temperature rise will have been reversed,
7 By 2650 earth could possibly be back to the depths of the little ice age.
8 The effect of increasing CO2 emissions will be minor but beneficial – they may slightly ameliorate the forecast cooling and help maintain crop yields .
9 Warning !! There are some signs in the Livingston and Penn Solar data that a sudden drop to the Maunder Minimum Little Ice Age temperatures could be imminent – with a much more rapid and economically disruptive cooling than that forecast above which may turn out to be a best case scenario.
Still, at least Diana spelt his name right!
Why does Dana have to pick on the poor people of Hiroshima? To make reference to the energy of the bomb that killed and maimed thousands of people and relate it to ocean heat content is sick.
Well. I have no idea how he’s going to get out of this.
If your statement is true…
“How it actually works is that during some periods there’s more heat transferred to the oceans, during others there’s less. It’s not a matter of heat being pumped from oceans to atmosphere, it’s a matter of the oceans absorbing less of the incoming energy. ”
This coupled with the fact that the molten earth core is caused by thermo-nuclear reactions since the earth was formed. Shouldn’t the seas be boiling right now?
Brian says: “Also, Bob largely ignores the ocean from 700-2000m, which is where Dana says heat is increasing most. Bob dodges the point by saying that people can’t understand Joules.”
Obviously, you’ve overlooked Figures 3, 4 and 8 which all include ocean heat content or depth-averaged temperatures to 2000 meters.
Brian says: “Bob spends a lot of time discussing surface temperatures and models, which do not contribute to the main point of Dana’s article.”
Did you read Dana’s article, Brian? Maybe you didn’t understand it. As a preface to my short discussion of climate model failings, I quoted Nuccitelli’s article:
“Over longer time frames, for example from 1990 to 2012, average global surface temperatures have warmed as fast as climate scientists and their models expected.”
Brian says: “In fact Dana says ‘the best climate contrarians can do is find a flat 10-year surface temperature trend’, and Bob’s rebuttal does exactly that.”
Actually, the surface temperature graph with the shortest term in my post presents data for over 12.5 years.
Brian says: “Bob dodges the point by saying that people can’t understand Joules.”
In reality, Brian, I presented the warming of the oceans in my Figure 8 in degrees C to show that the supposed continued warming of the oceans at depths of 700-2000 meters is worthless metric.
Brian says: “I’m not saying that Nuccitelli is correct, but this post does almost nothing to discredit him.”
Considering that your comment broadcasts that you have (1) no grasp of what was presented in this post, or (2) a willingness to misrepresent what was presented, or (3) a combination of 1 and 2, I would have to say your opinion is of no value.
Regards.
this sums it up for me…..
There has been no atmospheric warming for 17 years, because 2.4 billion nuclear bombs worth of heat is hiding in the bottom of the ocean.
This heat at the bottom of the ocean is affecting atmospheric physics through a mysterious mechanism, which actually doesn’t involve any change in heat content of the atmosphere.
The symptoms of this are known as climate change, which has caused all sorts of highly educated people to remark that they don’t remember any windy, hot or rainy days prior to a few months ago.
http://stevengoddard.wordpress.com/2013/10/18/understanding-how-the-missing-heat-causes-climate-change/
Peter Miller says:
October 18, 2013 at 7:14 am
“It is common practice for alarmists to muddle up AGW with CAGW. Sceptics should not make the same mistake.”
AGW is not proven – GW occurs, though. Certainly the manifestation of Anthropogenic change as CO2 emissions is being challenged to a significant degree by nature as we write. It’s pretty well indisputable that the last 17 years has illustrated that natural variability easily overwhelms CO2 warming (if there is any) – it stopped and looks like temps can even drop (the more they do, the more they whittle off possible CO2 warming). Moreover, the period of warming widely attributed to humans was really between 1979 and 1998, only 18yrs, and the strong evidence of natural variability makes it a significant candidate for contribution to the warming that took place.
CO2’s affect is challenged by paleo records which show: it rises generally after temperature’s rise, it has been as high as 5000 ppm, even when it was cold. Further, notwithstanding the absorption of LWR, there is evidence (growing of late) that warming (from whatever sources) triggers negative feedbacks to counteract it (Willis Eschenbach’s thermostat papers and others). The compelling evidence of this to me is that the equatorial ocean temperatures, where the largest proportion of solar insolation takes places never exceed 31C. Finally, fiddling recent temperatures up and past temperatures down by several tenths of a degree C accounts for a significant part of the warming. In 1998, 1936 still stood as the all time high at least in the US but it was a globally warm period as well – showing on all temperature charts. GISS deliberately trimmed the 1930s and 40s temps to make 1998 the high. And look at it now – the thirties have been pushed down even further over the past decade. With a cooling period in the works, this fiddling is about to strike back with a vengeance. Having the satellite record limits this chicanery for the future and their already pumped up present day temperatures will exaggerate the cooling in the works. CO2 heating in a jar is a naive proof of AGW in the atmosphere.
Brian says:
October 18, 2013 at 7:50 am
“I’m not sure how this is a rebuttal of Nuccitelli’s article.”
I agree but not for the same reasons I’m sure. Don’t you or Bob segue into “the warming has shifted to the oceans” gambit. The activist hype has always been about atmospheric warming and the disaster it is going to cause. We should be sure to trumpet this when they put out this other junk. They themselves abandoned the label with ‘Climate Change’ but it still was all about the expected 3 to 6C increase to come. Dancing around carrying the goal posts with them is itself proof that the theory has little legs of its own these day – the new stuff is all life support tubes up the nose of the theory.
That’s was in his reply in comment btw.
When is a pause not a pause?
http://sunshinehours.wordpress.com/2013/10/13/hadcrut4-northern-hemisphere-winter-doom/
Northern hemisphere winter temps since 2007
Do you live in the Northern Hemisphere.? Did anyone tell you that in the midst of record CO2 levels HADCRUT4 shows massively dropping winter temperatures?
At the bottom of this post is a graph of HADCRUT4 Northern Hemisphere only temperatures for each month for the last 7 years.
Did you know December was cooling at -.9C per decade? By 2100 December could be 8C colder?
Did you know January was cooling at -.73C per decade?
Did you know March was cooling at -.56C per decade?
Did you know February was cooling at -.19C per decade?
Did you know November was cooling at -.2C per decade?
Did you know October was cooling at -.17C per decade?
Did you know April was cooling at -.17C per decade?
Did you, Dana?
I’d post at CiF but they won’t even let me register any more after I kept unravelling their lies.
Imagine if these guys, these characters were in power (political power, elected and appointed positions and even in various civil service positions throughout government bureaus) … do you suppose they and their fellow travelers would still have the same mindset and keep “close records” of those showing the least signs of opposing them for their views?
I shudder at the thought.
.
HenryP says:
October 18, 2013 at 7:43 am
“It showed to me how close we are to being watched by big brother and how easy it is to ostracize certain people (like in the the nazi period it was jews, we know that in the future it will be those who believe in Christ)”
Carefule there. Nazism was not only a socialist/fascist economic system but also an esoteric neo-pagan religion; nothing to do with Christianity. Look at Thule society, Vril society, connections to Blavatsky. And of course the entirely anti-Christian Eugenicism; invented by the top echelon of atheists, the Darwin clan, themselves, and embraced by all 1920’s socialists on both sides of the Atlantic.
http://en.wikipedia.org/wiki/Thule_society
@jeremyp99
I checked your blog to see your figures and charts…very interesting compilation of data. I was wondering how the northern hemisphere was trending in temperatures in isolation from the rest of the world. It is the northern hemisphere that has to be watched because when the next glaciation episode comes, that is where the continental ice sheets will form.
Thanks for letting us see your work.
Bob, your reply to me doesn’t really address the points I was making. I could reply to each individual statement, but that would likely be viewed as threadbombing. Just a couple examples:
Brian says: “Also, Bob largely ignores the ocean from 700-2000m, which is where Dana says heat is increasing most. Bob dodges the point by saying that people can’t understand Joules.”
Bob Says: “Obviously, you’ve overlooked Figures 3, 4 and 8 which all include ocean heat content or depth-averaged temperatures to 2000 meters.” and “In reality, Brian, I presented the warming of the oceans in my Figure 8 in degrees C to show that the supposed continued warming of the oceans at depths of 700-2000 meters is worthless metric.”
Your discussions of figures 3-4 revolved around decreases in 0-700m and near-flat trends in 0-2000m, and only the Atlantic. If you are going to rebut Dana’s claim of warming in 700-2000m, then you need to concentrate on that data over the global oceans.
As to your second point, you start with “in reality” and then basically restate my original complaint. I know that you presented warming in degrees C instead of Joules. Immediately beforehand you stated that Zettajoules are “meaningless to most people”. That doesn’t mean you can argue it away by converting the units.
I believe you are stringing together a bunch of red herring arguments that are true on their own, but don’t directly tackle Nuccitelli’s article.
Repeated here on WUWT is a comment I made on Climate Audit in response to a remark made by Craig Loehle on Steve McIntyre’s “Fixing the Facts 2” thread concerning the width of the IPCC/AR5 expanded modeling envelope:
Coming from the “one picture is worth a million words” department, I thought it might be a useful exercise in the visual interpretation of graphical information to combine IPCC/AR5 Figure 1.4 with the Hadley Center’s graph of Central England Temperature (CET), 1772-2013, placing both graphics onto one common page.
This exercise is yet another phase in my ongoing efforts to expand my “CET is Anything and Everything” climate science paradigm into uncharted visual communications territory.
A major characteristic of the CET-is-Anything-and-Everything paradigm is the assumption that pre-2007 rates of temperature change in the CET historical record can be used as rough predictive indicators for post-2007 GMST rates of change — at least to the extent of stating that similar rates of change have been experienced within the past 240 years which cover similar (or longer) time frames as does the AR5 2013-2035 predictive time frame of twenty-five to thirty years.
Here it is: AR5 Figure 1.4 and CET 1772-2013
The illustration has two major graphical elements:
-> The first major graphical element, located in the upper-left quarter section of the illustration, displays an adaptation of IPCC AR5 Figure 1.4 which highlights the boundaries of the “AR5 Expanded Modeling Envelope”; i.e. that section of the original Figure 1.4 which illustrates the observation validation zone between the year 2001 and the year 2035 of past IPCC model runs. Overlain on the Figure 1.4 adaptation is a series of seven temperature rate-of-change trend lines spaced in 0.1 degree increments, each of which begins in the year 2007, and each of which also has a historical precedent in the Central England Temperature record.
-> The second major graphical element, which is shaded in light gray and which covers approximately three-quarters of the illustration, documents the method which was used to visually fit the approximate slopes of the seven CET temperature trends occurring between 1772 and 1975 which are being used as the historical CET precedents. A third graphic illustrating Global Mean Temperature between 1850 and 2008 is also included for visual reference and comparison. The original source graphics for CET and for GMT are from the Hadley Center. Their respective x and y axis scales have both been modified to be proportionately similar to AR5 Figure 1.4′s x and y axis scales.
Let’s remark here that the Central England Temperature record is the only instrumental record we have that goes back as far as it does; and that its recent temperature trends are approximately reflective of recent global temperature trends.
Concerning the derivation of my own graphical adaptations of the IPCC and Hadley Center source graphics, the process by which the slopes of historical CET trend lines were determined is readily evident from direct examination of the illustration, without any further explanation other than to clarify that all fitting of trend slopes was done by visually placing each linearized trend line onto the original HadCET source plot wherever it was appropriate in the CET record for the particular decadal rate of change being fitted: -0.1C, -0.03C, +.03C, +0.1C, +0.2C, +0.3C, or +0.4C
Several points become immediately evident from a casual look at this one-page graphical illustration:
(1) GMST could fall at a rate of -0.03 C per decade between 2007 and 2021 and still remain inside the AR5 model validation envelope.
(2) GMST could stay flat between 2007 and 2028 — i.e., have a trend of 0 C per decade for a period of 21 years — and still remain inside the AR5 model validation envelope.
(3) A small upward trend of +0.03 C per decade is the approximate rate of change in CET for the period of 1772 through 2007, a period of 235 years. GMST could rise with that same small upward trend of +0.03 C per decade for another 28 years beyond 2007 and still remain inside the AR5 model validation envelope.
(4) For the timeframe covering the period between 2007 and 2035, GMST could experience a rising temperature trend of anywhere from +0.03 per decade on up to +0.4 C per decade, while still remaining within the scope of past historical precedents documented in the Central England Temperature record for similar periods of time.
(5) Rates of CET temperature change which covered time periods of at least twenty-five years, and which ranged from a low of -0.1 C per decade on up to a high of +0.4 C per decade, occurred at pre-industrial levels of CO2.
What does it all mean?
It means we have seen it all before, and we will probably see it all again; i.e., there is nothing new under the sun.
All up now, in quadruplicate – Anthony
Henry says
I was just checking up how you did it.
SkepticGoneWild says:
October 18, 2013 at 8:54 am
“To make reference to the energy of the bomb that killed and maimed thousands of people and relate it to ocean heat content is sick.”
I agree. They also have no problem equating their opponents with Holocaust deniers. These are sick puppies.
jim says
Imagine if these guys, these characters were in power (political power, elected and appointed positions and even in various civil service positions throughout government bureaus) … do you suppose they and their fellow travelers would still have the same mindset and keep “close records” of those showing the least signs of opposing them for their views?
I shudder at the thought.
DirkH says
And of course the entirely anti-Christian Eugenicism; invented by the top echelon of atheists, the Darwin clan, themselves, and embraced by all 1920′s socialists on both sides of the Atlantic.
henry says
yes, that ship with Eugenicism was also exported to the USA and South Africa where it became know as segregation and apartheid, respectively. What a (spiritual) battle we had with that…..
And…we know it is going to happen again; it is what the book of Revelations is all about, is it not?
This time it will be global. Only one religion will be allowed.
An interesting aspect maybe that Hitler came to power at the height of the cooling period, 1935-1945 when food prices rose due to scarcity.
A similar situation will of course arise again due to global cooling from 2024-2034
I’m still waiting for somebody to explain to me how heat is supposed to be getting into the deep ocean (where conveniently we have few thermometers) without passing through the shallower layers that we do monitor closely. My understanding of thermodynamics must be flawed.
Might I add to my previous comment that there is ample evidence in Revelations that the next anti-christ will in fact be a woman and not a man.
Everyone will also be linked with a device (Rev. 13:15)
Perhaps Dana with realize the death of the AGW hypothesis when something like this happens:
https://i.chzbgr.com/maxW500/3045027328/h1585F40B/
Surely, as the ocean has so much more heat capacity than the air (1000 times or so?), if there were any temperature changes over the last decade in the ocean due to GHG, they would be far too small to measure.
Indeed, Professor Ted Shepherd at Reading University admitted
The heat is still coming in, but it appears to have gone into the deep ocean and, frustratingly, we do not have the instruments to measure there,”
So any claims that this is measurable cannot be taken seriously.
@Henry P:
1) Are you aware that both of your screen names link to “Hour of Power-SA”?
2) Are you aware that the actual Book of the Bible is titled “Revelation”, not “RevelationS”?
They are looking in the ocean’s as the expected warming in the Troposphere has never materialised. Getting desperate….what is more the less than expected heat from CO2 is merely the real world backing up the principle that CO2’s ability to create heat iis logarithmic and is having less of an effect than previous…they just can’t admit it. There is no pause and if the solar physicists are correct it is going to get an awful lot colder in the coming decades but don’t hold your breat that the AGW will admit anything.
Of course the oceans are cooling – that’s where the extra heat is coming from that stops the atmospheric cooling that should be happening now – just a ‘pause’, when we should be having ‘statistically significant rapid cooling’
HenryP,
The text in Revelation (singular) (c. 60AD) states that the coming world leader will cause all, both small and great, to receive a mark in the right hand or the forehead, and that without it, no one will be able to buy or sell.
Obamacare contains provisions for an implantable data chip, the RFID. The RFID will allow instantaneous access to the Obamacare Data Hub. The Obamacare Data Hub contains files on every American from the following state and federal agencies: “It links the Department of Health and Human Services (HHS) with seven other federal agencies: the Social Security Administration, the Internal Revenue Service, the Department of Homeland Security, the Veterans Administration, the Office of Personnel Management, the Department of Defense, and even the Peace Corps. It will contain such personal information as Social Security numbers, income, family size, citizenship and immigration status, incarceration status, and health coverage status. And it will be connected to some state agencies.”
Access to these personal files of the Obamacare data hub is granted to “navigators.” These are not neutral groups. ““The rules allow navigators to come from the ranks of unions, health providers and community action groups such as ACORN and Planned Parenthood,” reported the Examiner. ”
Obamacare is enforceable through the IRS, and is compulsory. Some states have passed resolutions protecting their citizens from being forced to receive any implantable devices. It was a travesty and a miscarriage of justice that Chief Justice John Roberts ruled Obamacare to be constitutional.
Nuccitelli: ”In terms of the threat from long-term global warming and climate change, it really doesn’t mean anything.
Bullcr@p! It did back before they needed an excuse for still being alarmed without surface warming:
http://globalchange.mit.edu/files/document/MITJPSPGC_Rpt11.pdf
“ One major uncertainty affecting possible climate change that has not received enough attention is the uncertainty in heat uptake by the deep ocean.”
“According to our results, when climate sensitivity is high, even a small change in the rate of heat uptake causes a significant difference in the predicted surface temperature increase. In the simulation with DTeq = 4.5 C and K = 0 cm2s-1 the surface temperature increase for years 91 to 100 of the integration, DT91-100, is 6.2 C. For heat diffusion with K = 0.5 cm2s-1, DT91-100 is 4.6 C. “
(DTeq = equilibrium sensitivity; K = diffusion coefficient)
The faster heat moves into the deep ocean the longer it takes to reach “equilibrium sensitivity”. The longer it takes to reach equilibrium sensitivity the longer ecosystems/civilizations have to adapt. Even if the equilibrium sensitivity is high (cough, cough) the “effective sensitivity” is reduced by deep ocean heat uptake, taking much of the wind out of the alarmists sails.
What does such deep ocean heat uptake do to effective sensitivity if the equilibrium sensitivity (assuming there is such a value) is low to midline of the official IPCC range?
Bottom line: thanks in part to the massive heat capacity of the deep ocean, climate change may cause us some inconveniences but it’s nothing that should keep you awake at night.
@geran
1) yes, perhaps I hope that people will watch the Hour of Power? (should be possible anywhere in the world)
2) sorry about that, my home language is not English
The heat energy is coming FROM the atmosphere. It goes into the land, the oceans, the ice FROM the atmosphere. If the atmosphere does not heat up first, it cannot be responsible for heating the rest of the planet.
This is not true IF you look at a phase change situation vis-a-vis ice melting or sublimating. However, you still need an energy differential between the two. The air has to STAY warm to melt ice it is above, and if the air temperature is stable above, say, Greenland’s ice, then there is no evidence that CO2 (or anything else) is actually changing anything: you would have to argue that WITHOUT CO2 the air would now be colder.
The final argument for the IPCC narrative will be that the Earth is in a natural cooling state, and without the terrible CO2 effect, we would be roasting. So we just have a little repreive, time to get off fossil fuel. But since we are such quarter-to-quarter thinkers (otherwise the stock market would fundamentally judge corporations on shorter or longer periods of time), CAGW will truly die if they try that final approach.
We need a cold winter and summer of 2014.
Regarding eugenics, population control, and the violation of religious freedom and conscience, Obamacare is so far losing court battles:
“This week, yet another district court halted the Obama Administration from forcing its anti-conscience mandate to provide coverage for abortifacients and contraceptives on unwilling employers. Many employers—religious, secular, nonprofit, and for-profit—believe it violates the free exercise of their faith to comply with this mandate.
This decision brings the scorecard of for-profit cases to 29–5, strongly favoring the free exercise of religion.
The plaintiff in this case is Cherry Creek Mortgage, a family-run home loan provider with 730 employees operated by evangelical Christians according to their faith. Cherry Creek sued the government in March 2013, arguing that the anti-conscience mandate violates the Religious Freedom Restoration Act (RFRA) and the First Amendment guarantee of the free exercise of religion.”
Hobby Lobby has also been fighting an expensive court battle to be exempt from Obamacare mandates for morning after pills, etc. Public funding for abortions is also possible under Obamacare. Even if you are not religious, it should alarm you that the law now puts all of the tools of eugenics/population control into the hands of a vast oversized government.
Why do you only present ocean data from the Northern hemisphere/
Brian says (twice): Also, Bob largely ignores the ocean from 700-2000m, which is where Dana says heat is increasing most.
Mark Buehn says: I’m still waiting for somebody to explain to me how heat is supposed to be getting into the deep ocean (where conveniently we have few thermometers) without passing through the shallower layers that we do monitor closely.
There is a simple, logical answer to that, not that that makes it correct: the extra heat from 700-2000m has come from _below_. That way it didn’t have to sneak past the 0-700m layer without being noticed. And then of course it couldn’t be due to atmospheric CO2!
Prove my hypothesis wrong!
Rich.
There is only one significant driver of the average global temperature trend since 1610. It is disclosed at http://conenssti.blogspot.com/
After about 1895, accurate temperature measurements were made world wide and revealed the natural oscillations above and below the sunspot-number-time-integral-trajectory. The oscillations are caused by the net effect of ocean cycles (which are dominated by the PDO). The resulting graph and physics-based equation that accurately (R2=0.9) calculates the measured anomaly trend are shown at http://climatechange90.blogspot.com/2013/05/natural-climate-change-has-been.html
If, somehow, ocean temperatures were increasing, the atmosphere above it should also rise. After all, we see exactly that with El Ninos.
But RSS numbers tell the opposite story.They show a small, but falling trend for the Lower Troposphere over oceans.
http://notalotofpeopleknowthat.wordpress.com/2013/09/24/mummy-the-oceans-eaten-my-heat/
I left the following comment on the Guardian blog. Dana responded that his analysis was correct, but wouldn’t address the actual question, even after he was challenged again. After a few volleys with him and a couple of supporters, comments were suddenly closed, and this comment and all responses disappeared without a trace. Now we all know the ocean heat content data is very suspect, but if the data is correct, then the IPCC has gone a long way toward disproving AGW, and proving Svensmark’s cosmic ray theory. What they are suggesting is the equivalent of saying that you can fry an egg without the pan heating up. It is nonsensical. Dana specifically stated that enough heat has gone into the oceans to heat the atmosphere 60 degrees F. Yet, he would have you believe it has passed through the atmosphere without leaving a trace. This is impossible.
The comment on Dana’s blog post:
There are several obvious problem’s with Dana’s analysis. First, warming due to the increase of atmospheric CO2 has no mechanism to warm the oceans directly without first warming the atmosphere, which then in turn heats the oceans. There is simply no way for all the heat that is alleged to be accumulating in the oceans to simply pass through the atmosphere without warming it. This theory has no credibility whatsoever without an explanation of how and why this is happening.
If on the other hand, the oceans are warming but the atmosphere is not, then we have a very good explanation for it that does not involve AGW. Svensmark’s cosmic ray theory of global warming, recently confirmed experimentally again, postulates just that: warming of the oceans without warming of the atmosphere.
http://www.dtu.dk/english/News/Nyhed?id={ABB2F1B4-F5F7-4452-BB39-9818EA7CB8F9}
Brian says:
October 18, 2013 at 9:30 am
…
I believe you are stringing together a bunch of red herring arguments that are true on their own, but don’t directly tackle Nuccitelli’s article.
SO if your concerns were merely a matter of faith, why didn’t you say so? Bob was talking data.
Brian says, “Bob, your reply to me doesn’t really address the points I was making.”
Actually my reply to you addresses all of the points you tried (and failed) to make. The fact that you can’t grasp them all is telling.
Brian, no one here can hope to find your comments credible when they contain such obvious falsehoods. You wrote in your second comment on this thread, “Your discussions of figures 3-4 revolved around decreases in 0-700m and near-flat trends in 0-2000m, and only the Atlantic.”
That’s as far as anyone needs to read, Brian. You refer to my Figures 3 and 4 in your comment. Figure 3 presents OHC (0-700 meters and 0-2000 meters) for the North Atlantic and Figure 4 presents OHC for the North Pacific, same depths. And then you state that my presentation is for “only the Atlantic”. Your falsehoods are so obvious they’re laughable.
You’re wasting your time here, Brian, and mine. If this is your first attempt at being a troll, you need to find something else to do. You make a terrible troll.
Adios.
Nuttifruiticelli is well, nutty. Science is not his venue, hype fear and twisted propaganda is.
Dingo and a few others;
Why? Is nuttifruiticelli peer reviewed? Which peer reviewed article did the atomic blast statement come from?
Can you say ‘cherry picked’ and ‘slanted’?
Get a life!
Good article and good catch of the fruitnut salad waste of time.
Bob gave me a link to all the oceanic currents at the surface and below that transport “rivers of water” from one area of the globe to another. These currents sometimes are at the surface only to dive again somewhere else.
Thinking out loud: Given the interwoven complexity of currents at and below sea level, it stands to reason that a warmed pool of water could show up in a particular area of the ocean from the side instead of from above, giving the impression that the below sea level area has warmed where it sits somewhat magically, especially when a time series clearly shows that warmth did not descend from above.
It stands to reason then to question warming at any depth. Did it warm through direct SWIR? LWIR? Wave induced surface mixing? Or did it ride there on a below sea level river? And which one of these sources of below sea level warming is a direct result of LWIR heating due to anthropogenic CO2 in the air above sea level?
Oops, I forgot your closing.
Brian says: “I believe you are stringing together a bunch of red herring arguments that are true on their own, but don’t directly tackle Nuccitelli’s article.”
I quoted Nuccitelli’s article 4 times. The quotes were not taken out of context. There were no distractions or misdirection on my part. My arguments addressed each of those quotes. Therefore, they are not red herrings as you describe.
Curiously, you’re doing what you’re accusing me of doing. And it’s blatantly obvious to everyone reading this thread. It’s a nice debate strategy…until someone (like me) calls it to everyone’s attention.
Have a nice day.
Brian, if you’re using the comments on the SkepticalScience cross post of Nuccitelli article as the source for your comments…
http://www.skepticalscience.com/does-global-warming-pause-mean-what-you-think.html#commenthead
…and it appears you might be, you need to find a better source.
Gareth Phillips says: “Dana N. sets out his rationale on Skeptical Science, http://www.skepticalscience.com/does-global-warming-pause-mean-what-you-think.html I’ll also link Bobs response on that site. I’d be very interested to see Dana’s response to Bobs analysis of the situation.”
Gareth, Dana’s “rationale”, as you put it, was simply a cross post of the article from the Guardian. But you did get a reply out of him:
http://www.skepticalscience.com/does-global-warming-pause-mean-what-you-think.html#99013
Dana wrote, “As usual Tisdsale is still focusing on surface temperatures and ignoring ocean temperatures.”
Hmm. Dana overlooked Figures 3, 4 and 8 just like Brian did on thus thread,
Dana wrote, “He does have a valid point that 0-700m ocean warming has slowed a bit, but only because 700-2000m ocean warming has accelerated.”
And as I showed in my Figure 8, ocean heat content at depths of 700-2000 meters is a useless metric. If the oceans below 700 meters are continuing to warm (big if), the rise in temperature is so small it’s meaningless.
Dana wrote, “He’s guilty of the same type of cherry picking I discussed above, just regarding surface ocean temps in addition to surface air temps.”
There was no cherry picking on my part in my presentations of satellite-enhanced sea surface temperature data versus models. The Reynolds OI.v2 dataset starts in November 1981 and so does my graph in Figure 6. The start year of 1990 in my Figure 7 was chosen by Nuccitelli, not me.
Bottom line, Gareth: Dana has to rely on untruths, falsehoods, fabrications, misrepresentations, however you’d like to characterize his statement. That’s not unusual coming from global warming enthusiasts.
Regards
“Bob Tisdale says:
October 18, 2013 at 1:53 pm
Brian, if you’re using the comments on the SkepticalScience cross post of Nuccitelli article as the source for your comments…you need to find a better source.”
I would say anyone using SkS As a source needs to find a better source, unless they are using it as a source of “ShonKy Science”.
🙂
Nuccitelli is a propagandist. He does not understand the topic beyond what can be used for screams.
Here’s the problem with Nutter-telli’s explanation:
The argument goes 17 years of no warming is too small a time frame to identify a trend (first it was 5 years, then 10, then 15 etc . . .), and the warming did actually occur, but has been hidden in the ocean.
The problem with this argument is that ARGO has only been around since 2000, and before that ocean temp data was spotty at best. Therefore only 13 years of reliable data are available, which is of course to short of a time frame to detect a trend.
So, if you are claiming the 17 year “pause” is not long enough, than 13 years is certainly not. And by logic, you can not say the oceans are warming, or cooling, or staying the same.
Joe says: “Why do you only present ocean data from the Northern hemisphere”
I assume you’re referring to Figures 3 and 4, Joe. First a note: The start year of that graph is dictated by the NODC. They only present the annual ocean heat content data from the depths of 0-2000 meters starting in 2005, which is when the ARGO floats had complete coverage of the global oceans. See the NODC data webpage here:
http://data.nodc.noaa.gov/woa/DATA_ANALYSIS/3M_HEAT_CONTENT/DATA/basin/yearly/h22-w0-2000m.dat
During the ARGO era, the North Atlantic and North Pacific show little to no warming at depths of 0-700 meters and 0-2000 meters. That indicates any warming of the global oceans at those depths must be happening in the Southern Hemisphere oceans. The global warming enthusiasts can’t claim the warming in the Southern Hemisphere oceans is caused by manmade greenhouse gases without explaining why those same manmade greenhouse gases aren’t warming the Northern Hemisphere oceans.
That’s been one of my primary messages at my blog and here at WUWT. Global data is a lousy metric to use to portray global warming, because when the data is broken down into logical subsets, it reveals things that aren’t apparent in the global data.
Bob, I’m not sure you know what a red herring is. You seem to think you rebutted an article by picking out 4 quotes but dodging the main points. And once again you picked out incorrect statements in my complaints (yes, I should have said northern hemisphere and not Atlantic) without addressing the main point. It’s hard to find a better example of a red herring.
Your response to Joe does more to address Nuccitelli than your entire blog post, since it directly deals with heat content of the deep global oceans. The fact remains that you do not discuss that topic in your post. And no, saying that people do not understand joules is not a discussion.
I do not read skeptical science. I read the article you linked to at the Guardian. Nor am I a troll, just someone who uses logic. Do you think anyone who raises complaints is a troll? I’m simply pointing out logical fallacies. I don’t disagree with your arguments in a vacuum, but to claim that they make AGW dead is a bit extreme, and to say that they discredit Nuccitelli is even more so.
Just getting curious about the kiloton analogy, I fired up Excel and looked for a handy reference for the total solar irradiance, which I found at
http://lasp.colorado.edu/lisird/sorce/sorce_tsi/
It looks like the TSI varies a bit over long and short times, around 1361 W/m2 with short term (few days or weeks or so) variations from 0.5 to 1 W/m2. Well, if the earth radius is taken to be about 6371 km, then just doing pi r2 gets (for the 1 W/m2 number) about 1.3e14 W/m2, which is about 1.3e14 J/s. Now a Joule is about 2.4e-13 KT so our 1 J/s over the earth is about 30 KT or about 2 Hiroshima yields per second. Per day that works out to about 2.36e6 KT per day or 175,000 Hiroshima yields per day. And that is just the variation amplitude. The total TSI is 1361 times that, or about 239e6 Hiroshima yields. Maybe a more meaningful idea of the daily dose (from 1361 W/m2) is in terms of total nuclear weapon yield. The global stockpile is kind of a guarded number but arms control guys guess about 17,325 in 2012. (See e.g. http://armscontrolcenter.org/issues/nuclearweapons/articles/fact_sheet_global_nuclear_weapons_inventories_in_2012/) The yields vary but guessing about 100KT per warhead, gives a total world nuclear stockpile yield around 1.73e6 KT. So every day the mean old sun hits us with about 2.36/1.73 or about 1.5 times the sockeroo as if the whole world fought global thermonuclear war against each other. There is always a chance I made a math error, but I think its about right.
Sometimes people forget how big the world and the sun and the universe actually are.
Interesting stuff, FAH. Always nice to put things in perspective. Thanks for sharing.
“Dana Nuccitelli Can’t Come to Terms with the Death of the AGW Hypothesis……”
And neither can the L.A. Times….
http://www.foxnews.com/science/2013/10/18/la-times-bans-letters-from-climate-skeptics/?intcmp=latestnews
It’s apparent to me that the concept in psychology known as cognitive dissonance is beginning to kick in here. The CAGW belief is being increasingly questioned with scientific evidence that cannot be easily explained away. The believers however are so emotionally attached to the CAGW belief system and so heavily vested in it that they cannot easily give up on it or let go of it. Thus, they have no choice but to simply block out or censor all the contrary evidence. Either that or increasingly use lies and other forms of deceit in a vain attempt to discredit the contrary evidence.
When elements of the mainstream media start resorting to the kind of behavior that the L.A. Times and The Guardian have chosen to practice, they begin abandoning not just the standards and ethics of journalism that they should be upholding but also the free exchange of ideas that underpins the very concept of free speech itself. Thus, they detach themselves not just from reality, but also from the principles that democracies are supposed to have been founded on and still stand for today.
The Guardian, Dana Nuccitelli, the L.A. Times, and all the others all increasingly having the same problem that involves the growing divide between their AGW religion and reality. As time goes by, Mother Nature will quite possibly make things even worse for them all. Watching them struggle with this will become increasingly interesting to watch.
Bob I’m banned from skeptical science so can’t argue the point with them. I wonder if you would address a few. Much is made of the fact that you make no mention of the Indian Ocean. Why was that? It is also said that you concentrate on intervals of time, 2005 -013 for ocean temperatures and 2000-2013 for air temperatures, that are too short to be statistically viable. That you look at small regions of the oceans rather than the globe as a whole and dismiss the satellite observations of temperature. I hope you are able to find time to respond
JohnWho says:
October 18, 2013 at 2:23 pm
I would say anyone using SkS As a source needs to find a better source, unless they are using it as a source of “ShonKy Science”.
——————————————————–
Ummm, would you believe North Carolina State University uses SkA as a serious Climate Education resource,..the clones wars are coming when they all graduate..
http://www.nc-climate.ncsu.edu/edu/k12/node/1430
Brian, without any sense of reality, you wrote, “Your response to Joe does more to address Nuccitelli than your entire blog post, since it directly deals with heat content of the deep global oceans. The fact remains that you do not discuss that topic in your post.”
Brian, what part of the data for the depths of 700 to 2000 meters didn’t you understand? Look again at the discussions of Figure 3, 4 and 8, and in the linked posts where they originated.
Once again you’ve been caught in a blatant fabrication.
Each time you commented on this thread you’ve misrepresented what was presented in my post. You have no credibility here, Brian. You’ve thrown it away. No one here helped you destroy your credibility. You did it all on your own.
Brian says: “Do you think anyone who raises complaints is a troll?”
With bloggers like you, Brian, I don’t have to think too hard about that subject. Someone like you, Brian, who repeatedly fabricates, misdirects, misleads, and misinforms presents themselves as a troll. I’m not sure why you have so much difficulty understanding that.
Your debate tactics are laughable.
Good-bye, Brian. I’m tired of playing whatever game you’re trying to play.
It’s easy, Bob. You have no figure that deals with heat content of the global oceans. Figures 3 and 4 are not global. Figure 8 is not heat content. I am being as direct as possible. Until you address this point, you are the one playing games.
the only issue i have here is in one of your replies you state complete coverage for argo bouys for the global oceans.argo bouys hgave no where near complete coverage of any ocean,never mind global oceans,and the entire data set for ocean temperatures is so sparse as to be virtually meaningless,so clowns like trenberth and offhisnuticelli do not have a leg to stand on in terms of claiming the heat has entered the deep oceans.
as to whether nucitelli is ignorant or disingenous,i personally think he is an arrogant,ignorant arsehole,along with the rest of the crowd on sks. i would pay good money for 5 mins alone in a room with him.
“””””……As the IPCC figure indicates, over 90 percent of global warming goes into heating the oceans, and it continues at a rapid pace, equivalent to 4 Hiroshima atomic bomb detonations per second……””””””
So please set us straight on this new SI unit of “heating” (AKA solar radiant energy wastage).
The total global TSI IS 1362 w/m^2 x [(360 x 60 x 1852 / pi)^2 x pi/4 ] m^2=173,443 TeraWatts , so how many Hiroshimas per nanosecond izzat ??
“””””……HenryP says:
October 18, 2013 at 10:24 am
Might I add to my previous comment that there is ample evidence in Revelations that the next anti-christ will in fact be a woman and not a man.
Everyone will also be linked with a device (Rev. 13:15)……”””””
Nancy Pelosi, or Hillary(named before Sir Edmund) Clinton. ??
Ben D says:
October 18, 2013 at 4:51 pm
JohnWho says:
October 18, 2013 at 2:23 pm
I would say anyone using SkS As a source needs to find a better source, unless they are using it as a source of “ShonKy Science”.
——————————————————–
Ummm, would you believe North Carolina State University uses SkA as a serious Climate Education resource,..the clones wars are coming when they all graduate..
http://www.nc-climate.ncsu.edu/edu/k12/node/1430
I used to live in NC, Ben. Folks there weren’t that, uh, lacking in IQ then. Maybe when I left the collective IQ dropped?
Dunno.
Brian says:
October 18, 2013 at 5:19 pm
———————————————-
Here’s a chart you can think about for awhile. (I have this in about 10 different depictions if you want).
http://s17.postimg.org/4ts1blb4v/2013_Missing_Energy.png
Brian says: “It’s easy, Bob. You have no figure that deals with heat content of the global oceans.”
Your complaints have now reached comedic levels, Brian.
Obviously, you’ve overlooked something once again. Scroll back up to the top of the post. Do you see Figure 1? What do the two blue curves present, Brian?
I then subdivided the data for Figures 3 and 4 into the North Atlantic and North Pacific and presented it for the period when annual data are available at both depth ranges. Then, in Figure 8, I presented the data for the global oceans in terms that people are familiar with, deg C. It’s really pretty easy to understand what I’ve done.
I’m beginning to believe that you, Brian, have no grasp of the subject matter. In fact, reading through your comments again, it’s pretty obvious you have a very limited understanding of what was discussed in this post. And to cover for your lack of understanding, you fabricate, misdirect, mislead, and misinform.
Most visitors who are new to the subjects being discussed here ask questions and try to learn the subject matter before they even consider arguing. You’re an exception. And as that exception, you’re being rude…and, to tell you the truth, very boring. Basically, Brian, all of your comments on this thread have been a complete waste of time for me, because I chose to respond to you instead of ignoring you, and a waste of time for all those who read them.
Good-bye, once again, Brian. Next time, try a new tack. Ask questions instead of arguing.
Would the Guardian newspaper be aware that one of its columnists is not revealing correspondence from the public?
A reputable paper like the Guardian would have data storage, retrieval and monitoring systems on all correspondence for legal reasons. It would also have a small team appraised to review the correspondence it receives and publishes or hides. This data would be collated and presented to the people who employ Dana so someone more senior above him would be aware that he is deliberately not publishing or acknowledging the correspondence coming in. The Guardian has a proud tradition of unbiased reporting and reporting all viewpoints. They support and respond to the Press Code within the rules.
Perhaps if some of our British colleagues inquired of the right people at the newspaper, or the Press Council or the Times a more non partisan presentation could appear.
This ought to tweak Nuccitelli a little bit more. This post at WUWT is in the top ten most-viewed WordPress blog posts today.
http://bobtisdale.files.wordpress.com/2013/10/wordpress-top-ten.png
Bob, I’m not misinforming anyone. Figure 1 is not your figure, Bob, and you don’t say anything about the deep ocean when discussing it. Your heat content charts (3&4) do not encompass the global oceans, Bob. Degrees C is not the same as heat content. These are facts, Bob.
Constant flux: what matters is the direction of heat flow between the layers. The heat content of a layer could remain exactly the same, and if the direction the heat flows changes then the layer above or below gets warmer/cooler.
When you put a blanket over yourself in a sealed room, the blanket heats up quickly, and remains at pretty much the same temperature while the rest of the room heats up more slowly. The rest of the room is the deeper oceans, the blanket is the surface layer, and your body is the heat source. After the blanket has warmed to equilibrium with your body, you can measure the temperature of the room getting warmer, but the blanket remains pretty much the same temperature.
Not an exact analogy, but should be an intuitive way to understand the physics.
Or, imagine a tennis canon with two nozzles. Ten balls are dropped into the hopper (which holds a hundred) every ten seconds. Both nozzles shoot ten 5 balls every 10 seconds. The number of the balls in the hopper remains the same. The system is in equilibrium. Program the machine to shoot 8 balls/10 seconds from one nozzle, and 2 balls/10 seconds out the other. The number of balls remains the same, even though one side of the court is ‘taking the heat’ more than the other. We see no change in the number of balls going every ten seconds, just the direction in which they are flying.
The deep oceans were getting 5 balls/10 seconds, now they’re getting 8. It’s physically possible for this to happen regardless how fast the hopper (0 – 700 meters) is replenished.
You can also see how the 0 – 700 meter layer could get colder while the deeper oceans heat up. The deeper oceans could draw heat from the upper layer faster than they warm. I imagine that if the system was not warming overall, that this is likely what we’d see if there are multi-decadal patterns that function like ENSO. Over the long-term, these would cancel out. Ocean processes can’t add or subtract energy from the whole system, just shift it around.
Think of flow, not discrete packages of heat, then you’ll get it.
I suggest Dana nooky baby check out the Kubler Ross model for the five stages of grief.
The oceans have a much higher heat capacity than the atmosphere. If Bob is implying it takes the same amount of heat to warm a swimming pool by 1C as it does to raise the temperature of a glass of water by 1C, then this is obviously wrong.
Brian… http://s17.postimg.org/4ts1blb4v/2013_Missing_Energy.png
Se the left hand graph. It shows atmosphere and ocean warming. (Note, the ocean warming is highly speculative and well within any error bars.) This means statistically meaningless, there is no missing heat from a scientific standpoint, it is simply a hypothesis without evidence.
Now see the right hand graph. This is the projected warming by the IPCC. Bob’s post also explained this, but you missed it. See Brian, CAGW, and AGW are DOA. Neither hurricanes, tornados, SL, polar ice, or extreme storms are on the increase. This is what the science says.
Anthony fell for the old bait and switch. Global warming is and always has been about temperature. Nutticelli fails basic physics. Temperature is NOT equal to heat. There is NOT even a linear correlation. You allow him to use a graph of heat to talk about the pause in temperature. Produce a graph of temperature change instead of heat since he clearly states it is about pause in temperature!
Sorry bob not Anthony.
“a play off a line by Inigo Montoya from”
Since we speak of ” a play on words”, should that not be “a play on a line”?
http://www.skepticalscience.com/does-global-warming-pause-mean-what-you-think.html#99013
dana1981 at 00:27 AM on 19 October, 2013
As usual Tisdsale is still focusing on surface temperatures and ignoring ocean temperatures. He does have a valid point that 0-700m ocean warming has slowed a bit, but only because 700-2000m ocean warming has accelerated. He’s guilty of the same type of cherry picking I discussed above, just regarding surface ocean temps in addition to surface air temps.
Dana Nuccitelli says you IGNORED ocean temperatures, but then agrees with your point about ocean warming and then that you cherry picked surface ocean temps. You obviously didn’t ignore them. How can anybody take him seriously with such doubletalk.
I suspect that Bob and Dana are saying the same thing really. The oceans are just an oscillating damping mechanism for temperature. Dana, being the anthropowarmist he is thinks the heat will just jump out of the oceans and burn us all one day. Bob sees that the natural ebb and flow of heat in the oceans is just that, natural and obviously beneficial to the stability of global climate.
It doesn’t matter what Dana tries to scare us all with the actualite´ as we experience and measure it is not scary at all.
Thanks Bob.
barry:
I write to point out that you are failing to think things through. If – as you assert – heat is accumulating in the ocean then it cannot induce discernible global warming.
I am ignoring the simple fact that you and Nuccitelli are ‘moving the goal posts’: global warming was always about rising surface temperature and NOT ocean heat content until the surface temperature stopped rising.
At Octobe r 18, 2013 at 9:08 pm you write
No, Barry, Bob is implying no such thing. He is saying only some of the oceans have been measured for temperature so those sampled zones are the only convenience sample we have. We can infer that if the measured regions show no discernible temperature rise then the other ocean regions show similar lack of temperature rise.
And because the deep ocean is all sea water then, yes, we can use temperature as a direct indicator of “heat content” and we can convert between the two.
Importantly, the total deep oceans contain about 1,200 times as much heat as the total atmosphere for the same temperature rise. Therefore, if the heat which would have raised the atmosphere by 1.0°C goes into the ocean then that would raise the ocean temperature by 0.0010°C.
And the air is warmer than the oceans so release of that heat from the ocean would be very slow. And by very slow I mean thousands of years.
Now, Barry, please try to think how an increase of ocean temperature by a thousandth of a degree C can be a discernible problem of any kind. Indeed, how an increase of ocean temperature by six thousandths of a degree C a discernible problem of any kind? Please think about it.
If the air temperature is not rising because the heat is going into the oceans then there is no possibility of that heat causing problematic global warming.
Richard
barry says: “The oceans have a much higher heat capacity than the atmosphere. If Bob is implying it takes the same amount of heat to warm a swimming pool by 1C as it does to raise the temperature of a glass of water by 1C, then this is obviously wrong.”
Please advise where, in anything that I’ve written at anytime, that suggested, inferred or implied that “it takes the same amount of heat to warm a swimming pool by 1C as it does to raise the temperature of a glass of water by 1C…” I haven’t, so it must be you who is making this leap in illogic.
ironargonaut says: “[Bob] fell for the old bait and switch.”
The global warming enthusiasts have been moving the goal posts for years.
Thanks Bob,
Figure 1 says it all 0.6 +/- 17
So the supposed imbalance is 25 times smaller than the error in the measurement
As I pointed out on Dana’s blog it is physically impossible for the energy in to the earth from the sun to be different to the energy out, except on very short timescales.
If the deep oceans are “sequestering” heat, that’s better than sequestering CO2. Problem solved!
Does anyone actually think that the scripts of Dana Nuccitelli for his PR pieces, like in the Guardian, are actually prepared by him?
His ghost writing team is the same usual group of ideology biased CAGW activists within the science community and in the blogosphere.
John
John Whitman:
re your post at October 19, 2013 at 4:45 am
And your evidence is?
Richard
A second day that Nuccitelli won’t be happy. This post is still in WordPress’s Top 10:
http://bobtisdale.files.wordpress.com/2013/10/wordpress-top-ten-day-2.png
Oh, look, Judith Curry’s post is there, too.
Not too coincidentally, there are no posts from CAGW enthusiast websites in the 10 Ten. Me thinks they need to do something about their message.
Is it me or is there a problem with the uncertainty range given in the Stephens et al figure for the TOA imbalance. The energy imbalance is given as 0.6 w/m2 with uncertainty of +/-0.4 w/m2. However, the LW_out and SW_out figures have uncertainty of 3.3 w/m2 and 2 w/m2 respectively.
This doesn’t make sense. Either the uncertainty range for the imbalance is wrong or the uncertainty ranges for the the LW and SW outgoing energy figures are wrong. If the LW and SW ranges are correct then the uncertainty range for the imbalance should be nearer 4 w/m2 (i.e. 10 times greater than the range given)
@Jim Stevens says: October 18, 2013 at 9:29 am
Jim – thank you for your kind words, but it’s not my blog, just a link. The figures are so startling I thought hey needed a larger audience.
It’s in your article above.
Followed by a graph of ocean heat content change measured in degrees C, compared to the surface/atmosphere time series (Figure 8). Your paragraph and especially the graph following work on the implication that the oceans have the same heat capacity of the atmosphere, and you don’t spend one word pointing out that this is not the case. My example is just a simplified version of what you’ve done here.
The heat capacity of the world’s oceans is 1000 times greater than that of the Earth’s atmosphere. Your comments, and the graph accompanying completely ignore this difference.
To spare any confusion your readers may have, it would be well to explain how much heat energy it has taken to warm the oceans and the atmosphere (surface atmospheric temps) respectively since 1955. Global ocean heat content, not just selected oceans.
Richard,
If the oceans have 1000 times the heat capacity of the atmosphere, as you point out, how much would the atmosphere warm if the Earth’s oceans lost a thousandth of a degree C of their total heat to the atmosphere?
barry:
The idiocy of your post at October 19, 2013 at 7:53 am would have been avoided if you had read my post addressed to you at October 19, 2013 at 2:42 am. Please read it instead of trying (and failing) to make obscurantist and knit-picking objections to Tisdale’s wording. To help you find it I provide this link which jumps to it
http://wattsupwiththat.com/2013/10/18/dana-nuccitelli-cant-come-to-terms-with-the-death-of-the-agw-hypothesis/#comment-1452910
And, yes, it does contain a sentence with a serious typographical error although that does not harm the information of the post. The corrected sentence would be
Indeed, how can increase of ocean temperature by six thousandths of a degree C be a discernible problem of any kind?
Richard
We should also remind ourselves what the climate models were predicting for OHC uptake.
The 0-2000 metre ocean is absorbing 0.53 W/m2/yr according to the Argo floats..
But GISS Model ER forecast it would be 1.2 W/m2/yr.
http://www.realclimate.org/images/ohc11.jpg
And Trenberth’s model CCSM4 said it would be 1.3 W/m2/yr.
http://s21.postimg.org/e4ozrdnyv/Trenberth_s_OHC_Climate_Model.png
So don’t try to tell me that oceans are absorbing the heat, they are actually absorbing only 40% of that projected by the theory. Interesting how many times the less than 50% shows up – Always.
Henryp: Well, I looked in Rev 13:15 and can find no ref to people being linked with a device. It merely talks about the ‘image of the beast’
@snotkop
I cannot get anything up here
e.g. my replies to Cardin Drake
(which were on topic)
Revelation is probably off topic here (rightly so)
[Reply: Changing your screen name causes problems like that. — mod.]
Don’t worry. I am exhaustipated
(Too tired to give a shit)
I hoipe they will still put up my reply to Cardin Drake
Barry, thanks for quoting my earlier reply to you and the part of my post that you’re objecting to. You then wrote:
“Followed by a graph of ocean heat content change measured in degrees C, compared to the surface/atmosphere time series (Figure 8). Your paragraph and especially the graph following work on the implication that the oceans have the same heat capacity of the atmosphere…”
My graph simply presents surface temperature anomalies and subsurface temperature anomalies. You’re the one making the assumption that I’m implying anything with that graph.
And you continued, Barry, with “…and you don’t spend one word pointing out that this is not the case.”
Because it’s irrelevant, Barry. Is all of that supposed extra heat in the ocean hiding in one place, Barry, growing and growing and growing in heat, so that one day it’ll rise to the surface and blast heat into the atmosphere and fry everything on the surface? No. It’s mixed and distributed throughout the oceans. At worst, it provides a miniscule background warming.
And you wrote, “The heat capacity of the world’s oceans is 1000 times greater than that of the Earth’s atmosphere. Your comments, and the graph accompanying completely ignore this difference.”
Why do you dwell on that? Because the oceans to 2000 meters warmed less than 0.1 deg C in 55+ years? It’s not coming back to haunt us, Barry.
Last, there’s also no evidence that the warming at the depths of 0-700 meters since 1955 was caused by manmade greenhouse gases.
Regards
You missed the point, Bob. You can’t make a comparison of the temperature change of the ocean and the atmosphere – as you did – by expressing it in degrees C.
You are downplaying the enormous amount of energy it takes to heat the oceans, even by a little. You do this by implying a false equivalence (“a whole new perspective”) in the heat capacity of the two mediums.
You leave the reader with the impression that the oceans have taken up less heat energy than the atmosphere over the period since 1955.
If you state clearly the comparative amounts of heat energy required required to warm each medium as far as they have warmed since 1955, then this would clear up the confusion.
Would you be so kind as to make that clear? I am sure it is well within your capabilities. Your readers will be better informed.
So Bob says AGW is dead because he thinks ocean heat is “not coming back to haunt anyone at any time in the future.” So despite all of his graphs that do not show heat content of the global oceans, Bob’s point comes down to this unsupported belief. Good luck actually persuading anyone who is not already a WUWT true-believer.
Richard,
I’m not interested in discussing qualitative notions like “problem”. The language is way too political.
The heat energy that warms the oceans by 6 thousandths of a degree would warm the atmosphere by 6C. My point is about relative heat capacity, not about global warming, where we’re headed or policy implications.
HenryP: How can anyone take anything you say seriously if you duck such an easy question as Rev 13:15. Do you want to try again? Or are you happy for people to know that not only are you “Too tired to give a shit” – you’re full of it.
@snotkop
You will become a wise man if you would just follow and acknowledge what I have said on this thread,
Notwithstanding that which they have chosen not to publish here what I have siad.
Brian:
At October 19, 2013 at 11:17 am your post says in total
OK. I’ll bite.
The thermal capacity of the oceans is 1,200 times more than the thermal capacity of the air. Therefore, each amount of heat which would have warmed the air 1.0°C but goes into the ocean causes the ocean temperature to rise by by 0.0010°C. And 6.0°C is the most that even the most extreme warmunists claim AGW could raise global temperature.
Therefore, if the oceans constrain all of the heat which would induce the maximum asserted possible global temperature rise, then the oceans would warm by 0.006°C.
The oceans are cooler than the air so please explain how that heat could escape the oceans at a rate and in a manner which could have discernible effects.
Richard
@HenryP: Yep, I’m wise to you. Like I said, full of it. And there was I reading your stuff and thinking it worth the effort. You destroyed it all with a crap reference to Revelation[s]. And as you can’t get back from that, everything you’ve written to date deserves the same descriptor. So I shall save my time in future by not bothering with your posts.
@snotkop
Problem is we are off topic
That is an insult to Bob?
Worth remembering that the only reason for these BS claims about the deep ocean was because of the failure of models , which we were told work , and the diversion between reality / alarmists claims , in the first place.
The need of ‘hidden ‘ heat is sign of just how weak their case actual is in the first place and how little like scientists , who can accept the need to modify theory , and how much like religions dogmatist , who cannot accept even the smaller error in their ‘faith ‘ , they act.
Br— and Ba— sure seem stuck on the same whiny non-points. Almost like they might’ve cooked up a similar nutty opinion piece to the one this article is rebutting.
The Ocean Heat Content is derived from the temperature of the water.
The Argo floats do not measure joules – they measure temperature of the water which is then converted into joules for the whole ocean or for a particular volume of water, across a m^2 whatever. The energy required to heat 1 gram of water by 1 C is 4.1840 joules.
We also know that a joule/second is a Watt so it can also be determined how many Watts/m2/time are being absorbed in the ocean.
Ocean Heat can be measured into TempC or Joules or W/m2/yr – they are all equivalent type measures. You just need the right conversion formulae.
Obviously Brian does not know that.
Some conversion factors for the 0-2000 Metre Ocean.
0.01C rise in the 0-2000 metre Ocean = 3.03 x 10^22 joules
1.0 W/m2/year absorbed in the Oceans = 1.13 X 10^22 joules
——–
Other comparisons
The Sun provides the Earth with 386.4 x 10^22 joules per year.
The 0-2000 metre Ocean is absorbing 0.59 x 10^22 joules per year.
The Land, atmosphere and ice-melt is absorbing 0.057 x 10^22 joules per year
Gareth Phillips says:
October 18, 2013 at 6:37 am
Dana N. sets out his rationale on Skeptical Science, http://www.skepticalscience.com/does-global-warming-pause-mean-what-you-think.html I’ll also link Bobs response on that site. I’d be very interested to see Dana’s response to Bobs analysis of the situation.
It would not make any sense for Bob to answer on that unreliable site just to see answers being changed and adapted to fit the narative – check why the respective site is specifically mentioned “unreliable” in the blog roll at WUWT.
Brian says:
October 19, 2013 at 11:17 am
So Bob says AGW is dead because he thinks ocean heat is “not coming back to haunt anyone at any time in the future.” So despite all of his graphs that do not show heat content of the global oceans, Bob’s point comes down to this unsupported belief. Good luck actually persuading anyone who is not already a WUWT true-believer.
there is no such “WUWT true believer”. There is only a forum for conversation and opinions of peoples trying to analyze logically using the tools of the scientific method various claims.
There are no beliefs here except the trust that the scientific method can help us understand various phenomena – or at least I could not see anything else – if you see any please highlight and discuss.
I am very thankful to WUWT & Anthony in particular, and the whole WUWT team and commenter for this special forum.
To my understanding Bob says something different to your derived conclusions of what he said, so I conclude you did not took the time to read and understand what he says.
If you have something to say you should say the rationales – you jump to conclusions without basing it on anything, only on words that have been potentially fed to you somewhere else.
The ocean heat content for the pre-ARGO era is a stretch and using it on a graph with the ARGO data is in my view wrong. One should not mix different ways of measuring as it may lead to totally wrong conclusions – or at least make the clear separation in the overview graph.
Secondly the 5 years smooth almost completely removes the ARGO data from the ocean heat content.
The error margins are so large that these are not even shown in the graph.
Taking many measurement in different location points does not reduce the error margin as some would like to make us believe.
The ocean heat content is very different to what the models expect which is a very important message that you seem to have missed.
@Bill Illis
My book says the sun provides irradiation to earth of ca. 1.5 x 10^22 J per 24 hours.
That would be 547 x 10^22 joules per year.
ca. 30% of that is lost to space due to deflection/ note why/because reduction/increase of O3/peroxides/nitric oxides TOA
may cause great differences.
An interesting aspect that many AGW believers seem to forget is that almost a a quarter of that is used for evaporation of water.
\
only about 0.023% is used by flora, i.e. plant/trees/crops etc (1975)
Since 1975 there has been a great increase in vegetation…
which traps heat….
This is why my only station showing an increase in mimina, pushing up means, was in Las Vegas.
Other places, like where people have been cutting trees shows a sharp decline in minima.
Makes you think, does it not?
( I am a greenie: make earth earth green even if it does cause more warming…..)
Barry and Brian,
Somehow you are attempting to suggest that the energy stored in the ocean as an increased temperature of a few thousandths of a degree could somehow manifest as an an atmospheric temperature of some few degrees sometime later. By doing this you are implicitly asserting that there is some mechanism for this, but there is not. The mechanism for the transfer of thermal energy is driven by the difference in absolute temperature. At best an ocean that is 0.001 degree warmer can impart 0.001 degrees of warming more than it would have if it hadn’t warmed. Once entering the ocean entropy dissipates the energy throught the volume of the ocean, the energy at the surface that is available is only that stored in a few microns at the surface for a medium 0.001 degrees hotter that It would have been. Essentially once the energy enters the ocean system thermal capacity means that energy is effectively lost. Not only that, any stored energy can only be released when the atmosphere is colder than the ocean because Nett thermal transfer only goes from hot to cold. Oceans therefore could only succeed in making winters and cold nights warm by releasing heat. On the whole any heat release by the ocean is likely to be very good for us
If global warming heat goes into the ocean, then it’s all over – global warming will never be a problem because than energy can never be released back at a rate or in a way that could cause any additional problems.
John Edmonston,
It is not strictly true to say energy received must equal energy emitted. What must be true it that energy in must equal energy out – of all forms. heat energy does change form and some of it is, some of the incoming energy is converted to kinetic energy and is expended in the gravitational system as pertubations in spin and orbit, rain expends kinetic energy converted from heat, lightning expends heat energy as electricity, light, sound etc. Plants turn some incoming energy into carbohydrates. These losses mean that the emission out will be less than the incoming energy by an amount equal to these losses. Climate models ignore the loss, or rather they missattribute these losses to CO2.
It really surprises me frankly that the climate industry claims that gigatonnes more water is cycling through the atmosphere then ignore the energy expended by gigatonnes of water hitting the eath at termjnal velocity.
Brian says:
October 19, 2013 at 11:17 am
So Bob says AGW is dead because he thinks ocean heat is “not coming back to haunt anyone at any time in the future.” So despite all of his graphs that do not show heat content of the global oceans, Bob’s point comes down to this unsupported belief. Good luck actually persuading anyone who is not already a WUWT true-believer.””
Brian, you’re an idiot and a know nothing one at that!
You just parrot the alarmists current, totally unproven, meme that extra energy is entering and hiding away in the deep oceans.
Even if this unproven meme was correct, you are too stupid to realise that, if this is the new hypothesised effect of increasing atmospheric CO2, then the global CAGW scare is dead as a Dodo.
Energy enters the oceans in a highly organised form and must become more disorganised as it dissipates amongst the deep oceans. There is no way for this energy to become highly organised again without breaching the Laws of Thermodynamics. Therefore, it cannot be released in ‘heat pulses’ it can only just cause a minor fractional increase in the Oceans surface temperature, where it interfaces with the troposphere and that can have no discernible effect on tropospheric temperatures.
So silly boy you can now move onto some other man made global catastrophe, I am sure that there will be one along soon. Unless of course you now want to disown the meme that increasing CO2 is causing the extra energy to go into the deep oceans.
Alan
@richardscourtney (and others saying something similar)
“I am ignoring the simple fact that you and Nuccitelli are ‘moving the goal posts’: global warming was always about rising surface temperature and NOT ocean heat content until the surface temperature stopped rising.”
This is plain wrong. From the Charney Report (1979, i.e. nineteen hundred seventy nine!):
“If carbon dioxide continues to increase, the study group finds no reason to doubt that climate changes will result and no reason to believe that these changes will be negligible. The conclusions of prior studies have been generally reaffirmed. However, the study group points out that the ocean, the great and ponderous flywheel of the global climate system, may be expected to slow the course of observable climatic change. A wait-and-see policy may mean waiting until it is too late”
http://www.atmos.ucla.edu/~brianpm/download/charney_report.pdf
And every IPCC report discusses the hydrosphere. Oceans have always been a part of the AGW theory. You may have a point if you would say that media attention always focussed on surface temperatures and only recently started including the hydrosphere.
Sisi:
Your post addressed to me and others at October 20, 2013 at 3:11 pm says
No, you are plain wrong.
I am holding in my left hand the First IPCC Report.
Its Figures 5.4 summarise temperature, Figures 5.6 summarise precipitation, and Figures 5.8 summarise soil moisture projections.
Section 7 discusses Observed climate variation and change.
Section 7.4 deals with Surface Temperature Variations and Change. It deals with temperature from pages 207 to 229 inclusive with an additional short Subsection on temperature (7.11.1) on pages 231 and 232. Droughts and Floods are covered in the single paragraph which is Subsection 7.11.2 on page 232. And precipitation changes obtain only a single sentence in the Section’s Conclusions.
If you think the hydrological cycle is discussed in any detail in that Report then please state which of its 362 pages provides that.
The IPCC has always focused on global temperature. The oceans have now become of interest because global warming has stopped and imagined ‘heat going in the oceans’ is being used as an excuse for that.
Deluded fools are swallowing propaganda such as “We have always been at war with Eurasia” or “every IPCC report discusses the hydrosphere”.
Richard
Sisi says:
October 20, 2013 at 3:11 pm
If the IPeCaC has always assumed that “global warming” driven by CO2 & other GHGs meant warming other features of the planet than the lower atmosphere, especially the ocean depths, please explain then why its GC models have never reflected this supposed recognition. Instead, they showed steadily rising air temperature in lock-step with CO2 concentrations, which is of course what the worse than worthless GIGO shams were programmed to show.
@richardscourtney
From: http://www.ipcc.ch/ipccreports/1992%20IPCC%20Supplement/IPCC_1990_and_1992_Assessments/English/ipcc_90_92_assessments_far_overview.pdf
the first three occurrences of “ocean” in the text (13 in total in the overview):
“The human-caused emissions of carbon dioxide are much smaller than the natural exchange rates of carbon dioxide between the atmosphere and the oceans, and between the atmosphere and the terrestrial system. The natural exchange rates were, however, in close balance before human-induced emissions began; the steady anthropogenic emissions into the atmosphere represent a significant disturbance of the natural carbon cycle.”
“Land surfaces warm more rapidly than the oceans, and higher northern latitudes warm more than the global mean in winter.”
“The oceans act as a heat sink and thus delay the full effect of a greenhouse warming. Therefore, we would be committed to a further temperature rise which would progressively become apparent in the ensuing decades and centuries. Models predict that as greenhouse gases increase, the realized temperature rise at any given time is between 50 and 80% of the committed temperature rise.”
This alone proves my point that the hydrosphere (not: hydrological cycle) is included in AGW theory. Sure, we can go through all other mentions in the full first IPCC report, but that wouldn’t change the fact that your statement:
“I am ignoring the simple fact that you and Nuccitelli are ‘moving the goal posts’: global warming was always about rising surface temperature and NOT ocean heat content until the surface temperature stopped rising.”
is plainly wrong, which I already showed by quoting from the Charney report. By the way, your quote:
“The IPCC has always focused on global temperature. The oceans have now become of interest because global warming has stopped and imagined ‘heat going in the oceans’ is being used as an excuse for that.”
doesn’t make any sense unless you mean that ‘focused on global temperature’ does not include the hydrosphere in your definition of ‘global’. There is me thinking I live on a wet planet…
@ milodonharlani
I think I recently mentioned that I will not discuss with you because of your discussion style. Again you show that I am probably right with that. Your comment is uninformed and you ask me to do something that has no bearing on the point I made with respect to a comment from richardscourtney. The information you want can be found by a few internet searches. Regarding me explaining it to you, I’ll pass! 😉
Sisi says:
October 20, 2013 at 4:31 pm
IOW, just as before, you’re totally clueless as to the subject upon which you presume to comment.
********, I presume?
@Sisi
note that the ocean’s surface temperatures never go above a maximum of around 35C. I observed the same in my pool. It seems that above this temperature the top layers of water (molecules) start boiling at around 1 atm, which gives a cooling effect downwards. (it takes energy to evaporate)
Hence the formation of water vapor and clouds. Without that, there would be nothing really. So, if some more heats ends up in the oceans, eventually this just translates into more clouds and more rain.
What makes you think that some extra heat coming in would go and stay in the ocean rather than cause more clouds and precipitation?
Sisi:
Your post at October 20, 2013 at 4:19 pm is risible.
The hydrological cycle is process (not the hydrosphere) so the hydrological cycle (not the hydrosphere) must be included in any putative disruption to global climate.
You say that the 1992 SUPPLEMENT to the 1990 IPCC Report included 13 mentions of the hydrosphere. So what? That does NOT demonstrate the 1990 IPCC Report discussed the hydrological cycle and/or the hydrosphere, and it did not.
You claimed – and in your post I am answering, you repeat your claim – that the (now disproved) AGW hypothesis includes the hydrological cycle. Your post I am answering says
There are two falsehoods in that.
Firstly, items in a Supplementary report published two years later do NOT demonstrate that something absent from the original Report was important to the subject of the original Report.
Importantly, those supplementary mentions do not explain why something you claim is included in the now disproved AGW hypothesis (n,b, it is not and never was a theory) was not discussed in the 362 page original IPCC Report.
Secondly, most of the Earth’s surface is covered in water but that does not mean mention of the hydrosphere demonstrates that the hydrosphere “is included in AGW theory”. It merely demonstrates the Report was discussing changes to planet Earth and not planet Mercury.
Similarly, if you think a mention in the Charney Report was important in the early days of the AGW scare then perhaps you can explain why the First IPCC Report did not include it?
As I said
Richard
Richard returns to high school and posits: “The oceans are cooler than the air so please explain how that heat could escape the oceans at a rate and in a manner which could have discernible effects.”
Richard didn’t do his homework on the topics of latent heat or advection.
Brian says:
October 21, 2013 at 8:58 am
Richard didn’t do his homework on the topics of latent heat or advection.
Brian, answering at the level of a kid that tries to show himself smart is not supporting a dead hypothesis. Please try a bit harder if you want to be taken seriously…
I’m just a layman, so bear with me. I’ve heard arugments from the AGW proponents to the effect that “the warmth is hiding in the deep ocean”. So please tell me, how can you add heat to the deep ocean without warming the surface? I mean, these folks make it sound like, at 500 meters of depth the water is boiling or something, and that we’re all doomed if it makes its way to the surface!
Bill Ryan says: “I’ve heard arugments from the AGW proponents to the effect that “the warmth is hiding in the deep ocean”. So please tell me, how can you add heat to the deep ocean without warming the surface?”
It’s entirely possible for that to happen. Think of the Gulf Stream carrying warm tropical waters to the north. The trade winds in the tropical North Atlantic are pushing the water from west to east, where all that water encounters land, so the water is forced poleward along the east coast of the U.S. There are also winds at high latitudes that can either enhance to poleward migration of water by the Gulf Stream or resist it. If the high latitude winds are resisting it, the warm water that normally migrates north will “stack up” along the Gulf Stream, warming the oceans to depth. But that warming would be very slight in terms of temperature, as we’ve illustrated in Figure 8, above. I’ll save you the trip:
http://bobtisdale.files.wordpress.com/2013/10/08-fig-3-temp-anom-comparison-a.png
Regards
Brian says: “Richard didn’t do his homework on the topics of latent heat or advection.”
And Brian has contributed nothing, nada, zilch, to the discussions on this thread–other than to exposed his obvious lack of understanding of the subjects being discussed.
Have a nice day.
bill ryan asked: how can you add heat to the deep ocean without warming the surface
henry@Bill ryan
I am not saying Bob is wrong.
the point is: how did the warmth (less or more of it) get into the oceans in the first place.
The UV from the sun is carrying most energy even though you cannot feel “its heat” on your skin.
UV is absorbed by the water, eventually, at greater depth, where it converts to heat/warmth, mostly.
Now read my comment earlier on:
http://wattsupwiththat.com/2013/10/18/dana-nuccitelli-cant-come-to-terms-with-the-death-of-the-agw-hypothesis/#comment-1454209
Natural variation of the UV (coming in), or rather: (that UV which is let through the atmosphere), is what is causing cooling and warming periods because this is where earth receives most of its energy… But don’t worry about any catastrophes: the period of warming is over and the period of cooling has begun.This is really all because of that variation in the UV coming in.
here is my take on it:
http://blogs.24.com/henryp/2013/04/29/the-climate-is-changing/
@HenryP
“What makes you think that some extra heat coming in would go and stay in the ocean rather than cause more clouds and precipitation?”
What makes you think that I would think that?
@richardscourtney
“The IPCC has always focused on global temperature. The oceans have now become of interest because global warming has stopped and imagined ‘heat going in the oceans’ is being used as an excuse for that.”
my debolding. What global temperature?
Global temperature yes, because of the recordings that exist. Who denies climate is about atmosphere, cryosphere, hydrosphere, biosphere and so on?
@richardscourtney
you’re not calabritated to reality enough.
cheers!