Those that want to make today’s weather seem like the “worst ever” often make ludicrous claims trying to link weather to high CO2 levels. For example, that extra CO2 gives the weather “personality“, or even more extreme linkage, like this:
Climate change means increased severe weather and asthma attacks. See what it means for your state: http://t.co/Pe9mOTVAro
— US EPA Research (@EPAresearch) July 1, 2013
and this
Climate Depot has a headline from Goddard that touts all the weather (not climate) issues of 2013 in the context of the highest ever reported CO2 concentration in modern times. Unfortunately, the link contained no proof, only claims. I decided to provide the proof.
First, about that 400PPM of CO2:

Unfortunately, they backed down from the claim later saying:
‘Carbon dioxide measurements in the Earth’s atmosphere did not break the symbolic milestone of 400 parts per million at a Hawaiian observatory last week, according to a revised reading from the nation’s climate observers.
The current level as of this writing is at: 395.50ppm and has actually gone down since the announcement of breaking the 400 ppm mark:
![co2_weekly_mlo[1]](http://wattsupwiththat.files.wordpress.com/2013/08/co2_weekly_mlo1-e1376168771698.png?resize=640%2C464)
Source: http://www.esrl.noaa.gov/gmd/ccgg/trends/weekly.html
Next: let’s take each of the claims below and provide the context for proof:
- Coldest summer on record at the North Pole
- Highest August Arctic ice extent since 2006
- Record high August Antarctic ice extent
- No major hurricane strikes for eight years
- Slowest tornado season on record
- No global warming for 17 years
- Second slowest fire season on record
- Four of the five snowiest northern hemisphere winters have occurred since 2008
Coldest summer on record at the North Pole:
Easy to prove, as we’ve covered this issue recently here. The DMI plot of Arctic temperature for 2013 (at the end pause of this animation) hasn’t gone above the climatic normals since this dataset began in 1958:

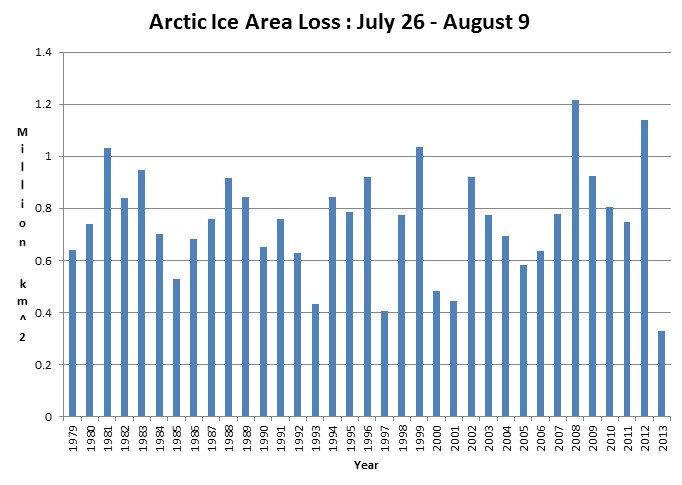
Highest August Arctic ice extent since 2006:
Plausible, but is debatable, depending on what data you look at, for example, this plot from DMI:
![icecover_current_new[1]](http://wattsupwiththat.files.wordpress.com/2013/08/icecover_current_new1.png?resize=640%2C480)
Source: http://ocean.dmi.dk/arctic/plots/icecover/icecover_current_new.png
Others on the WUWT sea ice page suggest it could go either way. What isn’t debatable though is that there has been a dramatic slowing of loss of Arctic ice extent in the past couple of weeks, as shown below, and that the current extent is well within the +/- 2 standard deviation.
Source: arctic.atmos.uiuc.edu/cryosphere/timeseries.anom.1979-2008
Record high August Antarctic ice extent:
That’s easy to show, at the end of July starting into August, as Paul Homewood demonstrates:

ftp://sidads.colorado.edu/DATASETS/NOAA/G02135/south/daily/data/
Since then, Sunshine Hours puts it in context with other years:
After taking a small jog sideways and downwards, Antarctic Sea Extent is back to moving up.
Day 221 is in 2nd place. 2010 holds the daily record. Can 2013 catch the 2010 record pace again? Wait and see.

No major hurricane strikes for eight years:
As we pointed out at the beginning of the hurricane season on June 1st, Hurricane season begins with a new record hurricane drought for the USA

The graph above provides an update to data on the remarkable ongoing US “intense hurricane drought.” When the Atlantic hurricane season starts next June 1, it will have been 2,777 days since the last time an intense (that is a Category 3, 4 or 5) hurricane made landfall along the US coast (Wilma in 2005). Such a prolonged period without an intense hurricane landfall has not been observed since 1900. – Dr. Roger Pielke Jr
It is now at 2847 days since Hurricane Wilma (the last Cat3 hurricane to strike the USA) on Oct 24th, 2005 as of August 10th, 2013.
Slowest tornado season on record:
Easy to prove, just look at NOAA’s Storm Prediction Center Data, which shows we are near a record low for tornado activity in the USA:
![torngraph-big[1]](http://wattsupwiththat.files.wordpress.com/2013/08/torngraph-big1.png?resize=640%2C416)
![torgraph-big[1]](http://wattsupwiththat.files.wordpress.com/2013/08/torgraph-big1.png?resize=640%2C396)
Source: http://www.spc.noaa.gov/wcm/#data
No global warming for 17 years:
This statement gets a number of people riled up, but it is clear that global warming has slowed to a crawl. Even the New York Times has at last been constrained to admit this.
Last year we had this:

Now a year later:

http://www.woodfortrees.org/plot/rss/from:1997/plot/rss/from:1997/trend
and

http://www.woodfortrees.org/plot/hadcrut3gl/from:1997/plot/hadcrut3gl/from:1997/trend
Slight cooling in the troposphere, slight warming at the surface, both virtually flat.
Of course after the latest HadCRUT4 “adjustments” are added in, some can claim it is actually warming.

http://www.woodfortrees.org/plot/hadcrut4gl/from:1997/plot/hadcrut4gl/from:1997/trend
Second slowest fire season on record:
Actually, just for this record set. The National Fire Information Center says:

2013 is actually lowest in the last decade for the number of fires, and second lowest for acreage.
Four of the five snowiest northern hemisphere winters have occurred since 2008:
Rutgers snow lab shows this clearly.
![nhland_season1[1]](http://wattsupwiththat.files.wordpress.com/2013/08/nhland_season11.gif?resize=600%2C400)
1978 was tops, followed by 2010, 2011, 2013, and 2008.
Source: http://climate.rutgers.edu/snowcover/chart_seasonal.php?ui_set=nhland&ui_season=1
We live in interesting times of nearly 400ppm of Co2 concentration in our atmosphere.

It’s still not too late to get t-shirts:

Order yours here on your favorite garment, mug, or bag here:
If CO2 was at the same level as of 800,000 years ago, why are we cooler by 5-10 degrees and sea levels lower by 75-120 feet? This would indicate there’s no CO2/temp/sea level relationship.
Anthony, don’t know if it’s just my browser, but the two woodfortrees graphs under “No Global Warming for 14 years” are just torture on the eyes.
There used to be handful of 350.org lawn posters in our neighborhood.
Not any more. Perhaps the people that had them might be a bit embarassed.
Go HadCRUT4! I like absurd humour.
@ Tommy Roche, try a refresh now
What are the “HadCRUT4 adjustments”?
I grow weary constantly rebutting the state propaganda; but that is, after all, the purpose of incessant state propaganda.
“A lie told often enough becomes the truth.”
variously attributed to Lenin (I doubt) Goebels (possible) but the most unlikely is William James (1842-1910) The father of modern Psychology “There’s nothing so absurd that if you repeat it often enough, people will believe it.”
I looked at the CO2 plot and thought, “Wow, that’s quite a change”. Then I looked at the temperature scale.
I think 1978 was the record year for snow extent. Just saying.
REPLY: yep, eyesight issue, fixed thanks. – Anthony
I really enjoyed this post. Thanks for putting it together. But even more importantly — thanks for that preview button! I just noticed it.
I searched Wikiquotes for William James and “nothing” and found nopthing relevant.
http://en.wikiquote.org/wiki/William_James
The science is settled, the new preview button rocks. And there is more science in that statement than anything the Goreacle ever leaked from his insidious lips.
Wikiquotes says there are no reliable sources for it being a quote by Goebels. (But Wikianything is very political outside the hard sciences).
Personally, I think this is something ALL statesman inherently know. Like a tyrant’s old wive’s tale.
Seriously, I would love to nail this source down. Any ideas?
During the Eemian interglacial of 125,000 years ago, atmospheric CO2 was lower, yet sea level was almost 30 feet higher, and temperature was 3 to 4 degrees Celsius higher. http://hockeyschtick.blogspot.com/2013/08/new-paper-finds-sea-levels-rose.html
Remarkably, the higher temperatures were not related to CO2 levels, and there was no run-away warming. As always, observations trump hypotheses based on the outputs of computer models. You don’t have to look at your computer to know if it’s raining; just look out the window.
Similarly, recent studies of coastal English villages show sea level was 3 to 4 feet higher during the Medieval Warm Period a thousand years ago. That’s when vineyards flourished in England (where they don’t today).
Now we are just emerging from the Little Ice Age (1350 to 1850 AD), the coldest period since the end of the Ice Age. Of course it’s warming! Just like four other times in the past 12,000 years (the Holocene Climatic Optimum, Minoan, Roman, and Medieval Warming), only not warming as much as the earlier warming periods – or the even warmer Eemian interglacial.
With Nature’s handwriting everywhere you look – previous higher sea levels, tree lines higher and further north, warm weather crops grown where they don’t grow now, greater glacier retreat than now – it’s a shame that alarmists are blinded by their dogma and can’t look out their windows to see the history of natural climate change.
So I must label them what they are: natural climate change deniers.
We believers in the Null (Natural Variation rulez) are having a great time.
OK I give up on internet resources; they are politicized on this subject.
Personally I opt for Goebels because he was logical and effective (unfortunately) … just the type to logically enunciate how statecraft works. Macchiavelli was a similar character, though on the right side of goodness. If anyone wants the directions to where Macchiavelli spent 20 years in internal exile in Florence, just ask me. There’s a good restaurant opposite.
Anthony, Kenji is remarkable. He always seems to have the right opinion!
PS: I like the new preview feature!!!!!
Being Sunny, it is difficult to wait for the cold, snow, horrid weather, as the Sun’s output plummets. What I mean is that Global cooling can/will be brutal. The Global temperatures dropped 2C between 1600 and 1650. Anyone who wants this to happen has a screw loose.
On the other hand Global Warming made available more crop land, cheaper food etc. The argument is whether people/industry warmed the Earth or not. It is too bad that the people we work for [governments] had to resort to deception instead of just increasing taxes [like usual].
I wonder what the warmist parties are like nowadays. After getting a hugely expensive temperature measuring method funded and implemented, only to have to resort to more and more laughably transparent adjustments of other people’s prior work. There must be a lot of alcohol involved. Also, there must be a winnowing process as the IQ limbo slowly clips the more intelligent from the invite list. At some point, the amount of alcohol required to make the conversation lucid likely exceeds the level required to remain conscious. We can call it the Watts ratio, as in the blood alcohol level required to converse with a warmist divided by the blood alcohol level at which the average human passes out. We’ll know that the warmist position is finally dead when the ratio equals 1.
I’m already ready for climate change – finally broke down and purchased a snow thrower that should handle anything the coming colder winters will throw at us.
Tiredoc says: @ugust 10, 2013 at 4:52 pm
I wonder what the warmist parties are like nowadays
The warmistas do not give an eff. They use global warming as an excuse for socialist policies. It’s that simple. Yes, it is political and launched by the left. Lysenko anyone?
Got a “server error” when chasing the T-shirt. Link not quite ready?
I can hear in my head the cagw crowd: record snowfall = climate change, record no of days without hurricanes = climate change, record number of years with no warming or cooling =climate change, record Antarctic ice…you get the drift. It is an argument you can never win with these guys! Maybe highlighting all the records not broken is the way to go. That should bore the crowd to death.
Yer know what Anthony, at 400ppm – as the tree said to the birds, “it sure tastes better than it ever did!”
Michael Combs says:
August 10, 2013 at 4:25 pm
Are you kin to Gail Combs? If so, perspicacity runs in the family.
We Combs are the largest closely related family in the US, with strong and ancient ties to Virginia and Kentucky (John Combs (or Combes) arrived in Jamestown on the 20th of May, 1619, on the good ship Marigold as an indentured servant). For years the biggest reunion in the US annually was the Combs getting together the first weekend of August in Hazard, Kentucky (featured in Life Magazine in the early 1960’s). That said, i hope I’m related to Gail because what she writes about natural climate change here on WUWT bestows great credit on the family name.
4TimesAYear says:
August 10, 2013 at 4:54 pm
Congrats on beating the rush. I should invest in snow blower futures.
Oh noes! The king crabs in Antarctica are now pillaging the exotic life-forms of the Antarctic seabed, all due to global warming!
Pass the melted butter…..http://www.youtube.com/watch?v=cVNTfpDlPzE
Anthony, one more graph you might want to include:
http://cdiac.ornl.gov/images/preliminary_2009_2010_fossil_carbon_emissions.jpg
Thank you so much for the reality check. Its comforting to know we are living within a period of stable climatic conditions. Its looking more like our children and grandchildren will do just fine despite the dire warnings of people who believe in CAGW.
As climate reality continues to sink into the mindset of the population I’m looking forward to watching the CAGWers scamper off into the mist while pointing their fingers at each other. Or stay where they are seen and be ridiculed for their collective stupidity.
Thank you Steven….and thank you Anthony for expanding on it!
CRS, DrPH says:
August 10, 2013 at 5:54 pm
I foresee a huge industry for Chile & Argentina when & if King Crabs take up permanent residence on the continental shelf.
Butter, lemon or both?
majormike1 says:
August 10, 2013 at 6:01 pm
OK, I’ll bite. Just how closely related are the Kentucky Combses?
Sorry. Cheap shot, for which I apologize, but couldn’t resist.
My second year at Oxford U., UK, I lived in the village of Combe, which in Brittonic (combe or coomb/e) means a small deep valley. A swale or small deep valley south of Pendleton, Oregon (Coombs Canyon) by pure chance is named after your family.
I’m also a Jamestown descendant, among the “Red Bollings”, who inflicted tobacco upon the British as the original Red Man’s Revenge (but without that drug, rum & sugar there would be no USA). There are also White (not descended from Matoaka Powhatan, aka Pocahontas) & Blue (aristocratic) Bollings.
Robert of Ottawa August 10, 2013 at 4:10 pm
I grow weary constantly rebutting the state propaganda; but that is, after all, the purpose of incessant state propaganda.
“A lie told often enough becomes the truth.”
variously attributed to Lenin (I doubt) Goebels (possible) but the most unlikely is William James (1842-1910) The father of modern Psychology “There’s nothing so absurd that if you repeat it often enough, people will believe it.”
I don’t understand. The words attributed to James say that people won’t believe anything, no matter how absurd it is, but even if I ignore this and assume, e.g., that you mistakenly substituted “will” for “won’t,” your point would seem to be that perhaps no famous person ever said “a lie told often enough …” or equivalent, which does not make sense coming from someone who has grown “weary constantly rebutting the state propaganda.”
Anthony,
This is a great post and effectively makes a strong case for skeptics.
I did some comparisons on the highs and lows before and after the adjustments for hadcrut and notice significant differences. Did they change the basis? Are they all tenths of a degree above or below 14C. It is noted that the warmest year was changed from 1997 to 2007.
Some noticeable differences both high and low below:
1997 Low -3 = 0.15 after adjustment -4=0.2
2002 high -3=0.6 after adjustment -4=0.67
2008 low -3=0.5 after adjustment -4=1.5
2012 high -3=0.57 after adjustment -4=0.65
2012 low -3=0.18 after adjustment -4=0.25
I am just a novice at this. Can someone explain the significant adjustments upward?
Also the first temperature graph seems quite different than the Hadcrut
Robert of Ottawa says: @ August 10, 2013 at 4:31 pm
OK I give up on internet resources; they are politicized on this subject.
Personally I opt for Goebels….
>>>>>>>>>>>>>>>>>>
I would opt for Willi Münzenberg
Sure sounds familiar doesn’t it?
Also check out the book The Red Millionaire: A Political Biography of Willy Münzenberg, Moscow’s Secret Propaganda Tsar in the West, 1917-1940 The free look see has some interesting stuff about Münzenberg. Stuff most of us never saw in history class.
Robert of Ottawa says:
August 10, 2013 at 4:24 pm
“Wikiquotes says there are no reliable sources for it being a quote by Goebels. (But Wikianything is very political outside the hard sciences).
Personally, I think this is something ALL statesman inherently know. Like a tyrant’s old wive’s tale.
Seriously, I would love to nail this source down. Any ideas?”
Goebbels’ rulebook was the 1928 book Propaganda by Eddie bernays, and Eddie, nephew of Siggi Freud, had already become rich and famous for his mastery of mass manipulation at that time. He was the advisor to Woodrow Wilson who presented Wilson as the bringer of democracy to WW I-destroyed Europe during the Treaty Of Versailles negotiations. Book is online
http://aaa-books.blogspot.de/2007/06/edward-bernays-propaganda-1928.html
You know, one of these coming years we ARE going to set a new hurricane, wildfire or sharknado record.
Michael Combs says:
August 10, 2013 at 4:25 pm
“previous higher sea levels, tree lines higher and further north, warm weather crops grown where they don’t grow now”
I’ve observed in Dominican Republic a horizontal “bench” cut in an old coral coast line that is about 1.0 to 1.5 metres above present sea level. This is a former higher sea level marker that may be from the MWP. Moreover, the entire coast is made up of coral that rises above this bench about another 6 metres or so. This coral therefore grew in a sea that was probably more than 10 metres higher than present – probably the Holocene Optimum. The coral rock is fresh and unfolded and you could probably use the bench for a survey datum it’s is so uniform.
@catcracking
“It is noted that the warmest year was changed from 1997 to 2007.”
The warmest day used to be somewhere around 1940, but that has been adjusted down (relatively) by some 0.6C or more.
HadCrud is a FARCE ……. A massive, trend creating, FARCE !!!
Robert of Ottawa says:
August 10, 2013 at 4:24 pm
Among philosophers, the accepted wisdom/lore is that the idea originates in full flower with Friedrich Nietzsche. He held that there is a need to create a “counter myth” from time to time. He viewed his doctrine of the “eternal return” as a counter myth to Christianity. You will not find a simple quotation that refers to something along the lines of repeating a lie enough times. Someone like Lenin or Goebbels might very well have made such a statement about lying.
majormike1 says: @ August 10, 2013 at 6:01 pm
We Combs are the largest closely related family….
>>>>>>>>>>
Actually it is my married name, so I married into the family.
Actually it is my married name, so I married into the family.
*****************************
Your husband, as is characteristic of we Combs males, also has great perspicacity, and recognized this admirable quality in you..
Excuse me, but why is the surface warming faster than the troposphere? Shouldn’t the troposphere be warming at a much higher rate?
Well the first two graphs of CO2 at Mauna Loa, demonstrate the falsity of a common claim of the CO2 warming alarmists; that CO2 remains in the atmosphere for 200 years.
The second detailed data plot, shows that the annual CO2 “cycle” amplitude (at ML) has an amplitude of 9 ppm p-p. It takes 8 months for that 9 ppm increase to occur, but all that excess CO2 is removed in just 3 1/2 months.
If we place the total excess CO2 at 120 ppm (400-280) over the supposed “equilibrium” level of 280 ppm, then all of that would be removed in 120 / 3.5 months , if the CO2 contributory mechanisms, were all shut down. That is 34.3 months, which would be the time constant of a simple exponential decay process, which fits many physical processes.
so if all sources were shut down, 99% of the CO2 excess, would be removed in five time constants, or 14.3 years.
So BS on any 200 year residence time.
As a practical matter, CO2 is a permanent component of the atmosphere so the residence time is basically infinite; same as it is for H2O which is also a permanent component of earth’s atmosphere.
It doesn’t matter which CO2 or H2O molecule is in the atmosphere, any one is as good as any other.
But the idea that a CO2 molecule from your burning cigarette will still be in the air after 200 years is plain nonsense. Of course it doesn’t matter to you; because as a smoker, you won’t be around in 200 years.
Nice, concise, and to the heart of the matter.
Share “Links like this one” accordingly. Somebody has too……
Thanks for sharing again Anthony!
It means much to many who wondered,,,,,,but could not substantiate such.
Just The Facts said it best,,, and Please correct me if I am off,
“You are entitled to your own opinion, but not your own facts”
😉
“”””””…….DR says:
August 10, 2013 at 8:04 pm
Excuse me, but why is the surface warming faster than the troposphere? Shouldn’t the troposphere be warming at a much higher rate?…….”””””””
Simple, the surface is the source of the “heat” energy, which it makes out of the incident EM radiation energy. The troposphere (upper) is on the way to outer space, where the energy is escaping to, and by virtue of the second law of thermodynamics, the “heat” energy is flowing from hot to cold.
Wake us all, if the upper troposphere does start warming faster than the surface.
majormike1 says:
August 10, 2013 at 8:09 pm
(replying to Combs’ “Actually it is my married name, so I married into the family.”
Oh. Shucks. Does this mean I have to stand in line?
“Highest August Arctic ice extent since 2006:
Plausible, but is debatable”
Indeed, although interesting, short timeframe observations are limited, in the midst of weather. However, increase in arctic ice extent can be expected later this decade.
.
In fact, looked at as an average of more than a single month and more than the summer alone, 2011-2012 had greater average arctic ice extent than some years of the early 1990s did, as in the reference displayed within the link at the end of this post. Common arctic ice history plots use one of two tricks: (1) either showing the lowest-extent minimum/season alone over the decades, or (2) nominally showing all months but only while switching to showing several years alone. (The plots in http://wattsupwiththat.com/reference-pages/sea-ice-page/ from common propaganda sources like Cryosphere Today vary in which one of the two tricks they use).
.
A rare exception revealing arctic ice history without using either trick (and, of course, deleted, but not before webcitation internet archiving preserved it) is within the following, also showing some other parts of the grand picture of climate (dominated by albedo change via cloud cover on the short term and via ice extent on the long term):
http://s23.postimg.org/qldgno07f/edited4.gif
I have to wonder. Is Hawaii the best place for global CO2 measurements?
I’m not trying to be sarcastic or anything, these are honest questions. What about all the roads being shut down in California last year due to extreme fires and the tornadoes in the midwest-ish area that were all over the news at their relative times? Is this just the news industry hyping things up? Or are these just not out of the ordinary?
DR says:
August 10, 2013 at 8:04 pm
“Excuse me, but why is the surface warming faster than the troposphere? Shouldn’t the troposphere be warming at a much higher rate?”
Only if CO2 magically violated Kirchhoff’s Law; and indeed “trapped heat” (decided to thermalize more frequently than to dethermalize).
@Gary Young Pearse –
More compelling evidence of higher sea levels in past warm periods comes from the following:
1. Ostia (Rome) and other harbors in the Mediterranean that are now high and dry today were flourishing ports during the height of the Roman Empire. (The argument that Ostia’s harbor was silted up by the Tiber is untrue because the river did not empty into it, and other harbors had no rivers adjacent to them.)
2. Venice was only founded in the sixth century because before that, the islands it sits on were well under water.
As for CO2 at 399.5 ppm, or 400 ppm – or even 1,500 ppm as in commercial greenhouses – I can only say,”So what? Bring it on!”
@DirkH and George Smith
I did not press the sarc/off button.
Seriously, this should be the Louisville Slugger to beat over the head of AGW. The non-existent ubiquitous “hot spot” is THE main tenet of Anthropogenic Global Warming; the “fingerprint”. Lo the last 25 years of following this whole thing, it was the enhanced “greenhouse effect” that kept my attention. Somehow it has been conveniently ignored now that it doesn’t work as advertised.
I know Anthony will not allow anyone to guest post on the subject, but how is it that even John Christy acknowledges the missing hot spot as a real head scratcher for him and his colleagues, yet anyone questioning the idea of the GHE are treated like lepers.
I don’t recall seeing this new paper by Christy and Douglass being mentioned by WUWT. IMO it should be front and center.
http://hockeyschtick.blogspot.com/2013/08/new-paper-finds-fingerprint-of-man-made.html
Excellent: http://www.sciencedirect.com/science/article/pii/S0272494411000867
• http://dx.doi.org/10.1016/j.jenvp.2011.12.002
Dead indoor plants strengthen belief in global warming
• Nicolas Guéguen
“Abstract
Studies have revealed that heuristics and accessible schemas may affect people’s judgments about global warming. In two studies, participants were asked to report on beliefs regarding global warming while seated in a room in which a small tree or several trees had been placed. In one experimental condition, the tree possessed its foliage whereas in the other, the branches were bare. It was found that participants were more likely to believe in global warming in presence of the tree without foliage (Study 1), that this belief increased in presence of three rather than one tree without foliage (Study 2), and that other beliefs not related to global warming were not affected by the experimental conditions. These results reveal that surrounding physical cues do affect beliefs about global warming. The spreading activation theory is used to explain these results.”
Game, Set, and Match?
Check Mate?
Back when I entered this fight in 2009 and lost a major battle against a national Carbon(Carbon Dioxide) Tax I began to pray.
House Passes the 1,200-page Climate Bill that Congress was Not Allowed to Read. Despite heated objections by some Republicans, the unread 1,200-page Waxman-Markey climate bill was passed 219-212 in the House on Friday. June 26, 2009
“WASHINGTON — Landmark legislation to curb U.S. greenhouse-gas emissions was approved by the House of Representatives in a close vote late Friday, securing an initial victory for a cornerstone of President Barack Obama’s agenda.
The 1,200 page bill — formally known as the “American Clean Energy and Security Act” — will reach into almost every corner of the U.S. economy. By putting a price on emissions of greenhouse gases, such as carbon dioxide, the bill would affect the way electricity is generated, how homes and offices are designed, how foreign trade is conducted and how much Americans pay to drive cars or to heat their homes.
The House climate bill, approved by a 219-212 vote Friday evening, would mandate that 15% of the nation’s electricity come from renewable sources such as wind and solar power by 2020, potentially expanding the market and profit potential for companies in those sectors. Towards that goal, it seeks to boost nascent industries such as wind-generated electricity and solar power.”
http://online.wsj.com/article/SB124602039232560485.html#mod=rss_Today's_Most_Popular
What to do, what to do? Blog and Pray.
WUWT became a daily utility to spread my message, and a very useful utility at that, as long as I was being put up with. I noticed from solar activity updates the Sun started going into a bit of an extended slow period and I prayed it would stay that way for a long time. Little did I know it would.
I was reading articles of serious cold spells occurring around the globe about that time. I believed if the Sun stayed in a low activity phase, the planet would get cold enough to teach the man-made global warming crowd a lesson the would never forget. Even though virtually everyone at the time said the Sun didn’t affect climate and temperature, I still checked it daily and weekly, and cheered when the number of sun spots were low. So many days of a blank Sun passed. It was beautiful.
November 2009 we got an early Christmas present, Climategate emails, that helped block further congressional action on the Cap and Trade bill. But I knew what it would take to de-program an entire nation brainwashed by mainstream media into believing Climate Change was peoples fault. I continued to cheerlead a low output Sun even to this day.
Was it just dumb luck and good timing another Dalton Minimum was under way? It sure is helping out in the de-programing process. Or is some celestial consciousness really listening to some of us, acting on our prayers?
What if a cooling world results in a drop of atmospheric co2 over the years to come? That would be wonderful irony if co2 never rises above the dreaded 400, on top of which it would end the co2 debate forever.
Restless 1 says:
August 10, 2013 at 8:23 pm
I have to wonder. Is Hawaii the best place for global CO2 measurements?
Pick one of these answers: Yes, No, Maybe, It depends.
In the WUWT search box (near the top on the right) type in Mauna Loa. Read all the posts and comments and follow all the leads therein.
Also, go here:
http://www.esrl.noaa.gov/gmd/ccgg/trends/
and here (one of the links in the above):
http://www.esrl.noaa.gov/gmd/ccgg/about/co2_measurements.html
Here are the subject headings:
Summary
Infrared absorption.
Mole fraction in dry air
Calibration of the instrument.
Target gas.
Data selection for background air.
Auxiliary measured variables
How we calibrate the reference gases.
Replication of the field measurements
Observed variations of CO2 in the atmosphere.
Further reading
imjak @ 8:30 almost answered his own honest question, leaving out all the nutcases hyping CAGW except the news industry. It is a long list.
Not sure what extreme fires are but think the wording is a clue that the questions are not really “honest.”
Sorry folks global warming has not flatlined. Randene Neill a Global TV News anchor in Vancouver BC said the flash floods in Colorado were caused by global warming climate change, so there. That is all the proof I need.
Do I have to use sarc on.
The next logical step is to finally place the “CO2 must produce some warming” belief/assumption under the microscope for detailed critical examination, as every indication is that it doesn’t have any effect whatsoever.
Al Gore should be proud he once again saved the world from eminent doom.
“Excelsior!”
George E. Smith says;
“Of course it doesn’t matter to you; because as a smoker, you won’t be around in 200 years.”
I hate to break the bad news to ya George……None of us will be.
Dennis Dunton said, “I hate to break the bad news to ya George…”
Awww Dennis Dennis Dennis… it was meant as light satire.
Makes me wonder if I needed to put a /s at the end of my “Excelsior!” post?
Other_Andy @ 4.05:
As far as I am aware…
HadCRUt3 used actual station data. As there are no recording stations in the Arctic (as such) then no Arctic temps were used. However, HadCRUt4 extrapolates from stations (sometimes a thousand miles away) and ‘bestguesses’ likely Arctic temps, just like GISS does. This therefore makes HadCRUt4 a ‘fiddle’ and HadCRUt3 actually better. I’ll stand corrected if all that is not quite right, but that’s what I’m given to understand.
I don’t know if this is weather or climate but I’ve never seen anything like this here at the Colorado – New Mexico border, and we live here more than 20 years.
For the record: it is 1:40 AM, August 11th, 2013, and the temperature outside is 44 degrees Fahrenheit (7 degrees Celsius).
This, in the very middle of summer, third night in a row. Why this rather extreme summer cold is not in the news?
It seems that the more evidence points to a climate change “meh”, the louder and more shrill the machinations of alarmists. As if they are screaming “nothing to see here” directly onto the ear of the collective consciousness. But, like the average teenager, the louder you holler, the more likely they will look at what you are trying to dissuade them from.
Alexander Feht says:
August 11, 2013 at 12:43 am
“For the record: it is 1:40 AM, August 11th, 2013, and the temperature outside is 44 degrees Fahrenheit (7 degrees Celsius).”
Try this;
Rocket Stove Mass Heater
rocket mass heaters in a nutshell:
heat your home with 80% to 90% less wood
exhaust is nearly pure steam and CO2 (a little smoke at the beginning)
the heat from one fire can last for days
you can build one in a day and half
folks have built them spending less than $20
the verbose details on rocket mass heaters:
This could be the cleanest and most sustainable way to heat a conventional home. Some people have reported that they heat their home with nothing more than the dead branches that fall off the trees in their yard. And they burn so clean, that a lot of sneaky people are using them illegally, in cities, without detection.
When somebody first told me about rocket mass heaters, none of it made sense. The fire burns sideways? No smoke? If a conventional wood stove is 75% efficient, doesn’t that mean the most wood you could possibly save is something like 25%? How do you have a big hole right over the fire and not have the house fill with smoke? I was skeptical.
And then I saw one in action. The fire really does burn sideways. The exhaust is near room temperature – and very clean. The smoke doesn’t come back up because a huge amount of air is getting sucked into the wood hole. Neat! I sat on one that had not had a fire in it for 24 hours – it was still hot!
http://www.richsoil.com/rocket-stove-mass-heater.jsp
Other_Andy says:
August 10, 2013 at 4:05 pm
What are the “HadCRUT4 adjustments”?
The ones that were necessary for the temperatures to show a rising trend over the last few years.
Robert of Ottawa says:
August 10, 2013 at 5:14 pm
Tiredoc says: @ugust 10, 2013 at 4:52 pm
I wonder what the warmist parties are like nowadays
The warmistas do not give an eff. They use global warming as an excuse for socialist policies. It’s that simple. Yes, it is political and launched by the left. Lysenko anyone?
You have the incorrect tense. “The warmistas do not give an eff. They useD global warming as an excuse for socialist policies. It’s that simple.”
Those socialist policies are now in place so there is no need for ‘warmistas’ who will now see their funding reduced. As far as the politicians are concerned the battle is over – hence their continual mantra the science is settled.
Alexander Feht says:
August 11, 2013 at 12:43 am
I don’t know if this is weather or climate but I’ve never seen anything like this here at the Colorado – New Mexico border, and we live here more than 20 years.
For the record: it is 1:40 AM, August 11th, 2013, and the temperature outside is 44 degrees Fahrenheit (7 degrees Celsius).
This, in the very middle of summer, third night in a row. Why this rather extreme summer cold is not in the news?
———
Cold is not in the news because it is ‘off-message’ for the Administration and the US media only reports what they are allowed to report by the Administration.
Ian W says:
August 11, 2013 at 1:16 am
“Cold is not in the news because it is ‘off-message’ for the Administration and the US media only reports what they are allowed to report by the Administration.”
We don’t have a free mainstream media press in America anymore. Most people realize this. Once CNN got 15 million viewers on a Larry King prime time show. Now that same time slot for Piers Morgan gets 500k if he’s lucky.
The MSM has become a cover-up arm for government lies and propaganda. No matter. People who work at those corporations are getting what they deserve, the worst pay and bonuses ever.
Robert of Ottawa says:
August 10, 2013 at 4:10 pm
“A lie told often enough becomes the truth.”
variously attributed to Lenin (I doubt) Goebels (possible) but the most unlikely is William James (1842-1910) The father of modern Psychology “There’s nothing so absurd that if you repeat it often enough, people will believe it.”
———————————————————————–
Doesn’t even make sense – in fact it means the exact opposite of what Goebels is alleged to have said. It’s also so badly worded there’s no way an educated psychologist would say something like that.
Here’s a version that actually makes sense, from thinkexist.com:
“There is nothing so absurd that it cannot be believed as truth if repeated often enough.”
george e. smith says:
August 10, 2013 at 8:11 pm
Well the first two graphs of CO2 at Mauna Loa, demonstrate the falsity of a common claim of the CO2 warming alarmists; that CO2 remains in the atmosphere for 200 years. The second detailed data plot, shows that the annual CO2 “cycle” amplitude (at ML) has an amplitude of 9 ppm p-p. It takes 8 months for that 9 ppm increase to occur, but all that excess CO2 is removed in just 3 1/2 months. If we place the total excess CO2 at 120 ppm (400-280) over the supposed “equilibrium” level of 280 ppm, then all of that would be removed in 120 / 3.5 months , if the CO2 contributory mechanisms, were all shut down. That is 34.3 months, which would be the time constant of a simple exponential decay process, which fits many physical processes. so if all sources were shut down, 99% of the CO2 excess, would be removed in five time constants, or 14.3 years.
I don’t think that argument works. It assumes that there would not be a similar fluctuation on the way down. But there would be, because NH plant growth does not continue all year, at least not at the same level. The mechanism of decline independent of the annual cycle would be something other than plant growth.
CO2 Is it not regulated by plant life ?I wonder how high the CO2 level was during the ice age when plant life was at a low?
400 ppm
What evidence do we have that nature works in base 10?
It is a totally meaningless ‘milestone’
And at 700ppm, Kenji will still be saying Ho Hum ZZzz
Plants will have an even wider grin., and much greener leaves.
And Hansen will still be predicting doom……. 20 years down the track.
AlGore’s bank balance from the scam will still be high enough for him to own his mansion by the sea.
You just wait til it actually hits 400ppm. It will be a calamity. Meanwhile during a part of the Ordovician ice age co2 was at 3,000ppm! Climate science is Alice in Wonderland science. Up is down and down is up! Co2 is a heat trapping gas, unless it is not isnot. It’s now the main climate driver at 300ppm.
Or I should have said:
Makes no difference anyway.
I cannot find an answer:
Is there a pro-AGW website that explains how CO2 is warming the oceans below 700m? Is there one that explains the mechanism? Anyone? Thanks.
Does HadCRUT4 say that 1998 was NOT the hottest year on the record?
Alexander Feht says:
August 11, 2013 at 12:43 am
1) The CO floods and CA fires are more visual.
2) Talking about cold when everyone “knows” the world is warming will confuse readers and viewers.
3) It’s kinda chilly elsewhere. This AM’s low near Concord NH was 50F (10C). Nowhere close to a record (39 in 1974 – 4C).
Hmm, there was one colder Aug 11 in my records:
Anthony, for perspective you might want to show some of the climate extremes during the Holocene. I have listed a few of them here. All occurred when co2 was below the safe level of 350ppm. We had mega droughts, ice free Arctic Ocean and other abrupt climate changes.
“If you tell a lie big enough and keep repeating it, people will eventually come to believe it. The lie can be maintained only for such time as the State can shield the people from the political, economic and/or military consequences of the lie. It thus becomes vitally important for the State to use all of its powers to repress dissent, for the truth is the mortal enemy of the lie, and thus by extension, the truth is the greatest enemy of the State.”
Goebbels (according to http://thinkexist.com/quotes/joseph_goebbels/)
The corn, soybean and wheat crops have been treated to favorable weather conditions recently. Tomorrow, we get the USDA August crop report, which will estimate yields for 2013 based on their latest data.
As you know, the US had a drought at this time last year. Fortunately, the increase in CO2 lessened damage to the crops during the growing season of 2012.
Heavy rains early in 2013 ended that drought in the Cornbelt but ironically, the cool and wet Spring caused big planting delays, especially in the Western Cornbelt. The weather dried out enough to get the crops planted in June. Recently, we’ve started to get too dry in several regions but thanks too unusually cool weather and high CO2 levels, the crop ratings have remained high.
In fact, the amount of corn and soybeans rated good and excellent went up 1% in last weeks crop rating report which is a bit unusual at this time of year.
Both crops are rated 64% good to excellent which is above average for early August.
My forecast for the next 2 weeks is for the weather to turn much drier in the key growing regions/Cornbelt with temperatures climbing closer to normal…….leaning warmer west and cooler east/south vs average
Good subsoil moisture will assist corn, which pollinated(2 weeks late in the WCB) with almost ideal weather and will continue filling kernels now. Dry weather the rest of this month, however, will keep national corn yields from breaking a record this year.
Soybeans are entering their key developmental phase, pod filling. A dry August will cause the crop to deteriorate slowly even though the final crop size will still be decent. A huge world demand base for beans mean we need near record crops here in the Northern Hemisphere and also in the South America.
Speaking of South America, a July freeze severely damaged Brazil’s sugar crop and the coldest air mass since 1994 threatened the Coffee crop. Only far southwest/minor parts of coffee(higher latitudes in SA) saw frost damage, meaning Parana. Sao Paulo and Minas Gerais dodged the frost bullet as the cold air mass stalled in Parana.
Numerous frosts in the 1970’s resulted in the coffee growing region of Brazil shifting farther north, closer to the equator. The last major frosts(2 of them) were in 1994.
The last major freeze to damage the US corn and soybean crops was in 1995. In any 1 year, the chance of a September freeze causing significant damage is around 5%. This year, with the cool weather/late planting, delayed maturity and long lived weather pattern featuring upper level ridging to the west of the growing regions and troughing to the east(steering cool, Canadian air masses in) the chance of September freeze damage is at least 30%.
The Ghost Of Big Jim Cooley says:
August 11, 2013 at 4:26 am
“I cannot find an answer:
Is there a pro-AGW website that explains how CO2 is warming the oceans below 700m? Is there one that explains the mechanism? Anyone? Thanks.”
Jim’s Ghost: I’ve been asking the same thing for months now. No reasonable explanation from either side of the fence has been offered. I recommend placement in the “Pure Fantasy” file.
One thing I’ve noticed that I haven’t seen discussed is the apparent shift in the Arctic melt season. Where, according to a 1979-2006 baseline, the average ice maximum occurred March 5-10th. Looking at the last six years, it appears this maximum is now March 16-27th, some two weeks later. The minimum, the end of the melt, appears to have shifted later as well by half that amount. It is easier to see in the NORSEX chart herewith 1/3 monthly increments:
http://arctic-roos.org/observations/satellite-data/sea-ice/observation_images/ssmi1_ice_ext.png
The US drought of 2012 came after setting a record for going the longest in recorded history without a widespread drought in the US Cornbelt……..24 years.
The previous one was in 1988.
Midwest droughts are much more frequent during La Nina’s(less frequent during El Nino’s).
As we know, La Nina’s are also more common when the PDO is in the negative/cool phase and El Nino’s when the PDO is in the positive/warm phase. La Nina’s have a cooling effect on global temps and El Nino’s a warming effect.
The recent shift to the negative PDO, is causing more La Nina’s than in the 80’s/90’s and the US Cornbelt is at a higher risk to see a couple more droughts this decade because of it.
Of course this will be blamed on climate change but ironically, global warming/El Nino’s effect on growing season conditions in the Midwest is positive/favorable.
Global cooling/La Nina’s and a negative PDO correlate with an increase in droughts.
george e. smith (August 10, 2013 at 8:11 pm) “If we place the total excess CO2 at 120 ppm (400-280) over the supposed “equilibrium” level of 280 ppm, then all of that would be removed in 120 / 3.5 months , if the CO2 contributory mechanisms, were all shut down.”
Smoking Frog (August 11, 2013 at 2:35 am) is correct. The george e. smith scenario assumes that we would have permanent summer in the NH and if that happens, that trees in the NH could just keep growing indefinitely (require no seasonal cycle for continued growth). The other problem is that the equilibrium is going to be higher than 280 thanks to manmade CO2. Maybe not a lot more, but 300 or more seems reasonable. The correct calculation is to look at the annual rise and the percentage of CO2 above equilibrium that gets removed each year. Then assume an exponential decay with that delta. It means that in less than 40 years we would be half way back to equilibrium.
Eric1skeptic:
At August 11, 2013 at 7:04 am
http://wattsupwiththat.com/2013/08/10/what-the-year-of-living-dangerously-at-nearly-400-ppm-of-co2-in-earths-atmosphere-looks-like/#comment-1386926
you assert
Well, you may be right, but you are probably wrong.
You are assuming the observed recent rise in atmospheric CO2 concentration is entirely caused by the emission of CO2 from human activities. Your assumption may be completely right or completely wrong.
On of our papers
(ref. Rorsch A, Courtney RS & Thoenes D, ‘The Interaction of Climate Change and the Carbon Dioxide Cycle’ E&E v16no2 (2005) )
produced six carbon cycle models. Three assumed the recent rise in atmospheric CO2 concentration had an anthropogenic cause and the other three assumed the rise had a natural cause.
Each of the models in the paper perfectly matches the available empirical data (to within the measurement error) for each year without use of any ‘fiddle-factor’ such as the ‘5-year smoothing’ the UN Intergovernmental Panel on Climate Change (IPCC) uses to get its model to agree with the empirical data.
So, if one of the six models of this paper is adopted then there is a 5:1 probability that the choice is wrong. And other models are probably also possible. And the six models each give a different indication of future atmospheric CO2 concentration for the same future anthropogenic emission of carbon dioxide.
Data that fits all the possible causes is not evidence for the true cause. Data that only fits the true cause would be evidence of the true cause. But the above findings demonstrate that there is no data that only fits either an anthropogenic or a natural cause of the recent rise in atmospheric CO2 concentration. Hence, the only factual statements that can be made on the true cause of the recent rise in atmospheric CO2 concentration are
(a) the recent rise in atmospheric CO2 concentration may have an anthropogenic cause, or a natural cause, or some combination of anthropogenic and natural causes,
but
(b) there is no evidence that the recent rise in atmospheric CO2 concentration has a mostly anthropogenic cause or a mostly natural cause.
Hence, using the available data it cannot be known what if any effect altering the anthropogenic emission of CO2 will have on the future atmospheric CO2 concentration.
Richard
The Ghost Of Big Jim Cooley says:
August 11, 2013 at 4:26 am
I cannot find an answer:
Is there a pro-AGW website that explains how CO2 is warming the oceans below 700m? Is there one that explains the mechanism? Anyone? Thanks.
=====================================
I’m Sure Santa Claus will leave that in your stocking this christmas.. 😛
Assuming you still believe in Santa Claus, that is…..
Presumably the CO2 levels are falling because it is summer in the Northern Hemisphere, which is the season of growth for most plants? Summer in the Southern Hemisphere does not have the same effect due to the much lesser surface area of land.
I am surprised the warmists have not banged on about that the same way they bang on about everything else AGW.
Here in the UK we have had a heatwave, which predictably has ended, currently 16 Celsius, showers and grey skies. I want to know when to plant the grape vines that I was told would flourish here when CO2 levels rose?
Most plants don’t do well when CO2 is less than ~185 ppmv, and at the beginning of the Industrial Revolution, it was at ~285 ppmv, giving them about 100 ppmv of “breathing space”.
Now CO2 is ~400 ppmv, which more than doubles the amount of utilizable CO2 plants need by giving them an additional 115 ppmv.
This anthropogenic augmentation of CO2 is the best thing we’ve ever done for plants. And since plants are at the base of our food chain, it’s a win-win situation for us humans, too.
RockyRoad:
re your post at August 11, 2013 at 7:48 am
http://wattsupwiththat.com/2013/08/10/what-the-year-of-living-dangerously-at-nearly-400-ppm-of-co2-in-earths-atmosphere-looks-like/#comment-1386939
I refer you to my post at August 11, 2013 at 7:22 am
http://wattsupwiththat.com/2013/08/10/what-the-year-of-living-dangerously-at-nearly-400-ppm-of-co2-in-earths-atmosphere-looks-like/#comment-1386929
Richard
Where are the Arctic-ice town-criers? Is this going to be their summer of discontent?
Mr Watts, The great attraction of your site lies in the fact that you go to great lengths to prove, with existing scientific facts, how wrong these silly statements by the warmists are. How you have time for such research on so many subjects in the GW field is a mystery, but it is certainly what puts your site head and shoulders above all others, and gives us lesser mortals the ammunition we need to refute the endless stream of silly statements put out by people who call themselves scientists and supported by a poodle press. Thank you for the fantastic job you do for those of us who like to feel we live in a world of sanity.
Is there a pro-AGW website that explains how CO2 is warming the oceans below 700m? Is there one that explains the mechanism? Anyone? Thanks.
—————
Why not.. A few warm years in the 1980s caused so much warming that it heated the ocean well below the 700m mark.. Its basic thermodynamics where you carry the one (Al Gore) and then multiply it by 25 000 (University educated grant seekers)..
Its a very complex formula that requires the progressive secret spy ring to fully decipher..
In order to get one you must provide proof that you have never watched Fox News or held a job that pays an hourly wage.. You must have rich parents willing to support you right up to, but not including actually giving you a job..
RIchard Courtney: I’m accept for sake of argument (probably incorrectly) that all the increase in CO2 is anthropogenic.
Why?
Because when a Warmista makes that claim (and they always will), I refute their scaremongering with my assertion that CO2 is great for plants and eventually humans and, according to this thread, has no negative impact on weather, and hence climate.
Your comment is correct when arguing against an all-anthropogenic origin for the additional CO2, but conceding the blame game on the human vs natural argument makes it easy to cut them off at the knees–even if ALL of it was anthropogenic, it’s a no-brainer: They lose the CO2 argument 100% of the time–we humans win and Warmistas lose.
If they accepted your argument (again, which I do), it would make pressing the point more difficult and less productive Remember, these aren’t logical people–they “think” with their emotions, much like children, or they’ve been brainwashed. But if you take their “toy” away AND give them something better, they’re happy.
Bottom line: It doesn’t really matter where the additional CO2 came from–it’s a benefit.
Surely the most egregious lie in these claims is the global average temperature.
So now it is 14C?
Was the IPCC not using 14.5C? 3rd or 4th report?
Other teams members 15C at one time?
These anomalies are wonderful tools of misinformation.
Especially when the reference point is carefully undefined and subject to constant correction to suit the cause.And quoted as accurate to 1/10th of a degree.
This is the heart of this anti-humanist religion, it also is the key indicator of systemic fraud.
Intentional misdirection with intent.
I like the preview feature.
RockyRoad:
Thankyou for your post addressed to me at August 11, 2013 at 8:58 am
http://wattsupwiththat.com/2013/08/10/what-the-year-of-living-dangerously-at-nearly-400-ppm-of-co2-in-earths-atmosphere-looks-like/#comment-1386970
in reply to my post at August 11, 2013 at 7:54 am.
For clarity, I point out that
(a) I was responding to the science and not political argument
and
(b) I completely agree with you when you write (pertaining to practicalities and not science of the carbon cycle)
Richard
PS I must now rush to fulfill some duties so please don’t be offended if I fail to reply to any response for several hours.
george e. smith says:
August 10, 2013 at 8:18 pm
Wake us all, if the upper troposphere does start warming faster than the surface.
================
One of the predictions of CO2 GHG warming is that the troposphere will warm faster than the surface. This warming is a result of the increase opacity of the atmosphere to outgoing LW radiation, which will then raise the surface temperatures because the troposphere and surface temperatures are bound by the Lapse Rate. Hand in hand with this prediction is the prediction of the tropical “hot spot” predicted by all climate models.
The spectacular failure of this central prediction of GHG warming is the smoking gun that GHG warming theory is wrong. It makes no difference in science how plausible and explanation is, nor how well it matches known scientific law, nor how many scientists believe a theory is correct.
If a theory makes a prediction and that prediction differs from observation, then the theory is wrong. No ifs, buts or otherwise. The theory that surface temperatures will rise DUE TO CO2 is wrong. Not simply because surface temperatures for the past 16 years have failed to rise in line with CO2 theory prediction, but because the predictions for the warming mechanism do not match observations.
For the surface to warm faster than the troposphere requires that the warming NOT be due to something in the atmosphere, otherwise the warming would first manifest itself in the atmosphere. You cannot increase “back radiation” to the surface without also raising the effective temperature of the troposphere.
As CO2 molecules absorb outgoing LW radiation their kinetic energy is increased, which must raise the temperature of the atmosphere locally according to statistical thermodynamics, because there is a lag time before the energy can be re-radiated. As well, some of the captured LW radiation will be conducted to neighboring molecules, further delaying re-radiation. Thus, for increased CO2 to warm the surface, there must first be a warming of the Troposphere. Since this warming is not occurring, the surface warming CANNOT BE DUE to increased CO2.
In re the NYT piece – they still aren’t conceding anything. Warming is “slowing,” not reversed as we know it to be. The “plateau” (translate: downward progression of temps) will end soon, and then the heating will resume. (Of course it will, maybe 30, 50, 250 years from now – and starting from a lower point than it did after the LIA ended, and probably stopping again well before 1997 temps are reached.) The Sun doesn’t lie, but the NYT does.
We could actually enter another LIA – or even a full-blown re-glaciation – and these gastropods will still claim the globe is warming. Fanaticism cannot be overcome by contrary evidence, because the first tenet of fanatical belief systems is that you do not listen to or acknowledge anything that contradicts your meme – for you, anything contrary simply doesn’t exist even if it slaps you upside the head. Two plus two will still equal -minus three to them, no matter how many times you show them it ain’t so.
There was an interview on CBC radio this morning with a ‘glacier expert’ who appears to be nothing less than a real and famous one. He was asked about the melting of a particular glacier in the Himalayas. He noted that there are green plants emerging from under the glacier, revealed by the pull-back, that are 6000 years old! They were carbon dated.
This was used in the interview (by the interviewer) to demonstrate that things have change so quickly and so rapidly that surely this is a man-made catastrophe. He did not actually support this, he just remained quiet and allowed the interviewer to blather on using the evidence for her purpose.
There were two interesting things: one said, one not said. The one said was that the dating of the plants was to several thousand years ago. The one not said was that obviously it means a few thousand years ago the glaciers were in retreat above the place being uncovered today.
When pressed to express that we should ‘do something about’ this [repeating] state of affairs, he was very reticent. He obviously knows how to get interviewed and have his work used by Al Gore (even) in AIT. He simply said that he was providing information and it was up to the political set to decide what policies should be created and implemented. Brilliant! He was placing right under her nose evidence that the glaciers have been melted back much more than they are today only a few thousand years ago when, according to him, the CO2 level was much lower and stable. He then neatly sidestepped questions aimed at getting him to jump on an anti-CO2 crusade.
We should expect more of this from real scientists who are in need of a living, who do not want to become lightning rods (not everyone does) but who do want to smuggle the real evidence to the public, via the uber-alarmist CBC no less. It was professional meets alarmist. No contest.
“””””……Smoking Frog says:
August 11, 2013 at 2:35 am
george e. smith says:
August 10, 2013 at 8:11 pm
Well the first two graphs of CO2 at Mauna Loa, demonstrate the falsity of a common claim of the CO2 warming alarmists; that CO2 remains in the atmosphere for 200 years. The second detailed data plot, shows that the annual CO2 “cycle” amplitude (at ML) has an amplitude of 9 ppm p-p. It takes 8 months for that 9 ppm increase to occur, but all that excess CO2 is removed in just 3 1/2 months. If we place the total excess CO2 at 120 ppm (400-280) over the supposed “equilibrium” level of 280 ppm, then all of that would be removed in 120 / 3.5 months , if the CO2 contributory mechanisms, were all shut down. That is 34.3 months, which would be the time constant of a simple exponential decay process, which fits many physical processes. so if all sources were shut down, 99% of the CO2 excess, would be removed in five time constants, or 14.3 years.
I don’t think that argument works. It assumes that there would not be a similar fluctuation on the way down. But there would be, because NH plant growth does not continue all year, at least not at the same level. The mechanism of decline independent of the annual cycle would be something other than plant growth……….””””””
“”””””……..
Eric1skeptic says:
August 11, 2013 at 7:04 am
george e. smith (August 10, 2013 at 8:11 pm) “If we place the total excess CO2 at 120 ppm (400-280) over the supposed “equilibrium” level of 280 ppm, then all of that would be removed in 120 / 3.5 months , if the CO2 contributory mechanisms, were all shut down.”
Smoking Frog (August 11, 2013 at 2:35 am) is correct. The george e. smith scenario assumes that we would have permanent summer in the NH and if that happens, that trees in the NH could just keep growing indefinitely (require no seasonal cycle for continued growth). The other problem is that the equilibrium is going to be higher than 280 thanks to manmade CO2. Maybe not a lot more, but 300 or more seems reasonable. The correct calculation is to look at the annual rise and the percentage of CO2 above equilibrium that gets removed each year. Then assume an exponential decay with that delta. It means that in less than 40 years we would be half way back to equilibrium…….””””””
There’s a lot of “assuming”, about what I was assuming, in my back of the envelope calculation.
No need; I specifically stated my assumptions; which were:- (1) All processes contributing CO2 to the atmosphere were shut down; that’s ALL such processes. (2) The CO2 decay followed a simple exponential decay.
Smoking Frog says THAT assumes (I didn’t) continued tree growth. Eric1skeptic didn’t like the 280 ppm number; says 300 is better because of human CO2 additions. The 280 is not MY number, it’s the AGW crowd’s number. And I would swear that I said I assumed ALL CO2 contributory processes were shut down; so nyet on man made increases.
I did assume that the conditions that cause the decline, continued, by stating that a simpe exponential decline occurred. If that is permanent summer, and tree growth, so be it. It is also permanent arctic ocean ice melt.
The annual Arctic CO2 cycle in the atmosphere is three times the amplitude of the ML amplitude, suggesting that increased absorption of CO2 in the ocean (more open water) is the primary CO2 reduction mechanism; not plant growth. In contrast, the south polar CO2 cycle is about -1 ppm (out of phase with NH), and the south pole has neither a plant growth cycle, nor an open water area cycle; it’s likely due to the Antarctica sea ice cycle, which occurs far from the south pole (and is bigger than -1ppm in amplitude).
It’s easy to show that the open ocean continually pumps CO2 into the oceanic depths.
Henry’s Law prescribes how much CO2 can dissolve in the ocean surface waters. The Temperature drops with depth, so CO2 is more soluble in the deeper colder water, so the surface water CO2 moves to where the capacity for CO2 is higher, in the colder deeper waters.
So the surface does not sit there at the Henry’s law concentration of dissolved CO2; it continually pumps CO2 out of the atmosphere into the ocean depths.
When the surface Temperature increases, the Henry’s law concentration will increase, but because of the depletion by the colder deeper water, there isn’t excess CO2 in the surface waters to outgas CO2. In fact seasonal warming of the surface water, increases the Temperature gradient, and enhances the CO2 pumping efficiency.
But smoking Frog, and Eric1skeptic are both correct. In the real world, those processes that add and subtract CO2 in the atmosphere don’t ALL operate continually.
As for the 1-1.5 ppm per year ML increase; there’s no proof that is man made. We are after all just 800 years past the mediaeval warm period, which is the typical climate period delay, between increases in mean global Temperature, and subsequent increases in atmospheric CO2; as is enshrined in the long ice core records.
Typo in there; I should have previewed.
Surface Temperature increase LOWERS the CO2 equilibrium value, NOT increases; but as I said, the surface CO2 concentration is already depleted, by the pumping, so there isn’t excess CO2 to outgas.
I am a former alarmist turned skeptic. Especially after having seen data showing that CO2 was nearly 5 times higher during the Jurassic than it is now… it seems the dinosaurs did just fine with elevated atmospheric CO2.
The sun and volcanic activity actually have a much bigger influence on the climate than anything that humans do. Watch the rest of solar cycle 24 and solar cycle 25. If solar activity continues to remain low during this time, there are going to be many alarmists eating crow. Look for temperatures to stabilize the next couple of years and then begin to drop over the course of the next couple of decades, we might even see New York harbor and the Thames river freeze over in some of the coming winters.
There is something to be concerned about though, if by chance we have a VE6 or greater volcanic eruption during this time, it could trigger a year or two of especially frigid temperatures like the ones we saw back during the Middle Ages and Colonial American times.
Gaill Combs said
“I would opt for Willi Munzenberg”
—————————————-
The name of Willi M sounded familiar and I foun lots in Arhur Koestler book The Invisible Writing,vol.2 of his auto biography Koestler worked under Willi from 1933 to 1940 when Willi was found murdered in a bush near the concentration camp where he and Koestler were .Will was a,member of the communist comintern “was the grey eminence and invisible organiser,…a unique feat in the history of propaganda”
The choice of Ms Combs was the best.
When discussing CO2 variability in the atmosphere, it is well to keep in mind the following facts. CO2 is more than 25 times more soluble in water than oxygen and more that 50 times more soluble than nitrogen. The oceans overall are loaded with CO2, much of it provided by undersea volcanic activity. Conversely CO2 is a very small component of the atmosphere. It has been estimated that the oceans contain 50 to 70 times more CO2 than the atmosphere. As the oceans warm and cool they release and reabsorb CO2, thereby affecting the atmospheric percentages. This is why the CO2 component of the atmosphere follows the temperature fluctuations of the ice ages. The Hockey Schtick blog has referenced some recent papers studying this matter over both the longer and shorter terms.
richardscourtney (August 11, 2013 at 7:22 am), thanks for the tip on your paper. I downloaded and I am reading it now. I will comment or ask questions tomorrow.
Here’s the world at 400ppm:
Hans Rosling’s 200 Countries, 200 Years, 4 Minutes – The Joy of Stats – BBC Four – YouTube
george e. smith (August 11, 2013 at 2:10 pm) “Surface Temperature increase LOWERS the CO2 equilibrium value, NOT increases; but as I said, the surface CO2 concentration is already depleted, by the pumping, so there isn’t excess CO2 to outgas.”
My question is why CO2 is lowest in July when global average temperature is the highest. Part of the answer may be that the ocean temperature does not follow quite the same curve at the global temperature which relies on northern hemisphere land warming in summer.
My understanding is that both sequestering and outgassing of CO2 takes place all the time in various locations on earth that depend on ocean currents to sink or raise cold water. Warm water sinking or rising doesn’t matter too much.
No major hurricane strikes for eight years:
William: This is good news. I do not want to jinx’s us with a comment on the lack of tropical storms in the Atlantic (2013) particularly as my brother lives in the Houston area (Lake Jackson on the coast.)
Coldest summer on record at the North Pole:
William: It appears the Arctic sea ice is going to make a rapid recovery. I cannot imagine how the warmists could explain record Arctic sea ice, record cold temperatures on the Greenland ice sheet and record winters in the Northern hemisphere.
William Astley:
You conclude your post at August 12, 2013 at 12:53 am
http://wattsupwiththat.com/2013/08/10/what-the-year-of-living-dangerously-at-nearly-400-ppm-of-co2-in-earths-atmosphere-looks-like/#comment-1387398
saying
Oh, I don’t need to “imagine”.
I merely assume they will continue to do what they do now; i.e.
they ignore all evidence and iterate their falsehoods.
For a recent example of this behaviour by a warmunist who admits to having been trained at an Al Gore ‘boot camp’, see the behaviour of James B in the WUWT thread at
http://wattsupwiththat.com/2013/08/02/notes-from-a-mole-in-al-gores-climate-leadership-training/
Richard
RIchard, at the beginning of your paper you make this claim: ” Obviously, the net result would be an increase of CO2 production by desorption from the oceans. This is a relatively slow process, because the mass transfer coefficient between the sea water and its surface is relatively low (the rates of both absorption and desorption in the oceans have time constants that are probably of the order of decades). This would mean that a disruption by a temperature rise would result in a relatively slow increase of CO2 production.”
I did not see quantitative support for that claim.. Towards the end you acknowledge: “Convincing, quantitative proof for the existence of an increasing natural flux through the CO2 cycle can not be produced. But there is also no proof that the recent rise of the CO2 concentration in the atmosphere must be attributed solely to anthropogenic emission. The latter is suggested by the evidence presented in Figure 1 in ref.1: that is, the concurrent rise of human emission and rise of CO2 in the atmosphere. But it is contradicted by the evidence presented in Figure 3: that is, the observed annual variance observed and the absence of a direct coincidence between annual human emission of CO2 and the annual pulse of CO2 into the atmosphere. This suggests that other influences are of importance.”
Your first claim is all the support you need for figure 3. But in fact the annual cycle reaches its low in July, the same time that the global average temperature reaches its peak, over 2C above the trough. That is direct contradictory evidence against temperature dependence of CO2. It is likely of course that the biosphere overwhelms temperature on an annual basis. But it cannot be used as evidence that a long term natural temperature rise is responsible for the long term CO2 rise. It suggests the long term factors are not temperature dependent, just like the short term.
eric1skeptic:
Thankyou very much for the interest you express in one of our papers
(ref. Rorsch A, Courtney RS & Thoenes D, ‘The Interaction of Climate Change and the Carbon Dioxide Cycle’ E&E v16no2 (2005) )August 12, 2013 at 2:14 am)
In your post at August 12, 2013 at 2:14 am
http://wattsupwiththat.com/2013/08/10/what-the-year-of-living-dangerously-at-nearly-400-ppm-of-co2-in-earths-atmosphere-looks-like/#comment-1387438
You make two points; viz.
1.
In our paper we state but do not justify that
As you say, this is near the start of our paper. It is an introductory point and we considered it to be understood so it did not warrant a reference (e.g. Newton’s ‘Principia’ is not usually referenced when considering effects of gravitational force).
However, there are many papers which support the contention; e.g.
http://www.netl.doe.gov/publications/proceedings/01/carbon_seq/5b4.pdf
2.
Near the end of our paper we say
You comment on that saying
I am not sure what you are saying in your comment.
It may be that
(a) you dispute our saying “the absence of a direct coincidence between annual human emission of CO2 and the annual pulse of CO2 into the atmosphere … suggests that other influences are of importance”
or
(b) you dispute that temperature may be one of those “other influences”.
Please note that we did NOT use the coincidence of temperature and CO2 having both risen since 1958 as “evidence” of a causal relationship between them: we stated the temperature rise to be one possible “other influence” on the rising atmospheric CO2 concentration. Another possible “other influence” is change to recent surface layer pH as a result of the recent arrival in the surface layer of dissolved sulphur following transport by the thermohaline circulation from undersea volcanism which happened centuries ago. A rise of 0.1 in surface layer average pH would be much too small for it to be discerned but would induce a rise in atmospheric CO2 larger than that observed at Mauna Loa since 1958.
However, the possibility of the long-term temperature effect does exist. This is because the short-term ocean/air exchange is limited by the CO2 in the ocean surface layer but the long-term ocean/air exchange is limited by the transfer rate from the surface layer to deep ocean. Hence, the short-term influence of temperature is not indicative of the long-term influence of temperature. (Incidentally, Bart does not accept this and may want to comment on it here).
I point you to an observation in our paper concerning the ‘seasonal’ variation in atmospheric CO2 which says
In other words,
A.
The dynamics of the seasonal variation indicate the natural sequestration processes of the carbon cycle can easily absorb all – both natural and anthropogenic – emissions of CO2 in each year
but
B.
The rise in atmospheric CO2 concentration since 1958 indicates the natural sequestration processes of the carbon cycle do not absorb all the emissions of CO2 in each year.
The important question is;
Why do the natural sequestration processes NOT absorb all – both natural and anthropogenic – emissions of CO2 in each year when the dynamics of the carbon cycle indicate that the processes can easily sequester them all.
Our paper explains that this question can be answered by assuming the equilibrium state of the carbon cycle has altered.
And our paper explains that using this assumption enables almost any postulated cause of the rise to match the available data. But our paper does NOT determine the cause of the alteration to the equilibrium state of the carbon cycle.
Please note that – as I said above in my post at August 11, 2013 at 7:22 am –
http://wattsupwiththat.com/2013/08/10/what-the-year-of-living-dangerously-at-nearly-400-ppm-of-co2-in-earths-atmosphere-looks-like/#comment-1386929
the anthropogenic emission may be – but probably is not – the cause of some, most or all of the postulated alteration to the equilibrium state of the carbon cycle which explains the observed rise in atmospheric CO2 concentration.
I again thank you for your interest in the paper and I hope this response is a clear and sufficient answer to your questions.
Richard
Mods:
I have posted a reply to the post of eric1skeptic August 12, 2013 at 2:14 am but that reply has vanished.
I write to ask you to find it and also to place on record when I attempted to post it.
I will post it again if it cannot be found.
Richard
Mods:
It has appeared. Thankyou.
Richard
I posted this comment yesterday re the adjustments between Hadcrut 3 and 4 which seems to be quite significant. I looked at several of the peaks and valleys and found all were adjusted upward.
Did the question just get buried in the numerous discussions or is the basis for the adjustment not clearly known? Appreciate comments.
“I did some comparisons on the highs and lows before and after the adjustments for hadcrut and notice significant differences. Did they change the basis? Are they all tenths of a degree above or below 14C. It is noted that the warmest year was changed from 1997 to 2007.
Some noticeable differences both high and low below:
1997 Low -3 = 0.15 after adjustment -4=0.2
2002 high -3=0.6 after adjustment -4=0.67
2008 low -3=0.5 after adjustment -4=1.5
2012 high -3=0.57 after adjustment -4=0.65
2012 low -3=0.18 after adjustment -4=0.25
I am just a novice at this. Can someone explain the significant adjustments upward?”
Catcracking says:
August 12, 2013 at 6:21 am
I am just a novice at this. Can someone explain the significant adjustments upward?”
===========
The Hadcrut 3 temperatures were deviating from climate model predictions. The Hadcrut 4 temperatures better fit the climate model predictions and are therefore more scientifically acceptable.
ferd berple says: @ August 12, 2013 at 7:19 am
The Hadcrut 3 temperatures were deviating from climate model predictions. The Hadcrut 4 temperatures better fit the climate model predictions and are therefore more scientifically acceptable.
>>>>>>>>>>>>>>>>>
Darn it Ferd, now I have tea all over my screen. ROTFLMAO
Ferd,
Thanks for the explanation. I forgot about the post normal science methodology which is widely practiced by the warming advocates. Being an old engineer it never dawned on me that correcting actual data to match computer models would provide a more accurate representation of the actual science. We should apply that methodology and watch things like bridges collapse instead of sticking to actual material strength test data.
Gail , good thing I have ample reserves in my strategic energy storage system to ROTFLMAO
“””””……eric1skeptic says:
August 11, 2013 at 6:42 pm
george e. smith (August 11, 2013 at 2:10 pm) “Surface Temperature increase LOWERS the CO2 equilibrium value, NOT increases; but as I said, the surface CO2 concentration is already depleted, by the pumping, so there isn’t excess CO2 to outgas.”
My question is why CO2 is lowest in July when global average temperature is the highest. Part of the answer may be that the ocean temperature does not follow quite the same curve at the global temperature which relies on northern hemisphere land warming in summer……..””””””
Eric, I thought I had already explained that. In the summer time, the additional open water in the Arctic ocean is another 8-12 million square km, of very cold water, which has been highly depleted of dissolved CO2, by being blocked off from the atmosphere for much of the year. During that time, that ocean ice has blocked CO2 from the water, the Temperature gradient in the water, has pumped CO2 into the deeper waters.
So when the summer melt occurs, you have all that CO2 starved water exposed to the atmosphere. The NOAA plot, (which they have now hidden) shows that the arctic ocean CO2 drops by something like 18-20 ppm during that time; several times the Mauna Loa value, which is in much warmer water.
I have the global 3-D plot of CO2 from pole to pole, for over ten years; but as I said, that graph no longer shows up at that location.
There simply is not a lot of growth cycling, going on in the Arctic ocean, when it is covered with ice, but once ice free, oceanic food blooms, which is why the whales go there in the summertime. I’m sure that aids the depletion of dissolved CO2, which simply accelerated the Henry’s law exchange with the atmosphere.
Yes you do have roiling of the surface waters during storms, but the penetration of storm effects into the depths is minimal. The ocean turnover due to currents, is much slower than the ice melt/regrow cycle.
g.e. smith;
Not to forget that CO2 is a couple of dozen times more soluble in water than (e.g.) O2! It really likes all that open ice-water surface.
Is that an exact quote? The number of negatives is wrong. It should say:
“There’s nothing so absurd that if you repeat it often enough, people will not believe it.”
It’s kind of bollixed either way; it would better have been phrased, “Any absurdity will be believed if repeated often enough.”
richardscourtney (August 12, 2013 at 3:43 am) “Why do the natural sequestration processes NOT absorb all – both natural and anthropogenic – emissions of CO2 in each year when the dynamics of the carbon cycle indicate that the processes can easily sequester them all.”
Richard, thanks for the reply and sorry for my delay in responding. The dynamics have two parts in my understanding. Leafing out of trees of trees consumes a lot of CO2 but I personally can’t quantify it. I have read the CO2 used is double or triple the amount sequestered in the wood but that the leaf mass far exceeds that. The second part is the release of CO2 in the fall, and I am really not sure how that can be so quick (as leaves turn from green to brown and shrivel up). Because of these uncertainties (and gaps in my knowledge) I would not want to speculate on whether the carbon cycle can sequester manmade emissions past the annual cycle.
Suffice to say that the annual cycle cannot be used as evidence either for or against long term natural sequestration of manmade CO2. I hope we can at least agree that there is a sufficient measurement of manmade CO2 to allow fairly accurate estimates of its contribution to atmospheric CO2 and that it represents about double the current observed rise. And from that we can speculate that nature is a sink.
george e. smith (August 12, 2013 at 12:18 pm) “Eric, I thought I had already explained that. In the summer time, the additional open water in the Arctic ocean is another 8-12 million square km, of very cold water, which has been highly depleted of dissolved CO2, by being blocked off from the atmosphere for much of the year. During that time, that ocean ice has blocked CO2 from the water, the Temperature gradient in the water, has pumped CO2 into the deeper waters.”
George, that’s not a bad theory except the timing is a little off. CO2 reaches its trough in July and the open water reaches a peak in September. Furthermore we would expect a lag from the absorption of CO2 in that open water to the measured trough, so we would expect the trough after September.
Eric1skeptic:
I am answering your reply to me which you post at August 13, 2013 at 2:50 am
http://wattsupwiththat.com/2013/08/10/what-the-year-of-living-dangerously-at-nearly-400-ppm-of-co2-in-earths-atmosphere-looks-like/#comment-1388320
You say
But you have and have read the paper I co-authored and which we are discussing
(ref. Rorsch A, Courtney RS & Thoenes D, ‘The Interaction of Climate Change and the Carbon Dioxide Cycle’ E&E v16no2 (2005) )August 12, 2013 at 2:14 am)
It lists all the sources and sinks for atmospheric CO2 and the Short Term Processes are listed there as
That is somewhat more than “Leafing out of trees” and “leaves turn from green to brown and shrivel up”.
You seem to be confusing the processes of the carbon cycle with the dynamics of the carbon cycle.
The dynamics are indicated by the rates of change of atmospheric CO2 concentration.
As I explained with quotation in my post
http://wattsupwiththat.com/2013/08/10/what-the-year-of-living-dangerously-at-nearly-400-ppm-of-co2-in-earths-atmosphere-looks-like/#comment-1387480
that you are replying
And you say
Well, yes, that is what our paper says and what I first wrote to point out in this thread.
However, if we understood the dynamics of the annual cycle of atmospheric CO2 then we would have definitive evidence that the recent rise in atmospheric CO2 is natural or anthropogenic in part or in whole. This is because, as our paper says
You conclude saying
Well, yes, but so what?
Would nature be a “net sink” or a net source in the absence of the anthropogenic emission?
Nobody knows and nobody can know because the system of the carbon cycle is not understood.
As I explained in my post that you are replying.
If such an alteration to the equilbrium of the carbon cycle has occurred then available data cannot resolve if it was induced by the anthropogenic emission or some other and natural effect.
Richard
PS I will now be off-line for several hours so will be unable to make any required reply quickly.
Thanks for your reply Richard. The dynamics are the result of the processes. The relevant annual processes are the biosphere (which I stated as trees leafing out and leaves turning brown, etc) I left out ocean biosphere which should also maximize in the NH summer. I should not have left that process off my list.
But I specifically exclude cold ocean consumption and warm ocean production of CO2. My reason is very simple, the earth’s average temperature peaks in July, but the CO2 troughs in July. The CO2 cannot be lowest as the ocean surface is warmest if overall ocean temperature were a factor in the annual cycle. But I realize the ocean is much more complex than an average, it consists of different areas producing and consuming CO2 throughout the year, particularly consuming in downwelling areas near the poles and producing in warmer locations.
But I doubt the is a major annual factor for the reason I gave above. Nor are 1b, 2b, and 2c in your list. That leaves leaves. My preferred theory is the one from the scientific mainstream which is that leafing out of trees is the primary cause of the annual trough and decomposition causes the annual rise in NH autumn. But again I need to stress that I do not know the processes well enough myself to confirm that and I also acknowledge that there are lots of uncertainties in the science itself.
eric1skeptic:
I am writing to acknowledge your post addressed to me at August 13, 2013 at 5:21 am
http://wattsupwiththat.com/2013/08/10/what-the-year-of-living-dangerously-at-nearly-400-ppm-of-co2-in-earths-atmosphere-looks-like/#comment-1388400
As I said, I do not agree with what you call the “mainstream” view and I could debate it. I choose not to debate it because – as you and I both say – there is no data capable of rejecting almost any hypothesis.
Hence, I merely acknowledge your post and give ‘the last word’ to you in that post. If I have missed something you wanted me to address then please say.
Richard
“””””…….eric1skeptic says:
August 13, 2013 at 2:52 am
george e. smith (August 12, 2013 at 12:18 pm) “Eric, I thought I had already explained that. In the summer time, the additional open water in the Arctic ocean is another 8-12 million square km, of very cold water, which has been highly depleted of dissolved CO2, by being blocked off from the atmosphere for much of the year. During that time, that ocean ice has blocked CO2 from the water, the Temperature gradient in the water, has pumped CO2 into the deeper waters.”
George, that’s not a bad theory except the timing is a little off. CO2 reaches its trough in July and the open water reaches a peak in September. Furthermore we would expect a lag from the absorption of CO2 in that open water to the measured trough, so we would expect the trough after September……..”””””””
At the start of the arctic ice melt in Feb-Mar, it is the dead of winter, and the Arctic Temp is around 243K. The Arctic ocean has been blocked off from the atmosphere by ice, for months, so the colde water Temperature and the Temperature gradient, have pumped surface CO2 to the depths (solubility gradient), so the water immediately under the ice is very cold, and highly depleted of CO2 relative to its Henry’s law equilibrium value.
So when the melt starts, and more open water appears, we have depleted cold ocean water in contact with the highest levels of atmospheric CO2, so the rate of exchange between air and water is accelerated, due to the unbalance from equilibrium.
So CO2 is removed at a faster rate during the early stages of the ice melt, when the atmospheric CO2 excess is highest and the exposed water Temperature is least, and most depleted.
As spring turns to summer, the atmospheric CO2 excess is lowering, the surface waters are warming, which lowers the equilibrium CO2 water fraction, and those warming waters are becoming less depleted due to the continually dissolving CO2; so the exchange process slows down as the summer progresses.
The max and min atmospheric CO2 times occur at roughly the same times as the max and min ice extent.
Also, that CO2 data is for the ML CO2; not the Artic CO2, which has a much greater cycle amplitude, and a different time phase as well.
I’m not up to speed on how the arctic ocean biological uptake is timed, the whales seem to get out of town fairly late in the regrowth phase, judging by the occasional trapping by sea ice.
I’m perfectly happy to entertain anyone’s expert input, as to why the Arctic CO2 cycle is not mostly due to the open ocean water growth and melt cycle; but the available data sure matches that thesis very closely. Certainly much closer than ANY available computer climate model matches the observed surface, and lower troposphere Temperature data.
I can’t prove MY model is correct; but any naysayer can prove me wrong with a single observation that contradicts it.
In 1771 Joseph Priestley the English radical churchman and devoted scientist, lit a candle and put it under a jar. The candle burned for a while then went out. Likewise a mouse placed under the jar soon expired. Other people had noted these events. It seemed to Priestley that the air in the jar had been somehow ‘injured’ by the burning candle and the breathing mouse so that now nothing could live or burn in it. If so, somewhere in nature there must be some way of undoing that damage; otherwise countless candles and mice and other agents since time beganwould have so degraded the air that no life would bepossible on Earth. There was no evidence he argued, that the air was no less wholesomenow than it had ever been. How could that be? What was constanly restoring the quality of the air?
Priestley guessed that green plants were involved, that they were able to return to the air whatever it was that the burning candles and breathing mice had removed or poisoned. To test the idea, he placed a sprig of mint under the jar with the burning candle, which of course soon went out. Priestley gave the mint plenty of time, nearly four weeks, to do what he suspected it would do.
To avoid disturbing the jar, he had to relight the candle by using a ‘burning glass’ to focus the heat of the sun onto the candle wick. It burst into flame,and burnt as brightly as it ever had. Priestley was delighted; he had found out how to ‘restore’ the injured air, and even more, had found that plants carry out this act of resoration all the time, it was agreat moment.
This was during the time of phlogiston chemistry before oxygen, nitrogen and carbon dioxide had been discovered. So even before its discovery it was known that ‘carbon dioxide emissions’ due to combustion and breathing processes were not irreversble and were probably treated by plants and as we know now absrbed in rainwater and seawater.
Phlogiston warmists must realise that injured air can and is being restored.
Robert S says: @ August 14, 2013 at 3:04 am
Thanks
A bit if science history I was unaware of.
Gail Combs says:
August 14, 2013 at 11:21 am
Priestley was in correspondence with Benjamin Franklin. on learning of his results, Franklin wrote, ‘I hope this [rehabilitation of air by plants] will give some check to the rage of destroying trees that grow near houses,which has accompanied our late improvements in gardening from an opinion of their being unwholesome,’