As noted in the July 2013 Sea Surface Temperature (SST) Anomaly Update, the extratropical North Pacific sea surface temperature anomalies (24N-65N, 100E-100W) made an unexpected surge in July 2013. NOAA may make a fuss about this in their State of the Climate Report this month, so I figured I’d better address it.
Before we begin, I first want to note that the Pacific sea surface temperature anomalies, as a whole, still show little to no warming over the past 20 years. Refer to Figure 1. But the models prepared for the IPCC’s upcoming 5th Assessment Report have simulated that the Pacific sea surface temperatures should have warmed about 0.4 deg C in the last 2 decades.
 Figure 1
People are going to try to blame the recent warming event in the extratropical North Pacific on human-induced global warming, but before they do that, they’ll need to explain why the Pacific as a whole hasn’t warmed in 2 decades.
THE EXTRATROPICAL NORTH PACFIC WAS WARM IN JULY 2013
There’s no doubt that the sea surface temperature anomalies for the extratropical North Pacific, based on the Reynolds OI.v2 data, are at record levels. See Figure 2.

Figure 2
Note: The seasonal cycle in the sea surface temperatures there peaks in August, so that’s not the warmest the sea surface temperatures (not anomalies) have been in extratropical North Pacific, but, unless there’s a drop in the anomalies this month, expect the alarmists at NOAA to be chiming in on that a month from now.
Notice, however, how relatively flat the sea surface temperatures had been in the extratropical North Pacific since the early 1990s—prior to the surge. In fact, as shown in Figure 3, the sea surface temperatures of the extratropical North Pacific have warmed at a very slow pace (0.029 deg C/decade) even with the July 2013 reading, while the models indicate it should have warmed at a rate that is almost 7.5 times faster.
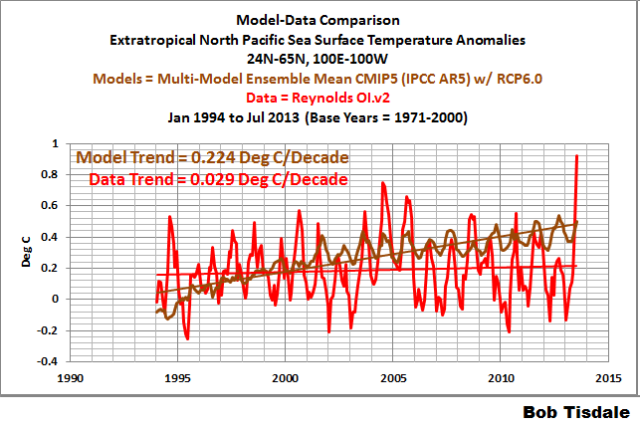
Figure 3
Looking at the weekly data since January 2001, Figure 4, the sea surface temperature anomalies for the extratropical North Pacific during the week of July 31, 2013 were also at their warmest—though not too much higher than the value reached in August 2004. And for those interested, the seasonal cycle in the anomalies there also typically peaks in August.

Figure 4
THE CARRY OVER TO THE NORTH PACIFIC AND THE PACIFIC AS A WHOLE
With a spike that large, the sea surface temperature anomalies of the entire North Pacific are also at record levels (Figure 5).

Figure 5
The Pacific as a whole (Figure 6) also showed a surge.

Figure 6
The tropical Pacific is experiencing ENSO-neutral conditions (not an El Niño and not a La Niña), but the recent rise in Pacific sea surface temperature anomalies (Figure 6) looks like the start of an El Niño event. (And for those wondering, sea surface temperature anomalies in the South Pacific cooled very slightly in July 2013.)
A REMINDER OF THE SOUTH ATLANTIC
When I saw the surge in the North Pacific this month, I was reminded of the curious surge in the South Atlantic sea surface temperature anomalies a few years ago. Refer to Figure 7. Other than the dip and rebound in the early 90s and second smaller dip in the late 1990s, sea surface temperature anomalies in the South Atlantic remained relatively flat from the late 1980s to 2008. Then in early 2009 there was a sudden upward shift. Sea surface temperature anomalies remained elevated for a few years in the South Atlantic and then dropped back to previous levels.

Figure 7
I have yet to find a paper that explains that sudden surge in South Atlantic sea surface temperatures, but I also stopped looking for an explanation a few years ago.
SURGE IN NORTH PACIFIC ALSO APPEARS IN NOAA’s ERSST.v3b DATA
Figure 8 compares the sea surface temperature anomalies for the extratropical North Pacific using the NOAA’s Reynolds OI.v2 data and their ERSST.v3b reconstruction. The ERSST.v3b data is used in the NOAA/NCDC combined global land air plus surface temperature anomaly product. While the Reynolds OI.v2 data is more volatile (a function of the satellite data it also uses), the sudden surge in the extratropical Pacific sea surface temperatures also appears in the ERSST.v3b data, which is based only on measurements from ship inlets and buoys (fixed and floating).

Figure 8
In Figure 9, the extratropical North Pacific data from the ERSST.v3b reconstruction is presented since the start of the dataset in 1854. The data is very volatile there, and it’s prone to sudden shifts and spikes. In addition to the recent spike, the one in the late 1960s also stands out.

Figure 9
There are two very pronounced multidecadal cooling periods in the sea surface temperature anomalies of the extratropical North Pacific. Of course, as shown in Figure 10, the climate models prepared for the IPCC’s upcoming 5th Assessment Report cannot simulate those cooling periods. As a result, they fail to properly simulate the warming that took place, when it took place. And they definitely failed to capture the upward shift in the late 1980s, which was caused by a shift in wind patterns. That well-known shift was then followed by a relatively flat temperature period (Refer back to Figure 3), until the recent upward spike.
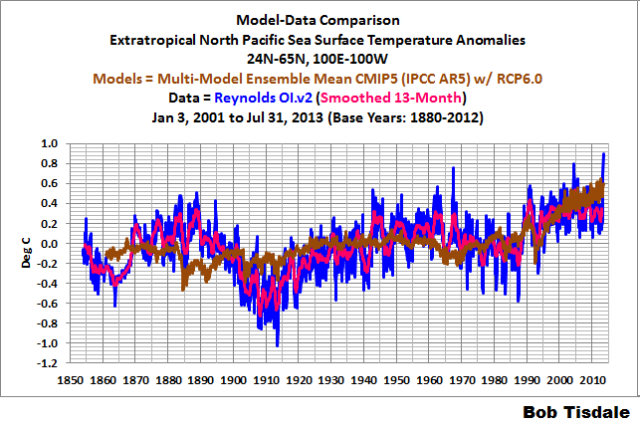
Figure 10
MONTHLY CHANGES OF THAT MAGNITUDE ARE NOT UNUSUAL
The new spike gives us a record high sea surface temperature anomaly in the extratropical North Pacific, so it’s unusual in that regard. But the magnitude of the monthly change from June to July is not unusual. Figure 11 presents monthly change in the sea surface temperature anomalies for the extratropical North Pacific, where the data represents the value of the month being plotted minus the value of the previous month.

Figure 11
However, when we look at the satellite era, starting the data in 1980 for example, Figure 12, the sudden spike is unusual.

Figure 12
You’ll note that the change from May to June 2013 was even greater than the change from June to July. So for those interested in the 2-month change, refer to Figure 13. A 2-month warming of that magnitude is more unusual, but they have occurred in the past.

Figure 13
I’m sure, if you were to evaluate changes for periods of different lengths–3 months, 4 months, etc.–you will find a period when the recent change appears unusual, but then you’d have to consider the fact that the data have been infilled in earlier years and that we do not know the true extent of the monthly variations in decades past. And there’s something else you need to consider, which we’ll get to in a few moments.
WHAT CAUSED THE SUDDEN SURGE?
It will probably be a year or so before someone publishes a paper about it, but I suspect the sudden upward spike in extratropical North Pacific sea surface temperatures was caused by a shift in wind patterns, related to a change in sea level pressure. In other words, it’s likely weather related.
For example: The North Pacific Index represents the sea level pressure of the central extratropical North Pacific (30N-65N, 160E-140W). Trenberth and Hurrel created the North Pacific Index (aka NPI) for their 1995 paper Decadal atmosphere-ocean variations in the Pacific. So the interrelationships between sea level pressure, wind patterns and sea surface temperatures have been known for decades. Trenberth and Hurrel (1995) used the North Pacific Index to explain the unusual variability in the sea surface temperatures of the North Pacific.
Continuing our example, the North Pacific Index data at the UCAR website lags by a few months, so I used the ICOADS-base sea level pressure data from those coordinates from the KNMI Climate Explorer. Figure 14 presents the July “North Pacific Index” sea level pressures for Julys starting in 1981. As shown, the last time the sea level pressures in the extratropical North Pacific were that high was in 1999, during the La Niña of 1998-01.

Figure 14
ANIMATIONS
I created 3 animations while I prepared this post and downloaded one from the Unisys website. You may need to click start them. Animation 1 is the most recent animation of sea surface temperature anomalies from Unisys.

Animation 1
Animation 2 presents the July sea surface temperature anomaly maps from 2007 to 2013.

Animation 2
Animation 3 includes the weekly sea surface temperature anomaly maps from the week centered on June 5, 2013 through July 31, 2013.
Animation 3
Animations 2 and 3 are based on maps created at the NOAA NOMADS website.
And Animation 4 is of sea level residuals since the first of the year from the JPL website here. The unusual warming of the extratropical North Pacific does not appear to have impacted the sea level residuals there—yet.

Animation 4
It’s unfortunate that the JPL sea level residual data is not available in a user-friendly format.
WHAT DOES THE SOURCE DATASET SHOW?
Always save the best for last.
ICOADS is the source dataset used by NOAA and the UKMO for their sea surface temperature products. It was updated in 2009. See the ICOADS webpage here.
The ICOADS data for the extratropical North Pacific, Figure 15, confirms the spike in July 2013—BUT—it shows sea surface temperature anomalies there were comparable in July 2004.

Figure 15
And that means, based on the new and improved source data, the July 2013 sea surface temperatures in the extratropical North Pacific were the same as they were in July 2004. See Figure 16.

Figure 16
Before you jump to conclusions, I believe the NOAA ERSST.v3b data is based on the older ICOADS source data. And keep in mind that the Reynolds OI.v2 data is based on satellite data and ICOADS in situ data from ships and buoys, also likely the older version. The only sea surface temperature reconstruction based on the new ICOADS data that I’m aware of is HADSST3.
WHAT DOES THE FUTURE BRING?
Is the sudden surge in the sea surface temperatures of the extratropical North Pacific an indication of an upward shift like the one in the late 1980s? Or is it simply a short-term spike like the one in late 1960s (and in 2004 based on the source data)? We’ll just have to watch and see what happens. And we’ll have to see what the UKMO has to say with their HADSST3 and HADISST datasets, but they lag the NOAA data by a month (HADSST3) or two (HADISST).
DATA SOURCES
The Reynolds OI.v2 data was downloaded from the NOAA NOMADS website. All other data was downloaded from the KNMI Climate Explorer.
so the bottom line is, we have a serious spike in ocean temperature, but it can be explained away either because it happened before or because the prior trend was zero…. i just want to make sure I have the story straight.
Total guess but I think the same effect that’s keeping the ice in the Arctic Basin is what has caused heating in the northern waters. The UK has had the warmest summer since 2006. Lots of sunshine. Warm waters round our shores and further north. Similar features cooled the North Atlantic last few winters. I’ve watched the Arctic ice regularly at
http://www7320.nrlssc.navy.mil/hycomARC/navo/arcticictn_nowcast_anim365d.gif
It might be a co-incidence but when the UK gets high pressure the ice doesn’t seem to flow out of the Fram Strait. Low pressure and it pours out.
Cool, or is that warm?
Steve T
Hi Bob, many thanks, all good interesting info as usual. Just left the following at your place:-
Warm pool dissipating in the western equatorial pacific?
http://www.bom.gov.au/cgi-bin/oceanography/wrap_ocean_analysis.pl?id=IDYOC007&year=2013&month=08
Normally builds Philippines to Japan then, when sufficiently charged, trundles south and east?
Bit of a daft suggestion but has it gone north and east this time? Indian Ocean seems to have been cool for some time.
Bob, Wouldn’t we expect bouts of warmer surfaces in the North Pacific as the Pacific Decadal Oscillation trends more negative and the winds associated with more La NIna-like conditions drive the tropically heated waters northward? Also do you have any sense of the role of warm subsurface mode waters?
Re: “… it can be explained away … .” [Sedron 1:31PM]
Mr. Tisdale never tried to explain it away. He simply described it and provided data for context. He, in short EXPLAINED it.
Why would Mr. Tisdale try to explain it away?
You are falsely assuming he operates like a pseudo-scientist from the Fantasy Science Club.
He is a REAL scientist.
“so the bottom line is, we have a serious spike in ocean temperature, but it can be explained away either because it happened before or because the prior trend was zero…. i just want to make sure I have the story straight.”
I think it would be far more accurate to say this:
we have a “serious” spike (approximately 1 degree) in one region of one ocean in one month of the year and in the big picture it is local in both time and in area and is rather meaningless in the big picture. That is the “straight story” you seem to be looking for…
If we follow measures of temperature in a thousand different locations, at a single point in time some of those measures are going to be unusually hot and others unusually cold (e.g. Chicago for the past couple of weeks). I’m not sure I understand what the big deal is. Sedron, could you explain? When and where do we define “climate change”?
Why would anyone think a one month spike was suddenly due to the accumulative effects of decades of carbon dioxide emissions? Unless one had an agenda, that is.
The alarmist storylines will be interesting.
jim Steele says: “Also do you have any sense of the role of warm subsurface mode waters?”
Unfortunately, ocean heat content data lags by a quarter so we can’t check to see if the extratropical North Pacific is gaining or losing heat during this until October at earliest.
Animation 1 ain’t animated. GIMP says it only has one layer.
I would expect more meridional jet stream tracks and more equatorward climate zones to have more dramatic regional thermal effects in the oceans just as they do over the continents.
However, that is a global cooling scenario rather than a global warming scenario.
The important feature of this is that it is a regional effect occurring whilst the Pacific sea surface temperatures as a whole have shown little warming for over 20 years.
If the warming anomaly were to spread across the entire Pacific sea surface then I would think differently.
As Bob says we must wait until October at the earliest to get a grip on the significance of this.
Meanwhile my new website devoted to natural climate change is now live here:
http://www.newclimatemodel.com/
The following is new to me, does anybody have any comments re the apparent differences in the strength of the north and south hemispherical jets ?
http://www.stormsurfing.com/stormuser2/images/dods/glob_250.swf
Normal, seasonal, changeable?
PS I have no background on the site or the plots so cannot comment on the validity and would appreciate any confirmation or not.
Note that the melted-down Fukushima nuclear reactors are leaking radioactive groundwater into the North Pacific.
Nah… Couldn’t be…
Those nuclear power plant guys would never withhold information about a radiation leak, or its severity and duration.
Sedron,
What he said was that it was unusual and a bit on the high side but things like this have happened in the past. He also pointed out that the N. Pacific had not warmed much the last 20 years.
You see, the “climate scientists” always say one should never cherry pick and only use 30 years of data as that is climate. Then they turn around and use a local event like a tornado or fire started by lightning or a single month’s temp. of a part of one ocean as “proof” that it must be global climate changie-ness.
In several of the graphs of real data you can see that it is not unusual at all to have jumps up OR down of 0.4 to 0.6 degrees.
Bob, in one spot you said La Nina of 1998-2001, is that correct?
Green Sand: The seasonal cycle in the western equatorial Pacific sea surface temperatures (not anomalies) peaks twice during the year, in May and November, and it reaches minimums in February and August.
http://i41.tinypic.com/1g26vd.jpg
But Kelvin waves (both downwelling and upwelling) along the equatorial Pacific do not appear to be tied to them.
Bill_W says: “Bob, in one spot you said La Nina of 1998-2001, is that correct?”
The La Niña that followed the 1997/98 El Niño lasted from July 1998 to March 2001, according to the new (but not improved) Oceanic Nino Index:
http://www.cpc.ncep.noaa.gov/products/analysis_monitoring/ensostuff/ensoyears.shtml
Regards
Roger Sowell says: “Note that the melted-down Fukushima nuclear reactors are leaking radioactive groundwater into the North Pacific.”
I also thought of the tsunami and the resulting flotsam, but, looking at the animations, there was also short weather-related spike in the sea surface temperature anomalies of the North Atlantic at the same time.
Part of the problem is due to the fact that ICOADS has residual seasonality remaining in the data.
It always spikes in this region in mid-summer because the seasonal cycle is not fully accounted for in this dataset. (which should be something that does not happen because seasonality is an easy issue to account for but someone screwed up and they won’t fix it).
I’ve noted this issue before.
lt sounds like much of the spike has been due to the weather.
With high pressure during the summer comes hot sunny days and calm winds. The sea’s round the UK looked to have warmed up by 3C or 4C within a month. Due to the hot sunny July we have had. Because of the jet stream pattern we have been getting during July. There has been lots of high pressure forming around or just to the south of the Arctic circle. Which brings fine warm weather to these areas during the summer and looks to have warmed up the seas. lf this weather pattern remains going into the winter, then it will start showing its ugly side. Because l think it was this sort of weather pattern that was taking place during the last ice age.
Thanks Bob, and as these are supposed to be anomalies:-
http://weather.unisys.com/surface/sst_anom.gif
http://www.bom.gov.au/cgi-bin/oceanography/wrap_ocean_analysis.pl?id=IDYOC007&year=2013&month=08
you have sent me off to look again at Kelvin and Coriolis!
Have fun!
Green Sand: Thanks for the link on the jet streams. If your question “Normal, seasonal, changeable?” was with respect to the warming event in the extratropical North Pacific last month, I don’t know answer. But if your question is more generic, the answer is changeable.
ENSO has a big impact on the locations of the jet streams…
Mean:
http://www.cpc.ncep.noaa.gov/products/analysis_monitoring/ensocycle/meanjet.shtml
El Nino:
http://www.cpc.ncep.noaa.gov/products/analysis_monitoring/ensocycle/enso_circ.shtml
La Nina:
http://www.cpc.ncep.noaa.gov/products/analysis_monitoring/ensocycle/lanina_circ.shtml
Sedron L,
“so the bottom line is, we have a serious spike in ocean temperature, but it can be explained away either because it happened before or because the prior trend was zero…. i just want to make sure I have the story straight.”
It can’t be explained at all, yet. Are you suggesting that it can be explained by GHG warming? How so? GHG warming is supposed to be gradual, not sudden. Did the CO2 in the atmosphere in the North Pacific suddenly get activated somehow? Was this warmth building in the deep ocean for decades? Hard to explain this by GHG warming, unless you’d like to enlighten us.
Bill Illis: Some of the seasonality in the data is caused by the outdated (1971-2000) climatology NOAA uses. If we use 1982 to 2011, the seasonal component is reduced:
http://bobtisdale.files.wordpress.com/2013/07/figure-x-extratrop-no-pac-with-82-11-base-years.png
It’s still a noisy subset and the spike still shows up loud and clear.
The problem: the Reynolds OI.v2 data starts in November 1981 so they can’t use the standard 1981-2010 for that dataset. We may not see an update of those base years for another decade, unless NOAA creates it from the in situ-based data.
Regards
kadaka (KD Knoebel) says: “Animation 1 ain’t animated. GIMP says it only has one layer.”
It’s working great for me. Try the original at the Unisys website:
http://weather.unisys.com/archive/sst/sst_anom_loop.gif
The seasonal anomalies are the give away. The pattern of increased summer anomalies means something has changed since the reference period, and that can only be increased solar insolation, almost certainly from decreased clouds.
Why would the anomaly be so large this year?
A: The monsoon was early this year with heavy rain in India and South China. This decreased aerosol transport from these areas and resulted in decreased aerosol seeded clouds.
I measure Solar Energy by the length of the cycle, times, the height [integral thereof].
Solar Cycles 21, 22 were huge. Cycle 23 was 75% of 21, 22. Cycle 24 is 25% of 21, 22.
Cycles 21, 22 are the end of extra enormous amounts of energy being created by the Sun.
Last year, Cycle 24 peak energy occurred as the Sun was +23.5 north of the Equator. This warmed the Northern Pacific storing energy. A year later, when the Sun was +23.5 north of the Equator, is when this Pacific spike occurred. We are still in the maximum of Cycle 24. Trade Winds, ocean currents respond to the Solar Cycle maximums by increasing and moving more heat toward the Poles.
Now that the Sun is moving south [still at ~+16 degrees north], the cooling will start.
As Cycle 24 produces less energy, we will enter the Global Cooling period.
Checkout the Southern Pacific Ocean and Antarctica to visualize the lack of energy.
Roger Sowell,
1. Would you be so kind as to provide documentation of your assertion: “the melted-down Fukushima nuclear reactors are leaking radioactive groundwater into the North Pacific.”
That is, what evidence do you have of this?
2. Please tell us specifically the level of radioactivity in this leaking groundwater. Is that level considered dangerous by anyone? If so, who and for what scientifically valid reason?
You would not only be doing me (and likely other WUWT readers) a favor by answering the above questions, you would be doing yourself a favor. As it stands, you are coming off as irrational and uninformed.
Janice Moore
P.S. Since this is WWWWAAAAAY off-topic, I will not be getting into discussion with you on this. If you answer disingenuously or misleadingly, that will speak for itself.
No Bob, sorry for not being clear, it was about the difference in strength between the hemispherical jets. South strong, north weak, inference being movements from equator to north more likely than equator to south or even normal El Nino western equator to east?
Whoa. What we are seeing is the reintensification of the PDO/PNA pattern. Look at the sharp drop in temperatures from Hawaii to California and up the West Coast. Also, over the past several weeks ENSO region sea surface temperatures are growing colder…i.e. more like La Nina.
It’s the same new Climate Regime shift that has dominated since 1998. And the one that stopped Global Warming for 16-years.
Janice, he likes to think he is the key man! And he is, he is a wind up merchant! Do not turn the key! He does not have the strength of intellect to do it himself, so without outside contribution the clock stops!
Tick, tock, tick, tock, tick, tick……
I think it is the Arctic Oscillation, and it has something to do with causing the arctic temperatures to be cooler than normal this year, and this spike in temperatures is almost like a capacitance discharge of heat into the atmosphere as the northern Pacific struggles to maintain equilibrium at the northern Hadley cell boundaries. Alaska saw mild weather too this year.
Note the coincidence of the high SST temperature anomaly south of the aleutians here:
http://weather.unisys.com/surface/sfc_daily.php?plot=ssa&inv=0&t=cur
with the atmospheric high pressure cell here:
http://weather.unisys.com/upper_air/ua_hem.php?plot=n5&inv=1&t=cur
Reply to Janice Moore from August 6, 2013 at 4:11 pm
First, I am not about to engage with you or any others in a sidebar discussion of nuclear power. I will try to guide you to your own research on radioactive waters released from Fukushima into the North Pacific.
Bob Tisdake has presented an interesting change in the pertinent water surface temperature, and at least to me, opened the floor for possible causes. My comment, to which Mr. Tisdale responded most politely, was obviously intended in jest. Apparently, you did not see it as a jest.
“1. Would you be so kind as to provide documentation of your assertion: “the melted-down Fukushima nuclear reactors are leaking radioactive groundwater into the North Pacific.””
Well, Janice Moore, I recommend you perform an Internet search on the keywords “cesium” and “fish” where you will likely find that fish caught recently in the ocean near Fukushima had more than 7,000 times the allowable safe limit for such radioactive materials.
“That is, what evidence do you have of this?”
You might also want to do a search for “Fukushima” today, since this being August 6 and the 68th anniversary of the atomic bomb at Hiroshima, several news outlets reported the Japanese nuclear regulatory agency (Janice, is that sufficiently authoritative for you?) today stated that additional radioactive water from the Fukushima reactor melt-downs is indeed breaching containment and headed for the ocean.
Do your own research, Janice.
Don’t expect any additional response from me when you use such obnoxious phrasing. If you choose to be civil, people might respond to you.
For animation #1 I right clicked and opened in a new window.
It opened running.
#s 2 ,3, & 4 ran in-place so no issues.
They too open in a new window as running, if there is the need to do that.
—————————-
Thanks, Bob.
I am hoping this does something to break the hold of the ongoing Neutral / Negative ENSO. One can hope ….
We think there’s a 20 year lag in SST increases which is why we’ve detected none until now.
/sarc
Thanks for another wonderful post, Mr. Tisdale. Your thorough discussion is a satisfying read. As regards what the spike means, well, a spike is a spike.
From Bob Tisdale on August 6, 2013 at 3:51 pm:
Upgraded the browser to the latest, Iceweasel (Firefox) 22, and it and another browser still both agree, it ain’t working.
But with further testing, it was how you called it out.
URL with right-click, View Image:
http://bobtisdale.files.wordpress.com/2013/08/animation-1.gif?w=640&h=480
Doesn’t work, only first layer loads.
Plain URL, as used with right-click, Open Link in New Tab:
http://bobtisdale.files.wordpress.com/2013/08/animation-1.gif
Works.
You also called out the width on the other 3 animations, but all are actually smaller than the requested 640 width, and the tape measure says there’s no difference between in-page and View Image (100%) widths, so the requested 640 up-sizing appears ignored.
But the first one would be a down-sizing from 800 width, which would have to be done to all layers, and apparently only the first gets done before it quits.
Could you possibly just specify the size using the page’s HTML, in the image tag, instead of an URL call-out? A resized smaller working animation for in-page linked to the full size original should also work.
“Figure 11 presents monthly change in the sea surface temperature anomalies for the extratropical North Pacific, where the data represents the value of the month being plotted minus the value of the previous month.”
Hi Bob, I’m glad to see you’re getting into looking at rate of change of temperature. When all the excitement is about climate _change_ it always seems odd to me that hardly anyone is actually looking at the change.
As you demonstrate here, plotting the _change_ makes it a lot easier to study change rather than trying to guess it by plotting the temperature time series and squinting at it.
Nice work.
This is one article from earlier today discussing recent news from Fukushima…http://news.msn.com/world/radioactive-water-may-overflow-at-japan-plant
Notice all of the tanks placed everywhere. They have a large amount of radioactive water stored in above ground storage tanks. Another powerful quake in that area could be serious, especially with one building whose large concrete foundation was turned into a huge storage tank.
Roger Sowell:
re your post at August 6, 2013 at 5:01 pm.
http://wattsupwiththat.com/2013/08/06/about-the-unusual-warming-event-in-extratropical-north-pacific-sea-surface-temperature-anomalies/#comment-1382904
This is a science blog. It is NOT a forum for ignorant idiots to make unsubstantiated assertions.
You made a series of unsubstantiated assertions and when asked to justify them you replied
and added an unfounded insult to a lady whose shoes you are not worthy to lick clean.
The only “obnoxious” thing is your reprehensible behaviour.
In the unlikely circumstance that you can provide evidence for your assertions then provide it: that is the ONLY acceptable behaviour in a scientific discussion.
Setting homework does not ‘cut it’. Simply, put up or shut up.
And apologise to the lady.
Richard
Cloud cover less? Wind less? Blocking Highs? Less ice/ water transported out of the Arctic?
I’m not quite sure i understand the ‘strong’ reactions to Rogers Sowell’s comment. Bob Tisdale replied in a polite, and more importantly, factual manner. If i understand correctly, he even mentioned that he thought about a possible relation, but noticed another “weather-related spike” in the North Atlantic, which makes a connection between these two events unlikely.
When i first read Mr. Sowell’s comment (albeit written in jest), i too found the possibility of an effect of radioactive water leaking into the ocean (even if only on the instruments) worth considering. However, i immediately dismissed the possibility, due to the fact that Mr. Tisdale has pointed out the similaritiy with recorded ‘upward spikes’ in previous years.
Unlike most events related to climate change, the Fukushima melt-down can only be called ‘unprecedented’, as in, there is no precedent of this magnitude for a repeated (or perhaps continuous) leakage of highly contaminated water into the ocean.
Bob Tisdale, i’m a great admirer of your work, if you ever wonder if your efforts are worth it, rest assured, they are. Please, continue to be outstanding. Thanks a lot.
Bill Illis (August 6, 2013 at 3:25 pm) wrote:
“[…] the seasonal cycle is not fully accounted for in this dataset. (which should be something that does not happen because seasonality is an easy issue to account for but someone screwed up and they won’t fix it).”
leaving it messed up
fits their bad-a** image better
they smugly think:
“we bad”
“we don’t care about the truth — we can just ignore that — we have a message to push…”
Ah, Richard S Courtney returns! Did you enjoy your time-out? I’m not sure why you were banned, but it was certainly a pleasant interlude. For the rest of us.
“This is a science blog.”
Not entirely true, but then you make unsubstantiated assertions! Where is your citation for that?
In fact, the WUWT masthead includes topics of puzzling things in life, technology, and recent news.
” It is NOT a forum for ignorant idiots to make unsubstantiated assertions.”
Well then, dear Mr. Cortney, please depart this blog as you are clearly an ignorant idiot. By the way, do you continue to assert that wind-turbines generate no useful power? I believe you made such an idiotic assertion in our previous engagement. Violation of laws of thermodynamics, that.
“You made a series of unsubstantiated assertions and when asked to justify them you replied do your own research”
I also provided ample guidance for the rude woman to establish for herself the truth. By the way, that (do your own research) is a frequent response on this blog, made by many others. Can we expect to see you ride forth in faux righteous indignation, spewing your venom at the other such commenters? I won’t hold my breath.
Might this be related to the global oceanic overturning circulation? Could it be upwelling of sunken warm pools from previous La Nina equatorial surface warming? Eventually all oceanic warming or cooling episodes go through this cycle and get coughed up at the poles, and in particular the Arctic pole. Could we be looking at now surfacing warm water that started its journey way back?
Friends:
I have posted a reply to Roger Sowell’s bluster. I do not know if my reply will appear. But the lout has not apologised to the lady as any decent person would have.
Richard
Janis stoked the piece with her P.S. comment. It was a snobbish tack on that was not needed on an otherwise reasonable set of requests.
Bill, it would be instructive to me for you to expand your comment on the possibility of this being an artifact of the data set. In what way is the seasonality not fully accounted for in this data set? Do they not use a wide enough filter? Too narrow? Is an algorithm not fully developed? If they fully account for seasonality does that remove things they don’t want removed so is it a decision of give a little take a little? What?
Addendum question: Is there an alternate data set that you think does this better?
I also think this is mainly weather related. It is the same set-up that has led to very warm weather in Alaska and N. Siberia. Keep in mind that the water in those areas often flows into the N. Pacific which accentuates the warming.
Probably something like the high pressure that caused the Greenland melting last summer. Just over a different spot. With the loopy jet stream these cut off systems will be more prevalent in the years to come.
From Roger Sowell on August 6, 2013 at 5:01 pm:
http://phys.org/news/2013-03-high-cesium-fish-fukushima.html
This is why humans should avoid bottom-dwelling fish, aka trash fish, as they naturally accumulate unwanted contaminants that settle at the bottom.
However, as often happens in the rush to rant, the “facts” weren’t properly checked. That may be “more than 7,000 times the allowable safe limit” for Japan, which consumes lots of seafood and other sea products, thus their government is understandably cautious.
Here in the US, where the average diet has much less seafood, we have the FDA’s Derived Intervention Levels (DIL).
Document: http://www.fda.gov/downloads/NewsEvents/PublicHealthFocus/UCM251056.pdf
Referred to by: http://www.fda.gov/NewsEvents/PublicHealthFocus/ucm247403.htm (Fukushima related info)
For Cs-134 and Cs-137 combined, the DIL is 1200 Bq/kg.
Thus for us in the US, this was only 616 2/3 times the allowable safe limit, not “more than 7,000 times”.
Thus by not applying due diligence in fact checking, Mr. Sowell has been more than 11 times as alarming as could possibly have been warranted.
There appears to be a mixup of posts between threads. Anthony? Moderators?
REPLY: Can’t move comments, sorry, Anthony
KDK:
Thus for us in the US, this was only 616 2/3 times the allowable safe limit, not “more than 7,000 times”.
Thus by not applying due diligence in fact checking, Mr. Sowell has been more than 11 times as alarming as could possibly have been warranted.
===
What disingenuous BS ! Whether a fish is 616 x the FSA limit or 7000 x the japanese limit WTF? IT’S TOXIC. Get real.
Philip Bradley says:
The seasonal anomalies are the give away. The pattern of increased summer anomalies means something has changed since the reference period
===
This is always worth bearing in mind whilst looking at “anomaly” data. During the 80’s and 90’s there was a subdued annual variation. This may well be at least partly due to volcanism. This leads to cooler summers and warmer winters, thus reducing the annual variation.
Beyond that, a one or two month spike is just weather and I doubt it’s worth spending too much time head scratching, unless it lasts for >6 months and starts to look like a new super el Nino or something.
From Greg Goodman on August 7, 2013 at 11:40 pm:
Mr. Goodman, I am saddened to hear about the loss of your sense of humor.
Have you considered offering a reward for its safe return?
Admit it or not, but it is important to correctly reference that “more than 7,000 times” bit. For example, post-Fukushima the allowable amounts in Japan were significantly reduced. So now there can be blaring headlines “TOXIC RADIOACTIVE JAPANESE FISH SOLD IN US” where what is banned for sale in Japan isn’t even a tenth of the maximum allowable US level.
Of course if being off an order of magnitude when presenting alarming news isn’t a problem for you, then what does it matter if we’re told there will be two feet of sea level rise per century, or twenty feet? It’s still bad, lot of suffering involved, etc.
While researching, I saw some no-nukes were proposing the limit be cut all the way down to only 5 Bq/kg. Would you be fine with someone reporting that fish was 148,000 times above a proposed stricter standard, without them mentioning the source of that proposal?
BTW, who’s the FSA?
“Mr. Goodman, I am saddened to hear about the loss of your sense of humor.”
Now of course you say it’s a joke but how is anyone else to know that?
But then you then go on to that is does matter, so you weren’t really joking anyway.,
And, yes being an order of magnitude off would matter except for the minor detail that if, even by US food standards, it was not already TWO AND A HALF ORDERS over the legal limit.
I am saddened to hear about the loss of your sense of honesty.
Have you considered offering a reward for its safe return?
From Greg Goodman on August 8, 2013 at 3:34 am:
If they pay attention to my many previous writings, they should know that sarcasm/satire is my default setting. Even when serious, it’s extremely rare I’m 100% serious, there is humor in there somewhere.
Didn’t you notice “BTW, who’s the FSA?” rhymes? Ah, you probably slipped right over “Thus for us in the US” without missing a beat. Your loss.
solar-terrestrial-climate-101 = http://img94.imageshack.us/img94/3161/zlp.png