Climate Dialogue about the (missing) hot spot
by Marcel Crok
Over at the Climate Dialogue website we start with what could become a very interesting discussion about the so-called tropical hot spot. Climate models show amplified warming high in the tropical troposphere due to greenhouse forcing. However data from satellites and weather balloons don’t show much amplification. What to make of this? Have the models been ‘falsified’ as critics say or are the errors in the data so large that we cannot conclude much at all? And does it matter if there is no hot spot?
The (missing) tropical hot spot is one of the long-standing controversies in climate science. In 2008 two papers were published, one by a few scientists critical of the IPCC view (Douglass, Christy, Pearson and Singer) and one by Ben Santer and sixteen other scientists. We have participants from both papers. John Christy is the ‘representative’ from the first paper and Steven Sherwood and Carl Mears are ‘representatives’ of the second paper.
Below I repost the introduction that we – the editors of Climate Dialogue – prepared as the basis for the discussion.
The (missing) hot spot in the tropics
Based on theoretical considerations and simulations with General Circulation Models (GCMs), it is expected that any warming at the surface will be amplified in the upper troposphere. The reason for this is quite simple.
More warming at the surface means more evaporation and more convection. Higher in the troposphere the (extra) water vapour condenses and heat is released. Calculations with GCMs show that the lower troposphere warms about 1.2 times faster than the surface. For the tropics, where most of the moist is, the amplification is larger, about 1.4.
This change in thermal structure of the troposphere is known as the lapse rate feedback. It is a negative feedback, i.e. attenuating the surface temperature response due to whatever cause, since the additional condensation heat in the upper air results in more radiative heat loss.
IPCC published the following figure in its latest report (AR4) in 2007:

Source: http://www.ipcc.ch/publications_and_data/ar4/wg1/en/figure-9-1.html (based on Santer 2003)
The figure shows the response of the atmosphere to different forcings in a GCM. As one can see, over the past century, the greenhouse forcing was expected to dominate all other forcings. The expected warming is highest in the tropical troposphere, dubbed the tropical hot spot.
The discrepancy between the strength of the hot spot in the models and the observations has been a controversial topic in climate science for almost 25 years. The controversy [i] goes all the way back to the first paper of Roy Spencer and John Christy [ii] about their UAH tropospheric temperature dataset in the early nineties. At the time their data didn’t show warming of the troposphere. Later a second group (Carl Mears and Frank Wentz of RSS) joined in, using the same satellite data to convert them into a time series of the tropospheric temperature. Several corrections, e.g. for the orbital changes of the satellite, were made in the course of years with a warming trend as a result. However the controversy remains because the tropical troposphere is still showing a smaller amplification of the surface warming which is contrary to expectations.
Positions
Some researchers claim that observations don’t show the tropical hot spot and that the differences between models and observations are statistically significant [iii]. On top of that they note that the warming trend itself is much larger in the models than in the observations (see figure 2 below and also ref. [iv]). Other researchers conclude that the differences between the trends of tropical tropospheric temperatures in observations and models are statistically not inconsistent with each other [v]. They note that some radiosonde and satellite datasets (RSS) do show warming trends comparable with the models (see figure 3 below).
The debate is complex because there are several observational datasets, based on satellite (UAH and RSS) but also on radiosonde measurements (weather balloons). Which of the dataset is “best” and how does one determine the uncertainty in both datasets and model simulations?
The controversy flared up in 2007/2008 with the publications of two papers [vi][vii] of the opposing groups. Key graphs in both papers are the best way to give an impression of the debate. First Douglass et al. came up with the following graph showing the disagreement between models and observations:

Figure 2. Temperature trends for the satellite era. Plot of temperature trend (°C/decade) against pressure (altitude). The HadCRUT2v surface trend value is a large blue circle. The GHCN and the GISS surface values are the open rectangle and diamond. The four radiosonde results (IGRA, RATPAC, HadAT2, and RAOBCORE) are shown in blue, light blue, green, and purple respectively. The two UAH MSU data points are shown as gold-filled diamonds and the RSS MSU data points as gold-filled squares. The 22-model ensemble average is a solid red line. The 22-model average ±2σSE are shown as lighter red lines. MSU values of T2LT and T2 are shown in the panel to the right. UAH values are yellow-filled diamonds, RSS are yellow-filled squares, and UMD is a yellow-filled circle. Synthetic model values are shown as white-filled circles, with 2σSE uncertainty limits as error bars. Source: Douglass et al. 2008
Santer et al. criticized Douglass et al. for underestimating the uncertainties in both model output and observations and also for not showing all radiosonde datasets. They came up with the following graph:

Figure 3. Vertical profiles of trends in atmospheric temperature (panel A) and in actual and synthetic MSU temperatures (panel B). All trends were calculated using monthly-mean anomaly data, spatially averaged over 20 °N–20 °S. Results in panel A are from seven radiosonde datasets (RATPAC-A, RICH, HadAT2, IUK, and three versions of RAOBCORE; see Section 2.1.2) and 19 different climate models. The grey-shaded envelope is the 2σ standard deviation of the ensemble-mean trends at discrete pressure levels. The yellow envelope represents 2σSE, DCPS07’s estimate of uncertainty in the mean trend. The analysis period is January 1979 through December 1999, the period of maximum overlap between the observations and most of the model 20CEN simulations. Note that DCPS07 used the same analysis period for model data, but calculated all observed trends over 1979–2004. Source: Santer (2008)
The grey-shaded envelope is the 2σ standard deviation of the ensemble-mean trends of Santer et al. while the yellow band is the estimated uncertainty of Douglass et al. Some radiosonde series in the Santer graph (like the Raobcore 1.4 dataset) show even more warming higher up in the troposphere than the model mean.
Updates
Not surprisingly the debate didn’t end there. In 2010 McKitrick et al. [viii] updated the results of Santer (2008), who limited the comparison between models and observations to the period 1979-1999, to 2009. They concluded that over the interval 1979–2009, model projected temperature trends are two to four times larger than observed trends in both the lower troposphere and the mid troposphere and the differences are statistically significant at the 99% level.
Christy (2010)[ix] analysed the different datasets used and concluded that some should be discarded in the tropics:

Figure 4. Temperature trends in the lower tropical troposphere for different datasets and for slightly differing periods (79-05 = 1979-2005). UAH and RSS are the estimates based on satellite measurements. HadAt, Ratpac, RC1.4 and Rich are based on radiosonde measurements. C10 and AS08 [x] are based on thermal wind data. The other three datasets give trends at the surface (ERSST being for the oceans only while the other two combine land and ocean data). Source: Christy (2010)
Christy (2010) concluded that part of the tropical warming in the RSS series is spurious. They also discarded the indirect estimates that are based on thermal wind. Not surprisingly Mears (2012) disagreed with Christy’s conclusion about the RSS trend being spurious writing that “trying to determine which MSU [satellite] data set is “better” based on short-time period comparisons with radiosonde data sets alone cannot lead to robust conclusions”.[xi]
Scaling ratio
Christy (2010) also introduced what they called the “scaling ratio”, the ratio of tropospheric to surface trends and concluded that these scaling ratios clearly differ between models and observations. Models show a ratio of 1.4 in the tropics (meaning troposphere warming 1.4 times faster than the surface), while the observations have a ratio of 0.8 (meaning surface warming faster than the troposphere). Christy speculated that an alternate reason for the discrepancy could be that the reported trends in temperatures at the surface are spatially inaccurate and are actually less positive. A similar hypothesis was tested by Klotzbach (2009).[xii]
In an extensive review article about the controversy published in early 2011 Thorne et al. ended with the conclusion that “there is no reasonable evidence of a fundamental disagreement between tropospheric temperature trends from models and observations when uncertainties in both are treated comprehensively”. However in the same year Fu et al.[xiii] concluded that while “satellite MSU/AMSU observations generally support GCM results with tropical deep‐layer tropospheric warming faster than surface, it is evident that the AR4 GCMs exaggerate the increase in static stability between tropical middle and upper troposphere during the last three decades”. More papers then started to acknowledge that the consistency of tropical tropospheric temperature trends with climate model expectations remains contentious.[xiv][xv][xvi][xvii]
Climate Dialogue
We will focus the discussion on the tropics as the hot spot is most pronounced there in the models. Core questions are of course whether we can detect/have detected a hot spot in the observations and if not what are the implications for the reliability of GCMs and our understanding of the climate?
Specific questions
1) Do the discussants agree that amplified warming in the tropical troposphere is expected?
2) Can the hot spot in the tropics be regarded as a fingerprint of greenhouse warming?
3) Is there a significant difference between modelled and observed amplification of surface trends in the tropical troposphere (as diagnosed by e.g. the scaling ratio)?
4) What could explain the relatively large difference in tropical trends between the UAH and the RSS dataset?
5) What explanation(s) do you favour regarding the apparent discrepancy surrounding the tropical hot spot? A few options come to mind: a) satellite data show too little warming b) surface data show too much warming c) within the uncertainties of both there is no significant discrepancy d) the theory (of moist convection leading to more tropospheric than surface warming) overestimates the magnitude of the hotspot
6) What consequences, if any, would your explanation have for our estimate of the lapse rate feedback, water vapour feedback and climate sensitivity?
[i] Thorne, P. W. et al., 2011, Tropospheric temperature trends: History ofan ongoing controversy. WIRES: Climate Change, 2: 66-88
[ii]Spencer RW, Christy JR. Precise monitoring of global temperature trends from satellites. Science 1990, 247:1558–1562.
[iii] Christy, J. R., B. M. Herman, R. Pielke Sr., P. Klotzbach, R. T. McNider, J. J. Hnilo, R. W. Spencer, T. Chase, and D. H. Douglass (2010), What do observational datasets say about modeled tropospheric temperature trends since 1979?, Remote Sens., 2, 2148–2169, doi:10.3390/rs2092148.
[iv]http://www.drroyspencer.com/wp-content/uploads/CMIP5-73-models-vs-obs-20N-20S-MT-5-yr-means1.png
[v]Thorne, P.W. Atmospheric science: The answer is blowing in the wind. Nature Geosci. 2008, doi:10.1038/ngeo209
[vi] Douglass DH, Christy JR, Pearson BD, Singer SF. A comparison of tropical temperature trends with model predictions. Int J Climatol 2008, 27:1693–1701
[vii] Santer, B.D.; Thorne, P.W.; Haimberger, L.; Taylor, K.E.; Wigley, T.M.L.; Lanzante, J.R.; Solomon, S.; Free, M.; Gleckler, P.J.; Jones, P.D.; Karl, T.R.; Klein, S.A.; Mears, C.; Nychka, D.; Schmidt, G.A.; Sherwood, S.C.; Wentz, F.J. Consistency of modelled and observed temperature trends in the tropical troposphere. Int. J. Climatol. 2008, doi:1002/joc.1756
[viii] McKitrick, R. R., S. McIntyre and C. Herman (2010) “Panel and Multivariate Methods for Tests of Trend Equivalence in Climate Data Sets.” Atmospheric Science Letters, 11(4) pp. 270-277, October/December 2010 DOI: 10.1002/asl.290
[ix] Christy, J. R., B. M. Herman, R. Pielke Sr., P. Klotzbach, R. T. McNider, J. J. Hnilo, R. W. Spencer, T. Chase, and D. H. Douglass (2010), What do observational datasets say about modeled tropospheric temperature trends since 1979?, Remote Sens., 2, 2148–2169, doi:10.3390/rs2092148
[x] Allen RJ, Sherwood SC. Warming maximum in the tropical upper troposphere deduced from thermal winds. Nat Geosci 008, 1:399–403
[xi] Mears, C. A., F. J. Wentz, and P. W. Thorne (2012), Assessing the value of Microwave Sounding Unit–radiosonde comparisons in ascertaining errors in climate data records of tropospheric temperatures, J. Geophys. Res., 117, D19103, doi:10.1029/2012JD017710
[xii] Klotzbach PJ, Pielke RA Sr., Pielke RA Jr., Christy JR, McNider RT. An alternative explanation for differential temperature trends at the surface and in the lower troposphere. J Geophys Res 2009, 114:D21102. DOI:10.1029/2009JD011841
[xiii] Fu, Q., S. Manabe, and C. M. Johanson (2011), On the warming in the tropical upper troposphere: Models versus observations, Geophys. Res. Lett., 38, L15704, doi:10.1029/2011GL048101
[xiv] Seidel, D. J., M. Free, and J. S. Wang (2012), Reexamining the warming in the tropical upper troposphere: Models versus radiosonde observations, Geophys. Res. Lett., 39, L22701, doi:10.1029/2012GL053850
[xv] Po-Chedley, S., and Q. Fu (2012), Discrepancies in tropical upper tropospheric warming between atmospheric circulation models and satellites, Environ. Res. Lett
[xvi] Benjamin D. Santer, Jeffrey F. Painter, Carl A. Mears, Charles Doutriaux, Peter Caldwell, Julie M. Arblaster, Philip J. Cameron-Smith, Nathan P. Gillett, Peter J. Gleckler, John Lanzante, Judith Perlwitz, Susan Solomon, Peter A. Stott, Karl E. Taylor, Laurent Terray, Peter W. Thorne, Michael F. Wehner, Frank J. Wentz, Tom M. L. Wigley, Laura J. Wilcox, and Cheng-Zhi Zou, Identifying human influences on atmospheric temperature, PNAS 2013 110 (1) 26-33; published ahead of print November 29, 2012, doi:10.1073/pnas.1210514109
[xvii] Thorne, P. W., et al. (2011), A quantification of uncertainties in historical tropical tropospheric temperature trends from radiosondes, J. Geophys. Res., 116, D12116, doi:10.1029/2010JD015487
Some Australian scientist states that only 41 per cent of people questioned knew how long it takes the Earth to travel around the sun. Reckons it is because people watch too many Jurassic Park films, etc., and believe Sarah Palin’s creationist explanation that humans walked with dinosaurs. So this report would not be understood by the majority. God help us.
17 July: News Ltd: Andrew Bolt: How to grill an alarmist politician
Source: BBC2: The Sunday Politics
Date: 14/07/2013
Andrew Neil: Ed Davey, Secretary of State for Energy and Climate Change, joins me now for the Sunday interview
http://blogs.news.com.au/heraldsun/andrewbolt/index.php/heraldsun/comments/how_to_grill_an_alarmist_politician/
“Models show a ratio of 1.4 in the tropics (meaning troposphere warming 1.4 times faster than the surface), while the observations have a ratio of 0.8 (meaning surface warming faster than the troposphere). Christy speculated that an alternate reason for the discrepancy could be that the reported trends in temperatures at the surface are spatially inaccurate and are actually less positive.”
Having read WUWT for several years, I would have made the same guess. Have the alarmists in charge of the “adjustments” to the surface temp records shot themselves in the foot?
Bushbunny, enough with the gratuitous Palin-bashing, based on an uncorroborated hearsay account from a single “progressive” commentator, who claimed to recall things from long ago that nobody else heard and Palin probably never actually said. Stop it, or I might have to mention Al “millions of degrees magma” Gore, You wouldn’t want that, would you?
The simplest and probably correct explanation of no troposphere hotspot is, there is no water vapour feedback.
One convinced CAGW protagonist’s view is that radiosonde data is unreliable because they have inadequate solar radiation shielding. If this was so, the weather balloon temperature data would be higher than the ‘correct’ value. The measured temperatures, however, are less than that of the models, so there is no case for dismissing the weather balloon data. So how useful are the models?
Marcel: Thanks for cross posting this here. I just left the following comment at ClimateDialogue:
http://www.climatedialogue.org/the-missing-tropical-hot-spot/#comment-668
I suspect one of the reasons for the difference between the models (the tropical hotspot) and observations (no hotspot) may result from how poorly climate models simulate sea surface temperatures, primarily in the Pacific.
The following is a model-data comparison of the Pacific sea surface temperature anomaly trends for the past 31 years on a zonal-mean basis. The data is the Reynolds OI.v2 SST, and the models are the multi-model ensemble mean of the CMIP5-archived models—simulation of TOS (Historic/RCP6.0).
http://bobtisdale.files.wordpress.com/2013/02/02-zonal-pacific.png
The models show a relatively high warming rate in the tropics, but the data show little to no warming. In fact, over this period, the equatorial Pacific has cooled.
And I also suspect the differences between the modeled and observed sea surface temperature trends in the Pacific are caused by the failure of climate models to properly simulate ENSO processes.
The above graph is from this post:
http://bobtisdale.wordpress.com/2013/02/28/cmip5-model-data-comparison-satellite-era-sea-surface-temperature-anomalies/
If the models can’t simulate ENSO or Pacific sea surface temperature trends properly, one wonders how they can ever hope to project regional variations in temperature and precipitation.
Regards
Thanks, Marcel. Very interesting discussion.
I think the data collected by millions of weather balloons shows the absence of the hypothesized “tropical hot spot”. Same with satellite data.
Water vapor positive feedback is the basis for CAGW, together with a high climate sensitivity to CO2 increases. It will defended to the last man.
Bushbunny should back up his implausible claim – Palin is nobody’s fool and could probably clean Bushbunny’s clock in any political debate, judging by her past performances.
bushbunny: “Sarah Palin’s creationist explanation that humans walked with dinosaurs”.
Can you cite a credible source? If not, shame on you.
“Thorne et al. ended with the conclusion that “there is no reasonable evidence of a fundamental disagreement between tropospheric temperature trends from models and observations when uncertainties in both are treated comprehensively”.”
Thorne should be beaten repeatedly… he all but admits that the uncertainty is massive and that its on the low side. Which is turn means zero reason for alarm and that it can easily be natural processes. These douchebags will just lie with a straight face its truly amazing. This is classic eugenics propaganda moves.
Gary Hladik says:
“Have the alarmists in charge of the “adjustments” to the surface temp records shot themselves in the foot?”
Most definitely.
Every time they use HadCrud or Giss temperature record, they start off with a highly manipulated data set. They cannot possibly end up with a viable result, even if everything else is correct.
GIGO !!!
They have well and truly painted themselves into a corner with the deception.
And I really wish people wouldn’t talk about ‘statistical uncertainty’ of models. The outputs of climate models aren’t samples of a population, except to the extent they are samples of the uncertainty of climate modellers, and hence a measure of the lack of consensus among them.
Bushbuuny,
It is time to snip this lie about Sarah Palin in the bud. Just because you disagree politically with a public figure, it does not give you the right to lie about her.
The claim that Sarah Palin believes that dinosaurs and humans co-existed is based on the following “evidence”;
An Internet Blog
These allegations [against Palin] appear to stem from a blog post that included “fake Governor Sarah Palin quotes” made up by a blogger at unbearablebobness.typepad.com. He states that his blog post was an attempt to satirize Gov. Palin’s beliefs, and does not reflect those beliefs in any way.
A LA Times article
An LA Times article has cited an anonymous source as stating that, shortly after being elected mayor of Wasilla, Alaska in 1996, Sarah Palin stated that she believed humans and dinosaurs existed at the same time. Some have questioned the truth of those allegations because the person who told that story operates a political blog primarily directed toward opposing Palin’s candidacy, the source never published his story prior to Palin’s nomination for Vice President, there were apparently no other witnesses to the statement, and no one else has come forward as stating that they have heard Palin endorse similar beliefs.
An YouTube interview by extreme leftist Mat Damon
bushbunny, you bash creationists, and end your diatribe with God help us?
What were you thinking?
The biggest problem is the drop in humidity. This implies if temps steady, the wet bulbs drop anyway. I have opined in my 400 mb research that falling rhs over the tropics are sending the global ace into a downspin. The fact is that with dry air, the cumulus towers over the tropics entrain the air and are forced to fight harder to sustain themselves. I have tweeted the June 1-July 10 rh at 400 mb several times and it showed the below normal RH’s. Once again the Global ace is in the tank, about 60% of average.
If one looks at 400 mb temps on the UAH site over the past 10 years, there has been no change, though years with the el nino it is warmer than normal, years with a la nina cooler. This would make sense given the ocean is probably the tail that wags the dog with climate and temperatures of the air react to the oceans, the tropical pacific being the big driver. A look at this shows the almost perfect correlation between sst and air temps
http://wattsupwiththat.files.wordpress.com/2012/08/1-s2-0-s0921818112001658-gr11.jpg
what is MOST IMPORTANT is tracking the wet bulb! This gives a much more accurate portrayal of what is going on. A steady state temp and dropping rh’s ( opposite of IPCC ideas) are the most likely link to global ace drop, with the warm amo of the atlantic fighting to pick up the slack that is most obvious in the Pacific. Once the AMO flips, the atlantic downturn will start, and I suspect the feedback will force increased action back in other areas again. The idea of temperature “distortion” where high latitude warming and lowering of pressures literally distorts the global temp pattern enough to lower the purpose of tropical cyclones ( redistribute heat.. if its already been accomplished , why do we need the storms) that I presented at the Heartland conference is something we can do a real time test on over the coming 20-30 years as we see if this is cyclical swing as many of us believe. In any case, the temps over the tropics are not increasing, and the wet bulb would be even of more value in evaluating this.
In the meantime, the current dryness over the tropics at 400 mb is as extensive as I can find
http://1.usa.gov/12UaUq5
Temperatures are near normal overall
http://1.usa.gov/16I3TK9
The implication is a cooler wet bulb over the tropics this year, and this forces waves to have to “work” harder to develop. The atlantic being a smaller ocean can still reverse for a fast, active season at the height of the season, but its unlikely the ace can recover in the Pacific enough to avoid yet another below normal year.
You are seeing the tip of an iceberg that I have been working on for quite some time. I test it in real time by showing people, and it is in its embryonic stage, but I do think that tropical cyclones are more than just the denizens of the deep you see. They are a product of the environment that produces them and the crashing ace is indicative of a more hostile atmosphere for their development. While people run to the enso, and wind shear, the dry air over these areas is as crucial and has a link to not only the tropics, but the implications we are discussing here.
I think it would make for a great project for some masters or phd level student at an open minded university that is not afraid to actually pursue the truth on the matter of linkage of weather and climate, rather than a pre conceived answer
How Thorne et al could credibly claim that there is no reasonable evidence of a fundamental disagreement between tropospheric temperature trends from models and observations when uncertainties in both are treated comprehensively is mind-boggling.
Apparently ‘comprehensive treatment’ involves focusing on anomalous radiosondes and expanding uncertainty claiming that increased uncertainty means they’re right. The alarmists standard trick is to claim all circumstances are the result of AGW.
The mean of their models completely disagrees with the mean of the measurements, period.
The increased low cloud formation from water evaporation reflects sunlight cooling the atmosphere. Increased lower atmosphere warming also expands and pushes the atmospheric layers up toward the emission level creating a steeper temperature gradient and thus more radiative cooling.
These would be the overriding factors, not necessarily a spatially inaccurate surface measurement.
Joe,
is the 400 mb dryness a symptom of, a cause of or unassociated at all with the 4 (6??) cut off lows that are currently shown in the 12 hour northeast pacific GOES W Satellite loop?
http://www.ssd.noaa.gov/goes/west/nepac/flash-wv.html
So is it there or not?
RoHa says:
July 16, 2013 at 8:27 pm
“So is it there or not?”
Thorne claims that he is certain that it is exists within the uncertainties error range. Which includes just about everything.
Bushbunny, Some Australian scientist states that only 41 per cent of people questioned knew how long it takes the Earth to travel around the sun.”
I found that hard to believe, so went out laughing to my wife. only to discover that 50% of the people living in our house didn’t know that either. There has been a 100% increase in knowledge about that fact within the past 2 minutes.
Well, it is also possible that the “GHE” hypothesis has a flaw; the allegedly “trapped” energy is simply delayed as it flows through the system (i.e. the Sun, Atmosphere, Surface, Atmosphere, Surface (again for a few quick trips) and finally onward to the “cold” expanse of space. Given the dimensions involved (surface to TOA times the speed of light = a few (or possibly tens of) milliseconds) this delay as the energy flows through the system multiple times at nearly the speed of light does not emulate the effects of a thermal insulator which actually slows the velocity (rate of forward progress, distance travelled per unit time, etc.).
So we have empirical evidence that one of the “signatures” (or should that be “footprints”) of the “GHE” cannot in reality (ignoring for a moment efforts to estimate temperatures from wind speeds, kind of like estimating a person’s net worth from the fabric used to construct their clothing) be observed. One could argue that the observations MUST be wrong, or one could wake up and smell the caffeine fumes and conclude that the “GHE” hypothesis is flawed.
Cheers, Kevin, “denier” and (proudly) also a ”lunatic”.
“””””……More warming at the surface means more evaporation and more convection. Higher in the troposphere the (extra) water vapour condenses and heat is released. Calculations with GCMs show that the lower troposphere warms about 1.2 times faster than the surface. For the tropics, where most of the moist is, the amplification is larger, about 1.4……”””””
I can’t believe I’m reading this in what purports to be a scientific “peer reviewed” paper.
I would say that the missing “hot spot” is missing, because there simply isn’t one; there can’t be one. Well there can’t be one due to the postulated mechanism.
When liquid water freezes, to become solid ice, there is never any heating of the water due to the removal of the 80 calories per gram of latent heat energy of fusion.
The liquid water can freeze only after two things occur.
First the water has to cool down to a Temperature of 273.15 Kelvins; the freezing point of water (under STP conditions.) That process can not occur, unless there is a “heat sink” that is at a lower Temperature than 273.15 Kelvins, that is in thermal contact with the subject water sample. The second law of thermodynamics demands that. Yes the water can cool by radiation as well, but nothing undergoes a Temperature increase in the process.
The second thing that must occur; after the water Temperature stalls at 273.15 Kelvins, is that 80 calories per gram of water, must be removed to some colder heat sink, again per the second law, and only after that heat energy, is sucked out of the water by a continuous thermal chain of ever cooler thermally conductive media, to some far cooler place, can the liquid water molecules close in on each other as the water turns to ice. At no time does ANYTHING in that continuous thermal chain experience an increase in Temperature, over what it was, before the liquid water was brought into thermal contact with the conductive chain.
The Temperature must drop, in order to establish a Temperature gradient to drive the latent heat energy out of the liquid water.
Exactly the same sequence of events, MUST happen, before water vapor can condense into liquid water; but this time the latent heat that must FIRST be removed, is about 590 calories per gram.
Yes the phase changing material, can also give up energy in the form of EM radiation, but that radiation escapes without raising the Temperature of the material that is supplying the latent energy.
Where do these people come by their training in simple thermal physics ??
2) Can the hot spot in the tropics be regarded as a fingerprint of greenhouse warming?
No, nor can the absence of one be construed as lack thereof.
We know a great deal about how CO2 interacts with LW in a lab setting. That allows us to extrapolate theories as to how it MIGHT change the atmospheric system as a whole. That the signal appears at best to be so weak that at best it cannot be differentiated from statistical error suggests that the theory is wrong.
But that doesn’t change the properties of CO2 measured in isolation in the lab. The message to the climate modelers ought to be that there are other factors unaccounted for that affect the final result. They should be sitting down and trying to understand what those might be and how to measure them instead of stubbornly insisting that the models are correct within some statistical bound that must be blurred to accommodate the fact that the theory and data don’t match.
“Having read WUWT for several years, I would have made the same guess. Have the alarmists in charge of the “adjustments” to the surface temp records shot themselves in the foot?”
They will have to adjust the troposphere data to?
“But that doesn’t change the properties of CO2 measured in isolation in the lab. The message to the climate modelers ought to be that there are other factors unaccounted for that affect the final result. They should be sitting down and trying to understand what those might be and how to measure them instead of stubbornly insisting that the models are correct within some statistical bound that must be blurred to accommodate the fact that the theory and data don’t match.”
There are several papers now showing a strong negative feedback in the atmosphere on warming along equator. The problem is that these findings are not UNFCCC conform?
Here are some interesting articles from JoNova covering AR5’s (draft) visual trickery with the still missing hotspot and John Cook’s religious devotion to the missing hotspot.
http://joannenova.com.au/2013/04/ipcc-plays-hot-spot-hidey-games-in-ar5-denies-28-million-weather-balloons-work-properly/
http://joannenova.com.au/2010/06/how-john-cook-unskeptically-believes-in-a-hotspot-that-thermometers-cant-find/
http://joannenova.com.au/tag/missing-hot-spot/
“Where do these people come by their training in simple thermal physics ??”
The political established UNFCCC falsifies the observations of the real world?
” d) the theory (of moist convection leading to more tropospheric than surface warming) overestimates the magnitude of the hotspot”
Clearly that is the correct answer. The observational evidence shows us that the negative system response of more evaporation and convection removes most if not all of the expected thermal forcing all the way from surface to tropopause. A change in the height of the tropopause above regions of enhanced convection would do the trick as per the Ideal Gas Laws.
Instead of the higher tropopause being at a colder height and radiating less to space (as proposed by AGW theory) the entire body of the troposphere expands and lets energy pass to space faster due to the reduction in average density. That faster transmission of energy to space completely negates the expected warming. GHGs might slow the transmission of energy down in a laboratory but in the open air the consequent changes in evaporation, convection and global air circulation speed it up again by an equal and opposite measure to retain total system energy content as determined by mass, gravity and ToA insolation alone. That is why the composition of atmospheres matters little to system energy content. Composition changes result in circulation changes and not changes in total system energy content. Some areas may be warmer as a result of the circulation change but others will be cooler.
“6) What consequences, if any, would your explanation have for our estimate of the lapse rate feedback, water vapour feedback and climate sensitivity?”
Increased evaporation and convection must have some effect on the global air circulation. That is the ‘price’ of the negative system response. However one must then assess any such change as compared to natural variations.
History appears to show that from MWP to LIA to date the global air circulation above some regions shifted latitudinally some 1000 miles on average. That shows us the normal natural scale of negative system response to normal natural (solar and oceanic) forcing elements.
I would guess that the change from our activities would be less than a mile.
That is implicit in my New Climate Model.
Still missing hotspot,
flat temps for 16+ years,
expanding Antarctica,
freezing NH winters & big time snowfalls,
are not entirely inconsistent with the ‘theory’ of hot climate catastrophe caused by co2.
I am surprised that there are arguments about radiosondes vs satellites when there is another source that could be used for validation. Almost all modern aircraft continually report the weather that they are experiencing in particular the wind and ‘outside air temperature’ and this information is available in real time to the WMO. Aircraft particularly transoceanic aircraft fly at the levels that the hotspot would be expected. Their reports could easily be used as another validation of satellite or radiosonde data. Note that the aircraft data is extremely accurate as it must be for flight safety and efficiency.
See http://www.youtube.com/watch?v=99nmJ3mqXXg
.
bushbunny says:
July 16, 2013 at 6:08 pm
Some Australian scientist states that only 41 per cent of people questioned knew how long it takes the Earth to travel around the sun. Reckons it is because people watch too many Jurassic Park films, etc., and believe Sarah Palin’s creationist explanation that humans walked with dinosaurs. So this report would not be understood by the majority. God help us.
That’s because those people are too busy working for their living and enjoying themselves afterwards to worry about how long the Earth takes to orbit the Sun.
“b) surface data show too much warming”
Perhaps “adjustments” made to the surface temps to show how catastrophic the warming has been have inadvertantly dimished the value of the hot spot?
steveta_uk says:
July 17, 2013 at 1:32 am
““b) surface data show too much warming”
Perhaps “adjustments” made to the surface temps to show how catastrophic the warming has been have inadvertantly dimished the value of the hot spot?”
Doesn’t matter. Any rational observer by now knows that warmunism is statist propaganda from start to finish. The unconscious sheep on the other hand will believe anything their dummy box tells them, and the warmunist pseudoscientists know it, so why bother, just keep on lying.
bushbunny says:
July 16, 2013 at 6:08 pm
“Some Australian scientist states that only 41 per cent of people questioned knew how long it takes the Earth to travel around the sun. Reckons it is because people watch too many Jurassic Park films, etc., and believe Sarah Palin’s creationist explanation that humans walked with dinosaurs. So this report would not be understood by the majority. God help us.”
Funny that the progressivist slanderer doesn’t provide a link for his tall tale about Palin; is that your scientific rigor at work, troll?
The biggest problem with the GHE theory, apart from thermodynamic law violations, is that it is not founded in reality but a product of a flat earth with no night/day cycles and a cold sun. I live on a rotating spherical planet with a strong sun during daytime and zero sun at night that supplies enough heat during the day to lift the surface temperature to 88C in the zenith position. Why would I need a GHE in this reality?
According to the GHE the radiated energy from TOA would fall because of the ”trapped” heat. This has also been found to be false.
Global temperature flat for 15 years. 1.4×0=0 so one wouldn’t expect to detect a warm spot. If the models were correct they would have predicted that. But the models are wrong so why are we bothering with the models.
At least Palin had the good sense not to vote for Al Gore.
Can Bushbunny say the same?
Stephen Wilde:
This is what I’ve been trying to explain as well, thanks for stating it more clearly than I have. The AGW theorists have cause and effect backwards, as well as a few other things.
For example, CO2 sinks are not static, or calculable. There is an effectively infinite ability for the biosphere to absorb CO2, if required (at least, relative to the levels the planet and humanity can possibly put into the atmosphere). This is due to the presence of life, particularly plant life, which will automatically multiply in micro and macro forms in an orgy of feeding and reproducing, until the level of CO2 no longer supports this activity, at which point they stabilize, then die off. Likewise the overall ratio of N2 and O2, which are controlled by life.
Atmospheric composition does not alter the temperature balance, and can’t. Our average temperature is more a function of our distance from the sun and overall mass of atmosphere than the composition of the atmosphere.
Sadly, the entire AGW camp simply cannot grasp the fact that energy input will always equal energy output on a planet. Always. Even Venus with it’s “runaway greenhouse” is stable.
“Sadly, the entire AGW camp simply cannot grasp the fact that energy input will always equal energy output on a planet. Always. Even Venus with it’s “runaway greenhouse” is stable.”
A lot of sceptics have problems with that too.
Philip Bradley says:
July 16, 2013 at 6:37 pm
“The simplest and probably correct explanation of no troposphere hotspot is, there is no water vapour feedback.”
Or, a positive feedback is assumed whereas the actual feedback from moist convection is negative, and negative feedback acts to stabilize the lapse rate.
Basic theory suggests the hot spot should occur whenever there is global warming, whatever its cause. The mistake made by Santer (2003), copied by the IPCC, was to assume that the hot spot is an artefact only of greenhouse-gas-driven warming.
The hot spot should have been evident between 1976 and 2001, when there was enough global warming to allow it to be detected.. However, it was not evident. The conclusion is that, since there was warming, and since theory dictates that the hot spot should have been present, either the basic theory is wrong (unlikely) or (more likely) that either the surface temperatures or the mid-troposphere temperatures are being incorrectly measured.
Since the mid-troposphere temperatures change little from place to place in the tropics, only a few sampling points are needed to establish a reliable measurement. Not so on the surface, where the tropics undergo considerable temperature changes from place to place and the sampling points are few and badly managed. A not unlikely conclusion, therefore, is that it is the measurement of tropical surface temperatures that is problematic. Warming that is not occurring is being incorrectly detected, masking much of the differential between tropical surface and mid-troposphere temperatures that indicates the hot spot.
If this explanation is correct, then the presence or absence of the hot spot tells us little or nothing about the cause of global warming.
“Thorne et al. ended with the conclusion that “there is no reasonable evidence of a fundamental disagreement”
=============
Any time you see a double negative in English you cannot trust your understanding matches the meaning.
Why did the author not state the conclusion in standard English? The use of a double negative is almost never recommended, because its meaning can be confusing.
I used the missing “tropic hot spot” in a talk I gave some 4 years ago.
My audience was mixed but mostly non-technical or scientific.
My basic thesis was that the climate models were wrong, overestimating
the sensitivity to CO2. I believe that the missing “tropic hot spot”
was strike 2 for the models. I showed 5 strikes for the models,
then turned to my audience and said: “In baseball, you get three strikes.
Science, done correctly, doesn’t need more. We have here 5 STRIKES
on the climate models, which are the source of most of the alarmist
statements we hear about climate change. Just how many more
strikes do the climate modelers get?”
Same temperature, less RH% = heat loss
If you look at Bob Tisdale’s post of July 16, 2013 and check the variance between modeled and actual temperature, http://bobtisdale.files.wordpress.com/2013/02/02-zonal-pacific.png, you will see that the great variance is in the tropics where the Argo float data shows the surface temperature is being limited to 31C. The modeling of the mechanism that limits the temperature to 31C is inadequate.
Bob Tisdale has it down. Touchdown.
The take-away in the discussion (for me) is Christy’s “… the use of climate models in policy decisions is, in my view, not to be recommended at this time.”
Stephen Wilde says:
July 16, 2013 at 10:59 pm
That faster transmission of energy to space completely negates the expected warming. GHGs might slow the transmission of energy down in a laboratory but in the open air the consequent changes in evaporation, convection and global air circulation speed it up again by an equal and opposite measure to retain total system energy content as determined by mass, gravity and ToA insolation alone.
==============
agreed. the lapse rate is a product of GHG COOLING the atmosphere. otherwise the atmosphere would be isothermal. as GHG cools the atmosphere, it radiates some of this energy to the surface and some to space. mass and gravity determine the limits, beyond which the lapse rate cannot increase.
Adding more GHG cannot warm the atmosphere while it is cooling it. You cannot make the troposphere warmer by removing energy from the troposphere and back radiating some of it to the surface and some of it to space.
All that can happen is that the vertical circulation increases to try and limit the amount of atmospheric cooling and surface warming, removing the excess energy reaching the surface from back radiation. Opposite to real greenhouses, which limit circulation to warm the surface.
The tropical hotspot is a signature of model prediction. the lack of a hotspot demonstrates that they are not correctly capturing the physics of the earth’s climate and cannot be relied upon for accurate predictions of future climate.
“KevinK says:
July 16, 2013 at 9:38 pm
Well, it is also possible that the “GHE” hypothesis has a flaw; the allegedly “trapped” energy is simply delayed as it flows through the system (i.e. the Sun, Atmosphere, Surface, Atmosphere, Surface (again for a few quick trips) and finally onward to the “cold” expanse of space.””
BINGO! I’ve been in some debates of late, and have focused in on the IR radiation to space. There is a certainty that is always omitted, … there has been no decrease in IR out to space. The temp will only go up and down based on an unbalanced equilibrium. LInzen demonstrated this in one of his papers, that OLR is associated with SST [rings the phone of Bob T.]. The goofballs over at Skepticalscience show a graph from NASA that claims “all the decreased OLR is in the range of GHGs .. Like CO2. LOL .. then you look at the graph at the bands of CO2 are flat out on ZERO. Three other papers show no decrease in OLR ranging from 1970 to 2006. Roy Spencer has also weighed in on the issue.
Simply put, you are not going to get any real change in earth’s temperature unless there is an imbalance in equilibrium. The ups and downs of the system seem to me to be the product of heat distribution …. in and out of the ocean, and fluctuations is SW coming in from space due to changes in clouds and slight decreases in TSI with coupled mechanisms to the ocean. Throw on top of that, that the earths system is a convective system, with gases going from a place of higher pressure to lower pressure and increased volume, … I don’t see where there’d be any hotspot … the system is always circulating so there can’t be a static “spot”. AND .. lastly, a point that I made in arguments is that 70% of the IR radiated by CO2 hits the ocean and is used up in latent heat transfer associated with evaporation. That heat bypasses the near surface zone and is released at the top of the atmosphere, where it radiates out to space. I still have some questions:
1) Can the IR radiated by CO2 to the surface of the ocean that is captured as latent heat and transferred to the TOA via evaporation, be released at different wavelengths?? [it would seem to me that if IR can heat water, the heat from that water is going to be reradiated out at WL more indicative of water vapor].
Can CO2 absorb IR at the TOA, then circulate back down to radiate that heat back to the surface? … or do the differences in pressure and temperature affect CO2 ability to absorb and radiate??
I need all ya’lls higher levels of knowledge on these subjects to nail the coffin in my debate.
Thanks
A lot of topics address here at WUWT seem appropriate. Miskolczi (sp?) was the one of the first to claim a constant GHE. That is, as CO2 increases the amount of H2O decreases accordingly. Joe B’s description of a reduction in RH would support this theory. I’ve also heard people mentioned an increase in the partial pressure of CO2 must be causing a reduction in other gases. This just might be H2O given its variability.
It all seems to fit together and support a very stable equilibrium situation. Of course, for a planet to survive a billion of years of life sustaining climate, one might just think it was pretty stable.
Bob is right of course.
This is simply because the climate scientists refuse to acknowledge the natural cycles in climate. It just so happens that during most of the satellite era PDO was positive (or like Bob will probably prefer, ENSO was high) and then tropical Pacific do not warm much. Now that the cycle has turned ironically we will probably see the hot spot in a decade or two, after a long pause in global warming but warming of the tropics and cooling around 30-40 lat. Tropical and mid latitude Pacific simply do not warm at the same time.
My modified version of Bobs graph, http://virakkraft.com/PDO-fingerprint-Pacific.png
More people are starting to get it 🙂
Or understood all along but are now gaining the confidence to say it.
Mother Nature’s tower heat sinks (aka tropical thunderstorms) pipeline heat into space. That also explains the missing H20 positive feedback. The negative feedback due to this pipelining overwhelms any positive components.
“””””…..davidmhoffer says:
July 16, 2013 at 10:15 pm
2) Can the hot spot in the tropics be regarded as a fingerprint of greenhouse warming?
No, nor can the absence of one be construed as lack thereof.
We know a great deal about how CO2 interacts with LW in a lab setting. That allows us to extrapolate theories as to how it MIGHT change the atmospheric system as a whole. …..”””””
David, I don’t have much quarrel with the claimed LWIR absorption/emission properties of the CO2 molecule. I’m not a physical chemist, but I believe that is a robust discipline, that is theoretically well understood.
But the atmospheric phenomenon is how the CO2 molecule as a dilute component of a complex atmosphere interacts with the ambient LWIR radiation that is primarily sourced from the earth surface (solid/liquid).
So I am totally deaf to “lab experiments” where CO2 gas mixtures are subjected to radiation sources that are ten times the real earth ambient source Temperature, and therefore 10,000 times as bright as the earth surface, and emitting a completely different spectrum at one tenth of the real LWIR wavelengths, which have completely different interactions with the CO2.
Has anyone actually done any “real” laboratory experiments with CO2 mixtures, using a real 288 Kelvin thermal radiation source that is putting out a 10.1 micron peak wavelength emission spectrum at about 390 W/m^2.
There would need to be some serious cooling of the apparatus to eliminate ambient 288 K emissions from the whole damn laboratory.
How can the earth be radiating a crude BB type spectrum corresponding to the surface Temperature when Trenberth claims that only 40 W/m^2 escapes to space in the atmospheric window, and folks insist that the main body of the atmosphere (gases) does not emit thermal radiation. Well of course I don’t believe that last assertion. Gases do emit thermal radiation continuum spectra; it just isn’t black body radiation. Well nothing emits black body radiation; just a sometimes fairly close but limited spectra approximation.
george e smith;
Has anyone actually done any “real” laboratory experiments with CO2 mixtures, using a real 288 Kelvin thermal radiation source that is putting out a 10.1 micron peak wavelength emission spectrum at about 390 W/m^2.
>>>>>>>>>>>>>.
Yes.
http://www.john-daly.com/artifact.htm
However I don’t consider this directly relevant to what happens in the atmosphere as a whole. Hug’s apparatus was 10 cm in length, the atmospheric air column is many kilometers, not the same thing at all. Plus no convection, condensation, or evaporation etc etc etc in Hug’s experiment either. In other words, CO2 in isolation at two different concentrations to see what happens.
Was the hypothis of a hotspot in Earth’s atmosphere caused because of the red spot on Venus?
CC Squid says:
July 17, 2013 at 12:09 pm
Was the hypothis of a hotspot in Earth’s atmosphere caused because of the red spot on Venus?
>>>>>>>>>
The reasoning for the existence is contained in the article.
The lapse rate feedback is only a negative feedback (in the general circulation model) if the long wave radiation that is released when the water vapour condenses is emitted to space rather than trapped by increased water vapour. Higher modelled temperature in the troposphere enables the general circulation model to assume there is more water vapour in the troposphere which amplifies the CO2 forcing by increasing the amount of water vapor in troposphere.
If the objective was to develop a general circulation model that matches reality rather than to push an agenda likely one of model fixes would be modify to GCMs (modeling of planetary cloud cover) to match Lindzen and Choi finding that planetary cloud cover in the tropics increases or decreases to resist forcing changes by reflecting more or less radiation off to space.
It appears other general circulation model fixes are required as there is a fairly long list of unexplained anomalies. There is currently no logical explanation as to 1) why there has been a 16 year period where there is a plateau of no warming and 2) why the majority of the warming in the last 70 years has been in high latitude regions in the Northern hemisphere, 4) why there is no tropical tropospheric hot spot 5) why there is cyclic warming in the paleo record where the same regions that warmed in the last 70 years, and 6) why there are solar magnetic changes that correlate with past cyclic warming and cooling (TSI changes to the sun do not explain the cyclic warming and cooling).
Comment:
1. A plateau where there is no warming is more difficult to explain than a wiggly gradual increase in temperature where the rate of increase is less than predicted. As the CO2 forcing mechanism cannot be turned on and off there needs to be a smart mechanism that hides the CO2 forcing. The aerosol hypothesis appears to fail as the aerosols are emitted in the Northern hemisphere where there is the most amount of warming. The aerosol hypothesis requires there to be less warming in the Northern hemisphere rather more warming.
2. The ex-tropic region of the Northern hemisphere has warmed twice as much as the planet as a whole and four times as much as the tropics. Furthermore the Greenland Ice Sheet has warmed the most of any region on the planet.
3. The same pattern of warming has occurred before. A mechanism than modulates planetary cloud cover could explain regional warming. Curiously the regions where the warming occurred are also the regions that are most strongly affected by solar mechanisms that modulate planetary cloud cover.
It seems the GCM were specifically written to produce amplification, using the modeling assumptions.
http://typhoon.atmos.colostate.edu/Includes/Documents/Publications/gray2012.pdf
The Physical Flaws of the Global Warming Theory and Deep Ocean Circulation Changes as the Primary Climate Driver
The water vapor, cloud, and condensation-evaporation assumptions within the conventional AGW theory and the (GCM) simulations are incorrectly designed to block too much infrared (IR) radiation to space. They also do not reflect-scatter enough short wave (albedo) energy to space. These two misrepresentations result in a large artificial warming that is not realistic. A realistic treatment of the hydrologic cycle would show that the influence of a doubling of CO2 should lead to a global surface warming of only about 0.3°C – not the 3°C warming as indicated by the climate simulations…. ….The NAS or Charney Report of 1979. The basic error of the global GCMs has been the model builder’s general belief in the National Academy of Science (NAS) 1979 study – often referred to as The Charney Report – which hypothesized that a doubling of atmospheric CO2 would bring about a general warming of the globe’s mean temperature between 1.5 – 4.5°C (or an average of ~ 3.0°C) (Figure 5). This was based on the report’s assumption that the relative humidity (RH) of the atmosphere would remain quasi-constant as the globe’s temperature increased from CO2‘s influence to block IR energy loss to space. The Clausius-Clapeyron equation specifies that as the temperature of the air rises the ability of the air to hold more water vapor rises exponentially. If relative humidity (RH) of the air were to remain constant as atmospheric temperature rose then the water vapor (q) amount in the atmosphere would accordingly rise. The water vapor content of the atmosphere rises by about 50 percent if atmospheric temperatures were to increase by 5C and relative humidity remained constant. Rising water vapor content, particularly in the upper troposphere greatly reduce the amount of outgoing longwave radiation (OLR) which can escape to space.
http://www-eaps.mit.edu/faculty/lindzen/236-Lindzen-Choi-2011.pdf
On the Observational Determination of Climate Sensitivity and Its Implications
Richard S. Lindzen1 and Yong-Sang Choi2
Idso’s classic paper is interesting as Idso uses real world data to estimate the planet’s response to a change in feedback. The results of Idso’s analysis supports the assertion that the warming due to a doubling of atmospheric CO2 would be roughly 0.3C.
Idso Skeptics View of Global Warming
http://www.mitosyfraudes.org/idso98.pdf
“””””…..William Astley says:
July 17, 2013 at 1:39 pm
The lapse rate feedback is only a negative feedback (in the general circulation model) if the long wave radiation that is released when the water vapour condenses is emitted to space rather than trapped by increased water vapour. …..”””””
So far as I am aware, the process of condensation of water vapor, to form liquid water, is a purely thermal process; not a radiative process.
So there is no release of LWIR radiation due to condensation. Nothing heats up (increases in Temperature) as a consequence of condensation of water vapor; it won’t condense unless it is cooled down.
“””””…..davidmhoffer says:
July 17, 2013 at 11:15 am
george e smith;
Has anyone actually done any “real” laboratory experiments with CO2 mixtures, using a real 288 Kelvin thermal radiation source that is putting out a 10.1 micron peak wavelength emission spectrum at about 390 W/m^2.
>>>>>>>>>>>>>.
Yes.
http://www.john-daly.com/artifact.htm……..”””””””””
Well I read that paper, and it distinctly says they used a 1,000 to 1,200 deg C source for their infrared radiation. That is not even approximately comparable to a 288 Kelvin source.
A chilled bottle of water, would be a much closer to reality source of the appropriate radiation.
Their source is about 517 times brighter than the real world source.
And I do believe I said in my post, that any lab result would not replicate what happens in the real atmosphere.
george;
Well I read that paper, and it distinctly says they used a 1,000 to 1,200 deg C source for their infrared radiation.
>>>>>>>>>>>>>>
which they filtered to obtain the desired range.
I think the reason there is no hotspot in the troposphere is because a large part of the convective mechanism is coupled with thunderstorms (a la Willis Eschenbach) in the tropics. BTW, this “thermostat” is what puts a 31C upper limit on sea surface temperature. The troposphere is 6 to 10km above the surface and the thunderstorm chimneys rush the moist hot air rapidly up as high as 15+km. Where, in the thin air of this altitude, it radiates readily to space. These rapidly rising columns by-pass the troposphere. Certainly in this environment there is no chance for significant downwelling LWIR, either. Also,do models account adequately for the non-temperature enthalpy of these phenomena – kinetic energy of winds, falling rain and ice, electricity generated…
To build on what davidmhoffer pointed out: the real question is why do the AGW promoters decline to review their models and assumptions in the face of significant data- slr, OA, troposphere, weather patterns, etc. that do not support their predictions?
“””””…..davidmhoffer says:
July 17, 2013 at 3:15 pm
george;
Well I read that paper, and it distinctly says they used a 1,000 to 1,200 deg C source for their infrared radiation.
>>>>>>>>>>>>>>
which they filtered to obtain the desired range…….””””””
David, I’m highly suspicious of filters. Many types of filters which do attenuate a specific input wavelength, have a nasty habit of simply passing the energy on at a different wavelength. (Beer’s law simply doesn’t hold for the ENERGY TRANSMISSION).
But I’m quite happy to accept that you believe it’s a credible methodology.
Thanx
In reply to:
george e. smith says:
July 17, 2013 at 2:41 pm
“””””…..William Astley says:
July 17, 2013 at 1:39 pm
The lapse rate feedback is only a negative feedback (in the general circulation model) if the long wave radiation that is released when the water vapour condenses is emitted to space rather than trapped by increased water vapour. …..”””””
So far as I am aware, the process of condensation of water vapor, to form liquid water, is a purely thermal process; not a radiative process.
William;
Yes. I agree with your comment. Water evapourating and then condensing moves energy from the ocean to higher in the atmosphere, there is no radiation involved with condensing. My comment above was incorrect.
I will try again.
It appears the key issue (reality/observations Vs GCM) is how much water vapour condensates.
The increased atmospheric CO2 will cause an increase in ocean temperature which will cause an increase in water vapour.
The key question is does an increase in evapouration in the tropics result in increased cloud cover in the tropics?
It is my understanding that the general circulation models (depending on the model) either assumes there is no increase in cloud cover with increasing atmospheric CO2 or assumes the cloud cover reduces with increasing CO2. i.e The GCM assumes there is an increase in water vapour but no increase in cloud cover. The increased water vapour blocks long wave radiation which causes an increase in temperature of tropical troposphere at around 8K and an increase in long wave radiation, a portion of which is emitted back down to the surface of the planet to amplify the CO2 forcing.
http://typhoon.atmos.colostate.edu/Includes/Documents/Publications/gray2012.pdf
If there is an increase in cloud cover in the tropics the clouds reflect additional short wave radiation off to space which cools the ocean surface, negative feedback.
My point is the temperature of tropic troposphere will warm less if there is an increase in cloud cover to resist the change.
I got the impression from Held and Soden’s model, (see figure 1, page 11)
http://www.met.tamu.edu/class/atmo629/Summer_2007/Week%204/Water%20Vapor%20Feedback.pdf
that the temperature should increase by a roughly constant amount all through the atmosphere if their global warming theory is correct.
The folks at “Real Climate” addressed the issue here in a theoretical explanation they later admitted was wrong:
http://www.realclimate.org/index.php/archives/2004/12/why-does-the-stratosphere-cool-when-the-troposphere-warms/
“Imagine an atmosphere with multiple isothermal layers that only interact radiatively. At equilibrium each layer can only emit what it absorbs. If the amount of greenhouse gas (GHG) is low enough, each layer will basically only see the emission from the ground and so by Stefan-Boltzmann you get for the air temperature (Ta) and the ground temperature (Tg) that 2 Ta4 = Tg4 , i.e. Ta=0.84 Tg for all layers (i.e. an isothermal atmosphere). On the other hand, if the amount of GHGs was very high then each layer would only see the adjacent layers and you can show that the temperature in the top layer would approximate 0.84n Tg (n+1)-1/4 Tg, (see note) where n is the number of layers – much colder than the low GHG case. Hence the increased GHG steepens the surface-to-top temperature gradient.]
In the case of the Earth, the solar input (and therefore long wave output) are roughly constant. This implies that there is a level in the atmosphere (called the effective radiating level) that must be at the effective radiating temperature (around 252K). This is around the mid-troposphere ~ 6km. Since increasing GHGs implies an increasing temperature gradient, the temperatures must therefore ‘pivot’ around this (fixed) level. i.e. everything below that level will warm, and everything above that level will cool. ”
I think the Held-Soden model and “Realclimate” explanations were wrong because they assumed
an atmosphere releasing all its radiation from a 255 K height. In fact, radiation escapes to spase from multiple heights, ranging from earth’s surface to high in the stratosphere
, as Michael Hammer pointed out here.
http://jennifermarohasy.com/2009/03/radical-new-hypothesis-on-the-effect-of-greenhouse-gases/
. There’s no theoretical reason for a “hot spot” to exist.
The ancients certainly had creative imaginations…..
http://journals.ametsoc.org/doi/abs/10.1175/JTECH-D-13-00047.1?af=R
And that is what brought Douglas et al 2007, then relentless attacks against the authors followed Santer 08, then the gobsmacking by MM10 (after 18 months of the Team blocking them at every turn), then several subsequent papers not finding the “hot spot”, including this latest at The Hockeyschtick
http://hockeyschtick.blogspot.com/2013/06/new-paper-finds-hot-spot-predicted-by.html
One should also note the measurement biases in the balloon data:
http://journals.ametsoc.org/doi/abs/10.1175/JTECH-D-13-00047.1?af=R
And what would history of predictions be like without the Dawn of AGW Scaredom without digging up beyond 10 years ago.
Hansen et al Popular Science 1988
sorry, should be 1989
The fact that there is no tropospheric hot spot supports the assertion that planetary cloud cover increases or decreases to resist the forcing change. (Same as Lindzen and Choi paper’s conclusion, two papers, second addressing all third party criticism and reaching the same conclusion.)
The general circulation models assume that planetary cloud cover is either not affected by the CO2 forcing or assume planetary cloud cover is reduced by the CO2 forcing which explains why they have a tropical tropospheric hot spot. The GCM must do that to amplify the CO2 forcing. That result of that assumption is the GCM have/produce a tropical tropospheric hot spot. The fact that there is no hot spot indicates that the GCM incorrectly model planetary cloud cover.
Furthermore, Gray’s analysis indicates that the assumed 1C increase in surface temperature for a doubling of atmospheric CO2 for the zero feedback case is too high. He notes that the CO2 3.7 watts/m^2 forcing will increase evaporation which reduce the temperature rise due to the 3.7 watts/m^2 of CO2 forcing. His estimate for the surface temperature rise due to a doubling of atmospheric CO2 for the zero feedback case is 0.5C which is further reduced to 0.3C due to negative feedback caused by the increase in planetary clouds which is in agreement with Idso’s experimental analysis to determine the planet’s response to a change in forcing.
This is a connected problem. If Gray and Idso are correct – a doubling of atmospheric CO2 will result in only roughly 0.3C warming – then roughly 0.5C of the 0.7C warming in the last 70 years was due to solar magnetic cycle modulation of planetary cloud cover.
Also as noted above, the solar magnetic modulation of planetary cloud cover is required to explain the latitudinal variation of planetary temperature. i.e. Global warming is not global.
http://typhoon.atmos.colostate.edu/Includes/Documents/Publications/gray2012.pdf
But this pure IR energy blocking by CO2 versus compensating temperature rise for radiation equilibrium is unrealistic for the long-period and slow CO2 rises that are occurring. Only half of the blockage of 3.7 Wm-2 at the surface should be expected to go into temperature rise. The other half (~1.85 Wm-2) of the blocked IR energy to space will be compensated by surface energy loss to support enhanced evaporation. This occurs in a similar way as the earth’s surface energy budget compensates for half its solar gain of 171 Wm-2 by surface to air upward water vapor flux due to evaporation.
3. Nature of Cumulus Convection
The AGW theory and the many AGW global model simulations assume that tropospheric relative humidity (RH) will remain quasi-constant as CO2 induced blockage of infrared (IR) radiation brings about temperature rises. Surface evaporation and rainfall must also increase under these conditions. The temperature and moisture from the CO2 gas increases are programmed in the GCM models to artificially increase the globe’s upper-tropospheric moisture with increased global temperature and rainfall. The resulting extra increased upper tropospheric moisture is assumed to block large amounts of additional outgoing infrared (IR) radiation to space beyond the blockage of CO2 by itself. This consequently leads to significant amounts of extra global temperature increase which is two to three times larger than what the CO2 doubling temperature increase can accomplish alone. Our observational analysis shows that these additional feedback warming assumptions are unrealistic. These incorrect views of convectively induced global warming originated with the National Academy of Science (NAS) report of 1979.
The typical enhancement of rainfall and updraft motion in deep cumulus and cumulonimbus clouds within heavy raining meso-scale disturbance areas acts to increase the return flow mass subsidence in the surrounding broader clear and partly cloudy regions (Figure 8). Global rainfall increases typically cause an overall reduction of specific humidity (q) and relative humidity (RH) in the upper tropospheric levels of the broader scale surrounding convection subsidence regions. This leads to a net enhancement of radiation energy to space over the rainy areas and over broad areas of the globe. Albedo is typically decreased to space as much (or slightly more) than IR is increased to space in the broad scale clear and partly cloudy areas. But over the rain and cloudy areas albedo energy to space is increased slightly more than infrared (IR) radiation is reduced to space. The albedo enhancement over the cloud-rain areas tends to increase the net (IR + albedo) radiation energy to space more than the weak suppression of (IR + albedo) in the clear areas. Near neutral conditions occur in the partly cloudy areas (Figure 9).
Our observational studies (Gray and Schwartz, 2010 and 2011) of the variations of outward radiation (IR + albedo) energy flux to space (ISCCP data) vs. tropical and global precipitation increase (from NCEP reanalysis data) indicates that there is not a reduction of global net radiation (IR + Albedo) to space which is associated with increased global or tropical-regional rainfall. There is, in fact, a weak tendency to go the opposite way.
http://www-eaps.mit.edu/faculty/lindzen/236-Lindzen-Choi-2011.pdf
On the Observational Determination of Climate Sensitivity and Its Implications
Richard S. Lindzen1 and Yong-Sang Choi2
LOL, the hotspot is smart. It’s playing hard to get and has gone and hidden itself in the deep ocean.
sarc off
“”””””……William Astley says:
July 17, 2013 at 6:58 pm
In reply to:
george e. smith says:
July 17, 2013 at 2:41 pm
“””””…..William Astley says:
July 17, 2013 at 1:39 pm
The lapse rate feedback is only a negative feedback (in the general circulation model) if the long wave radiation that is released when the water vapour condenses is emitted to space rather than trapped by increased water vapour. …..”””””
So far as I am aware, the process of condensation of water vapor, to form liquid water, is a purely thermal process; not a radiative process.
William;
Yes. I agree with your comment. Water evapourating and then condensing moves energy from the ocean to higher in the atmosphere, there is no radiation involved with condensing. My comment above was incorrect…….”””””””
William, did you catch my point that condensation, or freezing (phase changes) ONLY occur AFTER the material has cooled by losing heat energy to a colder heat sink, and also losing the latent heat, so the phase change can occur.
For condensation of H2O vapor the latent heat is about 590 calories per gram. That’s nearly six times the heat energy required to boil the water that condenses.
But nothing actually heats up; condensation happens because everything there is cooling down.
Now as I said, there can also be energy loss due to thermal radiation, but I suspect it is small compared to simple conduction from molecule to molecule.
George.e..smith is right.
Cooling must occur first for condensation to start.
That cooling is primarily a result of pressure reduction with height as per the Ideal Gas Laws whereby the reduction in pressure allows expansion, the gases become less dense and temperature falls resulting in condensation. The expansion converts kinetic energy to potential energy and the latter does not register on sensors so any sensors will register net cooling.
If convection is enhanced for any reason then the warmed gases will reach higher before condensing because the speed of uplift distorts the lapse rate locally but once the uplift is cut off as it must be on a rotating sphere illuminated by a point source of light (the sun) the heights revert to what they would have been in the absence of the uplift.
All one needs to cancel any warming effect from GHGs is slightly more vigorous convection reaching a fractionally higher level.
Latent heat is removed prior to condensation by the conversion of kinetic energy to potential energy as the molecules rise against gravity to a region of lower pressure.
Potential energy is just latent heat at a greater height. Whether one considers latent heat of phase changes or potential energy doesn’t matter because neither are recorded as heat by sensors.
The current confusion about the thermal behaviour of the Earth system is that no one seems to realise that the rate of conversion to and fro between the latent heat of phase changes and potential energy during adiabatic uplift and descent is variable with any forcing element other than mass, gravity or insolation.
It is that variability which keeps overall system energy content stable at the expense of regional redistribution of that energy.
There is no way anything can be warmed by latent heat release in such a situation.
However, the energy is still there within the molecules but in the form of potential energy and since the cooled gases become denser and heavier than their surroundings they then start to descend.
As they descend, perhaps in a high pressure cell they become warmer as potential energy is converted back to kinetic energy.
The key is the lapse rate set by gravity and mass. The circulation will always be forced into a configuration that meets the parameters set by mass and gravity otherwise an atmosphere cannot be retained.
Mass, gravity and insolation set the base level of system energy content for any planet with an atmosphere.
Everything else that might try to alter that base level simply results in atmospheric circulation changes (atmosphere includes oceans for this purpose) that adjust the rate of conversion between kinetic and potential energy so as to keep the base level of system energy content stable.
That ‘everything else’ is actually all the complex variations that arise from the materials contained within the system whether Earth, oceans or atmosphere.
Composition changes, whether in the Earth, oceans or atmosphere can only affect circulation and not system energy content.
More potential energy and less kinetic energy allows more retention of energy because potential energy cannot radiate out.
Less potential energy and more kinetic energy allows more loss of energy because kinetic energy can radiate out.
In every situation where any sort of composition change seeks to disturb the base level of energy the reconfiguration of the circulation results in an instant equal and opposite thermal response via the exchange of PE for KE and vice versa.
The net effect is system stability despite composition variations.
Clarification of this point is required:
“Latent heat is removed prior to condensation by the conversion of kinetic energy to potential energy as the molecules rise against gravity to a region of lower pressure.”
Heat (not latent heat) is removed prior to condensation by conversion of kinetic energy to potential energy which then provokes condensation and when the phase change occurs the release of latent heat causes the air parcel to rise a little further with additional conversion of KE to PE until it reaches the correct lapse rate temperature for its height and then it stops rising and begins to descend.
One can see that in operation in convective cumulus towers. The uplift is energised when condensation occurs and the latent heat of the phase change is released.
Rather than the released latent heat being radiated to space the additional uplift it causes converts the excess KE to PE until thermal balance is once more achieved at a higher level.
The transmission of energy through the atmosphere is at the speed of light, for that atmospheric density, so very nearly the speed in a vacuum. This very small reduction in speed makes no difference to temperatures of the atmosphere because times are so very short. What GHG’s actually do is to remove some of that incoming energy to increase their own kinetic energy and reduce that falling onto the surface. The main atmospheric gasses, O2 and N2 are heated by the kinetic transfer of energy from the GHG’s. This heat escapes to space.
” O2 and N2 are heated by the kinetic transfer of energy from the GHG’s”
Not entirely.
Most O2 and N2 heating starts at the surface with conduction and is raised upward by convection, becoming PE in the process.
“””””…..Stephen Wilde says:
July 18, 2013 at 1:00 am
George.e..smith is right.
Cooling must occur first for condensation to start.
That cooling is primarily a result of pressure reduction with height as per the Ideal Gas Laws whereby the reduction in pressure allows expansion, the gases become less dense and temperature falls resulting in condensation. …….”””””””
The cooling is primarily a result of the earth losing energy to space.
To the extent that the flow of “heat energy” is a part of that process, by means of conduction (collisions between molecules), and convection (physical transport of molecules), the second law insists that the natural direction of that flow is from “hot” to “cold”. Ergo, there must be a negative Temperature gradient in the atmosphere to get “heat energy” to propagate from the surface to the upper reaches of the atmosphere.
Ultimately, only EM radiation can export energy out of the earth atmosphere to space (ignoring satellite launches, and other minor massive ejecta for the nit pickers).
So the thermal energy transported to high altitudes, must be ultimately converted to Electro-magnetic radiation, in order to escape the planet. Now some energy has already escaped to space by radiation directly from the surface, and Trenberth insists that is only 40 Watts per square meter, or about 10 % of the roughly 390 W/m^2 corresponding to a 288 Kelvin black body spectrum.
So 90% of earth’s energy must be radiated from the upper atmosphere to space; which is far too cold to do that, even if it was a black body, which it isn’t.
And that 90% pretty much has to be emitted at the 15 micron CO2 LWIR band, since N2 and O2 and Ar don’t radiate. Well I suppose we have to kick in the H2O and O3 GHG bands as well.
But ! the inescapable conclusion is that only 10% of the earth’s radiant energy emission can be in a 288 K thermal emission spectrum from the earth surface, since the atmosphere can only radiate GHG bands.
So seen from outer space the earth radiation spectrum should be a small (10 % area) 288K thermal spectrum, overlaid with prominent GHG band spectra like CO2 15 micron peaks, and various water peaks, plus the Ozone 9.6 micron peak.
Well sadly, that isn’t what is observed. There are > NO < GHG spectral peaks in the external radiation spectrum of the earth.
There are ONLY GHG spectral DIPS in an otherwise BB like thermal continuum spectrum.
Either Trenberth's 40 W/m^2 is wrong, or else the atmosphere itself IS radiating a normal thermal spectrum appropriate to its Temperature.
You can't generate a black body like thermal spectrum, out of the resonance lines of molecular oscillation and vibration modes, or rotation modes.
The solar spectrum of the sun consists of a roughly black body like thermal continuum spectrum, peaking at around 0.5 microns wavelength (plotted on wavelength scale; not wave number) , and overlaid with the Fraunhoffer lines of either bright atomic spectral lines, due to elements in the sun, or dark atomic absorption lines, due to absorption of elements in the solar outer atmosphere. Well that's the 4-H club version of what gose on. Use your imagination or Dr Svalgaard to sanitize it for prime time.
The point being, that the resonance emissions / absorptions of atoms / ions are not being grossly smudged out by the ambient Temperature of the sun; they remain characteristic of the atomic species that radiate / absorb them.
Same thing must apply to earth , the line / band spectra of molecular resonances, are not smudged out by the atmospheric, or surface Temperatures.
The background thermal radiation continuum, is a consequence of thermal emissions from either the surface, or the atmosphere itself, as a direct consequence of their Temperatures; or both in concert.
The spectral spread of the earth emission is huge, enormous, compared to the puny line broadening that is conceivably possible, due to Temperature (Doppler) broadening, and Pressure / density (collision) broadening, of molecular resonance emission lines.
That spectral spread, is only possible due to the Planck radiation formula which seems to govern thermal emissions due to Temperature, based on the hypothetical ideal black body radiation concept, which posits an emission spectrum ranging from zero to infinite wavelength or frequency; excluding of course both end points.
Evidently, the Planck formula was re-derived by Bose based on his concept of Bose-Einstein statistics, that apply to Bosons (including photons), as distinct from the Fermi-Dirac statistics that apply to Fermions, or the Maxwell-Boltzmann statistics, that apply to assemblages of interacting (colliding) "particles". I'll let the Quantum Chromo / Electro- Dynamics folks, sanitize that for you.
I am surprised no-one has commented on WG1 in the Fifth Assessment. When I looked for a discussion of the tropical hotspot in ZOD, it was missing – there was just a great big gap between Middle Troposphere and Lower Stratosphere. Watts Up? I asked.
In FOD, there were little snippets of information, but nothing of any substance – so I blew a loud whistle and said “Heh! Something is missing!”
SOD arrived, and it was still absent. So I got cross:
“The whole of the debate about the problems of reconciling radiosonde data with GCM models is missing. Figure 10.7 in WG1 of AR4 showed a predicted heating of about 0.6 deg C per decade between 400 and 100hPa and -30 deg S to 30deg N. However, none of the data from satellites or radiosondes confirms anything like that rate of heating. Allen, Robert J. and Sherwood, Steven C. (2008) Warming maximum in the tropical upper troposphere deduced from thermal winds. Nature Geosci 1 (6), 399- 403, http://dx.doi.org/10.1038/ngeo208 note “Climate models and theoretical expectations have predicted that the upper troposphere should be warming faster than the surface. Surprisingly, direct temperature observations from radiosonde and satellite data have often not shown this expected trend,” for instance – and then go on to suggest biases in the data. Lanzante, John R., Melissa Free, 2008: Comparison of Radiosonde and GCM Vertical Temperature Trend Profiles: Effects of Dataset Choice and Data Homogenization. J. Climate, 21, 5417–5435.
doi: http://dx.doi.org/10.1175/2008JCLI2287.1 (Not quoted in SOD) note that even after homogenization “in general the observed trend profiles were more similar to one another than either was to the GCM profiles.” Singer, S Fred, (2011). Lack of Consistency Between Modeled and Observed Temperature Trends Energy & Environment, 22, 375-406 DOI – 10.1260/0958-305X.22.4.375 (Not quoted in SOD) drew attention to the fact that “The US Climate Change Science Program [CCSP, 2006] reported, and Douglass et al. [2007] and NIPCC [2008] confirmed, a “potentially serious inconsistency” between modeled and observed trends in tropical surface and tropospheric temperatures.” and noted further that “Santer’s key graph — misleadingly suggests an overlap between observations and modeled trends. His “new observational estimates” conflict with satellite data. His modeled trends are an artifact, merely reflecting chaotic and structural model uncertainties that had been overlooked. Thus the conclusion of “consistency” is not supportable and accordingly does not validate model-derived projections of dangerous anthropogenic global warming.” Douglass, D. H., Christy, J. R., Pearson, B. D. and Singer, S. F. (2008), A comparison of tropical temperature trends with model predictions. Int. J. Climatol., 28: 1693–1701. doi: 10.1002/joc.1651 (Not quoted in SOD) note “Model results and observed temperature trends are in disagreement in most of the tropical troposphere, being separated by more than twice the uncertainty of the model mean.” Titchner, Holly A., P. W. Thorne, M. P. McCarthy, S. F. B. Tett, L. Haimberger, D. E. Parker, 2009: Critically Reassessing Tropospheric Temperature Trends from Radiosondes Using Realistic Validation Experiments. J. Climate, 22, 465–485. doi: http://dx.doi.org/10.1175/2008JCLI2419.1 (Not quoted in SOD) note that “tropical tropospheric trends in the unadjusted daytime radiosonde observations, and in many current upper-air datasets, are biased cold, but the degree of this bias cannot be robustly quantified.” It was my clear understanding that the Assessment Report was to review the current literature – there are some notable omissions, as I have noted above. Moreover, I had understood that the Report was to give due weight to differences of opinion – instead, any reading of the present text leaves the clear impression that the debate is being studiously avoided rather than being addressed. And one thing my own review of the debate has brought home to me is that even the satellite data does not come near the predictions that were made in AR4 – the discrepancy between ALL data and the models is wide. This debate MUST be reflected in the text.”
I shall be interested to read the final text.
george e smith says:
July 18, 2013 at 12:57 pm
“So seen from outer space the earth radiation spectrum should be a small (10 % area) 288K thermal spectrum, overlaid with prominent GHG band spectra like CO2 15 micron peaks, and various water peaks, plus the Ozone 9.6 micron peak.
Well sadly, that isn’t what is observed. There are > NO < GHG spectral peaks in the external radiation spectrum of the earth."
Very good. So GHG's serve only toabsorb and re-emit the same photons over and over again, until about as much escape to space on these frequencies as would have without the GHG's directly from clouds / the surface.
I've been likening it to a fog for years now; it scatters the energy but neither absorbs nor net emits it.
johnmarshall says:
July 18, 2013 at 7:02 am
“The main atmospheric gasses, O2 and N2 are heated by the kinetic transfer of energy from the GHG’s. This heat escapes to space.”
Thermalization and dethermalization happen to equal amounts under localo thermalo equilibrium (Kirchhoff’s Law). IOW: O2 and N2 are heated, but return the kinetic energy to GHG’s which then re-emit the photons.
Alan D McIntire says:
July 17, 2013 at 7:28 pm
“I got the impression from Held and Soden’s model, (see figure 1, page 11)
http://www.met.tamu.edu/class/atmo629/Summer_2007/Week%204/Water%20Vapor%20Feedback.pdf
that the temperature should increase by a roughly constant amount all through the atmosphere if their global warming theory is correct.
The folks at “Real Climate” addressed the issue here in a theoretical explanation they later admitted was wrong:
[…]
I think the Held-Soden model and “Realclimate” explanations were wrong because they assumed
an atmosphere releasing all its radiation from a 255 K height.”
Their first mistake is that they assume the atmosphere to be hydrostatic (i.e. unable to expand; as in a pressure cooker).
I skimmed through the PDF. NOWHERE do they talk about AIR PRESSURE, vertical air movement is once mentioned where they state that water vapour rises etc.; no explanation is given whether or not the barometric equation is used (it is, in the models; it assumes hydrostasis and we KNOW that the atmosphere is not hydrostatic!)
Likewise the stupid explanation by realclimate starts out with “Imagine an atmosphere with multiple isothermal layers that only interact radiatively.”
Yes, that’s a nice Gedankenexperiment but we know it is false for the atmosphere of the Earth; so scratch the rest!
george e. smith said:
“The cooling is primarily a result of the earth losing energy to space.”
General global cooling, yes.
Cooling leading to local condensation in a rising column of air, no.
The former is radiative cooling and the amount that can occur is dependent on the proportion of total system energy content that is in the form of kinetic energy rather than potential energy at any given time.
The latter results from kinetic energy being converted to potential energy as warm air rises against the force of gravity in a convective column.
So proclaims the “there’s magic back & forth-isms goin’ own that mayuth caint see nor cownt!” wannabe.
You really need to get with the fact what you say’s easy to check.
Being shameless isn’t intellectual validity.
Bear that in mind, or you can be reminded in front of hundreds. If not thousands.
=====
davidmhoffer says:
July 16, 2013 at 10:15 pm
2) Can the hot spot in the tropics be regarded as a fingerprint of greenhouse warming?
No, nor can the absence of one be construed as lack thereof.
1&2- the ipcc believe so –
http://www.ipcc.ch/publications_and_data/ar4/wg1/en/ch8s8-6-3-1.html
box 8.1 states clearly “Under such a response, for uniform warming, the largest fractional change in water vapour, and thus the largest contribution to the feedback, occurs in the upper troposphere. In addition, GCMs find enhanced warming in the tropical upper troposphere, due to changes in the lapse rate (see Section 9.4.4). This further enhances moisture changes in this region, but also introduces a partially offsetting radiative response from the temperature increase, and the net effect of the combined water vapour/lapse rate feedback is to amplify the warming in response to forcing by around 50% (Section 8.6.2.3).”
as per the models- http://www.ipcc.ch/publications_and_data/ar4/wg1/en/figure-8-14.html
3/ it is clear the ipcc believes they are close enough, yet they are most certainly not eg-
http://meteora.ucsd.edu/~pierce/papers/Pierce_et_al_AIRS_vs_models_2006GL027060.pdf
where they find the models are clearly wrong using another different satellite than the other two that found the model so far out that they are not worth using, yet here they are still being used as the largest portion of the surface temp models that are used in predictions!
this says it all about the history of this-
http://www.john-daly.com/sonde.htm
Stephen Wilde says:
July 18, 2013 at 9:17 pm
“The latter results from kinetic energy being converted to potential energy as warm air rises against the force of gravity in a convective column.”
Stephen, how should that work in a thermodynamic way? It would reduce entropy. (Brownian motion is unordered; potential energy is not.)
As I understand the Ideal Gas Law, the temperature one measures depends on the density of the gas as less density means less collisions of individual molecules with the measuring apparatus, or IOW, less kinetic energy per volume unit of gas.
DirkH
As gas molecules move apart or rise higher within a gravitational field kinetic energy gets replaced by potential energy.
I did find authority for that not long ago but cannot immediately find it.
Potential energy replaces kinetic energy in a gas molecule both when the molecule rises higher in the gravitational field and when the gas molecules move further apart.
Since reducing pressure with height around a sphere allows more space between molecules
and between the molecules and the ground the molecules cool due to conversion of kinetic energy to potential energy.
No radiation involved except in the background as part of the wider picture. It is a mechanical process involving movement within a gravitiational field generated by a sphere.
DirkH
I am sure that everything at a temperature above 0K radiates heat even the non GHG’s. It is how those gasses get that energy in the first place that is important, whether directly from insolation as the GHG’s or from secondary processes like kinetic collision. It all results in energy radiating from earth.
johnmarshall says:
July 19, 2013 at 4:22 am
“DirkH
I am sure that everything at a temperature above 0K radiates heat even the non GHG’s. ”
A gas molecule cannot radiate as long as its energy is lower than the energy of a photon of the lowest emission line in its line spectrum. It cannot and does not emit a continuous blackbody spectrum. It can transfer kinetic energy to another molecule though, and through random collisions a small number of the molecules will reach the necessary energy to radiate.
O2 and N2 do have very weak absorption / emission lines in the LWIR range. Unlike CO2 or H2O these are a few spikes only, as the vibrating mode is only possible in a 3-atom molecule.
So, O2 and N2 do radiate a small amount of heat. But on their very narrow lines.
the earths spectrum is of an aprox blackbody of 210K to 310K. water vapour and co2 will always be radiating, however water vapour has a lot more emission lines within that range than co2. co2 has finer vibrational lines whereas water vapour has vibrational and rotational transistions making it absorb lower in the spectrum, but not as fine lines.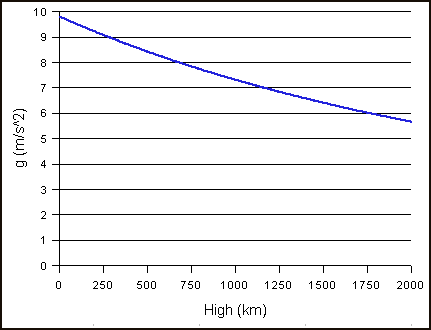
@stephen wilde –
the change in gravity over our atmospheres height is virtually nothing, in fact in space it is still about 90% that of ground level.
A for what it is worth note:
The commonly held belief is thunderstorm clouds have a negatively charged base and a positively charged top.
A few years ago my husband edited a scientific paper for some Chinese scientists who used a field mill to determine the actual charges in thunderstorms. Instead of two zones as commonly thought the thunderstorm is a sandwich of three charged zones.
hmm, this statement –
“This change in thermal structure of the troposphere is known as the lapse rate feedback. It is a negative feedback, i.e. attenuating the surface temperature response due to whatever cause, since the additional condensation heat in the upper air results in more radiative heat loss.”
confuses the question as the main driver of the ‘thermal’ structural changes in the upper troposphere is not the lapse rate changes as such, it is the water vapour itself. the ipcc state-
“Under such a response, for uniform warming, the largest fractional change in water vapour, and thus the largest contribution to the feedback, occurs in the upper troposphere. In addition, GCMs find enhanced warming in the tropical upper troposphere, due to changes in the lapse rate (see Section 9.4.4). This further enhances moisture changes in this region, but also introduces a partially offsetting radiative response from the temperature increase, and the net effect of the combined water vapour/lapse rate feedback is to amplify the warming in response to forcing by around 50% (Section 8.6.2.3). The close link between these processes means that water vapour and lapse rate feedbacks are commonly considered together. The strength of the combined feedback is found to be robust across GCMs, despite significant inter-model differences, for example, in the mean climatology of water vapour (see Section 8.6.2.3). ”
where they clearly state that the overall response to the feedback is not negative, but positive by a large portion. if this were negative, the surface temp models would not predict a warming at all. the water vapour feedback would need to be offset completely by lapse rate feedback changes. the ipccs position/gcms position of this is-
http://www.ipcc.ch/publications_and_data/ar4/wg1/en/figure-8-14.html
where it is clear that water vapour feedback is MUCH stronger and counteracts the ‘lapse rate’ feedback. the two should be considered together as the ipcc considers and combined. they claim the tropospheric hot spot exists because more water vapour should exists in that region (raising of the upper troposphere), and small fractional changes make a larger change in the temperature anomaly because GHGs are in the lower part of the log scale rather that the higher saturated state. ie in the ipccs words-
“The radiative effect of absorption by water vapour is roughly proportional to the logarithm of its concentration, so it is the fractional change in water vapour concentration, not the absolute change, that governs its strength as a feedback mechanism. ”
from-
http://www.ipcc.ch/publications_and_data/ar4/wg1/en/ch8s8-6-3-1.html
the no show of the hot spot is proof that the models are WRONG. its as simple as that. they overstate the amplification by water vapour feedback by a large margin, and prove that feedback through other means (like clouds/rain) prevent the upper troposphere from warming. ie there is no runaway warming scenario possible, feedback is negative, and Cagw is rubbish.
@Mr. Crok –
your post should start with the ipcc position on this-
http://www.ipcc.ch/publications_and_data/ar4/wg1/en/ch8s8-6-3-1.html
box 8.1