Other than the following maps, this post presents the weekly and monthly satellite-era sea surface temperature anomalies for the hurricane development regions—plus the extratropical waters off the east coast of the U.S. We’re including the extratropical waters off the east coast of the U.S. because it was part of Sandy’s storm track last year and people are interested in it. For additional discussions of the sea surface temperatures and anomalies of Sandy’s storm track, refer to the blog posts here and here.
For illustrations and discussions of the longer-term data, including the lack of a warming trend in the sea surface temperatures of the Main Development Region from 1930 to 1995, refer to this year’s first post on this subject here.
###
The first illustration is an animation of sea surface temperature (not anomaly) maps. One map presents the sea surface temperatures for the week centered on July 10, 2013. The other presents the climatology for the same week, which is based on the average sea surface temperatures for that week during the period of 1971-2000. To determine the anomalies for July 10, 2013, the 30-year average (the climatology) is subtracted from the observed values for the past week.
North Atlantic SST Animation
I presented the sea surface temperature maps for two reasons: First, to show that the sea surface temperatures for much of the Main Development Region (10N-20N, 80W-20), for much of the extratropical U.S. east coast waters (24N-40N, 80W-70W), for the Caribbean (10N-20N, 84W-60W) and for the Gulf of Mexico (21N-31N, 98W-81W) are above 26 deg C, which is considered the threshold for tropical storm development. Refer to the discussion here. The second reason: to show that the sea surface temperatures in those regions are not unusually warm. And we’ll confirm that with the following graphs.
WEEKLY DATA
The following four graphs of weekly sea surface temperature anomalies since January 1990 also include horizontal lines in red depicting the July 10, 2013 values. Of the four regions presented in Figures 1 to 4, the Main Development Region had the highest sea surface temperature anomaly of +0.24 deg C last week, but that is not unusual there. At the other end of the spectrum, the sea surface temperature anomalies for the Gulf of Mexico were below the 1971-2000 average—and that also isn’t unusually cool.

Figure 1
#######

Figure 2
#######
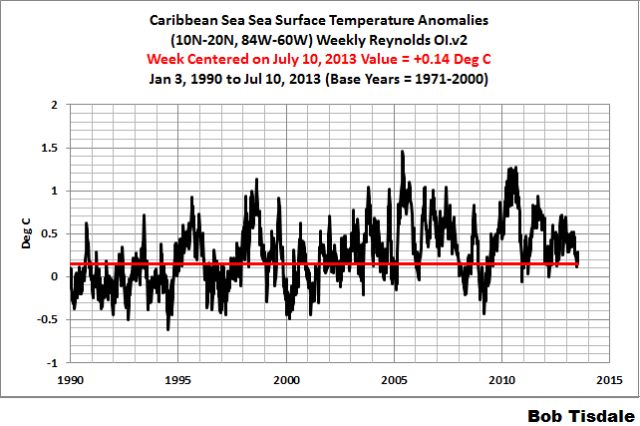
Figure 3
#######

Figure 4
MONTHLY DATA
While we should be interested in the most recent values (the weekly data), there are likely some readers interested in the monthly data for those four regions, so I’ve presented them in Figures 5 through 8.

Figure 5
#######
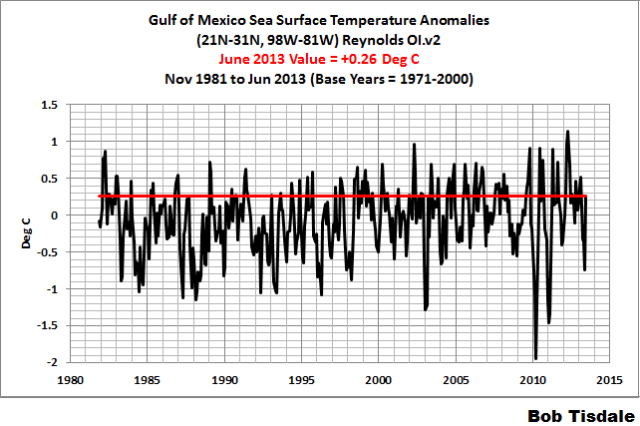
Figure 6
#######
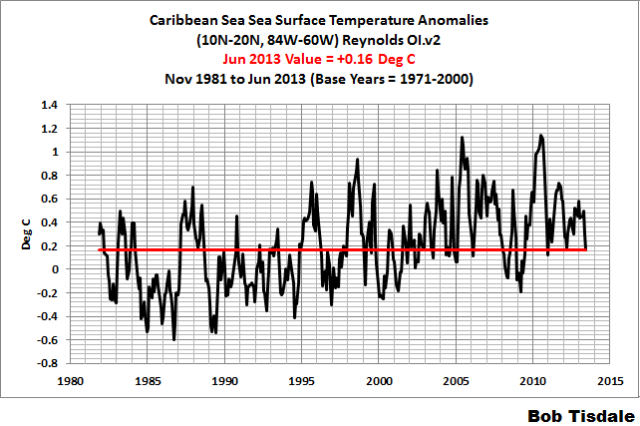
Figure 7
#######
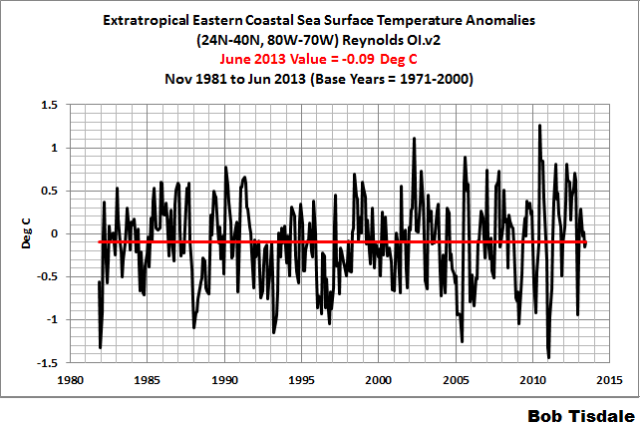
Figure 8
CLOSING
The sea surface temperatures for most of the hurricane development regions are above the temperatures required for tropical storm development, but they are not unusually warm.
Also, there is nothing in the ocean heat content records or satellite-era sea surface temperature data to indicate greenhouse gases were responsible for their warming. That is, the data indicate the oceans warmed naturally. If that topic is new to you, refer to the illustrated essay “The Manmade Global Warming Challenge” [42MB].
SOURCES
The Sea Surface Temperature anomaly data used in this post is available through the NOAA NOMADS website:
http://nomad1.ncep.noaa.gov/cgi-bin/pdisp_sst.sh
or:
http://nomad3.ncep.noaa.gov/cgi-bin/pdisp_sst.sh?lite=
@- “Also, there is nothing in the ocean heat content records or satellite-era sea surface temperature data to indicate greenhouse gases were responsible for their warming. That is, the data indicate the oceans warmed naturally.”
Unless you are invoking a supernatural or magical cause then ALL warming is ‘natural’ and the result of a greater amount of energy entering the oceans, or less energy being lost from the oceans.
The observations make it clear that there is ‘natural’ warming from extra energy. But as you correctly point out the observations do not explain the cause of the warming or the source of the extra energy. They only describe the warming.
The physics of energy absorption by dipole molecules in the atmosphere provides the explanation.
Lots of dry air over the tropics this year. took down ace in forecast, but pattern will favor development of waves west in heart of season and up ante for US coast. In fact the mean number of storms for major east coast seasons is only 10, a little looked at fact.. Global ace crashing again, only 60% of average! Its not just the atlantic, its all the tropics and I love it cause its yet another reminder how wrong the IPCC is about their trapping hot spot idea.
Remember the air over the ocean, especially in mid layers where dry air means cumulus towers can entrain the air and inhibit development is as huge as the water! Closest atlantic sst analogs are 1996/1999. Also DIFFERENCE in temps. cold off w coast SAMER ( nino 1.2) warm in Caribbean, cold in central atlantic big factor in mean surface pressures in sw atlantic being favorable at the HEIGHT of the season. When I was at PSU in 1970s.. Dr. John Cahir used to say the real hurricane season starts 15 Aug. We are going back toward those times again!
The weatherbell.com site can give you a visual on this for 3 day running means vs same periods all the way back to 1982. Another Ryan Maue creation
http://models.weatherbell.com/sst/sst_natl_previous.php
In short while heightened impact remains a concern for the coming years of warm amo, within 10 years the atlantic will shift for good and the only upswing in numbers will be from the extra naming of eyesores near the Azores ( or other areas we could not see with satellite in previous eras)
Did post on dry air and ace on our premium site yesterday. Love your work, btw!
Thanks for the comment, Joe.
Regards
The “Active” hurricane season is Aug 15- Oct 15. Cape Verde systems mid Aug-mid Sep. Western Carribean “rainy” season thereafter. Global teleconnections look very favorable. Cold Nino 3.4. Minimal wind shear. And, water temps between Africa and Caribbean ARE slightly above normal. One month to blast off. African rainy season in August.
I have a question. As I understand it, what happens in the atmosphere is but forms the storms but the ocean temps are what “boost” it into a tropical storm and/or hurricane. In other words, without the higher ocean temperatures a storm won’t become a tropical storm and/or hurricane and without the storm higher ocean temperatures will not form a storm that will be over the warmer water long enough to be “boosted”.
Have I got that basically right?
(A simple “Yes”, “No”, “Almost”, “Back to school for you, Grasshopper!” will suffice.)
izen says: “Unless you are invoking a supernatural or magical cause then ALL warming is ‘natural’ and the result of a greater amount of energy entering the oceans, or less energy being lost from the oceans.
“The observations make it clear that there is ‘natural’ warming from extra energy. But as you correctly point out the observations do not explain the cause of the warming or the source of the extra energy…”
izen, I didn’t state or imply that there was anything “supernatural or magical”. You’ve concentrated on the “natural” portion of the sentence you quoted but overlooked the prior portion which read, …there is nothing in the ocean heat content records or satellite-era sea surface temperature data to indicate greenhouse gases were responsible for their warming…
And as you noted, sea surface temperatures and ocean heat content can warm without an increase in energy entering the oceans. When surface winds slow, there is less upwelling of cool waters to the surface and less evaporation. The result: sea surface temperatures and ocean heat content can warm when surface winds slow.
Would you prefer it if I were to replace “the data indicate the oceans warmed naturally” with “the data indicate the oceans warmed via naturally occurring coupled ocean-atmosphere processes”?
Gunga Din: According to the following link…
http://www.theweatherprediction.com/tropical/
..there are six ingredients to a tropical cyclone. In the order listed:
1. Warm sea surface temperatures
2. Distance from the equator
3. “Saturated lapse rate gradient near the center of rotation of the storm”
4. Low wind shear
5. Lots of moist air from the surface to mid levels of the atmosphere
6. A tropical wave.
I’ve also seen it presented with only three (easier-to-remember) ingredients:
1. Warm sea surface temperatures
2. Low wind shear
3. Lots of moist air from the surface to mid levels of the atmosphere
izen says:
July 15, 2013 at 7:24 am
@- “Also, there is nothing in the ocean heat content records or satellite-era sea surface temperature data to indicate greenhouse gases were responsible for their warming. That is, the data indicate the oceans warmed naturally.”
“Unless you are invoking a supernatural or magical cause then ALL warming is ‘natural’ and the result of a greater amount of energy entering the oceans, or less energy being lost from the oceans.”
Typical Alarmist: data is not independent of theory (cause) and any change in data must have a known cause – which is always increasing CO2 for Alarmists. Typical category mistake. When one cites natural variability they are referring to data, specifically the full range of our data from lowest to highest value. That is, they are referring to what nature has done on its own. As for causes or theories, the genuine scientist knows that he does not know all of the causes behind natural variability. The Alarmist, not being a scientist but a metaphysician, assumes that the cause is increasing CO2.
Mr. Tisdale. Love your articles and the knowledge I have gained from them. One question though. I was born and raised on the Bay of Fundy. Why is the Gulf of Mexico included in the North Atlantic? Please correct me if I’m wrong,but I was taught the North Atlantic started just where the Bay of Fundy,at Presque Isle,Maine met up with Saint Stephen’s,NB. Or was this just local talk to keep us Easterner’s happy?
Justthinkin: The NOAA/ESRL uses the coordinates of 0-70N, 80W-0 for the North Atlantic, and those are the coordinates I use for the North Atlantic in the sea surface temperature updates. Example of North Atlantic SST anomaly graph:
http://bobtisdale.files.wordpress.com/2013/07/07-no-atl.png
From the most recent update:
http://bobtisdale.wordpress.com/2013/07/08/june-2013-sea-surface-temperature-sst-anomaly-update/
For this post, I clipped the map at 50N, because the highest latitude I was dealing with was 40N, and I wanted to concentrate on the areas being discussed.
Regards
======================================================================
Thank you. Your patience with people reminds me of REP.
SSTs are necessary for tropical cyclones, but only to a point. Shear and capping are the predominant factors keeping a lid on the tropics. I.e., an unsheared, uncapped cyclone will rapidly cycle dry air.
@- Bob Tisdale
“And as you noted, sea surface temperatures and ocean heat content can warm without an increase in energy entering the oceans. ”
My apologies, I have obviously expressed myself in an unclear manner as this is the exact OPPOSITE to the concept I was trying to communicate.
ANY temperature change of the oceans MUST indicate a change in the amount of energy in the oceans. That indicates a change in the dynamic balance between what energy enters the oceans from solar photons and the atmosphere and that which is lost to the atmosphere and eventually to space.
All of that is physics.
The past record of this natural variation had various causes for the past gain and loss of energy by the oceans. ENSO on the short (annual) term, Milankovitch cycles at the long (millenial) term.
The present trend in sea temperatures over the last few decades that the graphs you post show must also have a increased source, or reduced sink for the energy and therefore the temperature of the oceans to increase.
The data IS independent from the cause, but the data is purely descriptive and requires a cause to provide the explanation for the observations. That is where the physics comes in. ENSO is capable of greater variation in the short term but there are historical observations and physics arguments that indicate its effect is neutral over decadel time-frames.
I would welcome the appearence of an alternative explanation for the trend in sea temperatures seen over the last century. there is little in the historical record and proxy indicators of any similar variation during the Holocene, so until a better hypothesis emerges I like 97% of the informed scientific literature will accept the role of increased atmospheric CO2 in the explanation of the observed data.
Thanks, Bob. Good information.
It seems an increase in hurricane formation will be needed to classify 2013 as an over-active season.
izen,
97% of the “informed scientific literature” makes no such claim. Perhaps you need to do a LOT more research.
For me to understand weather l need to observe it, as this is how l have learned about weather.
For big hurricanes to form then the atmosphere needs to play ball. lts by looking at the way that groups of clouds over the mid Atlantic are behaving. ls what shows me that current conditions over the mid Atlantic are not suited to the forming of large hurricanes.
izen says: “My apologies, I have obviously expressed myself in an unclear manner as this is the exact OPPOSITE to the concept I was trying to communicate.”
Well then, the example I provided shows your speculations are wrong.
izen says: “The data IS independent from the cause, but the data is purely descriptive and requires a cause to provide the explanation for the observations. That is where the physics comes in. ENSO is capable of greater variation in the short term but there are historical observations and physics arguments that indicate its effect is neutral over decadel time-frames.”
The data disagrees and shows that its effect is not neutral over time. I’m not sure why that’s so difficult for you to comprehend. The ocean heat content data and satellite era sea surface temperatures indicate that ENSO acts as a chaotic recharge-discharge oscillator with La Niñas performing as the recharge mode and El Niños serving the discharge role. It’s blatantly obvious in the graphs included in the essay linked in the post:
http://bobtisdale.files.wordpress.com/2013/01/the-manmade-global-warming-challenge.pdf
izen says: “I would welcome the appearence of an alternative explanation for the trend in sea temperatures seen over the last century.”
I’ve documented the causes of the warming of ocean heat content since 1955 and sea surface temperatures over the past 30 years. Sea surface temperatures cooled from the early 1940s to the mid-to-late 1970s. Aren’t you aware of that? And before the 1940s, the sea surface temperature record is so sparse and has had such drastic adjustments that there’s no need to bother to examine it. Bottom line: If your beloved hypothesis of manmade global warming doesn’t work for the oceans over the past 30 years, it doesn’t work at all.
izen says: “there is little in the historical record and proxy indicators of any similar variation during the Holocene…”
Thanks for the laugh, izen. Do you really expect the paleoclimatological records to have sufficient resolution and accuracy to determine cause and effect?
izen says: “…so until a better hypothesis emerges I like 97% of the informed scientific literature will accept the role of increased atmospheric CO2 in the explanation of the observed data.”
Obviously, you still haven’t figured out why there’s such a high percentage of papers promoting manmade global warming, izen. Think funding. The government funding agencies have only paid for research that promotes human-induced climate change. Did the funding agencies pay for research to determine the true impacts of natural variability? Nope. And guess what? That’s why the climate science community is now scrambling to try to explain the lull in global warming.
Have a nice day.
Dr. Tisdale,
(I know your not but heck you have much knowledge and you are willing to share…)
One observation I have in regards to the lack of Cyclone formation is the current wind shear pattern due to a stronger than average Polar jet. The depth of intrusion towards the equatorial jet and the blocking lows which allow massive highs to build simply cause wind shear near 30-40 deg latitude areas. This behavior is not good for the formation of hurricanes (cyclone) or their continued function if they do form. Could this too be a reason that we have had a low number of them and the severity as well of those which do form?
@- And guess what? That’s why the climate science community is now scrambling to try to explain the lull in global warming.
A lull ( apart from the ocean heat content, ice melt and record breaking floods and drought) that would appear to be over. The last five years have been warming faster than before….
http://www.woodfortrees.org/plot/wti/from:2008/to:2013/trend/plot/wti/from:2008/to:2013
IZen,
Cherry Picking start points are we? try 2009 to present and its a 0.1 deg C DECLINE…
OY! this is why short trends are spurious at best..
http://www.woodfortrees.org/plot/wti/from:2009/to:2013/trend/plot/wti/from:2009/to:2013
I love those interactive graphs! Just spent a most entertaining 15 minutes mucking about with them. I can produce literally any trend I want! Great fun! Felt just like a real climate scientist!
Now pass me the crayons someone…! I wanna do an ice age…
@- Bill H
“Cherry Picking start points are we? try 2009 to present and its a 0.1 deg C DECLINE…
OY! this is why short trends are spurious at best..”
Gosh, do you mean that the longer the time period the more reliable and significant the trend it indicates?
http://www.woodfortrees.org/plot/best/from:1913/to:2013/plot/best/from:1913/to:2013/trend
izen,
Quick – I think you have your hockey stick upside down! The up tick goes the wrong way!
(Actually that is hilarious…!)
Mr. Tisdale….thanks for your response. Did not know there was a local and “official” line. But then I’m just a young pup at 55….:):):)