OVERVIEW
In a number of posts, we’ve discussed and illustrated the difficulties with ocean heat content data. (There are links to those earlier posts at the end of this one.) The data presented in this post is supported by the 2012 Levitus et al paper World ocean heat content and thermosteric sea level change (0–2000 m), 1955–2010 [8.1 MB].
One topic discussed but not illustrated (until now in Figure 1) was that the annual variations in temperatures at depths between 700 and 2000 meters were in terms of hundredths if not thousandths of a deg C and that it was unrealistic to think we could measure the temperatures of the oceans at depth with that type of accuracy. It turns out that the annual variations are typically in thousandths of a deg C. The total scale of the temperature anomalies of the graph in Figure 1 is two one-hundredths of a deg C.

Figure 1
Keep in mind that Figure 1 presents the approximated changes in annual temperature for the depths of 700-2000 meters—not the anomalies. The annual changes are determined simply: by subtracting the value of the previous year from the value of the year being plotted.
The ocean temperature data for the depths of 700-2000 meters is an important topic. With the surface temperatures no longer warming and with the slowdown in the rate at which the oceans are warming at depths of 0-700 meters, climate scientists are now saying the missing heat is being forced to depths below 700 meters. Of course, that assumes the missing heat actually exists.
DATA AND METHOD
The NODC provides vertically averaged temperature anomalies for 0-700 meters here, and for the depths of 0-2000 meters here. To use that data to determine the variations in temperatures at depths between 700 and 2000 meters we need to know the volume of water in the depth ranges of 0-700 meters and 0-2000 meters. In reality, we don’t necessarily need the volumes. We can work with percentages.
According to an EPA document about ocean heat content data (here):
…the top 700 meters of the ocean (nearly 2,300 feet)…accounts for just under 20 percent of the total volume of water in the world’s oceans.
“[J]ust under 20 percent” could mean many things, so we’ll use the rounded figure of 20%.
Then on the last page of the NOAA presentation here, under the heading of “ARGO Future Possibilities”, they have the bullet point:
-52% of ocean volume below 2000 m
That obviously means that about 48% of the ocean volume is above 2000 meters.
Assuming those percentages are close to being correct, that means 41.66 % of the volume of the oceans to depths of 2000 meters comes from the top 700 meters and 58.33% at 700-2000 meters. I told you this was a rough estimate. So now we can use a simple weighted-average equation, where you solve for one of the components, to determine the changes in ocean temperature for the depths of 700-2000 meters. The result is illustrated above in Figure 1, and the data is presented as the annual change in temperature.
PUTTING THAT IN PERSPECTIVE
Figure 2 compares the annual changes in global sea surface temperature anomalies (HADSST3) and the vertically averaged temperatures of the global oceans to depths of 0-700 and 700-2000 meters.
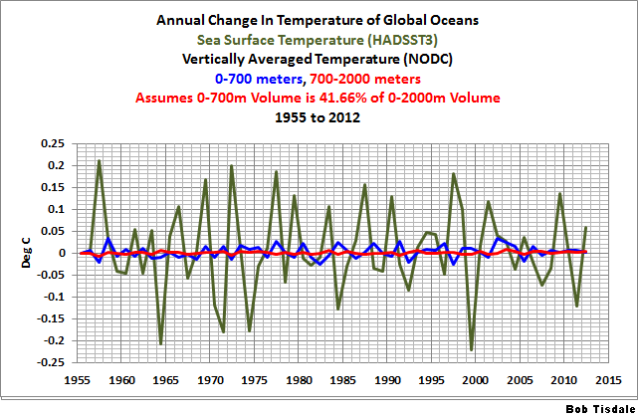
Figure 2
In Figure 3, the data has been returned to their standard time-series form and I’ve added global land+sea surface temperature anomalies (HADCRUT4) as a reference. All of the data have been zeroed at 1955.

Figure 3
Many persons find it hard to believe that global surface temperatures can be estimated to the values shown. They’ll certainly have difficulty with the warming shown at depths of 700-2000 meters.
THE NODC’S HOCKEY STICK WHEN THEY TRANSITION TO ARGO DATA
Figure 4 presents the vertically averaged temperature anomalies for the global oceans for the depths of 700-2000 meters. They warm at a relatively constant and very slow rate until the ARGO floats begin the have complete coverage of the global oceans around 2003. Then they warm at a rate that’s almost 24 times faster than the rate seen in the 5 decades leading up to it.

Figure 4
It doesn’t look very realistic, now, does it?
IS THE HOCKEY STICK DEPENDENT ON THE PERCENTAGES USED?
Let’s assume that the percentages I discovered online are wrong, and that the relationship of the volumes of the oceans at depths of 0-700 meters and 0-2000 meters is a linear one. That is, we’re going to assume that there are no continental shelves and that the volume of the oceans from 0-700 meters is 35% of the volume from 0-2000 meters (700/2000 = 0.35). Therefore, in our hypothetical example world, the volume of water from 700-2000 meters represents the other 65% of the depths from 0-2000 meters. Plugging those percentages into our standard weighted-average equation presents the curve shown in Figure 5. The hockey stick still exists, but it’s not as pronounced.

Figure 5
IS THE NODC FOOLING ITSELF WITH THE PENTADAL DATA?
Or are they trying to fool us?
In past posts (here and here), we showed how the NODC increases the warming rate of their ocean heat content data by presenting it in pentadal form. See the comparison graphs at depths of 0-700 meters (here) and 0-2000 meters (here). Figure 6 compares the roughly estimated vertically averaged temperature anomalies for the global oceans, for the depths of 700-2000 meters, from 1955 to 2012, in annual and pentadal forms. The same percentages of ocean volumes at depth (0.4166 for 0-700 meters and 0.5833 for 700-2000 meters) were applied to calculate both. In this comparison, I did not smooth the annual data because I wanted the break point in 2002 to be visible.
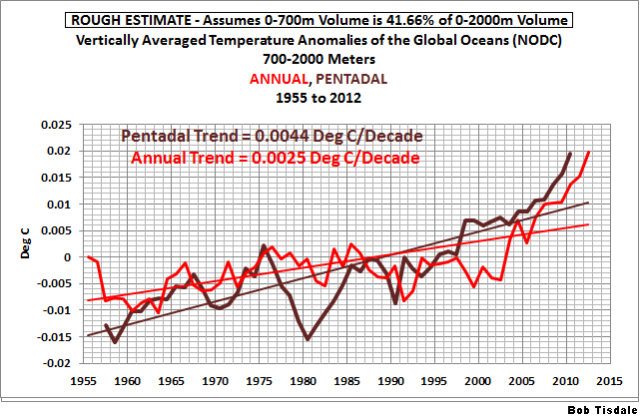
Figure 6
Not only does the data in pentadal form have a significantly higher warming rate, but its curve bears little resemblance to that of the annual data.
CLOSING
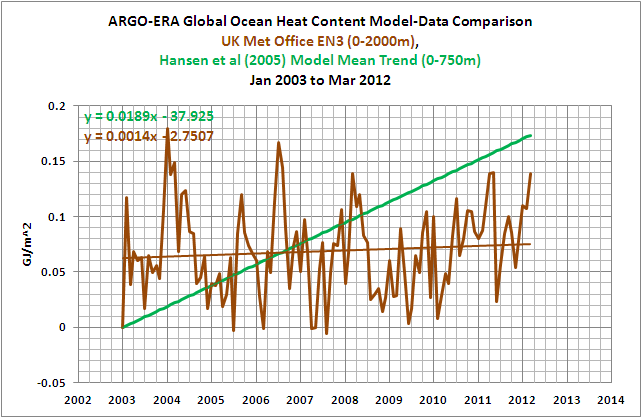
To account for the slowdown the warming of surface temperatures and in the heat content of the upper 700 meters of the global oceans, the climate science community is claiming manmade global warming is bypassing those levels and warming the oceans at depths below 700 meters. But that warming of the subsurface temperatures of the global oceans from 700-2000 meters represents variations measured in thousandths of a deg C. It is not reasonable to think we can measure the temperatures of the global oceans to that accuracy. Now consider that ocean heat content data have to be adjusted—tweaked, modified, corrected, whatever—in order for it to show warming during the ARGO era. (The UKMO EN3 data in the graph here should represent the uncorrected ARGO era data for depths of 0-2000 meters.)
The vertically averaged temperatures for the depths of 700-2000 meters can be approximated from their data for the depths of 0-700 and 0-2000 meters. It shows a very sudden shift in the rate of warming for depths of 700-2000 meters. The shift coincides with the introduction of the ARGO floats to rarely sampled portions of the global oceans—the mid-to-high latitudes of the oceans of the Southern Hemisphere, for example. This suggests that the warming presented by the data at those depths may result from the more-complete sampling of the global oceans.
We’ve discussed the problems with ocean heat content data in numerous posts over the past few months. They include:
Is Ocean Heat Content Data All It’s Stacked Up to Be?
Ocean heat content for the depths of 0-2000 meters is not a dataset in which one should have any confidence. It appears that it was introduced solely so that global warming enthusiasts could claim global warming continues.
B0b: Want me to have a look in the same way with these data as the ENSO?
I cannot imagine a process that would ”force” the heat lower into the ocean depths.
For the ocean water to suddenly warm at 24 times the normal rate would require either 24 times the heat input and no solar increase to anywhere of that order has been observed, or an alteration of the physical properties of the water.
Whatever, their estimates are very rough.
Thanks Bob.
RichardLH, data exists so that it can be examined. Keep in mind, though, that ocean heat content data, because it’s been modified beyond recognition, could be considered make-believe data. In reality, you may be wasting your time.
Regards
When did humans start measuring ocean temperatures at the levels described in this post pre-the ARGO buoys? Or am I missing something?
Don’t the Argo buoys go with the current.
And wouldn’t the currents naturally flow from colder to warmer, as the warmer upwells.
Maybe this is what the Argo buoys are seeing.?
I have earlier read that UNEP is working to get the “scientist” that study Ocean will get a place in the UN system together with WMO.
I wonder if it’s for what they have done or for the Things they are going to do, or both?, for the Team and the cause?
A thousandth of a degree here, a thousandth of a degree there, and pretty soon, you’re talking about real temperatures. (All apologies to Everett Dirksen.)
Do they present the data in pentadal form on the basis that as there is no such word, nobody can calim it is incorrect?
Patrick says: “When did humans start measuring ocean temperatures at the levels described in this post pre-the ARGO buoys? Or am I missing something?”
Before ARGO, disposable devices (known as XBTs), tethered to long wires, were dropped over the sides of ships and used to measure temperatures at depth. The following animation shows the locations of the samplings at depths of 1500 meters (6MB):
http://bobtisdale.files.wordpress.com/2013/03/nodc-temp-obs-at-1500m.gif
As you can see, there were few measurements at those depths prior to ARGO.
The animation is from this post:
http://bobtisdale.wordpress.com/2013/03/11/is-ocean-heat-content-data-all-its-stacked-up-to-be/
Regards
Happy Independence Day to all USA citizens.
It seems that we need head capacity per meter of ocean depth and atmospheric elevation to make sense of these data. If the information was put into the form of Terawatts needed to raise the temperature of the first 700 meters of ocean, the 700-2000 meters of ocean, and the atmosphere at near surface, to 14000 ft (Lower Troposphere), Upper troposphere, and stratosphere. With total changes in heat content, it is easier to understand the path of heat flow. The much lower heat capacity of the near surface atmosphere compared to the heat capacity of the upper ocean shows that atmospheric temperature measurement are not nearly as significant as ocean temperature measurements.
buhovda says:
“I have earlier read that UNEP is working to get the “scientist” that study Ocean will get a place in the UN system together with WMO.”
More likely to ensure that he is free from FIOA requests and has dimplomatic immunity, putting him beyond any country’s national law.
Mind you, if Peter Gleick is anything to go by, climate scientists already seem to be beyond the reach of the usual criminal law. At least in the USA.
In your figure 3, what have sea surface temperatures to do with the issue at hand: ocean heat content?
Given the heat capacity of water, and if one knew the volume being affected (which I don’t know), if this energy were to be put into the atmosphere I wonder how much the deep ocean warming would translate to in terms of atmospheric temeprature (which has a much lower heat capacity).
And figure 2, I may add.
vukcevic,
Thank you, and Happy Dependence Day to you from America! ☺
@Tisdale et al – significant digits, significant digits, significant digits!!! Just because your calculator gives you 3, 4,…10 significant digits doesn’t mean they have any significance.
So, because ~20% is exactly that, about 20% = ~2.0×10^1% or 1 significant digit and 41.66% = 4.166×10^1%, 3 significant digits, it’s really 42%, 1 significant digit.
This applies to the temperature measurements, too! Looking at figure 1, if the temp sensors are accurate to say ±0.1° reporting changes smaller than that from an average is meaningless since they all lie well within the error range. It looks informative, but it is meaningless. Just like the “adjustments” and data “homogenizations” the official agencies make to the raw data.
Bob, shouldn’t the annual changes be summed to give us the accumulated heat in the period under consideration? There is also since 2010 and apparent all positive increase. Is this real or is this potentially cooked to find the missing heat (Trenberth’s life mission since the “travesty”).
Interesting, Bob.
Could you show exactly how you are calculating this. Verbal descriptions are not good for explaining mathematics. Are you, for example, assuming a linear temp gradient from 0m to 2000m . That would lead to substantial error.
The curve and values looks very much like a semiconductor fade issue as they drift out of calibration: all in the same direction, semiconductor manufacturing does have some random elements but guardband issues are usually on one side or the other..
I suspect a .01% delta would not be noticed if a multiyear old device was re-checked.
Have they published a lifetime, measured calibration curve for the Argo units and the error trend found when they checked/recalibrate the devices?
This, of course, should be for “assumed working” devices;
=> failing devices are likely to be entirely different as the failure mode may have little to do with the expected electronic slew.
AndyG55 says: “Don’t the Argo buoys go with the current.”
Yup. You can see the ARGO floats following the currents in the following animation of temperature samples at depth (500m) starting in 2003 (I set it so that it plays kind of fast so that the movement was visible).
http://bobtisdale.files.wordpress.com/2013/07/argo-era-sampling-at-500m.gif
AndyG55 says: “And wouldn’t the currents naturally flow from colder to warmer, as the warmer upwells.”
A few things: (1) Currents also flow from high latitudes (colder) to the tropics (warmer). (2) The NODC presents OHC, temperature, sea level and salinity data as anomalies, not absolutes. (3) Upwelling typically occurs along the coasts and along the equator, where cooler waters from below the surface are upwelled to the surface.
Susan Corwin says: “Have they published a lifetime, measured calibration curve for the Argo units and the error trend found when they checked/recalibrate the devices?”
I ran across a paper yesterday that discusses the numerous corrections that need to be made to ARGO data. Unfortunately, I only glimpsed at the minimum text on the search results through Google and didn’t bother to download the paper. I also can’t find it at the UCSD ARGO website:
http://www.argo.ucsd.edu/
“Bob Tisdale says:
July 4, 2013 at 6:51 am”
Thanks for the response Bob, my question was rather rhetorical. British Royal Naval records, unavailable to mere mortals, suggests alarmism, is, well, alarmism.
The Argo floats were originally reporting decreasing ocean temps. The scientists “knew” this was wrong, so they eliminated the floats showing the greatest cooling. Clearly, this is selection bias. The scientists got the answer they expected – warming – because they eliminated those floats that told them otherwise.
The floats are not perfect. They are electro-mechanical devices. Some will read high, some will read low, and some will read true. Over time there will be drift. Some high, some low. In general the errors will be randomly distributed. The high errors will balance out the low.
However, when you eliminate some of the floats based upon the reports they are providing, you are skewing the error distribution. It is no longer random and the low errors will not balance out the high errors. Instead you will get a result that shows warming – but the result is spurious. It is a result of you selection method, not a result of actual warming.
This is a classic case of “kill the messenger”. When a king executes only the messengers than bring bad news, pretty soon all he will hear will be good news. In this case the scientists eliminated the “cooling” messengers, and pretty soon all they were hearing was “warming” messengers.
I don’t see how CO2 infrared can heat deep water very much, if at all. I’m not like some that say it can’t heat water at all, but it certainly can’t penetrate the way sunlight does. Its warming would be limited to the thin surface (plus added water vapor), IMO.
Greg Goodman says: “Could you show exactly how you are calculating this.”
Here’s the equation:
dT 700-2000m = (dT 0-2000m – (dT 0-700m*0.4166))/0.5833
Greg Goodman says: “Are you, for example, assuming a linear temp gradient from 0m to 2000m.”
No. I’m simply removing the variations in temperature of the 0-700 meter data from the 0-2000 meter data, leaving the variations at 700-2000 meters.
Gary Pearse says: “Bob, shouldn’t the annual changes be summed to give us the accumulated heat in the period under consideration?”
See Figure 4.
Regards
Figures 4 and 5 above show the results of selection bias in the Argo data. We see a sharp break in the trend at the time the Argo floats were introduced. Because the scientists knowingly eliminated the cooling floats, believing them to be in error, the data now doesn’t fit with the long term historical trend. Instead it appears skewed.
What we are seeing is similar to the problem with tree ring calibration. The scientists are selecting some trees/floats to believe and rejecting others, based on what the trees/floats are telling them. This changes the underlying requirement in statistics that your sample be random. As a result when you apply statistics to them the results are spurious – they are false and misleading.
The results from Argo and calibrated tree rings cannot be trusted statistically because they are not a true random sample of the population.
beng says: “I don’t see how CO2 infrared can heat deep water very much, if at all…”
There’s nothing in the ocean heat content records (0-700m) or the satellite era sea surface temperature data to indicate that CO2 contributed to the warming of the oceans. I discussed that here (42MB):
http://bobtisdale.files.wordpress.com/2013/01/the-manmade-global-warming-challenge.pdf
If it doesn’t show up in the sea surface temperature data or the ocean heat content data, then one might suspect that all it does is add to the evaporation.
Regards
Barry Cullen says: “@Tisdale et al – significant digits, significant digits, significant digits!!!”
Yup. I noticed how ridiculous the 41.66 % and 58.33% looked, but the way things go, if I had used 42% and 58%, someone would have complained.
Regards
Does it matter? Isn’t this all simply of accademic interest only?
If the ocean below 700m is truly warming, the energy has been disipated. What process possibly exists that allows it to come back and bite us?
At what rate could the ‘extra’ energy in the 700m to 2000m depth come back to warm the ocean in the 699 to 600m depth, then in turn the 599 to 500m depth etc?
When chemical cargoes get contaminated in shore tanks, or ships, one way to recondition the cargo so that it is usable and within the required specification, is not to redistill it, or to filter out the contaminant etc, but simply to dilute the contaminated cargo with copious amounts of good on spec cargo. In this manner the contaminant becomes so diluted that eventually the bulk is brought within the required range of specification. This is what is happening to the ‘extra’ energy allegedly absorbed in the below 700m range. It is simply being disipated in the bulk of the ocean and we know of no process that would enable it to come back and heat the surface layer of the ocean in a time frame measured in less than millenia.
So the warmists need to explain:
1. What physics and process involved explains why increased CO2 emissions leading to ever increasing amounts of backradiation in the 20th century heated the atmosphere, but not the deep ocean (ie., below 700m), but now (ie., the 21st century) that physics and process leads to heating the deep ocean but not the atmosphere.
2. What physics and process involved explains how the energy which is heatting the deep ocean passes through the 0 to 700m range undedected.
3 What physics and process involved explains how the extra energy absorbed in the deep ocean will return to warm the surface and when this will occur and at what rate will the surface layer be warmed.
OT, but I will be taking my son wild camping in the home of the “Hound of the Baskervilles” – that is Dartmoor UK – at the weekend and saw some interesting climate related history on Wikipedia:
http://en.wikipedia.org/wiki/Dartmoor
Turns out this area was much warmer in the Bronze age (up till about 3000years ago) – so warm in fact that farming was widespread in the area. Farming is now only possible in the lower areas. The medieval warm period also had an impact.
Bob Tisdale says:
July 4, 2013 at 7:52 am
Yup. I noticed how ridiculous the 41.66 % and 58.33% looked
============
no more ridiculous than calculating average ocean temperature to a precision of 0.0004 degree.
richard verney says:
July 4, 2013 at 7:52 am
Does it matter? Isn’t this all simply of academic interest only?
===========
It allows the climate scientists to claim that they weren’t wrong. That CO2 is continuing to warm the planet, only now it is warming the oceans.
It is the old epicycles argument. We weren’t wrong, the orbits are perfect circles, within perfect circles, because god creates perfection. The models correctly predicted warming, once we include both surface and ocean warming, because CO2 causes warming.
Recently, because I’m in Barcelona, I’ve been reading about how, during the Spanish Civil War (1936-1937) Stalinists vilified and outright lied about those who did not share their ideas of centralized control and inequality of benefits for the masters of the country vs the workers (counter-intuitive these days, but true: Trotsky wanted to have only local governments and everybody getting paid the same). Reading about the party line of CAGW I am struck by the similarity in word and deed by our governments on climate change and those of Stalinist Russia in the 1930s, when they feared loss of power to those who had more “revolutionary” ideas of liberty and equality.
Are we actually seeing a “party line”, including the use of distorted to the point of fabrication (nobody except the North Koreans thinks they can totally fabricate storiess these days)? The vilification of the skeptic position, all of us in the pockets of Big Oil, the refusal by the MSM to talk about the failure of, among other things, the mid-tropopsheric hotspot and the melting of Antarctica, is not unlike some of the shrieking done by the Stalinists against those even slightly in disagreement. The financial aid the Soviets gave to those they saw as useful to them was kept quiet back then, as is the funding that funnels to Mann et al, plus the fees Hansen, Suzuki and Gore get – not to mention the pure profits those at the level of Gore enjoy.
Whatever you might say, there is definitely a “party line” that is being supported and promoted. A “good” eco-green says that the NOAA data is good, and whatever data Hansen uses is better. HadCru temperatures, satellite temperatures, balloon temperatures and tidal guage measurements are not equal to what the IPCC uses. All this data goes towards supporting international control centralized in the UN, and rules and regulations that “efficiently” manage CO2 emissions – rules and regulations spilling forth that cross national boundaries and circumvent – seriously circucuvent – our legislative bodies. This is exactly what the Stalinist did in Spain.
It should be understood that the Stalinist position was that it is/was better to lose the battle (Spain) than lose the war (centralized control and an “efficient” economy as defined by the principals). In this regard one might look to coal plants in the UK and the XL pipeline in the Canadian/US situation. In the UK premature shut-down of the coal-fired power plants (along with nuclear power plants) could easily lead to power outages. Here the loss is felt by the UK civilian population, which of course includes the employed people. The XL pipeline, should it be vetoed, will cost jobs, pensions and such to the Texas refinery worker. In each case there is an ideological solution to these probable problems: renewable energy in the UK, now replaced by the false idea of shale gas, and in the US, the increasing but false expectation of North Dakota Bakken oil. The failure of both of these “solutions” is akin to losing Spain while maintaining at least the appearance of control, future or present, in the heart of Stalinist Russia.
What we seem to be seeing when our governing bodies refuse to accept that their “scientific” data is somewhat (at least) suspect, is that the party line, i.e. fossil fuel generated prosperity, is not acceptable. This bottom line is what counts, all else is expendable. The question that we really, really need to ask is, what is in it for them?
Note: I do not think there is a “them” in the organized sense. Just in an ideological sense. Obviously there can be mutual benefits with, for example, an investing rich like Gore, so that they all act the same way because they all will benefit from the same way. A Suzuki or a Hansen or an Erhlich similarly act without the (large) financial benefit in this case, because their egos are what benefit: it is perhaps better in the afterlife to be a prophet than a rich man, after all.
Bob: I have liitle fear of poor quality data now that I have a high quality instrument to look at it through 🙂 A matematically accurate one at that.
ferd berple says:
July 4, 2013 at 8:19 am
richard verney says:
July 4, 2013 at 7:52 am
Does it matter? Isn’t this all simply of academic interest only?
===========
“It allows the climate scientists to claim that they weren’t wrong. That CO2 is continuing to warm the planet, only now it is warming the oceans.”
I see a bigger problem for the warming proponents. Okay, so we are heating up the ocean depths by miniscule amounts. Is this REPLACING the effect of CO2 in the atmosphere at this time? Is the CO2 not now “capturing” any upwelling LWIR and heating the air? Does the CO2 in the atmosphere care whether a bunch of heat is suddenly heating up the ocean depths? How does the ocean efficiently suck up this terrible heat being created so efficiently that there is none available to heat the atmosphere for 16 years? As expected, when you look for ways to cling to a failing theory you get to look more and more foolish to more and more people. Perhaps its the process of looking evermore stupid that causes a sea change in the beliefs and a new paradigm.
This ocean heat business all so ad hoc. It’s clearly an attempt to correct existing models with things outside the model. It’s all just an admission of failure the models. The bottom line is that ocean heat must be accounted for in any realistic climate model but the data is scant while the effect is potentially just as monstrous as cloud variability.
All that’s been discovered is that modelling climate is even harder than modelling weather.
If one assumes the data is valid, it could be evidence of a unmodelled natural variation — one in which a massive heat sink transitions between net absorption and net release. One could posit some deep current long period oscillation that could tend to sequester, or tend to release heat. Given the specific heat of water this would seem far larger in magnitude than the variation in the atmospheric absorption of IR.
Gary Pearse says:
July 4, 2013 at 8:32 am
_______________
Don’t you see? CO2 is a switch, turning on the ocean heater.
/
Assuming those percentages are close to being correct, that means 41.66 % of the volume of the oceans to depths of 2000 meters comes from the top 700 meters and 58.33% at 700-2000 meters.
The four significant figures are a treasure. 😎
Thanks for another interesting post.
This is the nub of one potential problem with the data — The time rate of change of temperature is the sum of two terms 1) the partial derivative of temperature w/resp to time, which is to say the “ocean warming” signal; and 2) the signal that comes from the velocity vector of a buoy crossing ocean isotherms — the advective term. I’ve seen no attempt to separate the two. Keep in mind the advective term has the potential for a systematic bias as you said.
The sensors in these buoys have a measurement repeatability of around 0.005 C and very low drift, but this is under lab conditions. I don’t know that anyone has documented what they do under field use. Moreover, the figure of average ocean temperature anomaly is made assuming that one can simply add the individual measurements to make a mean–but what becomes of the the error budget is anyone’s guess. We don’t know if the errors of each sensor follow a single normal distribution or not. Thus it is difficult to say in the figures where would be the level of significant change.
With the numerous corrections to ARGO data being well over the .002 or .05 deg C would this not create an error bar which would render the data not only questionable but useless?
I fear that the MOE is far greater than the suposed warming..
For four years I was involved in anti-submarine patrols with the Canadian Air Force in the North Atlantic. A major part of the detection involved measuring transmission of sound through the water, either actively by dropping very small depth charges (PDC) or passively by detecting sound from microphones we could drop in the water and have it lowered to a particularly depth. We also had the ability to drop thermometers that provide water temperature at different depths. Besides this there were ship borne and land based detectors, including microphones on the bottom of the ocean. All these were used to create bathythermographs, that is water temperature with depth.
Knowledge of temperature layering was essential for placement of microphones because the sound travelled within those layers. I was always impressed by the remarkable number of layers that could exist and also the fact that temperature could have an inversion, that is increase with depth.
It was possible to have a microphone within metres of a submarine and not detect the sound, but it was also possible to detect a submarine hundreds of kilometres away within a particular layer. The number and variance in the layers over time was quite remarkable and leaves me skeptical about any claims of knowledge of water temperature in the top “friction layer” of the oceans.
Submariners are aware of these sub surface currents and use them to their advantage. For example, German U-Boats wanting to move undetected through the Straits of Gibraltar turned off engines and drifted in at one depth and out at another as the currents were opposite through the Straits. They also knew of the sound layering and “hid” within a certain layer.
I mention the friction layer because within the air and the oceans it is affected by the Ekman Spiral. Studies done with Professor Bell on a 1000 foot tower outside of Winnipeg, Manitoba with instruments every 200 feet showed very similar layering and inversions as I had seen in the oceans. It is just one reason why I am so skeptical about the construct of the computer models and their translations of energy from the upper ocean to the lower atmosphere.
After I left the military and started work on climate (when the consensus was cooling) I linked up with oceanographer, the late Roger Pockington who was studying water temperature changes in a transect from Port Au Basque Newfoundland to Bermuda. We often discussed the value of those military temperature readings, unavailable because of secrecy classifications. Maybe we could get Al Gore to get them released like he did the Top Secret ice data for the “Gore Box” in the Arctic.
http://drtimball.com/2013/thinning-arctic-ice-more-al-gore-aided-and-abetted-misinformation/
ferd berple says:
July 4, 2013 at 8:19 am
richard verney says:
July 4, 2013 at 7:52 am
Does it matter? Isn’t this all simply of academic interest only?
===========
It allows the climate scientists to claim that they weren’t wrong. That CO2 is continuing to warm the planet, only now it is warming the oceans.
It is the old epicycles argument. We weren’t wrong, the orbits are perfect circles, within perfect circles, because god creates perfection. The models correctly predicted warming, once we include both surface and ocean warming, because CO2 causes warming.
======================================================
Fred,
I dare say that this is how we learn we are going in circles using circular logic.. 🙂
richard verney asks a very good question-
“What physics and process involved explains how the extra energy absorbed in the deep ocean will return to warm the surface and when this will occur and at what rate will the surface layer be warmed.”
I think this is already settled. Now that the 700m-2000m ocean volume has warmed by about 0.01C since 2003, it eventually could (or maybe already has) cause surface temperatures to warm by up to… 0.01C.
I remember reading some years ago that one of the climate science glitterati (someone like Trenberth, Hansen, Schneider) suggested that if the CO2 flamethrower heat wound up in the deep oceans, then global warming would no longer be a crisis or even a worry.
Yet here we are pointing to deep ocean anthropogenic heating that may or may not even exist, with a magnitude in the hundredth’s of a degree, and with no physical means of being transferred back into large temperature changes at the surface.
This heating, microscopic as it is, should show up in the satellite sensed global gravity map and which should change over time as the water density changes. These changes are regional – impossible for them to be global as there’s not enough directed energy to cause the entire ocean heat to change at these rates and undirected energy at the rates needed would smoke the land surface of the planet.
Gravity distribution may be a better proxy for our Earth system balance of energy than temperature. Temperature really sux at it.
How many petawatts of energy does it take to move warm surface water to deeper depths in the volume needed to support this NODC data? Where does that energy come from?
Bob
I think i’ve had it explained to me about 5 times by warmistas as to how the warming (should it exist) leaps frog the top layers of water, over the middle layers and suddenly reappears much lower down in a frightening form that can be impressively measure in thousands of a degree,.
.
Could you please explain the process to me one more time using words of not more than two syllables. Or a diagram would be nice. Or a video. Cartoon? Anything.
tonyb
Tony, it’s just an excuse for a math error…..their math was wrong (missing)
might as well say it’s on the moon
ohnmarshall says:
July 4, 2013 at 6:19 am
I cannot imagine a process that would ”force” the heat lower into the ocean depths.
———————————————————
I can imagine a process and provide a “sciency” rational to support it using CO2 as the culprit.
Consider a bell jar in an 1880 lab containing increasing concentrations of CO2 exposed to sunlight; viola temperature rise. But the volume is fixed so temperature and pressure increase. Now consider an open system where volume is essentially unbounded and temperature and pressure have functional constraints i.e T and P cannot change locally before being dissipated to the surrounding “locales”.
Increasing CO2 concentrations tend to increase the turbidity of the atmosphere and less its temperature as the concentrations increase. After certain thresholds are realized the turbulence help to “self” organize natural turbulence driven from temperature and pressure gradients which stir up the oceans by creating more localized eddies that combine to make the oceans’ natural flows more turbulent. This increases the mixing of the oceans bringing heat content farther down and generate wild swings in local weather on land, albeit the “local” gets larger and larger.
Why has the CO2 decided to switch from heating the atmosphere to heating the deep of the oceans? Or, more to the point HOW has CO2 decided to do this? Deep ocean temperature recordings are only recent, and are still isolated, with just a few (thousand or tens of thousands, they are still very isolated) ARGO buoys around the world. Even the surface temperatures were isolated, with the motivation, ability and credibility of the persons taking them highly variable – often, these were obtained from the engine intakes, and these could vary from 2 metres to twenty metres below the surface, with measuring instruments of dubious provenance. And now we are talking about measuring the increases in tenths – or even hundredths! – of a degree. Are the instruments in the field even accurate to that figure?
Finally, is this (newly-discovered?) heat a result of CO2, or perhaps has something to do with the many subsea smoke-stacks? These volcanic sites are surrounded by water heated to temperatures science thought life could not tolerate, at pH levels considered too low for marine life – yet life proliferates! Then there are the other volcanic sites, all along the Atlantic ridge, for a start; that constantly-oozing lava is being cooled, and, by being cooled, is heating the sea water around. Is the temperature increases caused in these ways recordable, or ignorable?
Figure 3
Many persons find it hard to believe that global surface temperatures can be estimated to the values shown. They’ll certainly have difficulty with the warming shown at depths of 700-2000 meters.
================
The money quote. Thanks Bob.
Greg Goodman says: @ July 4, 2013 at 6:54 am
Mind you, if Peter Gleick is anything to go by, climate scientists already seem to be beyond the reach of the usual criminal law. At least in the USA.
>>>>>>>>>>>>>>>>>>>>>>>
From personal experience, I can tell you that the cops are not interested in catching crooks and the DA’s office is not interested in bring them to trial if there is no political gain involved or if the crooks have ‘Connections’ BTDT four times with four different thieves caught red handed and not one got tried much less went to jail. I have never seen so much dancing around the facts in my life except in Climate Science.
The Peter Gleick fiasco is about what the average citizen can expect if he does not have political ‘Friends’
This is the manner in which the accuracy of the global ocean temperatures readings are decided – the instrument accuracy is divided by the square root of the total number of observations.
So, if the instrument accuracy is .2 degrees, and the number of observations is 5000, the square root of which is 70.71 which in then divided into .2, that results in an instrument “accuracy” of .0029. Stupid and misleading, but “accepted” statistics.
I do not know the exact measuring quality of the ARGO floats, but if it is measured in tenths, then that to me would indicate the plus/minus of all the measurements to the tenth.
Thanks, Bob. Nice fireworks!
As always, the goal of the climate alarmist is to find some graph that can be interpreted as fearful warming. It is the same old same old. More excellent work, Mr. Tisdale.
As Judith Curry suggested only a few weeks ago on her blog; If the so called “missing heat” is going into the oceans and preventing global temperatures from increasing then it is the oceans and not CO2 that are controlling the global temperatures and climate.
And that would spell the failure of the entire basis in which the CAGW / Gaian worshipping ideology is founded.
Trenberth is going to have to do a lot of explaining to a lot of people on both sides of the equation if he fails to prove his claims very soon..
Chad Jessup says:
July 4, 2013 at 6:39 pm
This is the manner in which the accuracy of the global ocean temperatures readings are decided – the instrument accuracy is divided by the square root of the total number of observations….
>>>>>>>>>>>>>>>>>>>>
Complete and utter fallacy because each reading represents a unique time and place. They are not taking ten samples from the same batch of chemicals or ten widgets from the same cavity in a molding machine where you can increase accuracy by repeated sampling of the object under study and all other factors are held steady. (you hope)
Chad Jessup says: “This is the manner in which the accuracy of the global ocean temperatures readings are decided – the instrument accuracy is divided by the square root of the total number of observations….”
Since the accuracies of the individual components of the ARGO system are known, shouldn’t the system accuracy be the square root of the sum of the squares of the individual accuracies, aka RSS?
If we assume the temperature sensors in the floats have an accuracy of +/- 0.002 deg C, then the approximate system accuracy would equal SQRT((0.002^2)*3300) or +/- 0.11 deg C.
Regards
***
Bob Tisdale says:
July 4, 2013 at 7:45 am
beng says: “I don’t see how CO2 infrared can heat deep water very much, if at all…”
There’s nothing in the ocean heat content records (0-700m) or the satellite era sea surface temperature data to indicate that CO2 contributed to the warming of the oceans. I discussed that here (42MB):
http://bobtisdale.files.wordpress.com/2013/01/the-manmade-global-warming-challenge.pdf
If it doesn’t show up in the sea surface temperature data or the ocean heat content data, then one might suspect that all it does is add to the evaporation.
***
Bob, thinking about that, it seems rather remarkable. If true, it means CO2’s effect on the oceans is similar to land — almost (geologically) immediate. And estimates of long-term equilibrium are overstated. The long-term CO2 equilibrium may be much less than a decade for the entire global system (land+ocean), instead of decades or centuries as some have stated. This would essentially eliminate any “heat in the pipeline” theories — at least concerning CO2’s effect. Any longer-term effects from deep-water would be due to ocean-current changes (thermocline, upwelling/downwelling, etc), independent of CO2.
richard verney, July 4, 2013 at 7:52 am said:...
So the warmists need to explain:
1. What physics and process involved explains why increased CO2 emissions leading to ever increasing amounts of backradiation in the 20th century heated the atmosphere, but not the deep ocean (ie., below 700m), but now (ie., the 21st century) that physics and process leads to heating the deep ocean but not the atmosphere.
2. What physics and process involved explains how the energy which is heating the deep ocean passes through the 0 to 700m range undedected.
3 What physics and process involved explains how the extra energy absorbed in the deep ocean will return to warm the surface and when this will occur and at what rate will the surface layer be warmed.
In other words, their Emperor is naked.
Ok let’s talk about the down-welling of warm water. First some basics; warm water is less dense than cold water and in the Oceans, seawater is layered by density. From this we deduce that the water at the bottom of the ocean is always colder than that above, because the coldest water in a particular water column always has the greatest density. Is this correct?
Well actually this is not correct, because the ocean is not a uniform body of fresh water; it is complex association of salt water bodies with different origins and mixing histories. With seawater it is perfectly possible to have a body of warm haline that is denser than a colder but less haline one. If ocean currents bring these two distinct water bodies together in a zone of convergence, then the warmer saltier and more dense water will sink below the colder but less haline water, in a zone of dense warm water down-welling.
In meteorology we know that air masses are created with distinctive properties of temperature and humidity by the environmental conditions of their source area, so too in the oceans seawater masses are created with distinctive properties of temperature and salinity by their environment of origin. For example the modern Red Sea Bottom Water (RSBW) has a temperature of +21.7C and a salinity of 40.6 psu, this means that the RSBW has a density of 1028.595 kg/m3. By contrast Antarctic Bottom Water (AABW) has a temperature of -0.8C and a peak salinity of 34.7 psu. This means that the coldest sea water on the planet, which has a density of 1027.893 kg/m3, is less dense than Red Sea Bottom Water. In a straight fight between these two marine waters the Red Sea Bottom Water would win and the deeps of the ocean would be filled with warm oxygen poor bottom water from the tropics and not cold oxygenated water from the polar seas.
Sorry to labour the point but this is crucial for what follows next. Ok you say but the Red Sea does not influence the temperature of the ocean deeps in the modern world. True, the Red Sea is restricted in its access to the Indian Ocean, but notice that under modern atmospheric conditions the Red Sea easily creates and maintains a body of warm bottom water more dense than that of the AABW. Notice too that half the surface area of the planet lies between 30N and 30S, so it terms of size the marine Tropics and not the marine Polar region predominates. The controlling Thermo Haline Circulation process (warm Tropics or cold Polar) that determines the temperature of the deeps during a given geological age is merely an accident of ocean basin geography.
I have personal observation and experience of warm water down-welling, which is how I became interested in the whole subject of ocean water movement and the mechanics of the Thermo Haline Circulation (THC). Let me introduce you to a part of the modern tropics, the Atlantic Ocean archipelago of the Turks and Caicos Islands. In 1991 I had the good fortune of going on a geoscience field trip to West Caicos to study a modern open ocean carbonate platform environment. The Caicos archipelago is located on the Tropic of Cancer in a dry part of the West Indies where the climate is dominated by the warm dry North East Trade Winds blowing out from the Horse Latitudes anticyclone of the Hadley Cell situated to the north.
The combination of the dry trade winds, the extensive shallow water platform and the tropical sun means that the Caicos lagoon acts as a giant solar energy collector. In the lagoon, which has an area of some 200 sq. km and a water depth of no more than 10 metres, the tropical sun warms the sea water, the dry trade winds enhance evaporation concentrating the seawater and increasing the salt water density. The trade winds then blow this warm dense water across the platform lagoon to the west, where we find the tiny island of West Caicos,
West Caicos is a superb microcosm of a modern platform island undergoing carbonate deposition. As part of our exploration of the island’s environment we swam out from the west side across the coral reef flat to the platform edge. Over the reef the waters were warm, but as soon as we got the reef limit the water temperature suddenly dropped and I experience severe cramp in both legs. Fortunately I was wearing a life jacket and so no harm was done, but the experience was so dramatic and the impression so strong that I determined to find out what had happened to the warm water.
My researches led me to the following. In her paper: The Maastrichtian Late Cretaceous climate in the Northern Hemisphere Golovneva, L.B. (2000) deals with the high Arctic of the late Cretaceous and clearly establishes the principle of mode of THC at that time. She states (p51):-
As explained by Golovneva, in the absence of a polar ice cap (in either hemisphere) the bottom waters of the world ocean must be dominated by the thermo-haline circulation of warm dense marine brines sourced in the low latitude shallow waters of epeiric seas and continental shelves, for example those seas associated with the tropical margins of the Tethys Ocean.
At Caicos this process occurs today in miniature within an open ocean lagoon in the tropical Atlantic. I now know that the wind driven warm dense water created in the shallow waters of the Caicos lagoon falls away at the western drop off of the platform to be replaced at the surface by colder but less dense open ocean water that surrounds the archipelago and I believe that this marine warm water down-welling process is a fundamental feature of tropical latitude shallow water carbonate shelves located beneath the Hadley Cell. It is probably no coincidence that the world free diving record was set at Providenciales where the surface warm water current exits from the Caicos platform.
The modern Red Sea Bottom Water with its temperature of +21.7C shows how this mechanism of tropical solar energy capture and heat distribution by deep marine water was maintained in the past. The THC process of tropical warm water down-welling accounts for both the high average atmospheric temperature of the global climate for the Cretaceous and also explains the high Carbon Dioxide concentration in the atmosphere at that time.
Gail @ 6:11 am – thank you for the amplification of/addition to my remarks.
Bob @ 7:29 am – My main gripe with systems accuracy in regard to ocean temperatures occurs when the digits expand to include the ten-thousandths place (as reported in the mass media), when each instrument’s accuracy is only guaranteed to be within .005 degrees C.
Recent googling of ARGO floats reveals studies which accept the individual float temperature error factor of +/- .005 C, so I would conclude the measured accuracy of the systems to be within that parameter, but as Gail stated above, each particular float is measuring a different entity than what other floats are measuring.
My hat is doffed to the excellent engineers who designed and manufactured those fine ARGO machines.
Keep up the good work Bob. Thanks.
Tim Ball @ July 4, 2013 at 10:22 am
Thanks for your post. The following link to the Virtual Seismic Atlas shows the seismic response of the warm dense Mediterranean Bottom Water as it exits west through the Gibraltar Strait and flows beneath the colder surface water of the open Atlantic.
Meddy image GOLR012.
Author: Richard Hobbs
Late comment, but isn’t it customary to present figures of data like those above with error bars? Which never happens in climate science. Indeed, there should not only be error bars but a full discussion of the methodology used to obtain them.
Surely this addresses one way or the other the issue of ability to resolve temperatures at 0.001K . Which I would not believe possible for my own back yard, let alone the entire ocean, sure, but part of the REASON I wouldn’t believe it is because a glance at the statistical fluctuations in the actual data would convince me that accuracy of this sort is impossible. Perhaps temperatures don’t fluctuate much in the 700-2000 m range (indeed, below the thermocline, I suspect that they DON’T fluctuate much) and perhaps they don’t even vary much with latitude and longitude, so that one can get a very accurate result from just a few samples in a few locations. But either way, the data itself surely speaks to this. If one is permitted to see the actual data contributing to the numbers themselves, of course, or the paper has a section on accuracy, errors, and methods (as it should, but I don’t have time to read it and find out).
rgb
OK, I glanced at the paper, and no they do not discuss how they arrive at their error bars (which are order of 10% of the effect IIRC). They do, fairly enough, talk about how they create an “anomaly” and compute “heat content” but it is difficult to judge precisely how reliable their results are even with this without knowing more about both data source and the details of the computations. For example, they correct on the basis of density/salinity in the heat computation, but they do not indicate how reliable this data or correction is or how they assign an error estimate to the spatiotemporal volume associated with each measurement or to the global spatiotemporal average over the measurements.
They also admit that their actual data only goes to 1750 meters, not 2000, and they are basing the extrapolation on a much more limited data set. Not unreasonable, but it would have been better (IMO) if they’d presented results only within the range of the actual instrumentation they used instead of effectively extrapolating it this way, especially after disparaging infilling elsewhere in the paper. Infilling sucks, I agree, but it is better than extrapolation.
Either way, I would be very interested in knowing in a lot more detail how they compute errors.
rgb
Bob Tisdale has, as he invariably does, delivered a carefully researched and beautifully presented posting. I do hope he will draw the postings together and submit it for peer review.