OVERVIEW
Rob Painting of SkepticalScience recently published the post A Looming Climate Shift: Will Ocean Heat Come Back to Haunt Us? Many of you will find his post entertaining.
But this post is not about the SkepticalScience post. This post discusses the recent paper Rob Painting cited: Meehl et al (2013) “Externally forced and internally generated decadal climate variability associated with the Interdecadal Pacific Oscillation”. The abstract is here, and a preprint copy of Meehl et al (2013) is here. You’ll note that Kevin Trenberth is one of the authors. Meehl et al (2013) is an update of Meehl et al (2011) Model-based evidence of deep-ocean heat uptake during surface-temperature hiatus periods.
Since Meehl et al (2013) refer to the Interdecadal Pacific Oscillation, we’ll also discuss it—what it is and what it is not.
Last, this post includes a model-data comparison of the trends in satellite-era sea surface temperatures for the Pacific versus the outputs (ensemble mean and individual ensemble members) of the CCSM4 model used by Meehl et al (2013).
MEEHL ET AL (2013)
Meehl et al (2013) is basically a climate model-based study of the effects of El Niño and La Niña events on surface temperatures and ocean heat content. Like a couple of other recent studies, Meehl et al (2013) are suggesting that, during periods when La Niñas dominate, surface temperatures do not warm, but ocean heat content continues to warm at depths below 700 meters. Meehl et al (2013) are also suggesting that global surface temperatures warm during periods when El Niños dominate. I was not able to find any suggestion in Meehl et al (2013) that the heat driven below the depths of 700 meters would somehow come back to haunt us as some alarmists suggest nonsensically. Meehl et al (2013) are simply trying to explain why surface temperatures warm during some decadal periods and cool (or remain flat) during others—and the mechanism they propose is the El Niño-Southern Oscillation, but they’re using the Interdecadal Pacific Oscillation (IPO) as a proxy.
The problem: Meehl et al (2013) are using a climate model (NCAR CCSM4) that doesn’t properly simulate the coupled ocean-atmosphere processes that drive El Niños and La Niñas. As far as I know, there are no climate models that properly simulate El Niño and La Niña processes. We’ve discussed this numerous times, and as a reference on those occasions, I’ve presented Guilyardi et al (2009) Understanding El Niño in Ocean-Atmosphere General Circulation Models: progress and challenges. Guilyardi et al (2009) is a detailed overview of the problems climate models have in their attempts at simulating ENSO, and it cites more than 100 other papers. I introduced Guilyardi et al (2009) in my post here. Later in this post, we’ll also present one of the very obvious failures that occur because models can’t simulate El Niño and La Niña processes.
The differences between the modeled Interdecadal Pacific Oscillation spatial patterns in sea surface temperatures from Meehl et al (2013) and as determined from Pacific sea surface temperature data can be seen in my Figure 1. The three left-hand maps in my Figure 1 are Figure 5 from Meehl et al (2013). The caption for Meehl et al (2013) reads:
The first EOF of 13 year low pass filtered SSTs for the Pacific Ocean domain shown from a 300 year period of the unforced CCSM4 control run (the model’s IPO); b) first EOF of 13 year low pass filtered SSTs for the ensemble mean RCP4.5 simulations from CCSM4 indicating the dominant forced response pattern; c) same as (b) except for second EOF.
So cell a is the dominant sea surface temperature pattern in the Pacific when the models aren’t forced by greenhouse gases, and cell b is the dominant sea surface temperature pattern in the future Pacific when the models are forced by greenhouse gases. To the right are the observed sea surface temperature patterns for the Pacific, using the HADISST dataset, from Meehl and Hu (2006). Neither the unforced or forced spatial patterns of the models are the same as the observed spatial pattern in sea surface temperatures.
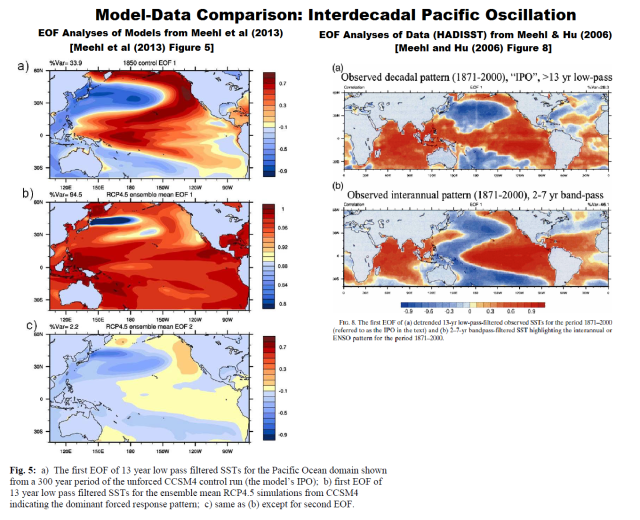
Figure 1
In fact, the unforced pattern in cell a of Meehl et al (2013), the upper left hand map in my Figure 1, resembles an El Niño Modoki pattern as presented by JAMSTEC. Figure 2 presents the El Niño and El Niño Modoki EOF maps from JAMSTEC for the period of 1979 to 2004. See their El Niño Modoki webpage here. So the most dominant pattern in the unforced sea surface temperatures of the models resembles the second most dominant pattern in the observations as presented by JAMSTEC.

Figure 2
It’s curious that the dominant pattern of the NCAR CCSM4 climate models used by Meehl et al (2013) is not the one created by East Pacific El Niño events. Why? East Pacific El Niños are what caused the sea surface temperatures of the Atlantic, Indian and West Pacific Oceans to warm in upward shifts. The El Niño events of 1987/88 and 1997/98, which caused the surges in global temperatures in Trenberth’s “big jumps” graph, were East Pacific El Niños, not El Niño Modoki events.
[Trenberth’s “big jumps” graph was discussed here. And El Niño Modoki events were discussed here and here. You’ll note in the latter post that the 1986/87/88 El Niño starts as an El Niño Modoki but ends as an East Pacific El Niño. That shift in El Niño type suggests that a secondary downwelling Rossby wave (a second burst of warm water from the Pacific Warm Pool) drove the El Niño farther to the east and created a more powerful El Niño during 1987, after the initial El Niño season of 1986/87.]
I also find it curious that Meehl et al (2013) presented the Interdecadal Pacific Oscillation-related spatial patterns for the control runs and for the future forced runs, but not for a hindcast period. If the models performed well at simulating the past, one would assume those maps would also have been presented.
And as noted in the post Open Letter to the Royal Meteorological Society Regarding Dr. Trenberth’s Article “Has Global Warming Stalled?”, even if La Niña events are causing the additional warming below the depths of 700 meters as suggested by the Meehl et al (2013) models, it’s sunlight, not infrared radiation from manmade greenhouse gases, that create that additional warm water in the tropical Pacific during La Niñas. Kevin Trenberth understands that very well. In fact, it was one of the topics discussed in Trenberth et al (2002) Evolution of El Nino–Southern Oscillation and global atmospheric surface temperatures. There, he and others wrote (my boldface):
The negative feedback between SST and surface fluxes can be interpreted as showing the importance of the discharge of heat during El Niño events and of the recharge of heat during La Niña events. Relatively clear skies in the central and eastern tropical Pacific allow solar radiation to enter the ocean, apparently offsetting the below normal SSTs, but the heat is carried away by Ekman drift, ocean currents, and adjustments through ocean Rossby and Kelvin waves, and the heat is stored in the western Pacific tropics. This is not simply a rearrangement of the ocean heat, but also a restoration of heat in the ocean.
In that post, I also presented a comparison graph of downward shortwave radiation (sunlight) versus downward longwave (infrared) radiation for the period of 1979 to present, along the equatorial Pacific (5S-5N, 120E-80W), based on the NCEP-DOE Reanalysis-2. See Figure 3. The downward longwave radiation (red curve) serves as a reasonable proxy for the El Niño and La Niña events. Notice that downward longwave (infrared) radiation decreases during La Niña events. That of course means its variations do not support the model-based supposition that infrared radiation is creating the additional warm water that is being forced below depths of 700 meters. In the real world, it’s downward shortwave radiation (sunlight) that increases during La Niña events.

Figure 3
The following section is for those concerned that I’m discussing El Niño and La Niña events while Meehl et al (2013) are discussing the positive and negative phases of the Interdecadal Pacific Oscillation.
INTERDECADAL PACIFIC OSCILLATION
Like the Pacific Decadal Oscillation dataset, the Interdecadal Pacific Oscillation (IPO) is an abstract form of the sea surface temperature data of the Pacific Ocean. Seemingly, there are as many definitions of the Interdecadal Pacific Oscillation as there are papers about it. Since this post is about Meehl et al (2013), we’ll used the latitudes they presented for the IPO in their Figure 5, which were 40S-60N, and use the longitudes of 120E-80W to minimize the influence of other ocean basins. Afterwards I’ll compare the “official” IPO index data to the IPO data I’ve created. There’s little difference in the timing of the changes from positive to negative IPO modes.
While the Pacific Decadal Oscillation data is derived from the sea surface temperatures of the extratropical North Pacific, for this presentation the Interdecadal Pacific Oscillation is determined from the data for most of the Pacific basin (40S-60N, 120E-80W). In the Pacific Decadal Oscillation data, global surface sea temperatures are subtracted from the North Pacific data. This does not make sense for an examination of Pacific data. The global data obviously includes the other ocean basins. Subtracting the data from the other ocean basins would leave us with a difference that no longer represents the Pacific Ocean. It leaves a difference influenced by the Atlantic, Indian, Arctic and Southern Oceans. So I’ve simply had the Pacific data detrended before the statistical analysis.
Empirical Orthogonal Function (EOF)/Principal Component (PC) analysis is used to determine the dominant pattern in the Pacific sea surface temperature anomalies. That is, for this discussion, the Interdecadal Pacific Oscillation represents the dominant spatial pattern of the sea surface temperature anomalies in the Pacific basin. See Figure 4. The map was created at the KNMI Climate Explorer. It uses HADISST data and is based on the period of 1900 to 2012.

Figure 4
Since El Niño and La Niña events are the dominant mode of natural variability in the Pacific (and the globe), the Interdecadal Pacific Oscillation basically presents an East Pacific El Niño-caused spatial pattern as shown above in Figure 4.
The data for the Interdecadal Pacific Oscillation represents how strongly the spatial pattern in the Pacific at a given time portrays (resembles) the El Niño-like spatial pattern. That’s why the year-to-year variations in the Interdecadal Pacific Oscillation data mimic NINO3.4 sea surface temperature anomalies, as shown in Figure 5. (NINO3.4 sea surface temperature anomalies are a commonly used index for the strength, frequency and duration of El Niño and La Niña events.) For two climate-related datasets, they agree quite strongly, with a correlation coefficient of 0.93.

Figure 5
But it’s also easy to see in my Figure 5 that there are subtle differences in the annual variations. We can highlight these minor differences by smoothing both datasets with121-month running-average filters. See Figure 6. Even with the decadal smoothing, the variations agree quite well. The additional variability of the Interdecadal Pacific Oscillation data is likely caused by the effects of changes in wind patterns (and the interdependent changes in sea level pressure) outside of the tropical Pacific that are not related to El Niño and La Niña processes. Changes in the direction and speeds of winds also impact the spatial pattern of sea surface temperatures.

Figure 6
Of course, some of the differences could also be caused by the uncertainties of the data. Keep in mind, sea surface temperature data are reconstructions—that is, we’re not examining raw sea surface temperature data—and numerous corrections/adjustments have been made that can impact these results.
Note: The IPO is presented, again depending on the paper, using a number of different low pass filters. I’ve used a 121-month running mean because it’s easy to understand and easy to duplicate, for those wishing to confirm the results.
And as shown in Figure 7, if we change the ENSO index from NINO3.4 sea surface temperature anomalies (5S-5N, 170W-120W) to the sea surface temperature anomalies for the Cold Tongue Region (6S-6N, 180-90W), we get slightly different results on the timing of the changeovers from positive to negative IPO. So the results are also dependent on the ENSO index.

Figure 7
Bottom line, as the comparisons show in Figures 6 and 7, for the most part, during periods when El Niño events dominate, the Interdecadal Pacific Oscillation data are positive and when La Niñas dominate, the Interdecadal Pacific Oscillation data are negative. It was those minor differences that interested researchers, because they influenced rainfall patterns in Australia.
As you’ll note in Figures 5 through 7, there are no units in those graphs. That is, they do not represent temperature in units of deg C. The reason: the two datasets have been standardized, divided by their standard deviations, so that they’re easier to compare. I’ve included Figure 8 as a reference. It compares NINO3.4 sea surface temperature anomalies to the 1st Principal Component of the detrended sea surface temperatures of the Pacific (Interdecadal Pacific Oscillation data) without the standardization. Based on their standard deviations, the variations in the NINO3.4 data are about 8 times stronger than the Interdecadal Pacific Oscillation data.

Figure 8
As noted earlier, there is an Interdecadal Pacific Oscillation dataset available on the internet. The version updated in 2008 is here. It’s based on the 1999 paper by Power et al Inter-decadal Modulation of the Impact of ENSO on Australia. Unfortunately, it ends in 2008.
To provide an up-to-date version, I used HADISST sea surface temperature data for the IPO in Figure 5 through 8. And as you’ll note, Meehl and Hu (2006) also used HADISST, so it’s a commonly used sea surface temperature dataset for these types of analyses. The problem: the HADISST data is infilled using EOF analysis. So the IPO data based on HADISST data also reflects, in part, the infilling method.
Ideally, I would have used HADSST3 data because it is not infilled. But that creates another problem because the HADSST3 data is not spatially complete—there are grids without data or gaps in the data—and this is especially true in the South Pacific. This presents a problem when performing EOF/PC analyses at the KNMI Climate Explorer. The default setting for the analysis requires that certain percentage of the grids contain data. For the months that don’t reach that threshold, the KNMI Climate Explorer leaves a blank, no output. That leaves numerous gaps in the Interdecadal Pacific Oscillation data during the 1940s and little data prior to the 1920s.
There are subtle differences between the Interdecadal Pacific Oscillation dataset I created and the “official” Interdecadal Pacific Oscillation data. I’ve compared them in Figure 9 for your information. Regardless, when El Niños dominate, the IPO is generally positive and when La Niñas dominate, the IPO is generally negative. And as discussed earlier, the differences are likely caused by the other factors that influence the ENSO-related spatial patterns in the Pacific.

Figure 9
And of course, as shown in Figure 10, the yearly variations in the “official” Interdecadal Pacific Oscillation data mimic the variations in NINO3.4 sea surface temperature anomalies—our ENSO index.

Figure 10
The document that contains the “official” Interdecadal Pacific Oscillation data includes the following statement:
The physical nature of the IPO is under investigation; it is still not clear, despite the above studies, to what extent the IPO is really independent of ENSO red noise and especially of SST variations near a decadal time scale where some physical processes have been identified.
Shakun and Shaman (2009) Tropical origins of North and South Pacific decadal variability examined the data in the North and South Pacific using EOF analyses. The conclusions of Shakun and Shaman (2009) reads (Note PDV stands for Pacific Decadal Variability):
Deriving a Southern Hemisphere equivalent of the PDO index shows that the spatial signature of the PDO can be well explained by the leading mode of SST variability for the South Pacific. Thus, PDV appears to be a basin-wide phenomenon most likely driven from the tropics. Moreover, while it was already known PDV north of the equator could be adequately modeled as a reddened response to ENSO, our results indicate this is true to an even greater extent in the South Pacific.
To sum up this section, the Interdecadal Pacific Oscillation is simply another El Niño- and La Niña-related index. When smoothed with decadal (or longer) filters, it portrays the decadal and multidecadal variations in the dominance of El Niño and La Niña events. The variations in the Interdecadal Pacific Oscillation index and an ENSO index (NINO3.4 sea surface temperature anomalies) agree quite well on annual and decadal time scales.
Unfortunately, many persons misunderstand what the Interdecadal Pacific Oscillation represents.
WHAT THE IPO DOES NOT REPRESENT
While the Interdecadal Pacific Oscillation data is derived from the sea surface temperature anomaly data of the Pacific Ocean, it does not represent the sea surface temperature anomalies there. The Interdecadal Pacific Oscillation data also does not represent the multidecadal variations in the sea surface temperatures of the Pacific Ocean. To confirm that, Figure 11 compares the “official” Interdecadal Pacific Oscillation data to detrended sea surface temperature anomalies of the Pacific Ocean (40S-60N, 120E-80W). Note again that the data in Figure 11 have been standardized, which greatly exaggerates the variations in both.

Figure 11
MODEL-DATA COMPARISON – SATELLITE-ERA PACIFIC OCEAN SEA SURFACE TEMPERATURE TRENDS
The sea surface temperatures of the Pacific Ocean warm in a specific fashion. El Niño events release naturally created warm water from below the surface of the tropical Pacific and ocean currents carry the leftovers toward the poles (and into the tropical Indian Ocean). During multidecadal periods when La Niña events dominate, less warm water is released to the surface by El Niños and less warm water is carried toward mid-latitudes at the surface in their wake. On the other hand, during multidecadal periods when El Niño events are dominant, more warm water than normal is released by El Niños to the surface and carried by ocean currents toward mid-latitudes. This can be seen by looking at the warming trends in sea surface temperatures for the Pacific Ocean on a latitudinal (zonal mean) basis.
El Niño events dominated the satellite era of sea surface temperature data, and because the Pacific has complete coverage during that period, we’ll use satellite-era sea surface temperature data in the following model-data presentation. The Reynolds OI.v2 data includes data from satellites, ship inlets and buoys (fixed and floating).
Let’s first discuss the type of graph being used in the comparisons. See Figure 12. The (vertical) y-axis is scaled in deg C per decade, and it indicates the warming rates, based on the linear trends, for the term of the satellite-era Reynolds OI.v2 sea surface temperature dataset. The (horizontal) x-axis is latitude. The units range from the South Pole (-90 or 90S) on the left all the way to the North Pole (90 or 90N) on the right. “0” latitude is the equator. The data ends at Antarctica and at the Bering Strait.

Figure 12
Figure 12 presents the trends of the sea surface temperature data for its term, which starts in November 1981 and runs to present, May 2013. As shown, there is little to no warming for much of the tropical Pacific—from 10S to about 20N. In fact, much of it cooled slightly over the past 31+ years. The high latitudes of the South Pacific (south of 50S) and into the Southern Ocean also show cooling. We can also see the aftereffects of the El Niño domination during this period. The mid-latitudes of both hemispheres show warming. Again, that’s caused by the leftover warm water from the El Niños is being carried by ocean currents to the mid-latitudes. That residual warm water is carried to regions called the South Pacific Convergence Zone in the Southwest Pacific and the Kuroshio-Oyashio Extension (KOE) in the Northwest and Central North Pacific.
In Figure 13, I’ve added the ensemble mean (the average of the 6 model runs) of the NCAR CCSM4 models stored in the CMIP5 archive. (The NCAR CCSM4 was the climate model employed by Meehl et al (2013) for their study. And CMIP5 is the archive being used by the IPCC for its upcoming 5th Assessment Report.) Those model outputs are available to the public in easy-to-use formats through the KNMI Climate Explorer.

Figure 13
As shown, the warming rates of the average of the model outputs show no resemblance to how the Pacific actually warmed. That indicates a number of things: First, the models aren’t simulating El Niño and La Niña events properly. If the models were simulating them properly, there would be no warming of sea surface temperatures along the equator. Second, the models are not transporting leftover warm water (from the El Niños) from the tropics to the mid-latitudes properly. That’s especially true in the Southern Hemisphere, where the modeled warming rates at mid-latitudes are comparable to those in the tropics. That severely undermines the conclusions reached by Meehl et al (2013). If the models show no skill at the transport of warm water from the tropics to the mid-latitudes on the surface, we have no reason to believe their results at depths below 700 meters.
Additionally, the models basically show how the Pacific sea surface temperatures would have warmed IF (big if) they were warmed by manmade greenhouse gases. Phrased another way, it indicates that modelers are still trying to force the warming of the oceans with greenhouse gases, while the data indicate that greenhouse gases were not involved in the warming of the oceans—sea surface temperatures or ocean heat content. If the natural warming of the global oceans is new to you, refer to my illustrated essay “The Manmade Global Warming Challenge” [42MB].
Animation 1 includes comparison graphs of the data to the six individual ensemble members and to the ensemble mean. Not one of the ensemble members captures the warming pattern correctly. Ensemble Member 2 (EM-2) shows some similarities, but the warming rates are way too high for most of the Pacific basin. And based on how poorly the other members simulate the warming rates, climate modelers are still a long way from being able to provide any information about the warming of the oceans—a long way away. And that’s after decades of modeling efforts. (You may need to click start the animation.)

Animation 1
CLOSING
Climate scientists are scrambling to explain why surface temperatures have not warmed since the 1997/98 El Niño. Meehl et al (2013) is yet another example. Fundamentally, Meehl et al (2013) is climate model-aided speculation. It is a failed attempt to explain how and why global surface temperatures cool (or remain flat) when La Niña events dominate and to explain that the warming continues but it occurs out of sight and out of mind below the depths of 700 meters.
Curiously, while Meehl et al (2013) depends on El Niño and La Niña processes, they never use the terms El Niño or La Niña in the paper. They elected to present the effects of ENSO on the Pacific basin in an abstract form, the Interdecadal Pacific Oscillation. The problem with that: If the climate models show no skill at being able to simulate the processes of ENSO on short-term bases, there’s no reason to believe they perform any better on decadal or multidecadal bases.
Another curiosity: Meehl et al (2013) presented the outputs of 5 ensemble members of the CCSM4 model using RCP4.5 forcings. But the CMIP5 archive contains 6 ensemble members with those forcings. Why did they exclude one? We illustrated how poorly all six ensemble members simulate the warming rates in the Pacific on a zonal mean basis, so why they excluded one is somewhat of a mystery.
Climate modelers still cannot simulate the coupled ocean-atmosphere processes associated with El Niño and La Niña events. And they are still trying to force El Niño and La Niña processes with longwave radiation from greenhouse gases, while in reality the processes are fueled by sunlight. One of the authors of Meehl et al (2013), Kevin Trenberth, actually “wrote the book” on ENSO, and he understands the processes well. Yet somehow he has lent his name to a paper that presents an alternative to that reality. That is, Meehl et al suggest that manmade global warming continues but it’s being driven to depths below 700 meters by La Niñas. But the warm water created during La Niñas results from an increase in sunlight, not infrared radiation.
All of these factors dictate that studies such as Meehl et al (2013) have no value. Meehl et al (2013) employed fatally flawed models in an attempt to determine how and why the warming of surface temperatures has stalled and they employed those same fatally flawed climate models in an effort to determine where Kevin Trenberth’s missing heat might have gone—which assumes the missing heat even exists.
Come to think of it, we have not found a variable that climate models simulate properly. That is, in recent months we’ve also illustrated and discussed that the climate models stored in the CMIP5 archive for the upcoming 5th Assessment Report (AR5) cannot simulate observed:
Satellite-Era Sea Surface Temperatures
Global Surface Temperatures (Land+Ocean) Since 1880
Daily Maximum and Minimum Temperatures and the Diurnal Temperature Range
So the value of climate models in any research effort is questionable.
“Will Ocean Heat Come Back to Haunt Us? “
Signs point to “No”.
TRENBERTH LOSES HIS STRAWBERRIES
(see the courtroom scene from The Caine Mutiny
As greenhouse gases still accrete
This captain of the climate wars
Is searching for the missing heat
That he believes the ocean stores
He’ll prove to all humanity
That danger in the deep resides
The Kraken that he knows must be
That Davy Jones’ Locker hides
The soul’s more heavy than we think
A truth that everyone must face
And to what depths a soul many sink
Oh! to what dark and dismal place!
Does Captain Trenberth understand
The data offers no appeal?
He tumbles in his restless hand
Three clacking balls of stainless steel
MY GEOMETRIC LOGIC PROVES
HEAT TELEPORTS FROM PLACE TO PLACE!
FROM SKIES INTO THE DEPTHS IT MOVES
AND IN BETWEEN IT LEAVES NO TRACE!
When silent faces stare at you
Its always best to shut your jaw
But Trenberth is without a clue
As he believes they stare in awe
Since they say that the PDO is not related to the Sun, then we have winds, air temperatures, volcanoes, Ocean currents and CO2 driving the oscillation. But, winds, air temperatures, and Ocean currents are driven by the Sun. So that leaves volcanoes and CO2. We have had no major volcanoes. That leaves CO2.
Now CO2 must be trapping the heat that is in the system. If that heat is being pushed down 700 meters into the Oceans, what mechanism is forcing this action? It must be Ocean currents. But the Ocean currents can only “move” the warm surface water into the depths to “warm the depths”.
Therefore, to “warm the depths”, the Ocean surface temperatures must be excessively warm, not normal. But that is not the case; Ocean surface temperatures are at best only rising slightly. Between the Arctic and Antarctic the amount of ice is almost constant. Globally, the Ocean temperature can not be increasing unless the amount of ice at the poles vanishes.
/sarc on
So that magic gas CO2, must be forcing the heat into the Ocean Depths, not Ocean currents. I haven’t calculated how much CO2 it takes to force one cc of water down 700 meters, but given the magic powers of CO2 maybe only one molecule can do it.
As I watched Obama give his speech about Climate Change, again I am amazed. That CO2 is both a laughing gas and a depression producing gas. Magic.
/sarc off
Bob, your dedication and efforts will not go unrewarded. You already stand out as the primary authority in oceanic circulation and related effects as far as many lay scientists are concerned and possibly many in the mainstream that are not hamstrung by (you know what).
Great post and well done.
“Model-based evidence…”
A model is not, and can never be, “evidence”.
Bob: The area I see that the progress is most likely to improve the understanding of climate is to identify and account for any short term natural cycles that we have already measured in the Global and other temperature data.
Ones in the 1 year to 15 year in length are the ones I think will be most useful.
We all understand how we can measure day, weather, season and, to a certain extent, climate. We also see individual irregular patterns (El Nino, etc) that are longer than a year but then again I have found little if any research into the regular natural patterns that will have occurred that are longer than a year in duration.
I believe that there is at least a 4 year natural cycle hidden in the existing temperature data. That is, there is a pattern to the 1461 day full solar ‘year’. Not really surprising given that 365 is only a human approximation anyway.
I think that we are destroying all that 4 year information in the data by chopping it into 365 day segments. We should instead use the 1461 day ones of a ‘full solar year’. This reveals things that we may have accidentally ignored otherwise.
If we use a 1461 day ‘full solar year’ segment, then curious regular patterns emerge from long term series like CET.
http://s1291.photobucket.com/user/RichardLH/story/73127
We also can find similar patterns in the UAH satellite data series.
http://s1291.photobucket.com/user/RichardLH/story/70051
The same 4 year periods occurring in both temperature series, one a whole area view from satellite of 34 years in length and the other a single geographical point but of 241 years in length seems unlikely to be a coincidence.
Perhaps the 37 month, 4 year, 7 year and 12 year signal from the satellite data is also visible in other temperature records as well?
This just in:
“AL GORE FINDS TRENBERTH’S MISSING HEAT”
It is just below the planet’s crust where temps are now millions of degrees!
🙂
“Model based evidence”. Just stop it. Please.
As an afterthought, something I should have considered earlier, the start year of the detrending impacts the detrended data. The “official” IPO data in seasonal form starts in 1850 and their monthly data begins in 1871. See here:
http://www.iges.org/c20c/IPO_v2.doc
I, on the other hand, had used a start year of 1900 for the detrending when I created the 1st PC (IPO) data represented by the blue curves in Figures 5 through 9. If I detrend the data starting in 1871, then my IPO dataset better agrees with the “official” IPO data in early years:
http://bobtisdale.files.wordpress.com/2013/06/figure-9b.png
I don’t think there’s any reason to change the graphs in the post. ENSO is still the primary cause of the multidecadal variations in the Interdecadal Pacific Oscillation data, and that’s the point I was trying to make.
Maybe that missing heat isn’t heat at all. Maybe that’s solar energy being stored chemically in biomass.
BOB: Having read Bob Painting’s blog on the Meehl paper I was eagerly awaiting your views on what seemed, even to a layman like myself, a rather pathetic attempt to find the ‘missing’ heat. As ever – You didn’t disappoint. Thank you.
With regard to the Bob Painting blog, he states categorically that the mechanism by which long wave downwelling radiation heats oceans is that it reduces the heat gradient in the thin cool skin layer, which is no thicker one millimetre. Thus 70% (the area of the world’s surface represented by the oceans) of the projected CAGW is down a trace gas affecting the top millimetre of the oceans.
Even if the oceans were millponds this seems quite ridiculous. Surely the climate science community at large don’t subscribe to this hypothesis?.
I live in the UK where a zealous green government has implemented a carbon reduction energy policy that is going to destroying the competitiveness of our economy and may not even keep the lights on. The USA seems hell bent on following the same course. Voices of sanity such as yours never reach the policy makers, so We can only hope that the climate science community will be forced to answer some difficult questions by our Governments in a year or two as the unreallity of their predictions becomes clear from the real world datasets. It will probably be too late for the UK economy, but perhaps not for that of the USA.
‘
What is the mechanism where by water heated at the surface moves that theat down to >700 meters, by passing the ~2000 feet of water in between the surface and 700 meters?
typo: IS destroying the competitiveness of our economy!
If the alleged fraction of a degree of heating of the wispy lower atmosphere that is “missing” were spread throughout the massive ocean depths, how could it possibly even be measured?
Figure 3 shows decreasing IR radiation at the Equatorial Pacific.
How is that even possible?
Great Post Bob
Here’s a quote from my latest post at
http://climatesense-norpag.blogspot.com
which your post validates in great detail.Thanks for all your excellent deconstuction of the modellers nonsense.
“In Britain , the gulf between the Met Office expectations for the last several years and the actual string of cold and snowy winters and wet summers which has occurred has made the Met Office a laughing stock-to the point of recently holding a meeting of 25 “experts” to try to figure out where they went wrong.
The answer is simple.Their climate models are incorrectly structured because they are based on three irrational and false assumptions. First that CO2 is the main climate driver ,second that in calculating climate sensitivity the GHE due to water vapour should be added to that of CO2 as a feed back effect and third that the GHE of water vapour is always positive.As to the last point the feedbacks cannot be positive otherwise we wouldn’t be here to talk about it .
Further ,Trenberth in a presentation at :
http://www.cpc.ncep.noaa.gov/products/outreach/proceedings/cdw31_proceedings/S6_05_Kevin_Trenberth_NCAR.ppt
proposes a strong natural negative feedback which has not been included in the IPCC- Met Office models and which independently of all the other evidence would necessarily substantially reduce model warming predictions.
Temperature drives both CO2 and water vapour independently,. The whole CAGW – GHG scare is based on the obvious fallacy of putting the effect before the cause.As a simple (not exact) analogy controlling CO2 levels to control temperature is like trying to lower the temperature of an electric hot plate under a boiling pan of water by capturing and sequestering the steam coming off the top.A corollory to this idea is that the whole idea of a simple climate sensitivity to CO2 is nonsense and the sensitivity equation has no physical meaning unless you already know what the natural controls on energy inputs are already ie the extent of the natural variability.
Furthermore the modelling approach is inherently of no value for predicting future temperature with any calculable certainty because of the difficulty of specifying the initial conditions of a large number of variables with sufficient precision prior to multiple iterations. “
I read the entry over at SKS, then I read the paper. What I found obvious was that no explanation was offered as to how the heat could simply vanish at the surface and reappear below 700m. These chaps obviously think we are all a bit dim probably because their acolytes are.
Thanks for the details Bob. Well put as always but it is probably a bit over the heads of the SKS crew.
Thanks, Bob.
Under the “CLOSING” section, 2nd paragraph beginning with the word “Curiously” you indicate the authors never use the terms El Niño or La Niña.
Curiouser and curiouser! [Alice]
If they believe in the evil of CO2, and apparently they do, then they have to ignore the clear sky and sunlight (CS&S) or show that CS&S is forced by CO2. Maybe that’s next. Anything, it seems, will do as long as they don’t have to unclamp from the CO2 bone.
“Curiously, while Meehl et al (2013) depends on El Niño and La Niña processes, they never use the terms El Niño or La Niña in the paper.”
Actually Bob, it’s not curious at all. You answer it later in that Trenberth “wrote the book” on ENSO. He’s hoping to get away with arguing that shortwave radiation heats the oceans despite the fact he knows it doesn’t. So maybe if he calls it something else, nobody will notice.
So the PDO is now being called the IPO? Is the IPO in any way a different construct, or do the authors of this change really think it is that important to clarify what everybody already knows: that “decadal” means interdecadal?
Alec Rawls says: “So the PDO is now being called the IPO?”
Nope. The PDO still exists. The PDO is derived statistically from the sea surface temperature anomalies of the North Pacific, north of 20N. The IPO is derived statistically from the sea surface temperature anomalies of most of the entire basin.
Because they are aftereffects of ENSO and because they do not represent the sea surface temperatures of their respective areas of the Pacific, neither has any value in determining how and why global surface temperatures warm.
Regards
Great job Bob…it’s obvious that you took great pains in penning a narrative that is digestible to us laymen. In addition the glaring errors and inconsistencies you have noted, I would like to add that it is physically impossible for all aggregate solar radiation (direct of reflected long wave) to mysteriously concentrate in one region of the globe.
From the sKs team page.
Rob Painting
Rob is an environmentalist, scuba diver, spearfisherman, kayaker and former police officer. Has researched climate science, in an amateur capacity, for 4 years. A long-time reader of Skeptical Science and now contributor.
‘climate model-based study’ rule one of climate ‘science’ when reality and models differ in value its reality which is in error . The models say the ocean is boiling , its boiling and there is no need to even look through the window to check it .
Not matter how high you pile it , in the end its still just a hill of sh*t
Dr Norman Page says:
June 26, 2013 at 8:46 am
Yet another point that all but eliminates the possibility that CAGW is even possible, and yet we have whole countries committing economic suicide because of a proven failed hypothesis.
Dear Anthony,
The moment I read the words “model” I lost interest.
Will I ever go to climate heaven?
Yours,
“Concerned” of Tunbridge Wells
Remote Cook Islands temperature records
http://www.vukcevic.talktalk.net/CookIslands.htm
from the South Pacific may be a good case study example.
Meehl, and all the other climate astrologers, should turn off their computers, quit paying attention to their models and attend an elementary school science class where the teacher enlightens the students on why ice forms on the surface of the water, and not on the bottom.
Bob
It is easy to “explain how and why global surface temperatures cool (or remain flat) when La Niña events dominate”.
La Niña domitates when PDO is low. When PDO is low there are more clouds and less shortwave to the tropical Pacific.
http://virakkraft.com/PDO-SW.png
On the decadal scale PDO and SW correlate but on a shorter scale (‘ENSO-scale’) they anticorrelate because of ENSO. Again you seem to have missed this important difference, repeating the misleading “the warm water created during La Niñas”.
the missing “heat”….is nothing more than a math error
What I do find funny…..is all the nutters that argue it’s right……which is admitting they were wrong again
Dr. Lurtz June 26, 7:16 am
CO2 is a laughing gas…
O god that is so good!!!!!!!
Eugene WR Gallun
Well they certainly are making a Meehl out of the hiatus and Trenberth’s missing heat. As many hilarious posts here demonstrate, they are already deep into the territory of self-parody.
But one or two possible flickers of enlightenment. First – they appear to accept a scenario of alternating periods of el Nino and La Nina dominance. Bob Tisdale has been patiently teaching for years that this is what lies behind the PDO – an epiphenomenon of ENSO. Another way to put it is that these two alternating periods, warm and cold phases of the PDO, also correspond to the two wings of a Lorenz butterfly attractor.
For so long they dismissed ENSO as just noise. How can noise show long term periodicity? Answer – when its not noise but a nonlinear oscillator governed by an attractor.
Also behind their desperate appeal to the ocean lies another glimmer of enlightenment, that the ocean’s internal thermal dynamics can exert long term influence on climate and temperatures. This is refreshing in the face of relentless peer reviewed research based on the premise that nothing but atmospheric interactions of radiation, backradiation and peccatogenic particles and gases can force climate and the ocean is only a passive puddle. Now a dawning realization of the power of the ocean to drive climate and to posses its own long term dynamic.
Eugene WR Gallun says:
June 26, 2013 at 7:11 am
TRENBERTH LOSES HIS STRAWBERRIES
(see the courtroom scene from The Caine Mutiny)
A truly great poem! What a creative renaissance WUWT is cultivating!
Wouldn’t it be great for humanity if scientists found a way to store heat in the deep oceans, thereby utilizing the finding and potentially delaying the onset of the next glacial period and its massive negative effects on our species ?
Pity Trenberth = shit fraudulent science for money.
Let’s all not let the anger dissipate for when it comes to retribution time.
lgl says: “It is easy to ‘explain how and why global surface temperatures cool (or remain flat) when La Niña events dominate’. La Niña domitates when PDO is low.”
You’ve got that backwards, lgl. The PDO is low when La Niñas dominate. The PDO lags ENSO so the PDO is an aftereffect of ENSO. Refer to Zhang et al (1999):
http://www.atmos.washington.edu/~david/zwb1997.pdf
And refer to Newman et al (2004):
http://courses.washington.edu/pcc587/readings/newman2003.pdf
The difference between an ENSO index and the PDO is a function of wind patterns and sea level pressure.
lgl says: “When PDO is low there are more clouds and less shortwave to the tropical Pacific.
http://virakkraft.com/PDO-SW.png”
Your graph appears to show cloud cover increasing and decreasing in unison with sunlight, where they should be inversely related. Did you invert one and forget to note that on your overlay.
Also, it would be nice if you’d list the source of your data when you present a graph. Is the cloud amount and DSR data from the NCEP-DOE reanalysis-2? If so, did you use total, low-level, medium-level or high-level cloud amount? I would assume you’re using total cloud amount, but I want to make sure, before I take the time to plot it myself so that I can examine what you’re showing.
lgl says: “On the decadal scale PDO and SW correlate but on a shorter scale (‘ENSO-scale’) they anticorrelate because of ENSO. Again you seem to have missed this important difference, repeating the misleading ‘the warm water created during La Niñas’.”
There’s nothing misleading about my statement ‘the warm water created during La Niñas’. The ocean heat content data for the tropical Pacific plainly shows that ocean heat content warmed during the La Niña events of 1954-57, 1973-76, 1995/96 and 1998-01. That fact is tough to miss with them highlighted in red in the following graph:
http://oi40.tinypic.com/9l97wh.jpg
Additionally what you wrote supports it. You noted that shortwave radiation over the tropical Pacific and ENSO anticorrelate on shorter timescales. That’s when the recharge takes place—on the shorter timescales—not on decadal time frames. That was the point I tried to impress on you the last time.
Again, please advise the source of your DSR and Cloud Amount data.
Regards
phlogiston says:
June 26, 2013 at 1:52 pm
And the more the oceans cycles are discussed to stronger I feel that the 2 attractors are switched by accumulated heat, one attractor is the ocean “warming” cycle, and the other is it’s “cooling” cycle.
The ocean accumulates heat, up to a point, then dumps that heat into the upper latitudes to radiate into space, resetting the cycle.
lgl, I took a look at the data to confirm what I thought I was seeing in your graph: http://virakkraft.com/PDO-SW.png
It appears to me that the PDO shows a long-term decline, but the DSR increases drastically from the late-1980s to the mid-1990s and then declines.
Those facts show up reasonably well in a comparison graph of the JISAO PDO data and the NCEP-DOE R-2 Downward Shortwave Radiation flux anomalies, when you standardize the data and then smooth them with 13-month filters:
http://i44.tinypic.com/5kf6z4.jpg
And they show up even better with a 37-month filter:
http://i42.tinypic.com/5lnqqb.jpg
Please don’t tell me I’m wrong or that I’ve missed something, when you have nothing to support your claim, especially when it appears you mislead yourself with how you present data. And please don’t attempt to mislead the readers here with your bogus presentations.
Have a nice day.
GODZILLA! GODZILLA!
We are caught in a real life GODZILLA! movie. All we have to do is replace the term
“global warming” with GODZILLA! Some scientists in the 1980’s looked at the landscape and saw what looked like giant footprints and tail swipes from what must be a huge monster. Grants were granted, studies were made and models were modeled. It became so clear to to the team of intrepid investigators; GODZILLA! lives! We may not survive! We must scare the population into incontinence and then action. We are the truth and the way.
Then around 15 years ago mankind caught a break. GODZILLA! sensed that we were onto him and went into hiding. Amazing that such a gargantuan and powerfully destructive creature could vanish but nevertheless he went missing. Some on the team suspect that GODZILLA! Has chameleon DNA and is hiding in plain sight. Others on the team are convinced GODZILLA! Used an ancient and secret passageway to slip undetected into the deep ocean where he swims today and waits for the moment of his choosing to slither back onto land and finish us once and for all. Other scientists look at the alleged footprints and tail swipes and see nature. The world waits for answers…
I’m guessing here. Undersea volcanism has been decreasing and nobody told us? I found Trenberths missing heat.
Teehee.
“When silent faces stare at you
Its always best to shut your jaw
But Trenberth is without a clue
As he believes they stare in awe.” [Eugene Gallum 7:11AM 6/26/13]
Applause! Applause!
*********************************************
“… how much CO2 it takes to force one cc of water down 700 meters, [] given the magic powers of CO2 maybe only one molecule can do it.
*** CO2 is both a laughing gas and a depression producing gas. Magic.” [Dr. Lurtz at 7:16AM]
LAUGH – OUT — LOUD gas. #[:)] — good one, Lurtz.
********************************************************************
Dear Bob,
Thank you, once again, for sharing all your diligent, thorough, important, work.
In your “worth a thousand words” graphs, by the way, you make excellent use of colors that contrast and or “pop.” Easy to read and quickly grasp your message from them. They, in fact, underscore your excellent writing-to-be-understood.
Your grateful student,
Janice
!*!*!*!*!*!*!*!*!*!*!*!*!*!*!*!*!*!*!*!*!*!*!*!*!*!*!*!*!*!*!*!*!*!*!*!
HEY, EVERYBODY! BUY BOB’S BOOKS!
!*!*!*!*!*!*!*!*!*!*!*!*!*!*!*!*!*!*!*!*!*!*!*!*!*!*!*!*!*!*!*!*!*!*!*!
Or, if not Godzilla [good one, Van W, lol]….
THE BLOB!
It was frozen and dropped into the Arctic Ocean in 1958…. WHERE IS IT NOW???!
Very nice, Bob. I particularly like your figure 11. It is one of the first times I’ve actually seen a chart of the Pacific SSTs. Did you notice that the anomalies in the 1940s were actually higher than the recent ones. So, how is it the adjusted temperature data sets (GISS, HadCru, BEST) all show us warmer today when fully 1/3 of the Earth was warmer then, and we know that our current temperatures are primarily driven by changes in ENSO? How is it possible for the Pacific to have not driven temperatures in a similar fashion back in the 1930s and 40s? I think this is strong evidence that temperature adjustments are wrong.
This would be a nice topic for another post. Show the discrepancy between then and now.
Bob
My Y-axis says from 62 to 56 so yes, cloud cover is inverted, and like always when not specified it’s total cloud cover, and the data is from your NCEP-DOE gold mine.
More later.
Bob
I haven’t got it backwards just because some say so. Have you already forgotten: “The physical nature of the IPO is under investigation …” The lag you mention is on a short time frame, not decadal. On a decadal frame the rule is, high PDO > less clouds, low PDO > more clouds, which sets the SW input. It is b t w illogical that ENSO would drive itself higher and higher and then suddenly switch to driving itself lower.
“That fact is tough to miss with them highlighted in red …”
What is tough to miss is that there were several other stronger Ninas without any corresponding OHC increase.
Why didn’t the 65, 71 and 08 Ninas warm the Pacific?
Why didn’t the very deep Ninas in 89 and 11 give more warming than for instance the 92 Nino?
Clearly the 95-96 Nina which was barely a Nina at all was not responsible for that OHC jump. A much more logical explanation is that the 96 Nina was so weak it didn’t remove all the heat generated in the east Pacific by the Ninos after 90 so those moderate Ninos are the real fuel of the 97 Nino.
Your highlighting is a pure cherrypick. If valid there should be correlation between OHC and the inverse of ENSO. That correlation is very poor. I fact the correlation is better between OHC and a lagged normal (non-inverted) ENSO.
In the attached you will also find a very clear east Pacific OHC step up in 76 when the PDO went positve, and a similar step down again in 07 when PDO went negative (and a smaller step down around 2000 when the PDO was also negative) This is another fingerprint of the PDO/-NPI.
http://virakkraft.com/Trop-Pac-OHC-ENSO.pptx