OVERVIEW
Before the ARGO floats were deployed, there were so few temperature and salinity observations at depths below 700 meters that the NODC does not present ocean heat content data during that period for depths of 0-2000 meters on an annual basis. That is, the NODC only presents its annual ocean heat content data for the depths of 0-2000 meters starting in 2005. The NODC’s annual ocean heat content data (0-2000 meters) for global oceans are here; for the Indian Ocean, see here; for the Atlantic Ocean, they’re here; and for the Pacific Ocean, data can be found here. The NODC now only presents its long-term data (1955 to present) for depths of 0-2000 meters in pentadal form. They had provided the long-term annual data for the depths of 0-2000 meters for a very short time period, but removed it from their website as soon as they released the pentadal data. There are two problems with the pentadal data. It mysteriously adds more than 30% to the long-term trend when compared to the formerly available annual data for those depths. (See the post here.) And the 5-year “averaging” of the pentadal data makes the dataset useless in attribution studies. 5-year filters have been used by the climate science community for years to mask responses to El Niño and La Niña events, which also have significant impacts on ocean heat content data.
So that leaves us with only 8 years of annual ocean heat content data to examine for the depths of 0-2000 meters. That’s okay. We can learn something from the 8 years of data.
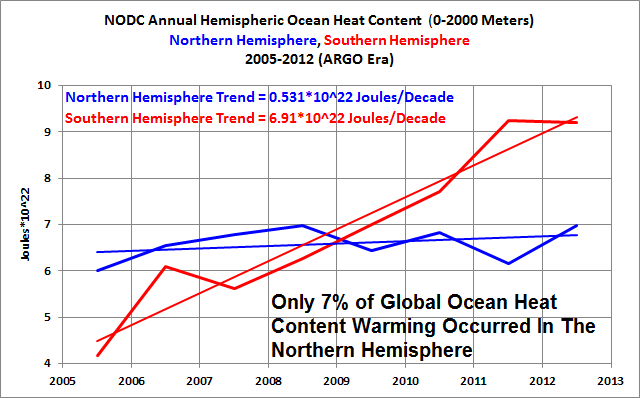
Figure 1
Keep in mind, ocean heat content data is unlike surface temperature and lower troposphere temperature data. With ocean heat content data, the heat is either there or it’s not. There is no unrealized heat. Roger Pielke Sr. provided a more detailed explanation in his blog post here.
Also keep in mind that Balmaseda et al (2013) Distinctive climate signals in reanalysis of global ocean heat content (paywalled), of which Kevin Trenberth was one of the authors, began their abstract with:
The elusive nature of the post-2004 upper ocean warming has exposed uncertainties in the ocean’s role in the Earth’s energy budget and transient climate sensitivity.
That falls right in line with the period from 2005 to 2012, for which we have annual data. And as we’ll see, the warming is still elusive.
Ever since the NODC released their ocean heat content data for the depths of 0-2000 meters and published Levitus et al (2012), it seems that each time a skeptic writes a blog post or answers a question in an interview, in which he or she states that global surface temperatures haven’t warmed in “X” years, a global warming enthusiast will counter with something to the effect of: global warming hasn’t slowed because ocean heat content continues to show warming at depths of 0-2000 meters. Recently, those same people are linking Balmaseda et al (2013) and claiming the warming of ocean heat content data continues.
It is true that the NODC’s ARGO-era ocean heat content (0-2000 meters) continues to warm globally, but always recall that the ARGO data had to be adjusted, modified, tweaked, corrected, whatever, in order to create that warming. That is, the “raw” ocean heat content data for 0-2000 meters shows the decreased rate of warming after the ARGO floats were deployed. (See the post here.) Also, while the much-revised NODC ocean heat content data for 0-2000 meters might show warming globally, it shows very little warming for the Northern Hemisphere oceans since 2005. See Figure 1. Only about 7% of the warming of ocean heat content for the depths of 0-2000 meters occurred in the Northern Hemisphere from 2005 to 2012, yet the surface area of the Northern Hemisphere oceans represents about 43% of the surface of the global oceans.
Can well-mixed human-created greenhouse gases pick and choose between the hemispheres, warming one but not the other? One might think that’s very unlikely.
Something else to consider: the Northern Hemisphere warming of ocean heat content for depths of 0-2000 meters occurs in only one ocean basin, and it’s not one of the big ones.
NORTHERN HEMISPHERE OCEAN HEAT CONTENT – 0-700 AND 0-2000 METERS
Before we begin with the individual ocean basins, let’s take a look at the change in the ocean heat content of the Northern Hemisphere from 2005 to 2012, for the depth ranges of 0-700 meters and 0-2000 meters. See Figure 2. There was a comparatively minor warming in the Northern Hemisphere at depths of 0-2000 meters from 2005 to 2012. But the upper 700 meters in the Northern Hemisphere cooled. The difference is provided to show the additional warming that occurred at depths of 700 to 2000 meters.
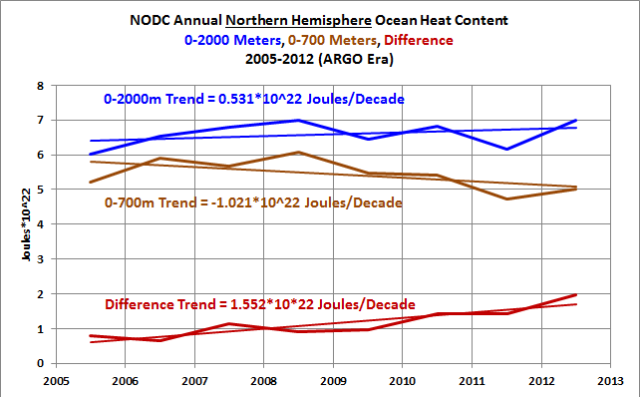
Figure 2
NORTH INDIAN OCEAN HEAT CONTENT – 0-700 AND 0-2000 METERS
Before we begin, recall that the North Indian Ocean is not like the North Atlantic and North Pacific. The North Indian Ocean basically ends in the tropics with the Arabian Sea and the Bay of Bengal, both bordering Asia, while the North Atlantic and North Pacific have large extratropical portions. The North Indian Ocean is comparatively small for that reason.
If manmade greenhouse gases were capable of warming the global oceans, one would have to assume the warming would be similar to what’s taking place in the North Indian Ocean. As shown in Figure 3, the ocean heat content for the North Indian Ocean is warming at depths of 0-700 meters and 0-2000 meters—and at 700-2000 meters.

Figure 3
On the other hand, the ocean heat content data for the North Atlantic and North Pacific are not cooperating with the hypothetical warming of the oceans by manmade greenhouse gases.
NORTH ATLANTIC OCEAN HEAT CONTENT – 0-700 AND 0-2000 METERS
RealClimate recently published a post titled “The Answer is Blowing in the Wind: the Warming Went into the Deep End”. It’s about the Balmaseda et al (2013) paper. There Rasmus Benestad writes about the North Atlantic:
A weakening of the Atlantic meridional overturning circulation (MOC) may have played a role in the deep ocean warming.
So let’s take a look at the North Atlantic ocean heat content data. Based on the linear trend, the ocean heat content data of the North Atlantic for the depths of 0-2000 meters haven’t warmed from 2005 to 2012. See Figure 4. And the data for depths of 0-700 meters show cooling in the North Atlantic. The additional warming at the depths of 700-2000 meters (illustrated by the “difference”) was comparable to the cooling at 0-700 meters, inferring there might simply have been an exchange of heat between two depth ranges, but there is no evidence of manmade greenhouse gas-driven warming in the North Atlantic from 2005-2012.
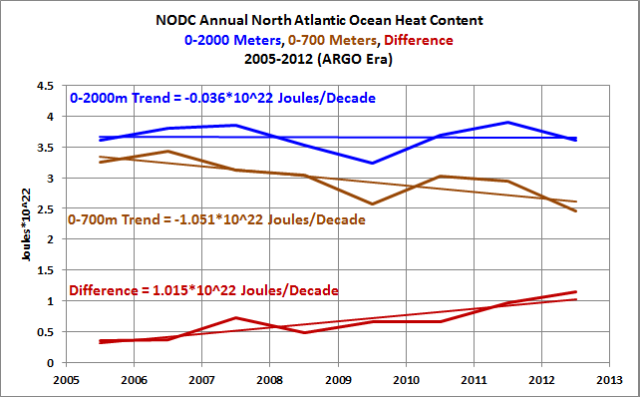
Figure 4
Also recall that Mauritzen et al (2012) Importance of density-compensated temperature change for deep North Atlantic Ocean heat uptake (paywalled) found that while the upper 2000 meters of the North Atlantic warmed since the 1950s, the deep ocean below 2000 meters cooled, suggesting an exchange of heat between the deep ocean and the depths above 2000 meters. That cooling below 2000 meters is obviously not considered in the NODC ocean heat content data. Mauritzen et al (2012) was discussed in my post Is Ocean Heat Content All It’s Stacked up to Be? under the heading of SPEAKING OF STILL-TO-BE-DISCOVERED SUBSURFACE OCEAN PROCESSES.
NORTH PACIFIC OCEAN HEAT CONTENT – 0-700 AND 0-2000 METERS
There have been a number of blog posts about Balmaseda et al (2013) by proponents of the hypothesis of manmade global warming, including the RealClimate post linked above and at least one post at SkepticalScience. From what I can gather from those posts, Balmaseda et al (2013) are basically saying this: when La Niña events dominate, warm water is forced to depths greater than 300 meters, driven there by the stronger-than-normal trade winds associated with the La Niñas. According to the new and improved Oceanic NINO Index, starting in 2005, there have been 5 La Niña events and only 2 El Niños. Clearly, La Niña events dominated the last 8 years. Therefore, we would expect the ocean heat content of the North Pacific to be showing all sorts of excessive warming.
But the NODC’s annual ocean heat content data for the North Pacific shows cooling, Figure 5, not warming, for the depths of 0-2000 meters. And the depths of 0-700 meters have cooled at an even more drastic rate. If the stronger trade winds associated with the La Niña events have contributed to the warming of the North Pacific ocean heat content from 700-2000 meters (shown as the “difference”), then the only thing those stronger trade winds did was prevent the 0-2000 meter data from cooling as quickly as the 0-700 meter data.
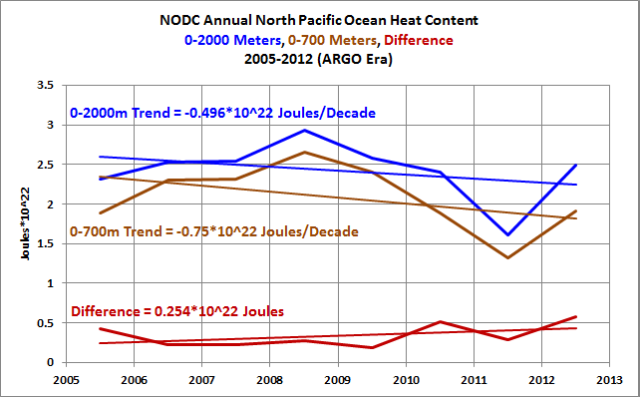
Figure 5
FURTHER INFORMATION
I linked this post earlier, but I’ll link it again. For a detailed discussion of the problems with ocean heat content data refer to Is Ocean Heat Content All It’s Stacked up to Be?
For introductory discussions of how the ocean heat content data for the depths of 0-700 meters indicate the oceans warmed naturally, and discussions of the natural processes that caused the warming, refer to my illustrated essay “The Manmade Global Warming Challenge” [42MB]. And if you’re looking for a much more-detailed discussion of the natural warming of the global oceans, refer to my book Who Turned in the Heat? It was introduced in the post “Everything You Ever Wanted to Know About El Niño and La Niña”. It’s for sale in pdf form at US$8.00.
CLOSING
With their continuing failed attempts, the alarmist wing of the climate science community still has a lot of work to do to explain the warming of the global oceans, or lack thereof. If they can’t explain why the ocean heat content data of the North Atlantic and North Pacific have not warmed, they can’t claim greenhouse gases are responsible for the warming of the ocean heat content in the Southern Hemisphere. They also have problems with the long-term data, as we’ve been presenting and discussing for a few years. But first…
SkepticalScience’s Rob Painting provides a reasonable explanation of the hypothetical cause of greenhouse gas-driven warming of the global oceans in the post Observed Warming in Ocean and Atmosphere is Incompatible with Natural Variation. Painting writes (my boldface):
Arguably the most significant climate-related impact of increased concentrations of greenhouse gases in the atmosphere, is that they trap more heat in the ocean. Over the last half-century around 93% of global warming has actually gone into heating the ocean. A little-known fact is that the oceans are almost exclusively heated by sunlight (shortwave radiation) entering the surface layers. Geothermal heat emanating from deeper layers of the Earth does contribute a small amount to ocean warming but, on the time scale of decades & centuries, this contribution is effectively constant as it is determined by the rate of radioactive decay.
So how do greenhouse gases accomplish this ocean heating? This is discussed in this SkS post, but briefly; greenhouse gases radiate heat (longwave radiation) back toward the surface and, although they cannot penetrate into the ocean itself, they warm the uppermost surface of the thin cool-skin layer. The thermal gradient through this layer dictates the rate of heat loss from the (typically) warmer ocean surface, to the cooler atmosphere above. When greenhouse gases increase, more longwave radiation is directed back at the ocean surface, which warms the cool-skin layer, lowers the thermal gradient, and consequently reduces the rate of heat loss. The sum effect is that the oceans trap more of the sun’s energy and therefore warm over time.
While Painting does note that longwave radiation from greenhouse gases only impacts the top few millimeters (the skin) of the surface, he fails to consider that evaporation occurs at the surface, he fails to consider that the ocean release heat primarily through evaporation, and he fails to consider that when the ocean heat content data of the global oceans are divided into logical subsets, they indicate the oceans warmed naturally.
For almost 4 years, I’ve been illustrating how (and presenting the natural processes through which) specific La Niña events are responsible for the warming of ocean heat content in the tropical Pacific. More recently, I’ve shown that without the 1973-76 and 1995/96 La Niña events, Figure 6, the ocean heat content of the tropical Pacific would have cooled since the 1950s. It’s tough to claim manmade greenhouse gases are responsible for the long-term warming when that warming relies on only 4 years of data.
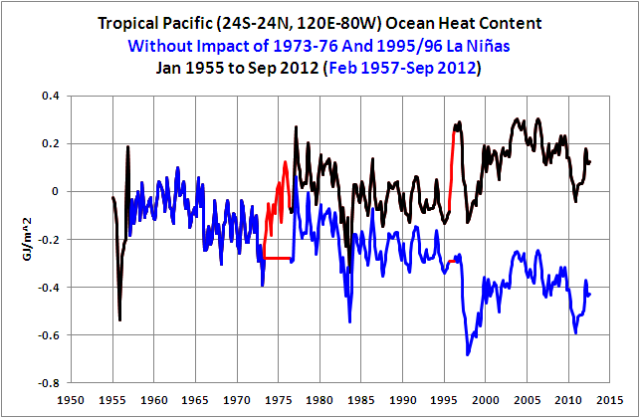
Figure 6
And I’ve been showing that the warming of the ocean heat content (0-700 meters) for the extratropical North Pacific is dependent on a 2-year shift and without that upward shift, which is likely caused by a change in wind patterns there, the ocean heat content of the North Pacific north of the tropics would also cool since the 1950s. Again, it’s tough to claim anthropogenic greenhouse gases caused the warming in this portion of the North Pacific when the ocean heat content data there would cool if you remove just 2 years of data.
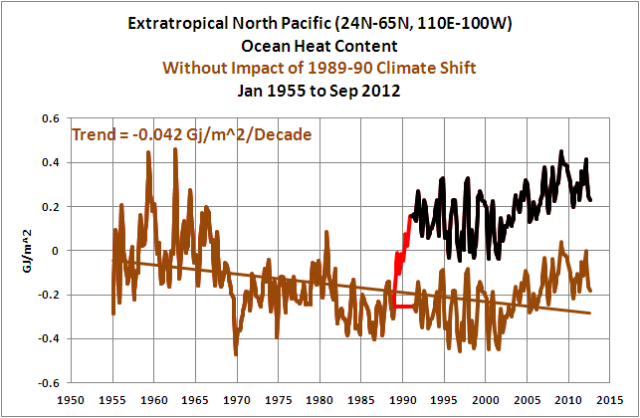
Figure 7
(Note: Almost 2 decades ago Kevin Trenberth discussed the same wind pattern-based upward shift in the sea level pressure of the extratropical North Pacific. Refer to Trenberth and Hurrell (1995) Decadal coupled atmosphere-ocean variations in the North Pacific Ocean. See their Figure 6, which shows the sea level pressure of a portion of the extratropical North Pacific. One would think Trenberth should also know that same shift exists in extratropical North Pacific sea surface temperature and ocean heat content data.)
Curiously, when you combine those ocean heat content subsets for the Pacific Ocean with their different natural warming and cooling periods, Figure 8, they mimic the long-term warming of the global ocean heat content data, which alarmists happily but falsely claim is caused by manmade greenhouse gases.
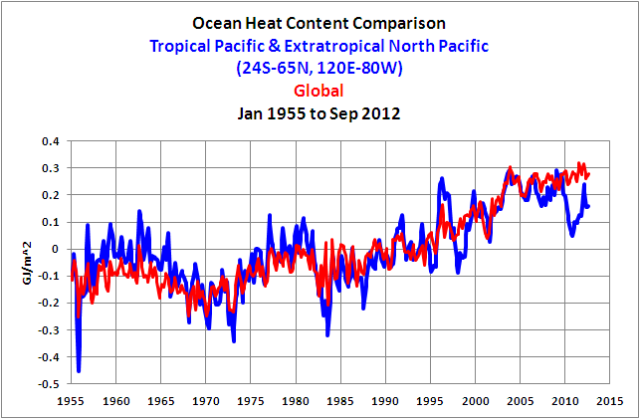
Figure 8
To conclude this post, I’ll paraphrase the opening sentence of Balmaseda et al (2013):
The elusive nature of the post-2004 upper ocean warming continues to expose uncertainties in the ocean’s role in the Earth’s energy budget and transient climate sensitivity.
SOURCES
The annual ocean heat content data (0-700 meters and 0-2000 meters) presented in Figures 1 through 5 are available from the NODC webpage here. The NODC ocean heat content data for Figures 6, 7 and 8 are available through the KNMI Climate Explorer.
How is the latent heat trapped in frozen water represented. Going from frozen to liquid phase requires energy. Were ocean circulation very efficient no temperature rise would be seen until all floating ice was melted.
Could it simply be that the rate of energy loss to space is greater in the Arctic than it is in the Antarctic?
Good post Bob.
Why would GHG forcing produce such a varying distribution of ocean heat content – some areas declining, some rising. That sounds more like internal ocean circulation variability than a global warming signal.
And where is all the GHG forcing going (it is 4 to 6 times bigger than any of the ocean heat content or atmosphere warming numbers).
Because North pole ice is melting into the water and circulating, but South pole ice isn’t? Duh.
Perhaps it is as simple as the SH summer is at perihelion.
KevinM: Here’s a map showing the ocean heat content trends for the Northern Hemisphere from 2005 to 2012:
http://oi39.tinypic.com/23r96ko.jpg
Would you like to change or keep your diagnosis for the Northern Hemisphere trends?
KevinM: And here’s a map showing the ocean heat content trends for the Southern Hemisphere from 2005 to 2012:
http://oi41.tinypic.com/13zv6na.jpg
Same question as above.
fhhaynie says:May 3, 2013 at 6:39 am
Could it simply be that the rate of energy loss to space is greater in the Arctic than it is in the Antarctic?
That is my guess. Warming NH waters melt Arctic ice, Arctic dumps excess heat, ice comes back since NH waters cooler. The radiation to to space in the north would be from open water, whereas in the Antarctic, only the atmosphere can dump heat. Could be a magnitudes of difference pole to pole. Seems like it could be a natural cycle.
Good post, Bob. I bought the paywalled Balmaseda 2013. Trenberthndidmnotmfind all his missing heat. He found 2/3 of it in a revised model, ORAS4, used for initializing ECMWF weather forecasts. That model previously ran too hot above 700m and too cold below, so was renormalized by data assimilation of ARGO PLUS an additional exogenous temperature bias correction. Part of the ‘found heat was just shifted around. The total heat to 2000m is 1.4x the NODC estimate, so in fact Trenberth ‘found’ less than half of what he predicted in 2009. And the alleged mechanism ascertained ‘from model sensitivity analysis’ was strengthened pacific trade winds. Except all the recent climate papers from his ‘team’ say they haven’t, and are using recent climate change caused weakening trades to explain dryer conditions in Hawaii the past decade.
8 years of Argo is enough to start to learn things about the oceans, but not enough to say anything at all with respect to climate change and possible relationships to AGW and rising CO2. Trenberthnonly embarrasses himself when he makes such claims aaa out a phenomena that miraculously emerged at the same time ARGO was deployed, via a mechanism that obervationally does not exist.
Regards
Thanks, Bob. As always a very good post.
I gather that the greenhouse effect does not affect the oceanic temperatures much, as they cool mainly by evaporation.
The greenhouse effect is looking weak, very weak. This indicates a low climate sensitivity, I think,
Your statement “If manmade greenhoue gases — warming — similiar — North Indian Ocean” is interesting since the Persan Gulf which empties into the Indian Ocean does not limit it’s temperature to 30.5 C. Kajajuk, April 28, 2013, pointed this out to me: http://www.windows2universe.org/earth/Water/temp.html. The Persan Gulf is different and has a peak temperature of 36 C. Whatever mechanism limits the ocean temperature is not present. I do not know why it is different. Also, it would be interesting to know if the Indian Ocean bordering the Persian Gulf is different.
Tell me why I should believe an upward shift in 1989-90, but not believe in a downward shift in 1968-70. (see Figure 7).
Bob, one aspect of the difference between NH and SH oceans is, of course, their relative area and volume. Your first chart shows the NH oceans heating at less than 10% the rate of SH oceans. I think this should be presented as joules per year, per cubic mile. Even that is not going to capture the latitude differences, though.
The deeper problem is that you are attempting to eat your cake and have it, too. Either the Argo data is corrupt and useless, or it is not corrupt and can tell us something. You can’t have it both ways. Good enough to justify a blog post and bad enough to deserve rubbishing halfway through said post just doesn’t work.
What I find in Mr. Tisdale’s essay is falsification of the Warmist hypothesis that increasing concentrations of CO2 are causing slower cooling at the surface of the oceans and thereby “warming” the oceans. If that “warming” mechanism exists in some ocean then it must exist in all oceans. It does not exist in northern hemisphere oceans, with the exception of the tropical north Indian Ocean.
If Warmists argue that their “warming” mechanism is influenced by local factors in the oceans then they concede Mr. Tisdale’s main point and he wins the argument. That is because he has an account of local factors, such as ENSO, and their effects on ocean heat content which can explain the differences in warming or cooling among the oceans. (Of course Mr. Tisdale is not a wealthy institution and has not enjoyed the luxury of conducting extensive experimentation to refine and confirm his claims.)
We should keep in mind that once Trenberth began looking for “the missing warmth” in the deep oceans he had given up the Warmist’s fundamental hypothesis that CO2 explains all warming. He is now playing Mr. Tisdale’s game but he does not realize it.
Stephen Rasey says: “Tell me why I should believe an upward shift in 1989-90, but not believe in a downward shift in 1968-70. (see Figure 7).”
Here’s a graph with the period of Jan 1986 to Dec 1970 highlighted:
http://oi42.tinypic.com/mcsshz.jpg
It could very well be a cooling shift in ocean heat content then. It may even start six months to a year earlier.
David vun Kannon says: “Bob, one aspect of the difference between NH and SH oceans is, of course, their relative area and volume. Your first chart shows the NH oceans heating at less than 10% the rate of SH oceans. I think this should be presented as joules per year, per cubic mile. Even that is not going to capture the latitude differences, though.”
It’s unfortunate that the NODC doesn’t present its data in a format that’s better suited for comparisons, like Gigajoules/sq meter. KNMI is kind enough to present the NODC OHC data (0-700 meter) that way.
David vun Kannon says: “The deeper problem is that you are attempting to eat your cake and have it, too. Either the Argo data is corrupt and useless, or it is not corrupt and can tell us something. You can’t have it both ways. Good enough to justify a blog post and bad enough to deserve rubbishing halfway through said post just doesn’t work.”
I disagree with you, of course. I advise the readers of the alterations to (problems with) the data to remind them of what we’re dealing with. It’s up to the readers to decide if they find the ocean heat content data credible. I’m simply using the data that’s available to identify problems in the arguments presented by global warming enthusiasts.
Theo Goodwin says: “Of course Mr. Tisdale is not a wealthy institution…”
It really is unfortunate that the claim “skeptics are funded by big oil” is a myth. But I’d settle for more book sales.
Theo Goodwin says: “…and has not enjoyed the luxury of conducting extensive experimentation to refine and confirm his claims.”
“Observations” would be a better end word in that sentence than “claims”.
Theo Goodwin says: “He is now playing Mr. Tisdale’s game but he does not realize it.”
Theo, I present data. I personally find it entertaining in a nerdy way. But a game? Not so much. It takes up way too much time.
Regards
Retired Engineer John: The annual average sea surface temperatures for the Gulf of Oman appear to be a little warmer than the Persian Gulf, but the Persian Gulf has wider annual variations:
http://oi43.tinypic.com/ivzp84.jpg
Consider becoming familiar with the KNMI Climate Explorer:
http://climexp.knmi.nl/selectfield_obs.cgi?someone@somewhere
And the NOAA NOMADS website for Reynolds OI.v2 data:
http://nomad3.ncep.noaa.gov/cgi-bin/pdisp_sst.sh?lite=
Regards
As always, fascinating.
w.
Mr.Tisdale continues to confuse his otherwise good evaluation of ocean temperatures by repeating an incorrect interpretation of the ocean surface energy balance.After presenting Rob Painting’s correct description of this balance,Tisdale then rejects it by stating”he fails to consider that the ocean release(s) heat primarily through evaporation” This is a true statement, but is irrelevant.It is the ocean surface temperature that controls the heat release,and the” back” radiation affects this temperature through the rather complicated nonlinear surface energy balance.Numerical evaluation of this balance shows that a 1W/m2 increase in back radiation causes(approximately) a 0.004K increase in surface temperature,and a 0.9 W/m2 decrease in the convective/conductive heat loss from the bulk ocean: the concomitant increase in evaporative flux is 0.05 W/m2. It is in this way the back radiation “warms”the ocean—it reduces the heat loss.The challenge Mr.Tisdale faces is to reconcile this basic physics with his explanation of ocean temperature changes.In this endeavor I wish him well.
Bob Tisdale says:
May 3, 2013 at 10:00 am
Thanks for your comments. Yes, you do stick to observations. That is much to your credit. And you do a great job of tying them together.
As for the game, maybe it is mine. I am trying to get the Warmists to take the observations seriously and to engage in empirical science on the natural regularities that underlie them. Success in this endeavor would mean that the Warmists give up their “manmade CO2 Uniformitarianism.” Trenberth has given it up but he does not realize it. If he must now identify oceanic processes of mixing to explain the effects of manmade CO2 on the oceans, and that is his latest effort, he will soon realize that those processes are not uniform for all oceans and that he must do empirical research on local oceanic processes. In other words, he will realize that he must do empirical research on phenomena such as ENSO. That will be a total game changer for mainstream climate science.
From the looks of the NH vs. SH data it looks like whomever “adjusted” the data wasn’t very careful and made it obvious that the adjustments are …. what is that word again …. starts with a F … oh, never mind.
”Oh what a tangled web we weave when first we practice to deceive”
Bob T,
I looked at both those maps and I don’t see how they contradict my guess.
Look like the water has trended warmer around 90S where ice has been growing and colder at 90N, and right next to Greenland.
Not trying to be a dumb jerk, but it looks like ocean temperature change near the ice depends on ice growth or decline. So whats your argument?
Also notice that nice little blue “getting colder” blob just north of the only part of Antartica that has been losing ice. Slam dunk.
KevinM says:
May 3, 2013 at 11:48 am
“Not trying to be a dumb jerk, but it looks like ocean temperature change near the ice depends on ice growth or decline. So whats your argument?”
You need to take into account a few more factors. For example, much of the ice in the South rests on land while all of the ice in the North rests on water. The effects of ice forming or melting will vary greatly between North and South.
The southern ice on land would flow to the sea if it were melting YOY, but it isn’t, except near that cold water spot.
The northern ice melts right into the sea, which it has been doing, and looks to be trapped in the pinch between Alaska and what used to be labeled Kamkatcka on Risk boards.
KevinM:
re your post at May 3, 2013 at 1:40 pm.
The ice does not melt except on its upper surface.
Antarctic ice is increasing with the result that total polar ice is increasing.
Your hypothesis is based on a false premise.
Richard
Anthony Mills says:
May 3, 2013 at 11:15 am
Mr.Tisdale continues to confuse his otherwise good evaluation of ocean temperatures by repeating an incorrect interpretation of the ocean surface energy balance.After presenting Rob Painting’s correct description of this balance,Tisdale then rejects it by stating”he fails to consider that the ocean release(s) heat primarily through evaporation” This is a true statement, but is irrelevant.It is the ocean surface temperature that controls the heat release,and the” back” radiation affects this temperature through the rather complicated nonlinear surface energy balance.Numerical evaluation of this balance shows that a 1W/m2 increase in back radiation causes(approximately) a 0.004K increase in surface temperature,and a 0.9 W/m2 decrease in the convective/conductive heat loss from the bulk ocean: the concomitant increase in evaporative flux is 0.05 W/m2. It is in this way the back radiation “warms”the ocean—it reduces the heat loss.The challenge Mr.Tisdale faces is to reconcile this basic physics with his explanation of ocean temperature changes.In this endeavor I wish him well.
The above is a clear example of how Carl Popper described how not to do science. Our radiation balance model hypothesis demands warming, but evidence shows no warming of the oceans, so we reject or manipulate away the evidence and cling stubbornly to the model. That is inductive – building a fiction of reality by linear catholic logic, as opposed to true, deductive science which makes hypotheses susceptible to falsification, then goes out, collects data and accepts the verdict – thumbs up or down?
This linear radiation balance argument, ignoring real world data, is a pathetic litany of blind faith in a desperate creed. The oceans are not warming. Change your hypothesis (or that of Mr Painting) – or at least accept that more than one factor might affect ocean heat and climate.
Bob Tisdale says:
May 3, 2013 at 7:09 am
KevinM: Here’s a map showing the ocean heat content trends for the Northern Hemisphere from 2005 to 2012:
http://oi39.tinypic.com/23r96ko.jpg
And here’s a map showing the ocean heat content trends for the Southern Hemisphere from 2005 to 2012:
http://oi41.tinypic.com/13zv6na.jpg
Interesting – the warming SH and cooling NH is in spite of SH to NH heat piracy – or perhaps it is the causative factor for this piracy. I love the oceanographic term “heat piracy” and the fact that it is carried out by the Carribean current – “pirates of the Carribean”!
Seidov et al 2001, http://193.146.160.29/gtb/sod/usu/$UBUG/repositorio/10280002_Seidov.pdf
Seidov et al 2005, http://www.eesi.psu.edu/~bjh18/papers/gpc05.ssh/Seidov_et_al_GPC_2005.pdf
Menviel et al 2012, http://myweb.science.unsw.edu.au/~lauriemenviel/Menviel12dsr.pdf
Maslin et al 2010, http://elearning.zaou.ac.zm:8060/Science/Oceanography/Encyclopedia%20of%20Ocean%20Sciences/Holocene%20Climate%20Variability.pdf
Anthony Mills: I have read the argument you’re trying to make numerous times. As shown in the post and in the linked essay, there is nothing in the ocean heat content data or satellite-era sea surface temperature data to indicate that manmade greenhouse gases have had any impact on the warming of the global oceans. If you’d like to carry your argument further, please provide links to the climate model-based peer-reviewed studies that explain:
1. How and why the sea surface temperatures of the East Pacific (90S-90N, 180-80W) haven’t warmed in 31 years.
http://oi47.tinypic.com/hv8lcx.jpg
2. How and why the seas surface temperatures of the Atlantic, Indian and West Pacific Oceans (identified as Region 2 in the graph) with the coordinate of 90S-90N, 80W-180, only warmed during the strong El Niño events of 1986/87/88, 1997/98 and 2009/10.
http://oi47.tinypic.com/jzw3np.jpg
Taking graphs now from this post:
3. How and why the warming of the ocean heat content data for the tropical Pacific is dependent on the 1973-76 and 1995/96 La Niña events, and without those La Niñas the ocean heat content for tropical Pacific would cool.
http://bobtisdale.files.wordpress.com/2013/05/figure-6.png
4. How and why the warming of the ocean heat content of the North Pacific (north of the tropics) is dependent on a 2-year climate shift (1989-90), and without that climate shift, the ocean heat content for the North Pacific would cool.
http://bobtisdale.files.wordpress.com/2013/05/figure-7.png
I await the links to peer-reviewed papers you’ll provide that offer climate model-based explanations for how and why the ocean have warmed in the fashion they’ve warmed. The first problem you’ll encounter is trying to find climate models that can simulate ENSO. As far as I know, there are a sum total of…none.
Theo Goodwin says: “In other words, he will realize that he must do empirical research on phenomena such as ENSO. That will be a total game changer for mainstream climate science.”
I suspect Trenberth already knows.
FYI, I had a recent exchange with one of the lead authors of the upcoming AR5 over at TallBloke’s a couple of months ago. My comment is here:
http://tallbloke.wordpress.com/2013/01/05/major-change-in-uk-met-office-global-warming-forecast/comment-page-1/#comment-40188
His reply is here:
http://tallbloke.wordpress.com/2013/01/05/major-change-in-uk-met-office-global-warming-forecast/comment-page-1/#comment-40242
And I ended with:
http://tallbloke.wordpress.com/2013/01/05/major-change-in-uk-met-office-global-warming-forecast/comment-page-1/#comment-40258
Personally, I think many of the researchers know they have a problem, about 25-30% of the sales of my book “Who Turned on the Heat?’ have been to researchers, but now they can’t back away from their position of the past 3 decades.
Regards
KevinM says: “So whats your argument?”
The warm water originates in the tropics and is dispersed in waves as a response to ENSO events. Refer to the following animation of OHC since 2003.
http://bobtisdale.files.wordpress.com/2013/03/argo-era-nodc-ohc-0-700m-12-month-smooth.gif
With the lesser El Niño events we’ve been experiencing, compared to the period of from the 1982/83 El Niño to the 1997/98 El Niño, and due to other unknown factors, possible a shift in the sea level pressure of the North Pacific, less warm water is being driven into the North Pacific after these lesser El Niños.
The animation was included in the following post as Animation 1, about ¾ of the way through it:
http://bobtisdale.wordpress.com/2013/03/11/is-ocean-heat-content-data-all-its-stacked-up-to-be/
Regards
Bob Tisdale:You are avoiding the issue I raised in my prior comment,which was simply that your interpretation of the surface energy balance at an evaporating ocean surface violated basic physical laws of heat transfer and thermodynamics.Physical laws demand that an increase in back radiation reduce heat loss from the bulk ocean.If there is no apparent evidence for this reduction,we need to look for other physical reasons for the ocean behavior you document.This is the challenge!
I’m pretty sure it’s got something to do with the beer.
phlogiston: Thanks for all of the links. There’s also a paper (last 10 years, I think) that attempted to quantify through measurements the volume of water that’s transported near the surface from the South Pacific to the North Pacific, back towards the equator again and then into the Indian Ocean at Indonesia. I had read it a couple of years ago but I can’t find it again. I had thought it was authored by a few researchers from PMEL, but I can’t find it at their website. The second name is very well known, but I can’t recall who it was. Errrr. (See what you have to look forward to when you reach my age.) I wanted to take another look at it to see how or if the sea level pressures between the hemispheres or basins (Pacific vs Indian) altered the flow.
Anthony Mills: There was a physicist who used to blog here. Her name is “Anna V”. An example of one of her comments is here:
http://wattsupwiththat.com/2010/04/05/march-global-sea-surface-temperatures/#comment-361280
She was quite vocal on that thread and on others. You’ll find her interesting.
Regards
fhhaynie says:
May 3, 2013 at 6:39 am
Could it simply be that the rate of energy loss to space is greater in the Arctic than it is in the Antarctic?
>>>>>>>>>>>>>>>>>>>>>>>>>
You might be interested in what John Kehr has to say link
Bob,
Concerning the two maps you posted to KevinM via tinypic (May 3, 7:09am and 7:21am)
http://oi39.tinypic.com/23r96ko.jpg
Northern Hemisphere Ocean Heat Content Trends 2005-2012
(0-700 Meters) GJ/m^2 Per year
Reg Jan-Dec averaged time index
With Jan-Dec averaged NODC 0-700m heat content 2005:2012 p < 30%
http://oi41.tinypic.com/13zv6na.jpg
Southern Hemisphere Ocean Heat Content Trends 2005-2012
(0-700 Meters) GJ/m^2 Per year
Reg Jan-Dec averaged time index
With Jan-Dec averaged NODC 0-700m heat content 2005:2012 p < 10%
Legend ranges -0.3 to +0.3 GJ/m^2 per year.
First question: what do the “p < 30%" and "p < 10%" mean in these senses and why are the North and South maps using different parameters?
Second , when I see numbers like: “+0.3 GJ/m^2 Per Year” I have to ask, “Is that a lot?”
1 GJ will raise the temperature of 700 m^2 sea water how much? 0.348 deg K. (see below)
In your maps, we have spots that have a regression slope of + or – 0.25 GJ/m^2/Yr. (North central Atlantic, W. Carib, Eastern N Pacific, Southern Indian)
We have an eight year record. If we split the raw Argo data into the first half and second half, the centroids of each half will be 4 years apart. In some places, we have a 0.25 GJ/m^2/yr slope, then we should have a 1 GJ/m^2 difference between each half. So there should be a 0.348 deg K. difference in the raw Argo data means between the two halves in those places. That DOES seem like a lot. That is about 0.9 deg K / decade!
Can we see that 0.348 deg K difference in the raw Argo Data, and is it statistically significant? Or are we seeing gridding artifacts in your map?
—- Calculation —-
Volume of Water 700 m x 1 m^2 = 700. m^3
Density of Sea Water = 1030. kg/m^3
Mass of Sea Water in 700m x 1 m^2 = 7.21E+05 kg
Specific Heat Cap of Sea Water = 3.99E+03 J / kg / degK
Heat to raise 700 m3 of sea water = 2.88E+09 J / degK
Joules per GigaJoule = 1.00E+09 J/GJ
Heat to raise 700 m3 of sea water = 2.877 GJ / degK
Avg rise in ocean temp (0-700 m) per GJ/m^2 = 0.348 deg K / (GJ/m^2)
phlogiston says:
May 3, 2013 at 3:23 pm
“Change your hypothesis (or that of Mr Painting) – or at least accept that more than one factor might affect ocean heat and climate.”
They cannot do that. For them, it is “manmade CO2 only but everywhere and all the time.” They are not only unwilling to test their hypotheses through empirical science but get all bothered when someone else takes on the task. They have no interest in empirical science.
Bob Tisdale:Sorry,when I read “Anna V” I conclude only that she has a very poor understanding of appropiate thermodynamics and heat transfer.A surface energy balance simply involves application of the First Law of Thermodynamics to a control volume surrounding the ocean- air interface, and numerical evaluation of the various heat fluxes involved to yield the behavior of the system. Anna V and others should do this exercise,rather than make ad hoc statements about heat transfer processes they do not understand properly. We need quantitative science, not qualitative speculation:the latter can be completely wrong.
Bob Tisdale says: May 3, 2013 at 10:31 am
“Retired Engineer John: The annual average sea surface temperatures for the Gulf of Oman appear to be a little warmer than the Persian Gulf, but the Persian Gulf has wider annual variations:
http://oi43.tinypic.com/ivzp84.jpg”
Bob , thank you very much for your reply. I have been looking at the temperatures and a paper on the Persian Gulf by J. Kampf and M. Sadrinasab. The Persian Gulf is very shallow, the average depth being 36 meters, and it loses about 2 meters of water to evaporation each year. The cooling from this evaporation is probably the reason it is cooler than the Gulf of Oman. The evaporation and the desalting plants, Saudi Arabia gets almost all it water from the Gulf, discharge makes it very salty. I notice no limitations on the Persan Gulf temperatures; the waveforms look like perfect sine waves on both the high and low temperature swings. But the Gulf Of Oman, which is between the Persian Gulf and the North Indian Ocean shows limiting near the 31C mark; although, I believe that one year it went higher. The waveforms on the low side are close to sine waves. The interesting part about the limiting in the Gulf Of Oman is that it appeared to have a difficulty in getting started. The temperature would rise close to the 31C mark and limiting would start and lower the temperature until the temperature dropped to 29C. The waveforms that Willis showed in his second post about the Argo float temperatures (I think it was Feb 2012) showed balanced waveforms on the ascending temperatures and descending temperatures even though the waveforms were flattened. I can’t draw any conclusions from this, but I will continue to think about it.
Scottish lobster catches hit by long winter, say fishermen
http://www.bbc.co.uk/news/uk-scotland-22418221
“Fishermen have said the harsh and prolonged winter in Scotland has been disastrous for the country’s lobster industry.
Valuable stocks of the shellfish are still hibernating out at sea because of the cold weather.
Creel fishermen claim catches are as much as 90% down on last year, meaning prices for the seafood have soared.”
I recall talking to a fish shop owner on the Isle of Wight a few years ago about the lack of crab in stock because of the low sea temperature. I was informed the crabs won’t move when the water temperature is below 6C.
Anthony Mills says: “Anna V and others should do this exercise,rather than make ad hoc statements about heat transfer processes they do not understand properly.”
I believe if you’ll read Anna V’s comments on the thread I linked and on others that you’ll find she understands thermodynamics. If memory serves, she’s a retired nuclear physicist.
Stephen Rasey says: “First question: what do the ‘p < 30%’ and ‘p < 10%’ mean in these senses and why are the North and South maps using different parameters?”
The fact that they’re different was an oversight on my part. Here’s the Southern Hemisphere trend map with the same setting ‘p < 30%’ as used for the map in the post:
http://oi44.tinypic.com/fbdlrc.jpg
KNMI writes the following about the “p factors”:
“Significance masking – In correlation, regression and difference maps, by default grid boxes with p-values above 0.1 (less than 90% significant) are left blank. This gives a first-oder estimate of whether a signal is really physical. Not that one should expect 10% of the map to be coloured even if here is no signal whatsoever by pure chance. Field significances are not yet computed. The p-values are computed assuming normal distributions, which means that they should only be comsidered a rough estimate of the significance. Note that small clusters of grid points are often not plotted in shaded plots as one cannot interpolate with less than a 2×2 square. Plot with the option "grid boxes" to show all points.”
Stephen Rasey says: “Second , when I see numbers like: “+0.3 GJ/m^2 Per Year” I have to ask, ‘Is that a lot?’”
Depends on your point of view. See:
http://bobtisdale.files.wordpress.com/2013/04/figure-23.png
From this post:
http://bobtisdale.wordpress.com/2013/04/17/a-different-perspective-on-trenberths-missing-heat-the-warming-of-the-global-oceans-0-to-2000-meters-in-deg-c/
Regards
Bob, Why prefer p < 30% over p < 10% if it is indeed a significance test? At p < 10%, there ought to be a 1 in 10 chance that the grid box will be erroneously reported significant. at p < 30%, 1 in 3 boxes will be erroneously significant. There are a lot of boxes, so a small, tighter p value seems more appropriate. In light of the second point, perhaps a tighter significance p < 10%, p < 5% or p < 1% should be considered. Otherwise, aren't you correlating little more than noise?
As to the second point, is “0.3 GJ/m^2 Per Year" (either plus or minus) a lot?
I pointed out in my calculation that some of the grid cells in your maps exceed (either plus or minus) 0.25 GJ/m^2/yr of the 0-700 m water column. Over a 4 year difference between the means of the first and second halves of the 8 year data this amounts to a 1 GJ/m^2 difference between the 4 year halves, which must result in a 0.35 deg K in 4 years inferring 0.90 deg K / decade.
You then point to a graph of "Pentadal NODC" (0-2000 m) with a slope of 0.025 deg K / decade, worldwide. Which seems to miss the point. It is a different depth range, it is worldwide rather than by small correleation cell, and you comparative value is 3% of the maximum values from the grid (over a much shorter time).
The maps in question imply that there are places in the ocean that have changed 0.35 deg K in as little as 4 years. Some places might have increased 0.35 deg K, other places decreased 0.35 deg K. This is surprisingly large even if isolated in 5×5 degree cells. If we look at the raw Argo, can we see a 0.9 deg K temperature changes in 5×5 cells using two 4-year datasets? It might be illuminating in terms of overall uncertainty analysis in regards to worldwide ocean heat content. But it might also be a gridding algorithm showing noise as signal.
phlogiston: I apologize for not responding earlier- I missed your comment. Please reread my comment carefully.
1. I did not claim that the “oceans were warming”: I stated that back radiation reduces heat less from the ocean surface and in this way”warms” the ocean. If the ocean energy content is indeed not increasing, then we need to look for other factors involved.
2. I did not propose a “radiation balance” hypotheses”. Rather I applied the First Law of Thermodynamics together with the established physical laws of Fourier, Fick and Beer with empirical coefficients to give my result. Which of these laws would Carl Popper (or you) reject?
3. Your comment “pathetic litany…” is uncalled for in a scientific exchange. I did not “ignore real world data” – I simply rejected the physical explanation given by Tisdale.
4. Your comment implies that I am a supporter of CAGW: if you had attended any of my lectures on climate change you would know that I certainly am not. I am an academic specializing in heat transfer trying to help “my side” improve their science. Please google A.F.Mills to check my credentials.
This reply also responds to Theo Goodwin.
Bob, what is the total heat content of the oceans, or what is the average temperature of the mass of the ocean – not the anomalies. I couldn’t find such an estimate with google.
7 years of data? Is that unadjusted data (I think not)? We have some “idea” as to the energy input from the Sun however, we have no idea what the energy input the internal core energy (Heat) feeds into the oceans from below (Unless I missed something).
Patrick says:May 6, 2013 at 7:07 am
From what I can calculate from the numbers in my CRC Handbook, the earth radiates about 0.0082 watts/sq. meter on average
Stephen Rasey says: “If we look at the raw Argo, can we see a 0.9 deg K temperature changes in 5×5 cells using two 4-year datasets? It might be illuminating in terms of overall uncertainty analysis in regards to worldwide ocean heat content. But it might also be a gridding algorithm showing noise as signal.”
Sorry, Stephen. I haven’t downloaded the raw ARGO data or the support programs for it so I can’t answer your questions.
Regards
Stephen Rasey: A while back, I had used (I needed to use) the 30% p factor to try to replicate some correlation maps from a study and I got in the habit of using it. Yes, the 10% factor would have been better.
Anthony Mills says:
May 5, 2013 at 9:50 am
Point taken, my comment was an inappropriate reaction. It does annoy me that the climate mainstream appears to reduce the climate to simply a radiation balance issue ignoring for instance the huge amount that is known and published in oceanography about century and millenial scale ocean driven variation. But I did misinterpret where you were coming from, apologies.
@ Bob Tisdale 5/6 8:56 am
Sorry, Stephen. I haven’t downloaded the raw ARGO data or the support programs for it so I can’t answer your questions.
Neither have I. Work for a future day. I was just pointing out that 0.25 GJ/m^2/yr ought to be seen as a 0.35 deg K average temperature difference in just 4 years. or 0.90 deg K in a decade. That IS a lot.
If we can see that much change in a small 2×2 or 5×5 degree cell in so short a time, and we see nothing remotely close to that worldwide, then this observation would have bearing on the size of the error bars on the worldwide number. See “Decimals of Precision” 26 Jan 2012.
On the other hand, I don’t know that I trust the gridding algorithm even with a p < 10% significance test. in any 3×4 cell array, at least one of those cells is likely appearing significant in error. Perhaps we should consider a p < 2.5% which would imply one erroneous significance in a 5 x 8 cell array.
BTW, what was contouring algorithm used and what smoothing operators and parameters did it use?