This is a cross post of my post titled El Niño-Southern Oscillation Then and Now.
I’m presenting this for those who look for patterns. I see it only as a curiosity—nothing more. I am not suggesting that future ENSO events will mimic those of the past, but…
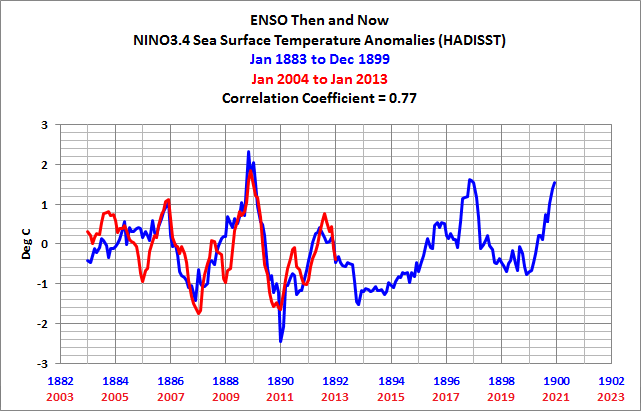
El Niño-Southern Oscillation indices are used to monitor the strength, frequency and duration of El Niño and La Niña events. One of the commonly used indices is the sea surface temperature anomalies of an area in the east-central equatorial Pacific called the NINO3.4 region (5S-5N, 170W-120W). A blogger recently advised me in a comment of a curious agreement in the NINO3.4 data for two periods separated by more than 100 years. Thanks, Bob. That is, the sea surface temperature anomalies of the NINO3.4 region for the period of January 2004 to March 2013 are quite similar to those from January 1883 to March 1892. Refer to Figure 1, which presents NINO3.4 anomaly data for the two periods, from the Kaplan reconstruction of sea surface temperatures. The agreement is reasonably strong for climate data. The two periods have a correlation coefficient of 0.77.

Figure 1
The following links include the same graphs using ERSST.v3b and HADISST reconstructions.
UPDATE: When considering those graphs, keep in mind that sea surface temperature sampling along the equatorial Pacific is rare before the opening of the Panama Canal in 1914. Sea surface temperature reconstructions in the NINO3.4 region are questionable in the 1800s. END UPDATE
You’ll note that I’ve extended the past data forward another 8 years. Someone was bound to ask me to do this, so there was no point in my presenting only the overlapping periods. Again, I’m not suggesting that future El Niño and La Niña events will coincide with the past. But…
Imagine what would happen IF (big if) we didn’t have another strong El Niño until 2017/18—four ENSO seasons from now—and that a multiyear La Niña event dominated the years until then: Global surface temperatures would likely remain flat for four more years. Global warming skeptics would be pleased, and climate scientists would be conjuring up more excuses for the lack of warming. If the response of the ocean heat content for the tropical Pacific was similar to past multiyear La Niña events, the tropical Pacific would likely warm to fuel the upcoming 2017/18 El Niño, and alarmists would point to that increase in ocean heat content as proof of human-induced global warming. In other words, little would change.
INTERESTED IN LEARNING MORE ABOUT THE EL NIÑO AND LA NIÑA AND THEIR LONG-TERM EFFECTS ON GLOBAL SEA SURFACE TEMPERATURES?
Why should you be interested? Sea surface temperature records indicate El Niño and La Niña events are responsible for the warming of global sea surface temperature anomalies over the past 30 years, not manmade greenhouse gases. I’ve searched sea surface temperature records for more than 4 years, and I’ve searched ocean heat content records for more than 3 years, and I can find no evidence of an anthropogenic greenhouse gas signal. That is, the data indicates the warming of the global oceans has been caused by Mother Nature, not anthropogenic greenhouse gases.
For a further discussion, see the essay (pdf) titled The Manmade Global Warming Challenge. (It’s 42MB, but it’s free and worth the download time.)
I’ve recently published my e-book (pdf) about the phenomena called El Niño and La Niña. It’s titled Who Turned on the Heat? with the subtitle The Unsuspected Global Warming Culprit, El Niño Southern Oscillation. It is intended for persons (with or without technical backgrounds) interested in learning about El Niño and La Niña events and in understanding the natural causes of the warming of our global oceans for the past 30 years. Because land surface air temperatures simply exaggerate the natural warming of the global oceans over annual and multidecadal time periods, the vast majority of the warming taking place on land is natural as well. The book is the product of years of research of the satellite-era sea surface temperature data that’s available to the public via the internet. It presents how the data accounts for its warming—and there are no indications the warming was caused by manmade greenhouse gases. None at all.
Who Turned on the Heat? was introduced in the blog post Everything You Ever Wanted to Know about El Niño and La Niña… …Well Just about Everything. The Updated Free Preview includes the Table of Contents; the Introduction; the beginning of Section 1, with the cartoon-like illustrations; the discussion About the Cover; and the Closing. The book was updated recently to correct a few typos.
Please buy a copy. (Credit/Debit Card through PayPal. You do NOT need to open a PayPal account.) Simply scroll down to the “Don’t Have a PayPal Account” purchase option. It’s only US$8.00.
Since North Atlantic has entered its 30-year cooling period as it happened few times in 20th century and Northern Pacific is well reaching its cold period, I see the global would go down. More, long neutral or slightly positive ENSO means long-term loss of energy without La Nina replenishment.
Imagine what would happen IF (big if) we didn’t have another strong El Niño until 2017/18—four ENSO seasons from now—and that a multiyear La Niña event dominated the years until then: Global surface temperatures would likely remain flat for four more years.
You mean, go down, right? What with the solar cycle having peaked by then as well.
There are other periods when NINO3.4 sea surface temperature anomalies show patterns similar to one another. The periods including and following the 1972/73, 1986/87/88 and 1997/98 El Niños are very similar, inasmuch as the primary El Niño events are trailed immediately by multiyear La Niñas (or a very strong La Niña following the 1986/87/88 El Niño) and then followed by multiyear periods of moderate El Niños. See:
http://bobtisdale.wordpress.com/2009/07/12/similarities-of-the-multiyear-periods-following-significant-el-nino-events-since-1970/
But outside of those, I’ve never run across two periods that are as similar as those shown in this post.
Thanks Bob.
1885/2006 do not seem to follow though. I do not think that an exact match could be found. Your period cross match because, probably, you looked for and found two periods that roughly matched. Does this actually mean anything? I doubt it since the climate cycle periods are driven themselves different variable periods. Climate is a chaotic system so your match is entirely possible but not really significant.
It would be nice to have the timeline extended also to the past to see how the temperature development differs before the matching period.
If we don’t have an El Nino event for 4 years AND we have the weakest solar cycle in 100 years, and we don’t cool at least a little, then I will begin to seriously wonder if the warmists aren’t correct after all. I can’t imagine anything more damaging to our argument than that…
Correlation coefficient or coefficient of determination (R2)?
If we had four more years with no significant El-Nino you are essentially saying that the Pacific is either abosrbing solar energy or slightly radiating it. Since this is a period of slightly lower TSI, UV Irradiance as well as very high GCR rates, it is more than likely that any solar energy available for the oceans to absorb heat will see diminished quantities for the foreseeable future. And if the poorly understood PDO Negative Phase is the driving force behind the lack of El-Nino’s it would seem that the world is indeed cooling because there may not be any strong El-Nino’s for a while.I think it will make a big difference at reinforcing that global temperatures decline for 30 years during a PDO Cool Phase and that seems to be because there are fewer El-Nino’s.
Dave says: “Correlation coefficient or coefficient of determination (R2)?”
I used the “CORREL” function in EXCEL to determine the correlation coefficient.
Regards
As if we know or can know the sea surface temperature of XIX century…meh…
AlexS: Thanks for the reminder. I’ll add a note.
When we don’t have El Ninos, Atlantic hurricanes are stronger (because El Nino winds at about 30,000 feet “chop off” (for lack of a better term) the tops of hurricanes, preventing them from getting to be cats 3-5 (roughly).
So if we don’t have El Ninos, we might have several strong hurricanes hit land in that time frame. You don’t have to guess what kind of reaction that will get.
Could it be these ENSO cycles are riding on top of a 120 year cycle with harmonics at 60 and 30 years?
Reblogged this on CraigM350 and commented:
1883 pops up again.
If CC = 0.77, what’s n =
Hey naysayers: This is called the beginnings of statistical modeling. It is used extensively in ENSO predictive runs and is the comparison set against dynamic models. Many dynamic models use a CO2 fudge factor. Statistical models say, “What did we have before that is similar to now?” It would not surprise me to find out that the period Bob has found is part of at least some of the statistical models already. So I would not say that this match is insignificant. I would say that statistical models use this kind of match making all the time. Cool find Bob. Pun intended.
121 years. Harmonic of the quasi stationary 60 year oscillation of the ocean currents. Co-incident with the orbital alignment of Jupiter, Saturn and Venus every 60 years..
Just an interesting observation: the “consensus” panel (a select group of researchers involved in ENSO modeling) opinion has been shadowing the average of the statistical models for quite some time. The dynamical models seem to have lost favor with this top-hat panel of modelers. So one could say, using armchair vernacular, that the consensus is now in favor of “there isn’t anything new under the Sun” instead of “CO2 will fry the oceans”. Oh, the irony is so delicious!
Bob
You are perhaps confirming what I found out that there are fewer strong climate altering El Ninos during global cooling cycles than during global warming cycles [about half as many].Once the global SST start its decline , the weaker El Ninos have only a short term warming effect and the longer term cooling continues until the oceans change from cooling to warming which happens as lagged effect of the sun cycle. The period 1880-1910 was such a similar period as now .
MattN says:
April 24, 2013 at 5:11 am
I will begin to seriously wonder if the warmists aren’t correct after all.
============
What caused the Minoan warming? No one knows.
What caused the Roman warming? No one knows.
What caused the Medieval warming? No one knows.
What caused the Little Ice Age and the warming that followed? No one knows.
What caused the warming from 1915-1945? No one knows.
What caused the warming 1975-2005? We are certain it is CO2.
How can we be certain? Because CO2 increased this time, but not any of the times before. Therefore this time the cause must be different. It must be due to CO2. Climate Science 101.
A child of 5 can spot the flaw in this logic. However, after years of careful schooling, a PhD and selective grant money, they can often be conditioned to believe. Those that can’t need not apply. They will need to get real jobs.
johnmarshall says: April 24, 2013 at 5:06 am
“Climate is a chaotic system so your match is entirely possible but not really significant.”
On the contrary, that’s the only way to make predictions for chaotic systems when you don’t have the dynamical equations. It’s perfectly valid. It’s only possible to make short term predictions before you reset, but that’s the nature of chaotic systems due to sensitive dependence on initial conditions. The first use was by Ed Lorenz in the 1960s to try to predict weather and called “The Method Of Analogues” by him, http://journals.ametsoc.org/doi/abs/10.1175/1520-0469(1969)26%3C636%3AAPARBN%3E2.0.CO%3B2.
As an exercise, try it on the sunspot numbers. Matching a couple of sunspot cycles around 1800 with current the current cycles seems to give a decent prediction of what’s happening now.
ENSO is not a simple thing that can be matched by graphs for a few years. You could have found “correlations” like that many times over many years. You could probably find correlations between the current ENSO and the price of pork for periods that short, over the past 100 years. It’s meaningless. Yes, the current solar cycle matters a little, as do many other things. But to say that ENSO is so simple that it follows patterns like that, is “streaching it” – to put it politely.
Thanks, but I’ll keep watching PDO, AMO, and solar cycle more than ENSO. All three of the former indicators are dismissed by climate modelers and solar physics groups as constants or insignificant factors. That makes me think these are like undiscovered countries of under-specified variables of the key multi-decadal type. Shorter-term variables are still interesting but not compared to the informational and parameter specification gulf opportunities of the multi-decadal type. See dark energy and dark matter for comparisons. And recall that proof of concept for quantum mechanics and the electronics world we live in now largely came about from moving beyond theory to experimental proof via empirical breakthroughs in methods of lab measurement along with materials science.
R squared of 0.77, eh? That’s a few orders of magnitude better than we are used to in ‘climate science”.
When the atmosphere cools the oceans release their energy. When the atmosphere warms the oceans decline to release their energy. ENSO is a negative feedback. Hat tip to Ulric Lyons for this argument.
Global surface temperatures would likely remain flat for four more years.
It seems to me that over the next two years, assuming the pattern holds, the temperatures will actually go down. And the present 16 year pause will be extended by two years in each direction to give 20 years of no warming on at least three data seets.
‘MattN says:
April 24, 2013 at 5:11 am
If we don’t have an El Nino event for 4 years AND we have the weakest solar cycle in 100 years, and we don’t cool at least a little, then I will begin to seriously wonder if the warmists aren’t correct after all. I can’t imagine anything more damaging to our argument than that…”
nonsense. nothing can falsify the skeptic position(s)
Steven Mosher says:
April 24, 2013 at 9:02 am
nonsense. nothing can falsify the skeptic position(s)
And a lack of warming doesn`t falsify the warmist position?
http://www.guardian.co.uk/environment/climate-consensus-97-per-cent/2013/apr/24/reuters-puzzled-global-warming-acceleration
Way OT; my apologies (but I did it anyway!)
Besides, I don’t have any other way to send this.
*****************
Pamela Gray says: April 24, 2013 at 6:31 am
*****************
How you doing Miss Pamela? Been shooting lately??
Just a reminder that you and your Sweetheart have an invitation to stop by if you are ever in the Heart Of Texas. We can shoot guns, eat BBQ, drink beer, and go to a good Southern Baptist Bible thumpin’ church service! There is also a cactus convention in Austin this coming June and we are putting on a big 2nd Amendment fandango in October.
Happy Trails and good shooting!
Steamboat Jack (Jon Jewett’s evil twin.)
Steven Mosher says: “nonsense. nothing can falsify the skeptic position(s)”
Galvanize says: “And a lack of warming doesn`t falsify the warmist position?”
Mosh’s point seems to be that the Warmists keep moving the goal posts, so no falsification is possible. I.e., it’s not science. And how do you falsify: “CO2 causes global warming and global cooling?” Occam’s Razor says that “The weather gods are angry” is a better explanation.
Thanks for the interesting post Bob. I have been curious about ENSO analogues myself and even taking it a step further to see if there is any possible relationship to SSN. I tried cutting up the ENSO time series into segments according to solar cycles (back to cycle 10) and transforming these series into the ‘solar cycle domain’. To be sure, there are some interesting analogues. It often seems that there are back to back pairs of ENSO/SSN segments which correlate well. Here is a plot comparing the two most recent segments for cycles 22 and 23. I find the image particularly striking when one considers the fact that cycle 22 was 9.7 years and cycle 23 was 12.6 years yet there is remarkable coherence in the solar cycle domain.
Cute: a lagged correlation. I can feel a model coming on.
ggm says: “…[T]o say that ENSO is so simple that it follows patterns like that, is ‘streaching [sic] it’ – to put it politely.”
ENSO is relatively simple compared to the entire climate system. It is quasicyclical, forced by known mechanisms. (Well, mostly known. The trigger that initiates the El Nino phase is unknown, though I have a theory that I’ve already bored Bob Tisdale with too many times.)
The point is, ENSO patterns can repeat; they are not totally stochastic. They are at least partly determinate; we just don’t know the full mechanism. Yet. I compare the mechanism to a grandfather’s clock with a mouse intermittently running up and down the back of the pendulum. We can see the ENSO pendulum through the glass, but we can’t see where the mouse is. When the mouse is standing still at a particular spot, the pendulum will cycle very much like the last time the mouse was there. Matching cycles are not totally accidental.
Take two empirical observations and call me in the morning. 😉
@jorge
“The point is, ENSO patterns can repeat; they are not totally stochastic.”
If a person of warmist bent was to be able to provide a chart with 0.77 correlation between temperature and CO2, that camp would have a lot more scientific standing than is provided by the present cacophony of cultic and hand-wringing laments.
Bob, I am really impressed with your latest work. It is another example of what happens when one gets up in the morning and takes a Sensible Pill before heading to work.
Some very interesting comparative data going back a century – thanks!
My quess is that the blue line (1899) and the red line (2013) are just about to radically diverge. I noticed a curious heuristic principle (hardly original no doubt), that when Nina 3.4 temperature peaks in winter – e.g. el Ninos, the peak ends significantly cooler than it started, while when a peak occurs in summer, it will end warmer than it started. Series of multiple summer-peaks comprise a warming trend and tend to be small. Conversely winter peaks are larger and, while at their peak are war event, they are followed by a sharp cooling and end cooler than they started, so that for instance el Ninos are events which on balance lose heat from the Pacific.
On this basis I would predict that Nina 3.4 temps will continue a rising trend of sequential small summer-peaking oscillations for up to a year, till there is a winter peak and then Nina3.4 will fall sharply – some time in 2014.
I would suggest this apparent correlation is linked to the lunar tidal effect. There are two main lunar cycles. The 18.6 Moon noodal cycle which has a period of 18.6 years. This is what it takes the Moon crossing point of the elliptical to make a full rotation rotation.
The second cycle is about 8.8 years and is the pointing of the rotation time of Moon’s eleptic orbit to make full rotation.
The time difference is between the apperent repeat of the pattern is about 121 years.
So lets divide the two
121/18.6 = 6.505
121/88 = 13.75
It take 121 * 4= 484 year for the full pattern repete itself.
BTW, I have a 4 year forecast for ENSO. http://www.global-warming-and-the-climate.com/images/ENSO-forecast-April-2013.jpg
Note this is for the MEI index, not for the Nino3.4 area.
Steven Mosher @ 9:02a:
“…nonsense. nothing can falsify the skeptic position(s)…”
Seems to me the Skeptic position is warmists use some pretty bad science. All warmists have to do is prove their warming models are better than no-warming Mother nature…
I would suggest that this apparent correlation is linked to the lunar tidal effect. There are two main lunar cycles. The 18.6 Moon nodal cycles which has a period of 18.6 years. This is what it takes the Moon crossing point of the elliptical to make a full rotation.
The second cycle is about 8.8 years and is the pointing angle of the rotation time of Moon’s elliptic orbit to make full rotation.
The time difference is between the apparent repeat of the pattern is about 121 years.
So let’s divide the two
121/18.6 = 6.505
121/8.8 = 13.75
It takes 121 * 4= 484 year for the full pattern repeat itself.
BTW, I have a 4 year forecast for ENSO. http://www.global-warming-and-the-climate.com/images/ENSO-forecast-April-2013.jpg
Note this is for the MEI index, not for the Nino3.4 area.
Sory for the typing errors
Resourceguy says: “Thanks, but I’ll keep watching PDO, AMO, and solar cycle more than ENSO. All three of the former indicators are dismissed by climate modelers and solar physics groups as constants or insignificant factors…”
I’ll comment on two of your indicators. I agree with you about the AMO–it is not an insignificant factor. Even RealClimate acknowledges its impact:
http://www.realclimate.org/index.php/archives/2004/11/atlantic-multidecadal-oscillation-amo/
When the AMO peaks (it may have already) and makes a multidecadal decline again (it hasn’t yet), the excuses from the AGW camp will grow much louder.
On the other hand, I’ll disagree with you about the PDO. While the PDO is useful in weather prediction and for the fishing industry, there is no mechanism for the PDO to vary global temperatures, because the PDO is inversely related to the sea surface temperature of the North Pacific. The PDO is basically an aftereffect of ENSO and the sea level pressure (wind patterns) of the North Pacific. For more info on the PDO refer to:
http://bobtisdale.wordpress.com/2010/09/03/an-introduction-to-enso-amo-and-pdo-part-3/
And:
http://bobtisdale.wordpress.com/2010/09/14/an-inverse-relationship-between-the-pdo-and-north-pacific-sst-anomaly-residuals/
And:
http://bobtisdale.wordpress.com/2011/06/30/yet-even-more-discussions-about-the-pacific-decadal-oscillation-pdo/
Regards
I would suggest that this apparent correlation is linked to the lunar tidal effect. There are two main lunar cycles. The 18.6 Moon nodal cycles which has a period of 18.6 years. This is what it takes the Moon crossing point of the elliptical to make a full rotation.
The second cycle is about 8.8 years and is the pointing angle of the rotation time of Moon’s elliptic orbit to make full rotation.
The time difference is between the apparent repeat of the pattern is about 121 years.
So let’s divide the two
121/18.6 = 6.505
121/8.8 = 13.75
It takes 121 * 4= 484 year for the full pattern repeat itself.
BTW, I have a 4 year forecast for ENSO. http://www.global-warming-and-the-climate.com/images/ENSO-forecast-April-2013.jpg
Note this is for the MEI index, not for the Nino3.4 area.
Perhaps future el-nino’s are going to be weaker and la-nina’s stronger.
I’ve been thinking the same thing as MattN – if it does stay flat with no el nino’s and the solar cycle going down for another 5 years or so I’ll think of it as showing a CO2 effect. Not any kind of large feedback if any, but probably around .5 to 1.5 degrees. However surely the MWP hasn’t been closely correlated to solar as I’ve heard of the little ice age, which leaves room for other warming factors I would think.
Bob, You comment about the lack of accuracy of sea surface temps prior to the Panama Canal. I have just repeated your Fig 1. using the Australian BOM SOI data, which is the standardised mslp difference between Tahiti and Darwin. The graphs are even more in step than your sea surface temp graph.
Jantar says: “I have just repeated your Fig 1. using the Australian BOM SOI data, which is the standardised mslp difference between Tahiti and Darwin. The graphs are even more in step than your sea surface temp graph.”
Thanks, Jantar. Because there is so little sea surface temperature data for the equatorial Pacific in the 1800s, I’ve always wondered whether the scientists who reconstructed sea surface temperature-based ENSO data used the SOI to help infill the missing data. It would be the logical thing to do.
Regards
Thanks Bob. I’m a bit perplexed though by this downplay of PDO. What about D’Aleo and Easterbrook and many posts over the lest few years citing PDO as vital to understanding multidecadal cycles? and the model fits of .96 R sq when combining PDO AMO and sunspot number? Why would they include PDO in such constructions if it is a downplayed variable?
Resourceguy says: “Thanks Bob. I’m a bit perplexed though by this downplay of PDO. What about D’Aleo and Easterbrook and many posts over the lest few years citing PDO as vital to understanding multidecadal cycles? and the model fits of .96 R sq when combining PDO AMO and sunspot number? Why would they include PDO in such constructions if it is a downplayed variable?”
Sorry for the delay in replying. First, you can’t combine the AMO and PDO. They represent two different things and are calculated in two different ways. The PDO does not represent the sea surface temperature of the North Pacific. They’re actually inversely related. On the other hand, the AMO is simply detrended North Atlantic sea surface temperature anomalies. See:
http://bobtisdale.wordpress.com/2011/06/08/on-the-amopdo-dataset/
For more info on what the PDO represents and, more importantly, what it does not represent see:
http://bobtisdale.wordpress.com/2010/09/03/an-introduction-to-enso-amo-and-pdo-part-3/
And:
http://bobtisdale.wordpress.com/2010/09/14/an-inverse-relationship-between-the-pdo-and-north-pacific-sst-anomaly-residuals/
And:
http://bobtisdale.wordpress.com/2011/06/30/yet-even-more-discussions-about-the-pacific-decadal-oscillation-pdo/
Also, I don’t recall seeing what you’ve described as “the model fits of .96 R sq when combining PDO AMO and sunspot number”, but I suspect the datasets were smoothed beyond recognition. In other words, the data was likely tortured until it gave the desired answer. Do you have a link?
Regards